


-
Dental caries, a biofilm-mediated, sugar-driven, multifactorial, dynamic disease, represents one of the most prevalent and preventable conditions worldwide, leading to the demineralization of dental hard tissues[1,2]. Dental caries can induce discomfort, anxiety, and functional limitations, impacting children’s school attendance and academic performance due to tooth loss[3]. Beyond individual health impacts, caries imposes economic burdens on individuals and communities[4,5].
Despite socioeconomic advancements, the dental health of Chinese citizens has deteriorated over the last three decades, a trend attributable to aspects of social development[6]. The National Oral Health Epidemiological Survey’s 2015 report highlighted a dental caries prevalence of 38.5% among 12-year-old children, a near 10% increase from the 28.9% reported in 2005[7].
The standardized mean decayed, missing, and filled teeth (DMFT) scores range from 0.50 to 0.8, with notable regional disparities. Recent trends indicate worsening DMFT scores among children in northeastern and southwestern China compared to other regions. Moreover, there is a pronounced variation in DMFT scores across different geographical areas, with children from the northeast and southwest demonstrating better outcomes than those from eastern China[8].
A comprehensive analysis of caries’ spatial heterogeneity within China is warranted. Multiple factors could explain the regional variations observed. Studies indicate that caries prevalence and progression are influenced by socioeconomic status, environmental pollution and individual factors[9-11]. For instance, F. Schwendic et al. demonstrated that individuals with lower socioeconomic status, characterized by reduced educational attainment, income, and occupational status, exhibit higher caries prevalence[12]. Contemporary research also explores the link between air pollution and oral caries, suggesting that tobacco smoke, coal particles, and heavy metals like lead and cadmium may disrupt the oral cavity’s microbial balance[13]. This disruption could affect the immune response[14], induce hypoxia[15], trigger oxidative stress[16], alter saliva composition[17], or initiate other mechanisms, potentially leading to dysbiosis and the subsequent colonization by pathogens, thereby accelerating caries development[18]. Moreover, regional dietary habits, specifically the quantity and frequency of sugar intake, could influence caries prevalence. Furthermore, the incidence of dental caries may vary according to regional dietary practices, including total sugar intake and frequency of consumption. However, the exact relationship between the various physical-geographic regions and dental caries remains unclear, as does the degree to which these factors correlate with the occurrence of caries lesions or the overall caries experience.
Shanxi Province, encompassing 11 cities, had a resident population of 34.66 million at the end of 2022. Its geography varies, with mountainous terrain in the east, a basin in the center, and a plateau in the west. The First Epidemiological Survey of Oral Health in Shanxi Province, conducted in 2018, revealed a disturbingly high prevalence of dental caries among 12-year-old children at 41%. Notably, Lyuliang city displayed a higher prevalence than other areas, underscoring significant geographical disparities. Hence, Shanxi Province provides an ideal context for studying the spatial heterogeneity of dental caries.
Approximately 80% of epidemiological data possesses spatial attributes. Investigating the spatiotemporal distribution of diseases and examining the socioeconomic drivers of spatiotemporal variation can enhance strategies for addressing high-risk regions. Therefore, this study aims to evaluate the spatial differentiation and ecological risk factors and explore the spatial heterogeneity of caries using the Geo-Detector model.
-
This ecological study utilized 16 districts across 8 prefecture-level cities within Shanxi Province, China, as units of analysis. It included 3,721 children aged 12 years. The study’s protocol and consent forms were rigorously reviewed and approved by the Ethics Committee of Shanxi Medical University.
-
The analysis incorporated data from two recent surveys to examine oral health status, sociodemographic characteristics, and oral health-related behaviors of 3,721 children: (1) The First Epidemiological Survey on Oral Health in Shanxi Province in 2018 (N = 2,847), a government initiative assessing oral health across different age groups in 12 districts of eight cities in Shanxi Province. (2) The Fourth National Oral Health Epidemiological Survey conducted by the National Health Commission of the People’s Republic of China in 2015 (N = 874), covering four districts in four cities within the Province. The methodologies of each survey have been detailed in prior descriptions. Data collection involved oral examinations by trained and certified dentists, assessing the dental caries status of all permanent teeth under artificial light using a plane dental mirror and community periodontal index probe, adhering to diagnostic criteria of World Health Organization (WHO). The inter-examiner reliability, indicated by a kappa value exceeding 0.9, was substantial. Dental caries prevalence was computed as the proportion of affected individuals within the respondent pool. Prior to data collection, written informed consent was obtained from the children’s parents or legal guardians. Utilizing these two cross-sectional surveys, a multifactorial regression model predicted the 2018 caries prevalence among 12-year-olds in the 11 cities, enhancing the sample size. The model’s formulation is the Logistic function model:
$$ y=\frac{k}{1+e^{a x+b}} $$ (1) Equation 1: In this equation, a and b represent parameters to be determined, while k denotes the predicted upper limit of prevalence.
Table 1 presents the raw and computed sample data. Natural and socioeconomic factors were derived from the Shanxi Statistical Yearbook - 2019 and Shanxi Statistical Yearbook - 2016, respectively, published by the Shanxi Statistical Bureau.
City District The number of children sampled (people) The caries prevalence rate in districts (%) The caries prevalence rate in cities (%) Taiyuan Xiaodian area 234 52.10 49.22 Qinxu county 239 46.40 Datong Pingcheng area 196 29.60 34.13 Zuoyun county 229 38.00 Yangquan urban area 236 39.00 32.19 Pending county 240 25.50 Changzhi 53.32 Jincheng urban area 239 45.50 38.99 Qinshui county 240 32.50 Shuozhou 31.62 Jinzhong Yuci area 239 36.70 39.99 Pingyao county 229 43.43 Yuncheng Yanhu area 238 43.80 46.61 Wenxi county 214 49.74 Xinzhou Xinfu area 235 49.28 49.19 Dai county 234 49.10 Linfen 52.65 Lyuliang Lishi area 240 43.00 42.65 Liulin county 239 42.30 Total 3,721 Note. The bold data in the table represents the calculated data. Table 1. The number of children sampled and the caries prevalence in each city
-
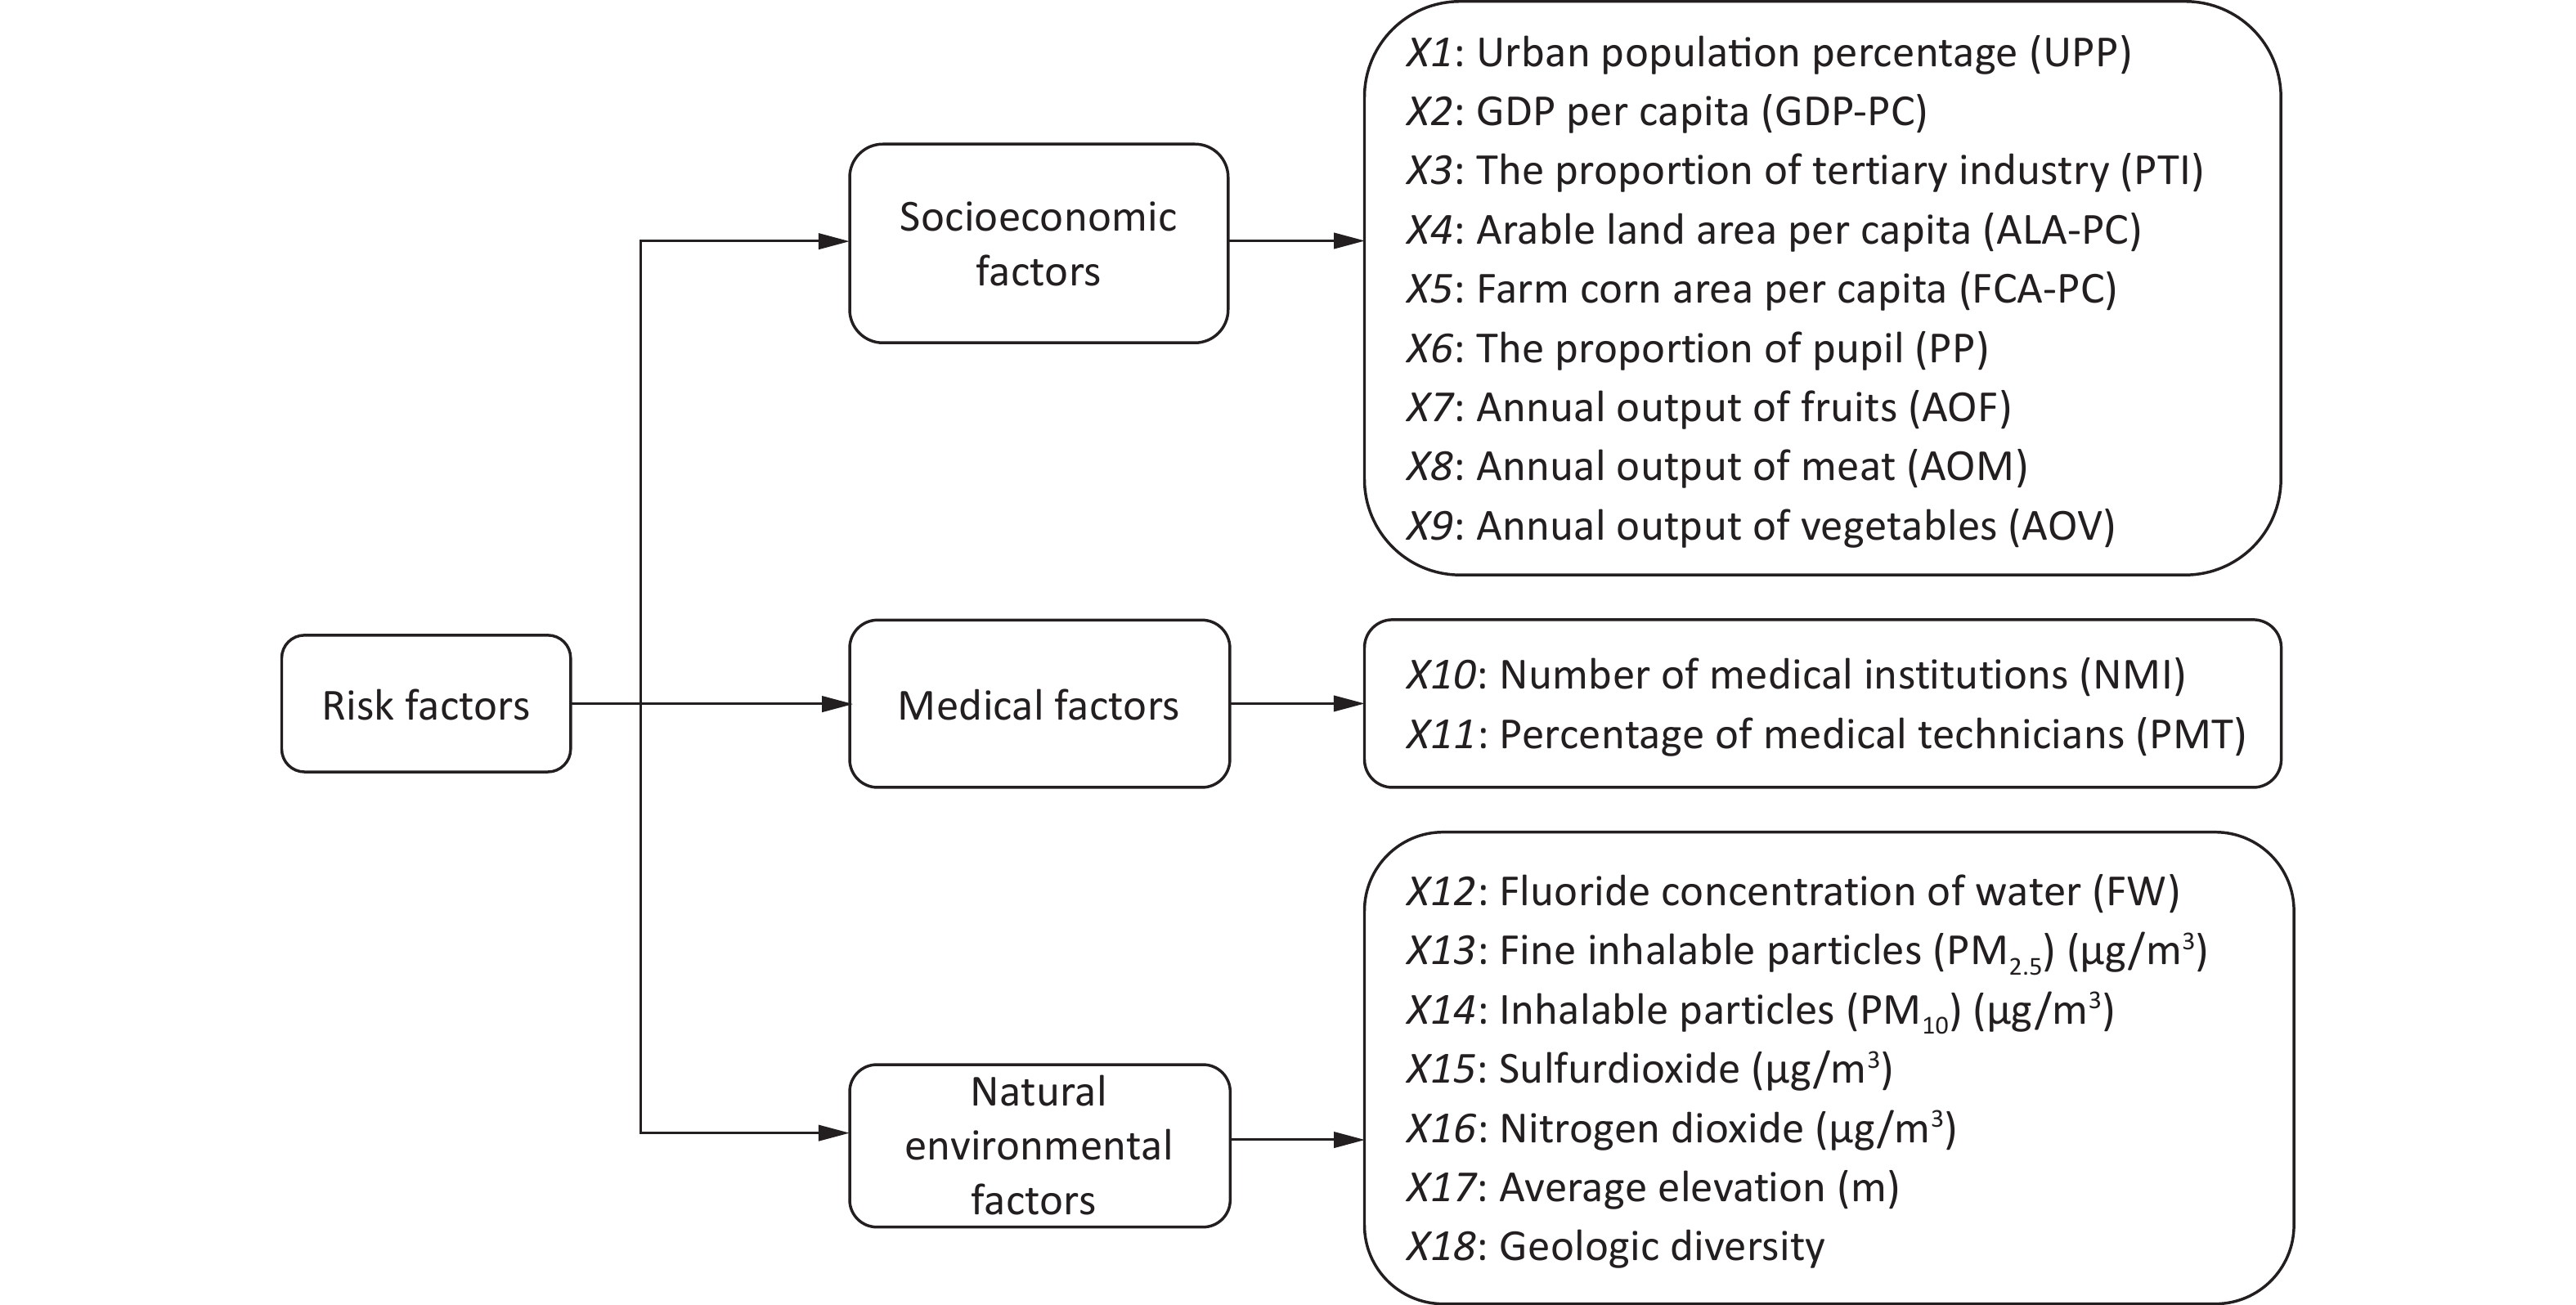
Prior research on the spatial distribution of dental caries has predominantly concentrated on individual factors, overlooking the complex interplay among multiple ecological determinants that could influence spatial disparities[19-21]. Thus, our investigation delves into the correlation between caries rates and various factors, including socioeconomic factors, medical resources and environmental conditions. Guided by the extant literature and data availability from local authorities, we identified eighteen pertinent variables, illustrated in Figure 1. To measure the social economy of a city, we should not only rely on the economic aggregate and total population, but also pay attention to the characteristics of its population structure, so we selected nine variables: urban population percentage (UPP), gross domestic product per capita (GDP-PC), the proportion of tertiary industry (PTI), arable land area per capita (ALA-PC), farm corn area per capita (FCA-PC), proportion of pupils (PP), annual output of fruits (AOF), annual output of meat (AOM) and annual output of vegetables (AOV). The healthcare system’s state was represented by two variables: the number of medical institutions (NMI) and the percentage of medical technicians (PMT). Additionally, we integrated seven natural environmental factors, based on data from the local authority: fluoride concentration of water(FW), fine inhalable particles (PM2.5) (µg/m3), inhalable particles (PM10) (µg/m3), sulfur dioxide (µg/m3), nitrogen dioxide (NO2) concentrations (µg/m3), average elevation (m) and geologic diversity.

Figure 1. The three ecological factors and the eighteen specific ecological factors.
-
In this research, the Geo-Detector model, introduced by Wang in 2010, was employed to generate a map illustrating the spatial distribution of dental caries, aiming to delve deeper into the spatial heterogeneity and influential patterns of dental caries, with a focus on the interaction among various factors.
The Geo-Detector model[22] quantifies the extent to which an independent variable X elucidates variations in the spatial distribution of Y using the q value. The q value is defined as follows:
$$ \begin{array}{r} \mathrm{q}=1-\dfrac{\sum_{h=1}^{L} \sum_{i=1}^{N_{h}}\left(Y_{h i}-\bar{Y}_{h}\right)^{2}}{\sum_{i=1}^{N}\left(Y_{i}-\bar{Y}\right)^{2}} \times 100 \text{%} \\ =1-\dfrac{\sum_{h=1}^{1} N_{h} \sigma_{h}^{2}}{N \sigma^{2}} \times 100 \text{%} \end{array} $$ (2) In this context, N represents the total number of spatial lattice pixels across Shanxi province, categorized into h = 1, 2, …, L strata based on influencing factors (Xs). Each stratum h encompasses Nh spatial statistical pixels, with Yi and Yhi indicating the caries prevalence rate for the ith pixel and within stratum h of influencing factors (Xs), respectively. The terms Y and σ2 denote the overall mean and variance of the caries retention rate across the province. It is pertinent to note that q-values range from 0 to 1, where a higher q-value signifies a more robust explanatory power of X on Y.
The q-value was computed from the cross-classified strata of two distinct factors: X1 and X2, denoted as q (X1∩X2). This metric is instrumental in discerning the interaction effects of X1 and X2 on the dependent variable (Y). The Geo-Detector model delineates criteria to evaluate the nature of the interaction effects exerted by X1 and X2 on Y (Table 2)[23-25]. Furthermore, the model ascertains whether the factors (X1 and X2) attenuate or intensify their impact on Y. These interaction effects are categorized into five types of interactive relationships, with the corresponding criteria detailed in Table 2.
Judging rules Types of interaction effects q(X1∩X2) < Min(q(X1), q(X2)) Non-linearly weakened Min(q(X1), q(X2)) < q(X1∩X2) < Max(q(X1), q(X2)) Univariate non-linearly weakened q(X1∩X2) > Max(q(X1), q(X2)) Bivariate enhanced q(X1∩X2) = q(X1) + q(X2) Independent q(X1∩X2) > q(X1) + q(X2) Non-linearly enhanced Table 2. The interactive categories of two factors and their relationship
-
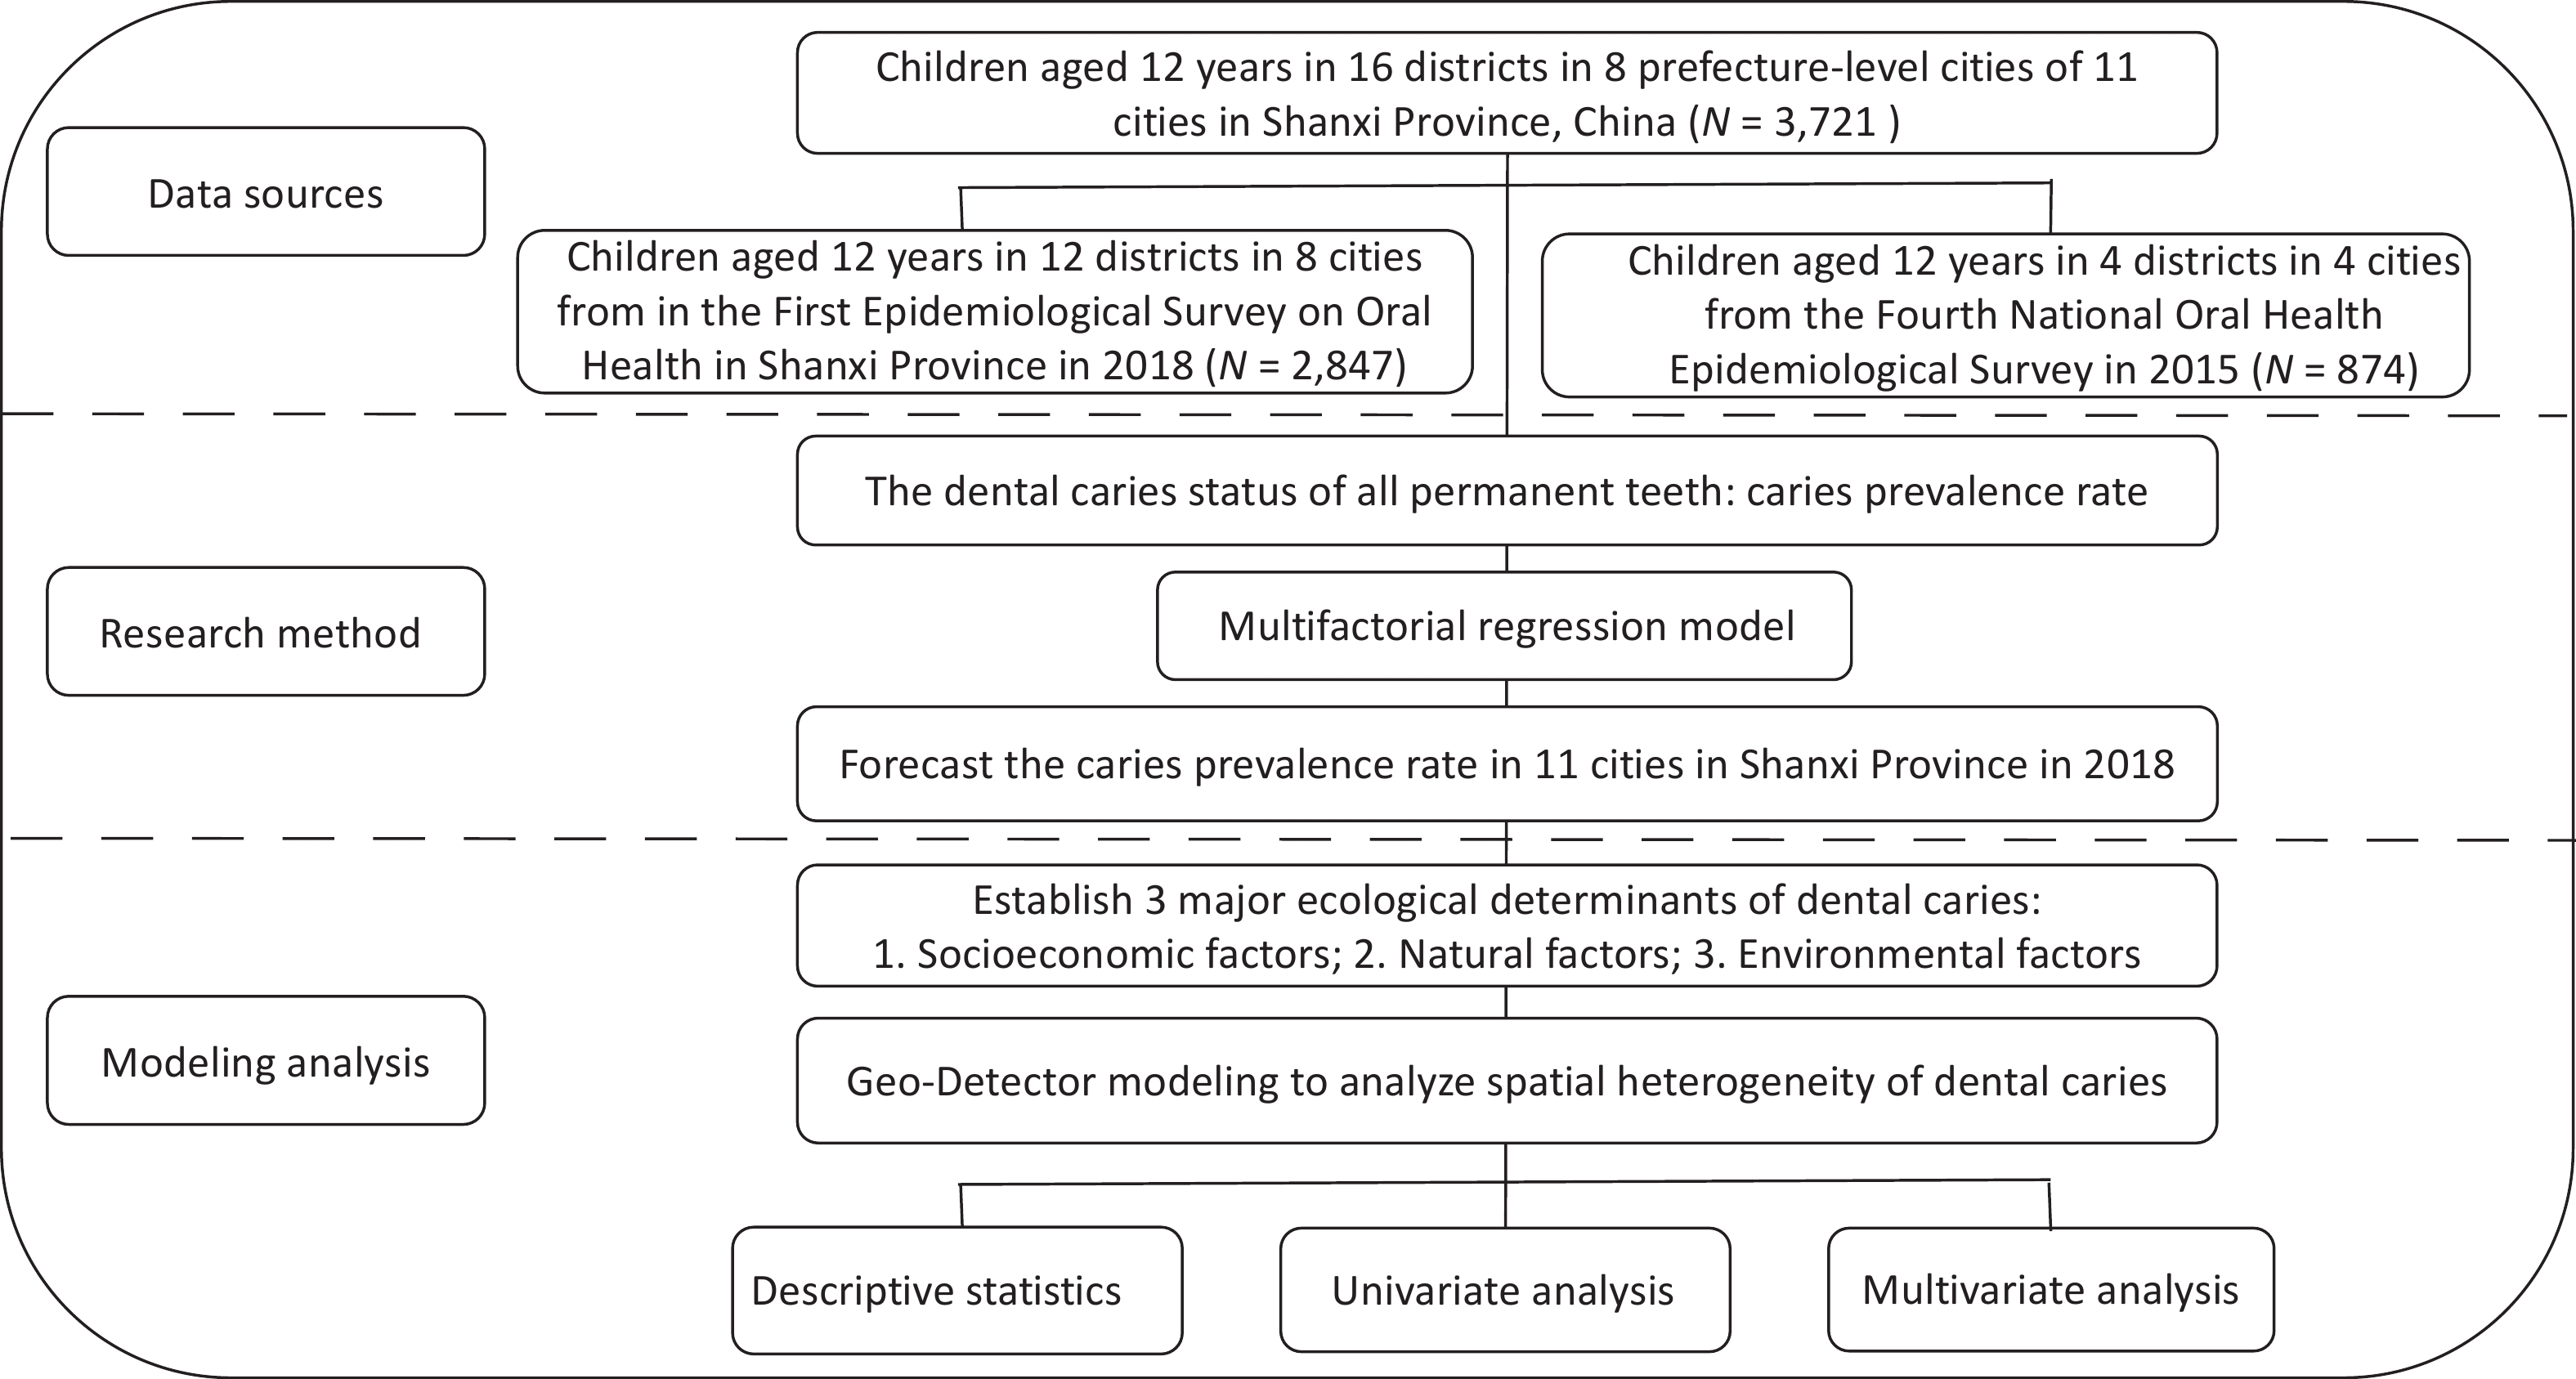
Figure 2 showed the flow diagram of the whole research process.
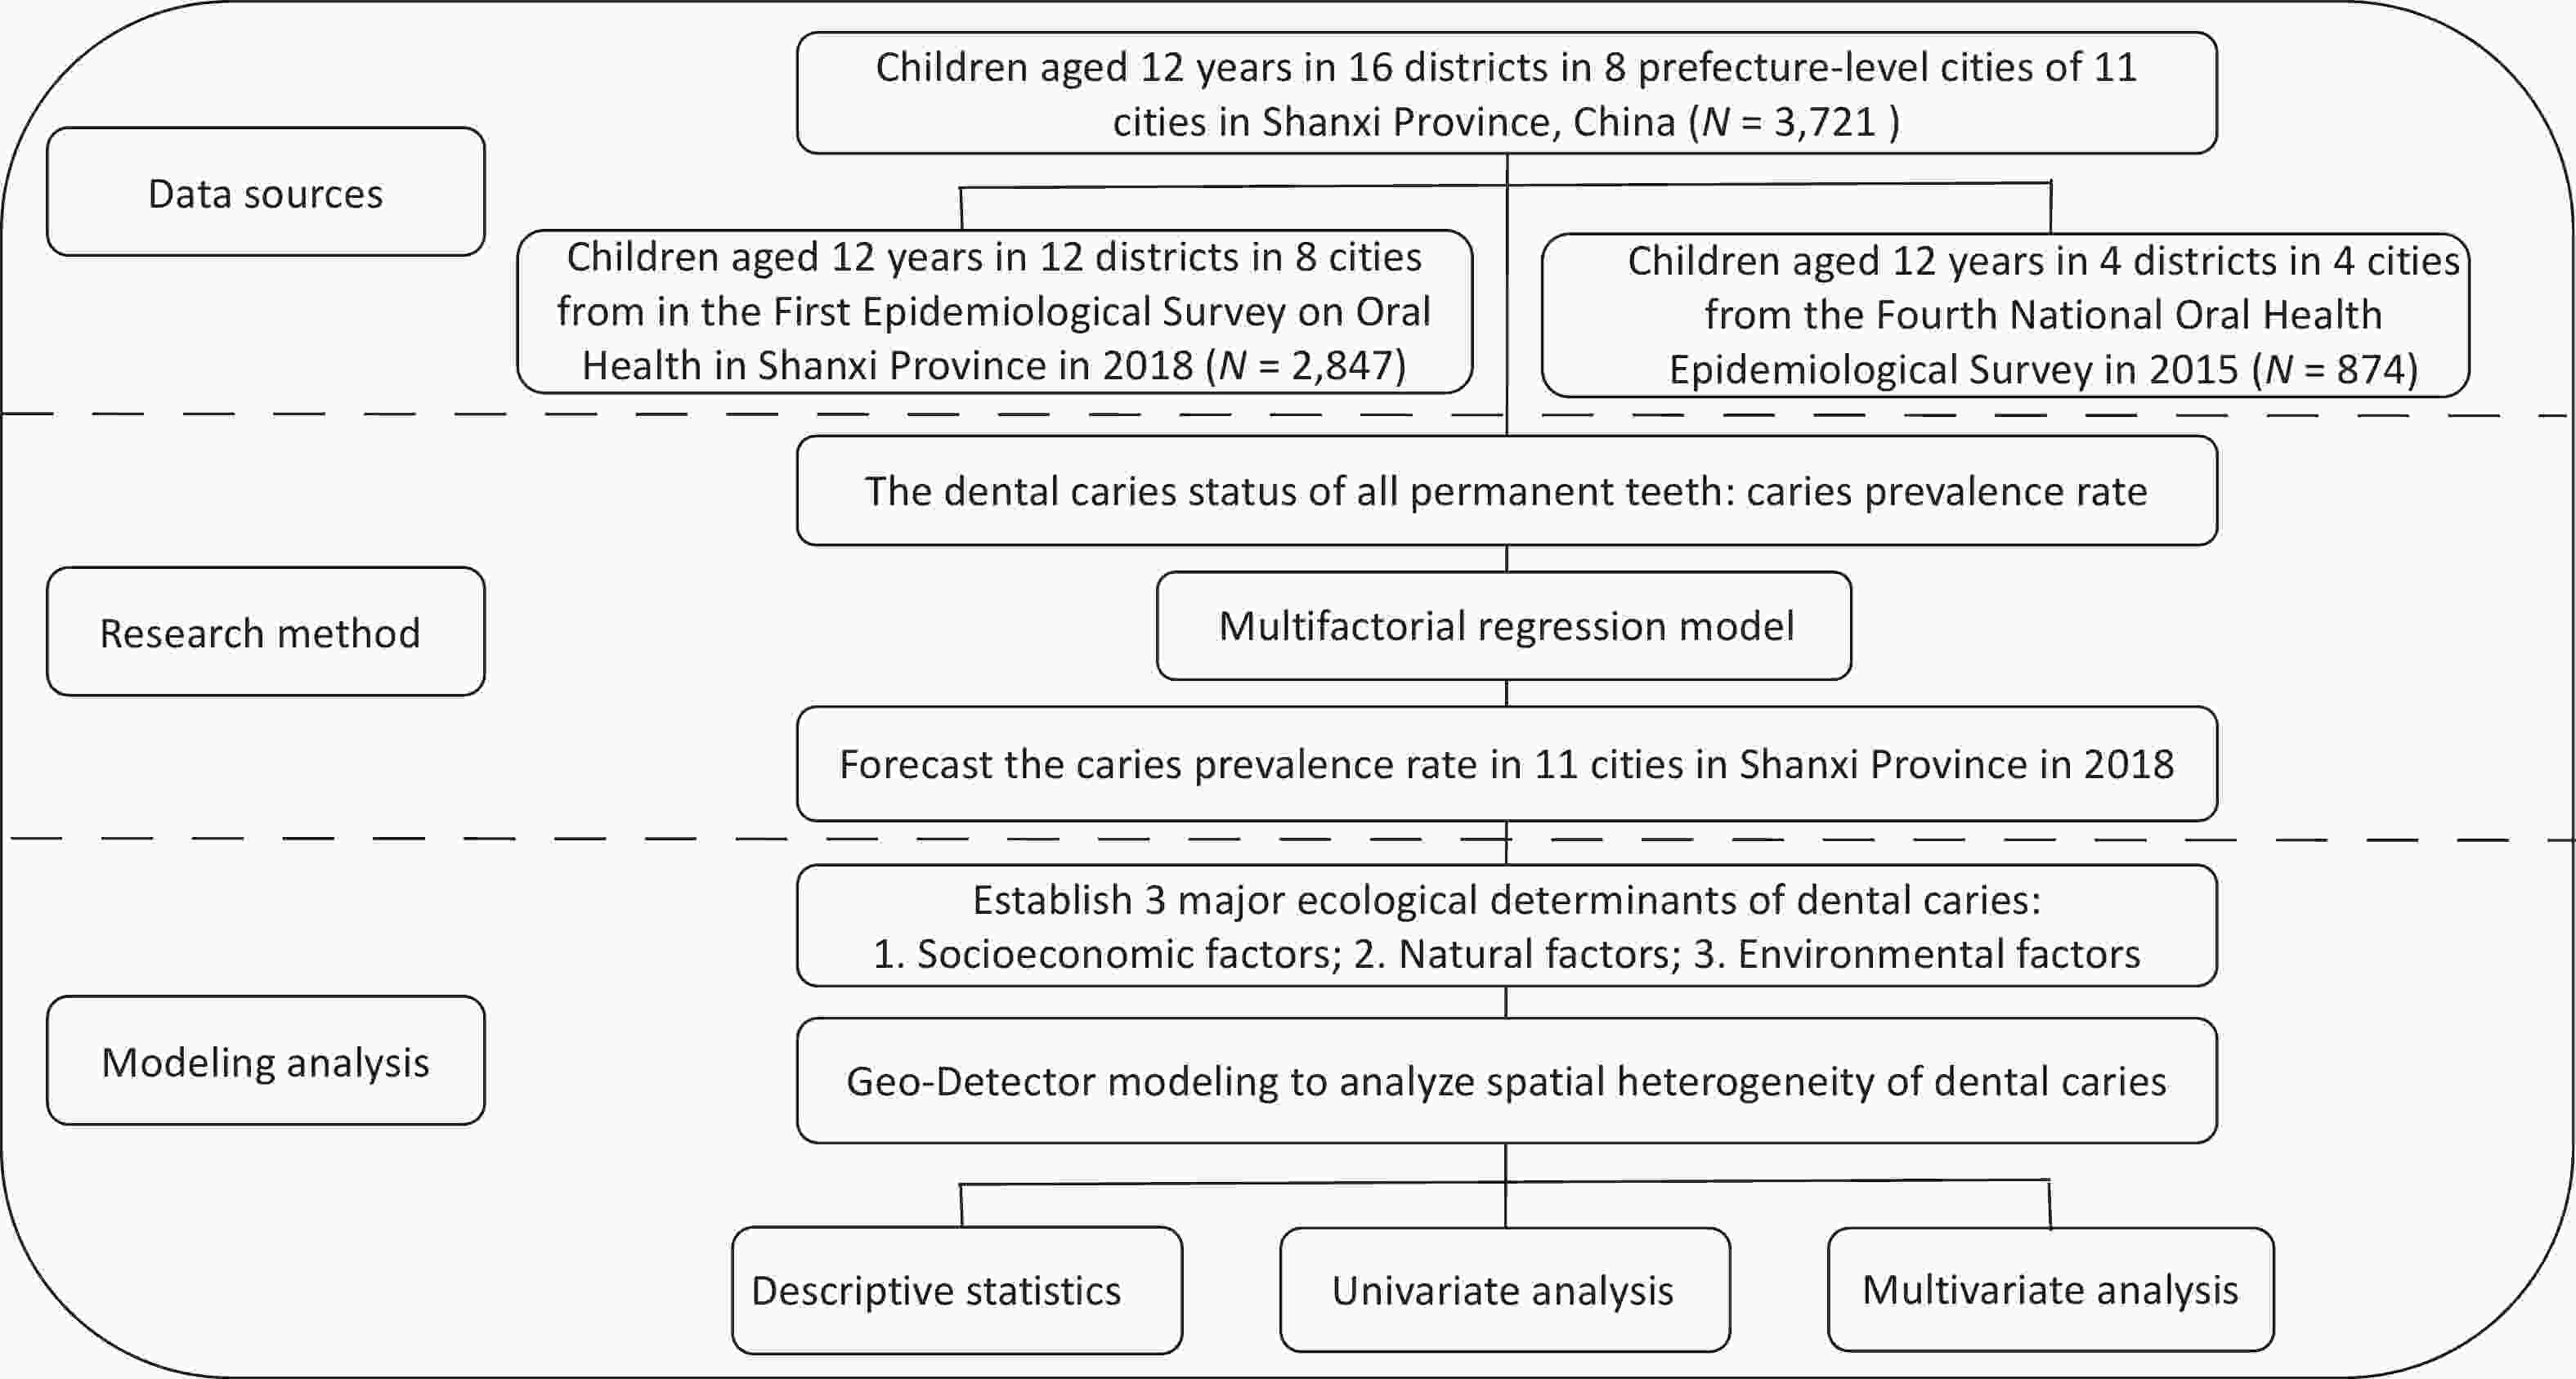
Figure 2. The flow diagram to display the whole research process.
-
The analyzed sample included 3,721 children aged 12, comprising 1,856 boys (49.9%) and 1,865 girls (50.1%), residing in 8 cities across Shanxi Province. Table 3 details the participants’ demographic characteristics and the prevalence of dental caries. In Shanxi Province, the dental caries rate among 12-year-olds (DMFT > 0) stood at 41.1%. Notably, there were significant gender differences in caries prevalence, with girls exhibiting a higher rate according to Table 3. Conversely, the variation in caries prevalence between urban and rural settings was not statistically significant (P = 0.10).
Variable Number Dental caries (%) χ2 P 12 years 3,721 1,528 (41.1) Sex Boy 1,856 689 (37.1) 23.769 0.00 Girl 1,865 839 (45.0) Area Urban 1,857 788 (42.4) 2.763 0.10 Rural 1,864 740 (39.7) Table 3. Baseline characteristics of the samples
To elucidate regional disparities, the caries prevalence rate was categorized into four levels (< 0.35, 0.35–0.43, 0.43–0.51, and 0.51–1.00).
-
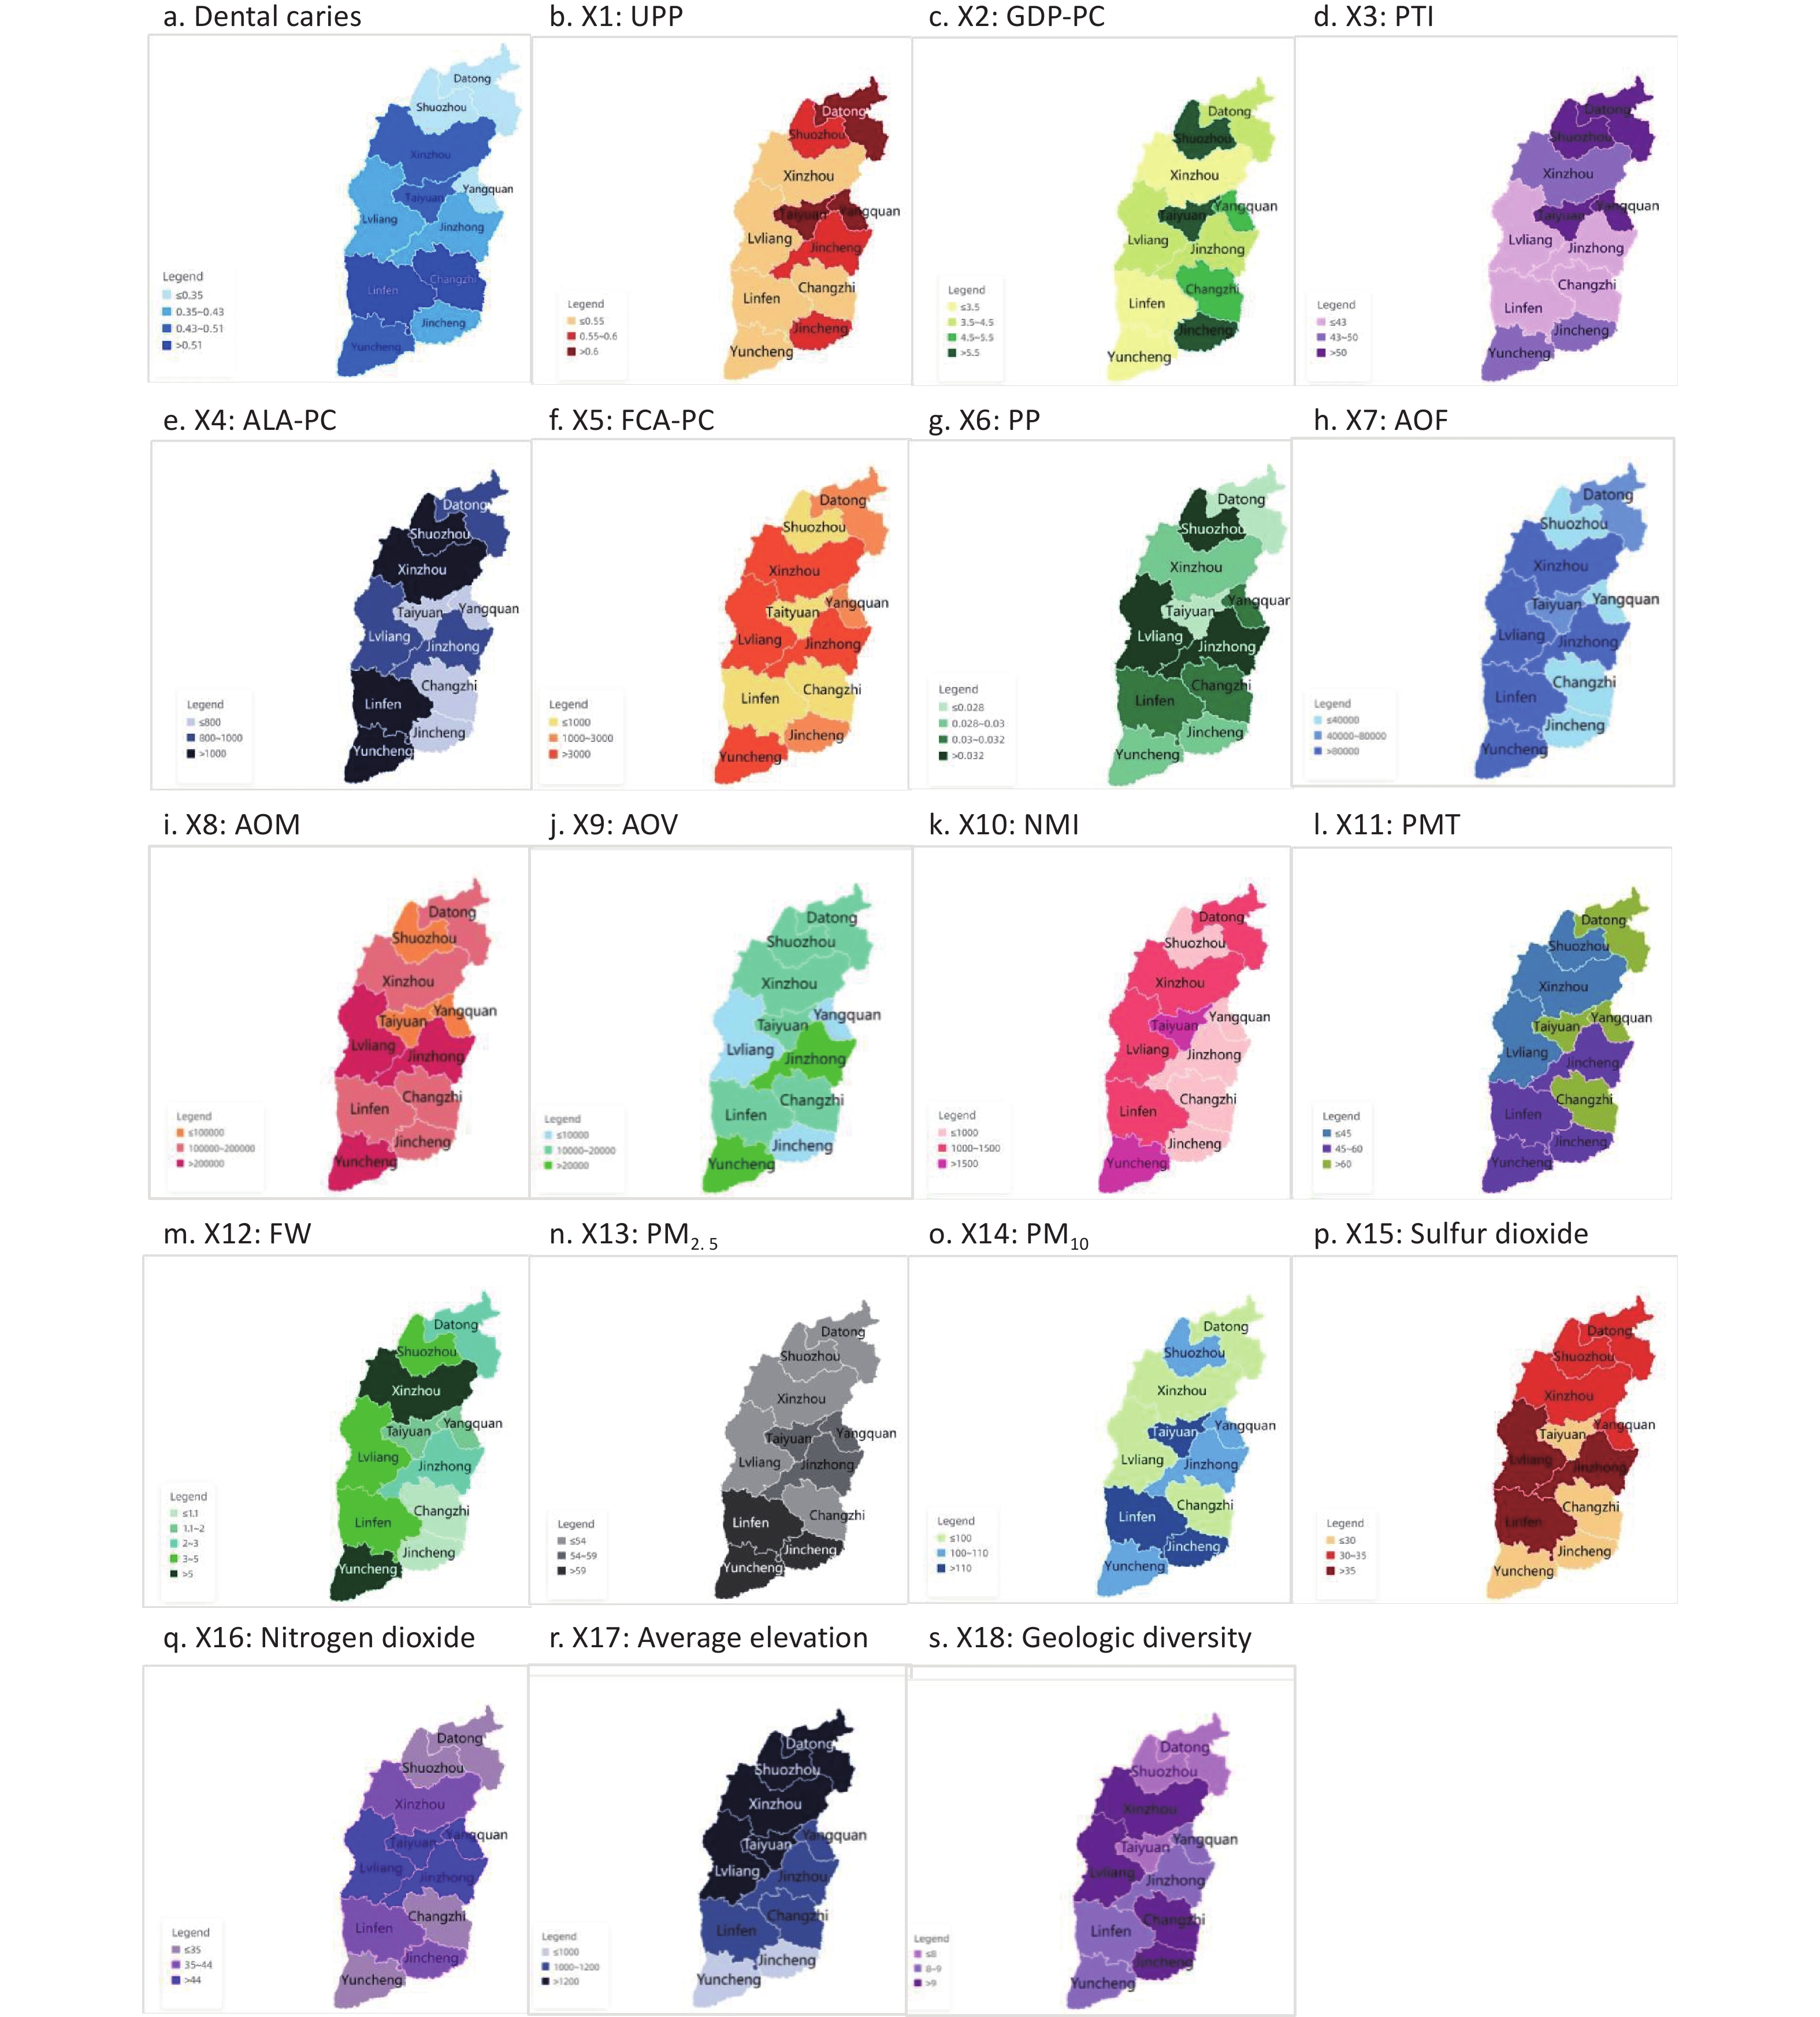
The Geo-Detector model assessed three categories of ecological factors: socioeconomic, medical resources, and the natural environment. Supplementary Figure S1 (available in www.besjournal.com) depicts the spatial heterogeneity of these ecological factors alongside the caries prevalence rate, and Table 4 enumerates the q-values for the eighteen distinct ecological factors. The findings reveal that socioeconomic factors (Q = 0.30, P < 0.05) exert a more substantial impact compared to the natural environment (Q = 0.19, P < 0.05) and medical resource accessibility (Q = 0.25, P < 0.05). The UPP has the highest explanatory power (51%) for caries prevalence heterogeneity, as indicated by its q-value (q = 0.51, P < 0.05). Both the PTI and FCA-PC exhibit equal q-values. Moreover, natural environmental factors like SO2 concentration and FW are influential, with q-values of 0.39 (P < 0.05) and 0.27 (P < 0.05), respectively.
Factors Q P Socioeconomic factors 0.30 0.04 X1(UPP) 0.51 0.04 X2(GDP-PC) 0.38 0.02 X3(PTI) 0.39 0.02 X4(ALA-PC) 0.17 0.03 X5(FCA-PC) 0.39 0.04 X6(PP) 0.26 0.04 X7(AOF) 0.14 0.03 X8(AOM) 0.19 0.04 X9(AOV) 0.16 0.03 Medical resources factors 0.25 0.03 X10(NMI) 0.12 0.02 X11 (PMT) 0.08 0.03 Natural environmental factors 0.19 0.04 X12(FW) 0.27 0.04 X13(PM2.5) 0.14 0.03 X14(PM10) 0.22 0.04 X15(Sulfur dioxide) 0.39 0.02 X16(Nitrogen dioxide) 0.14 0.03 X17(Average elevation) 0.10 0.03 X18(Geologic diversity) 0.17 0.04 Note. Q in the table represents strength of interpretation of dental caries distribution by individual factors of socioeconomic, medical resources, and the natural environment, q represents strength of interpretation of dental caries distribution by individual factors of eighteen distinct ecological factors. The larger the value, the greater the ability to explain the spatial disparities of dental caries; UPP, urban population percentage; GDP-PC, gross domestic product per capita; PTI, the proportion of tertiary industry; ALA-PC, arable land area per capita; FCA-PC, farm corn area per capita; PP, proportion of pupils; AOF, annual output of fruits; AOM, annual output of meat; AOV, annual output of vegetables; NMI, the number of medical institutions; PMT, the percentage of medical technicians; FW, fluoride concentration of water. Table 4. Q-values of the three ecological factors and the eighteen specific ecological factors
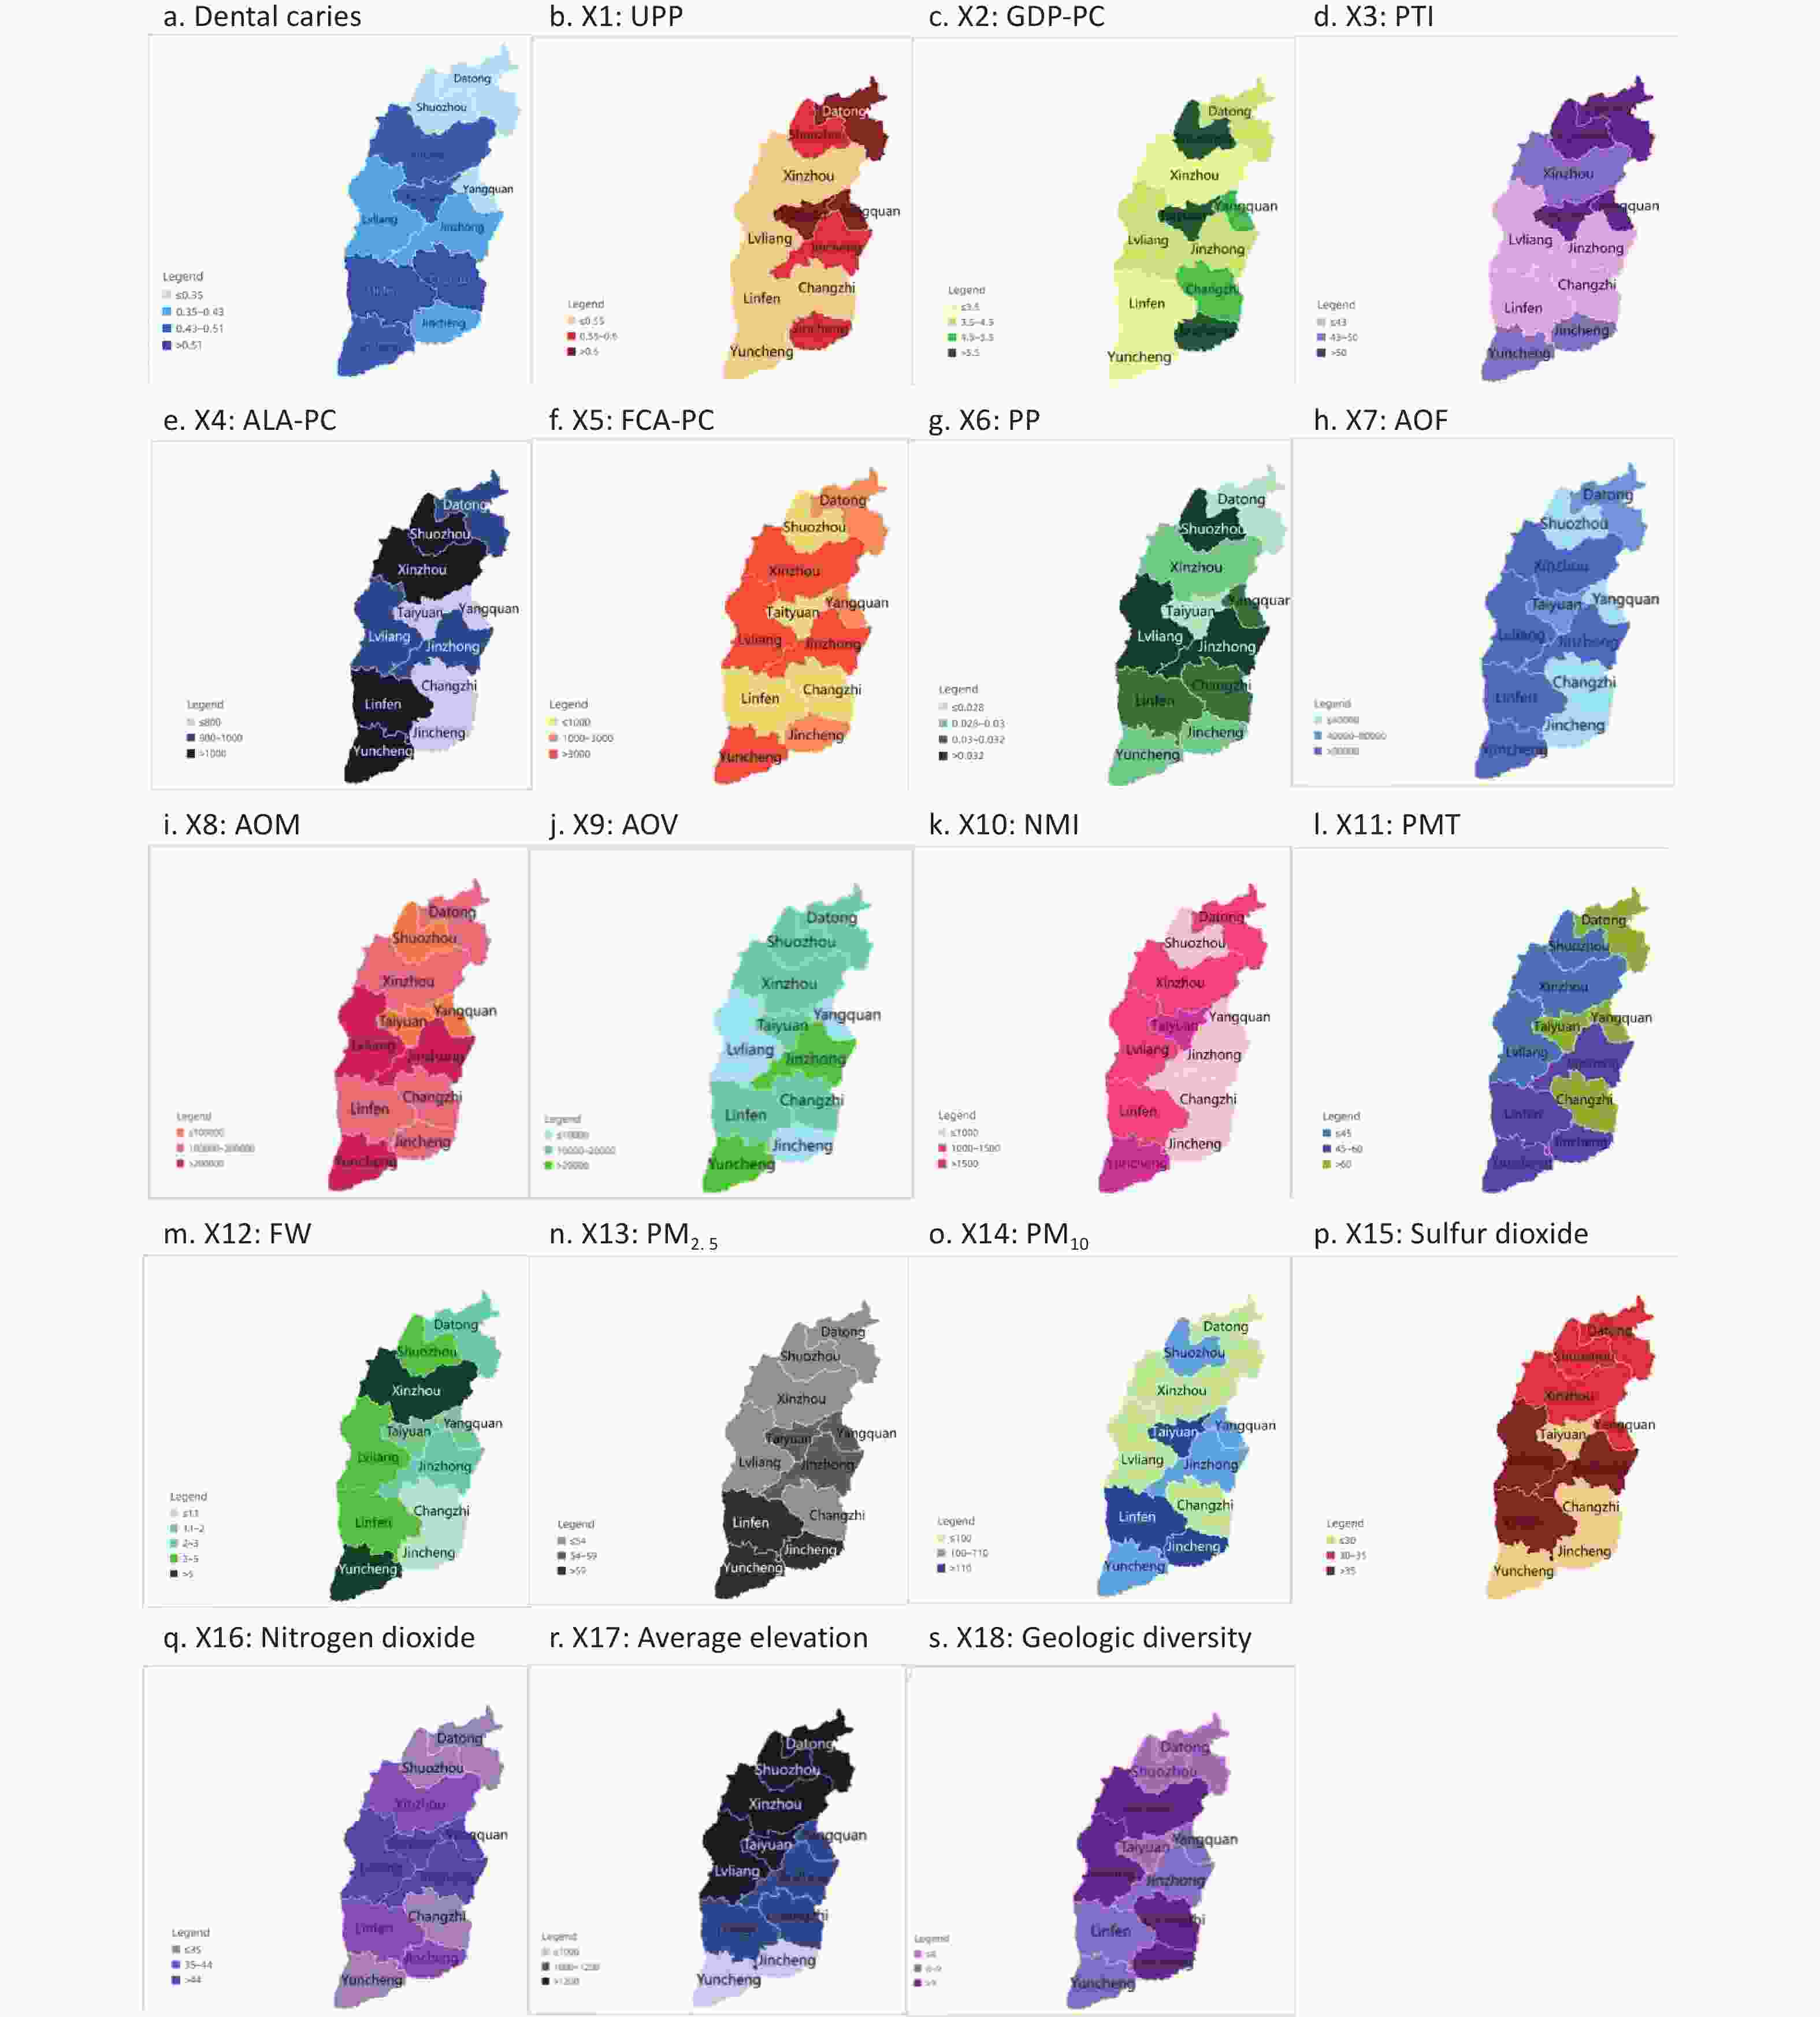
Figure S1. He spatial heterogeneity of ecological factors. (source of the base map: https://map.baidu.com). UPP, urban population percentage; GDP-PC, gross domestic product per capita; PTI, the proportion of tertiary industry; ALA-PC, arable land area per capita; FCA-PC, farm corn area per capita; PP, proportion of pupils; AOF, annual output of fruits; AOM, annual output of meat; AOV, annual output of vegetables; NMI, the number of medical institutions; PMT, the percentage of medical technicians; FW, fluoride concentration of water.
-
This study employed the Geo-Detector model to explore how interactions among socioeconomic, medical resources and natural environmental factors influence caries prevalence. Table 5 presents the q-values for the interaction effects among ecological factors. The analysis identified two interaction types: bivariate and nonlinear enhancement effects. Notably, the interactions between FCA-PC and PP, and between FW and PM10, demonstrated the highest explanatory power, at 100%, for the spatial heterogeneity of the caries prevalence rate (P < 0.05), among ninety-six interaction pairs exhibiting a nonlinear enhanced effect.
X5∩X6
(1)X12∩X14
(1)X2∩X12
(0.96)X2∩X15
(0.96)X5∩X11
(0.89)X11∩X12
(0.82)X1∩X16
(0.78)X4∩X16
(0.67)X4∩X9
(0.59)X4∩X17
(0.49)X2∩X16
(0.96)X6∩X15
(0.96)X12∩X17
(0.96)X2∩X13
(0.93)X5∩X14
(0.89)X3∩X14
(0.86)X5∩X18
(0.78)X3∩X13
(0.67)X7∩X18
(0.53)X9∩X16
(0.49)X5∩X15
(0.96)X6∩X16
(0.96)X2∩X14
(0.93)X3∩X4
(0.86)X6∩X9
(0.86)X1∩X9
(0.81)X3∩X10
(0.71)X4∩X6
(0.67)X9∩X14
(0.59)X10∩X13
(0.49)X6∩X8
(0.96)X6∩X14
(0.96)X6∩X13
(0.93)X12∩X16
(0.86)X12∩X13
(0.82)X10∩X18
(0.78)X4∩X8
(0.67)X4∩X10
(0.59)X9∩X11
(0.48)X1∩X5
(0.95)X6∩X12
(0.96)X7∩X14
(0.93)X12∩X18
(0.86)X1∩X17
(0.82)X3∩X6
(0.81)X13∩X18
(0.78)X2∩X11
(0.64)X4∩X11
(0.48)X1∩X2
(0.92)X1∩X7
(0.67)X16∩X17
(0.93)X2∩X8
(0.82)X2∩X9
(0.82)X1∩X10
(0.81)X4∩X14
(0.78)X7∩X12
(0.71)X8∩X10
(0.52)X2∩X3
(0.86)X1∩X13
(0.67)X2∩X7
(0.59)X16∩X18
(0.93)X2∩X18
(0.82)X14∩X15
(0.82)X5∩X8
(0.77)X3∩X8
(0.77)X5∩X16
(0.67)X17∩X18
(0.43)X2∩X5
(0.86)X1∩X18
(0.67)X3∩X17
(0.58)X15∩X16
(0.96)X14∩X17
(0.82)X3∩X9
(0.81)X7∩X8
(0.77)X4∩X15
(0.71)X10∩X17
(0.52)X3∩X5
(0.86)X2∩X6
(0.67)X5∩X12
(0.67)X2∩X17
(0.49)X3∩X16
(0.82)X10∩X14
(0.81)X9∩X15
(0.77)X8∩X17
(0.71)X8∩X12
(0.71)X9∩X13
(0.51)X1∩X6
(0.82)X5∩X13
(0.64)X2∩X10
(0.57)X5∩X9
(0.49)X4∩X18
(0.82)X1∩X4
(0.81)X9∩X17
(0.71)X9∩X12
(0.67)X8∩X18
(0.67)X1∩X14
(0.82)X3∩X7
(0.66)X15∩X17
(0.63)X5∩X7
(0.57)X6∩X18
(0.49)X5∩X17
(0.82)X13∩X15
(0.77)X11∩X18
(0.67)X4∩X13
(0.64)X6∩X10
(0.64)X1∩X15
(0.82)X7∩X15
(0.66)X10∩X15
(0.57)X3∩X18
(0.48)X8∩X14
(0.48)X1∩X11
(0.73)X10∩X12
(0.71)X11∩X15
(0.64)X7∩X16
(0.64)X1∩X8
(0.77)X1∩X3
(0.61)X2∩X4
(0.54)X6∩X11
(0.46)X8∩X16
(0.38)X8∩X9
(0.38)X9∩X18
(0.73)X14∩X18
(0.71)X10∩X11
(0.64)X3∩X15
(0.77)X4∩X5
(0.60)X6∩X7
(0.53)X11∩X14
(0.46)X11∩X16
(0.38)X6∩X17
(0.35)X7∩X17
(0.35)X13∩X17
(0.73)X3∩X11
(0.63)X4∩X7
(0.61)X1∩X12
(0.71)X7∩X10
(0.42)X13∩X14
(0.46)X8∩X13
(0.37)X7∩X11
(0.35)X8∩X11
(0.35)X14∩X16
(0.35)X15∩X18
(0.71)X7∩X13
(0.60)X3∩X12
(0.71)X5∩X10
(0.60)X7∩X11
(0.42)X4∩X12
(0.35)X9∩X10
(0.30)X13∩X16
(0.28)X11∩X13
(0.24)X11∩X17
(0.20)X10∩X16
(0.60)X8∩X15
(0.71)X12∩X15
(0.71)Bivariate enhancement effect Nonlinear enhancement effect 0.4-0.5 0.5-0.6 0.6-0.7 0.7-0.8 0.8-0.9 0.9-1 Note. X1∩X2 represents the q-value of the interaction between variables X1 and X2, The resulting q-value in parentheses of the interactive factor is used to characterize the relationship between the two factors and their joint impact on dental caries; The table show that there are only two types of interaction infuence: the bivariate and nonlinear enhancement effects. Bivariate enhancement effect indicates that the combined influence of two factors on caries was more significant than the expected effect of each individual factor alone; Nonlinear enhancement effect indicates that the combined influence of two factors on caries greater than the sum of the expected effects of the two factors alone, and give different colors according to the q-value size. X1: UPP, urban population percentage; X2: GDP-PC, gross domestic product per capita; X3: PTI, the proportion of tertiary industry; X4: ALA-PC, arable land area per capita; X5: FCA-PC, farm corn area per capita; X6: PP, proportion of pupils; X7: AOF, annual output of fruits; X8: AOM, annual output of meat; X9: AOV, annual output of vegetables; X10: NMI, the number of medical institutions; X11: PMT, the percentage of medical technicians; X12: FW, fluoride concentration of water; X13: PM2.5, fine inhalable particles; X14: PM10, inhalable particles; X15: sulfur ioxide; X16: nitrogen dioxide; X17: average elevation; X18: geologic diversity. Table 5. Q-values of the interaction influence between two factors
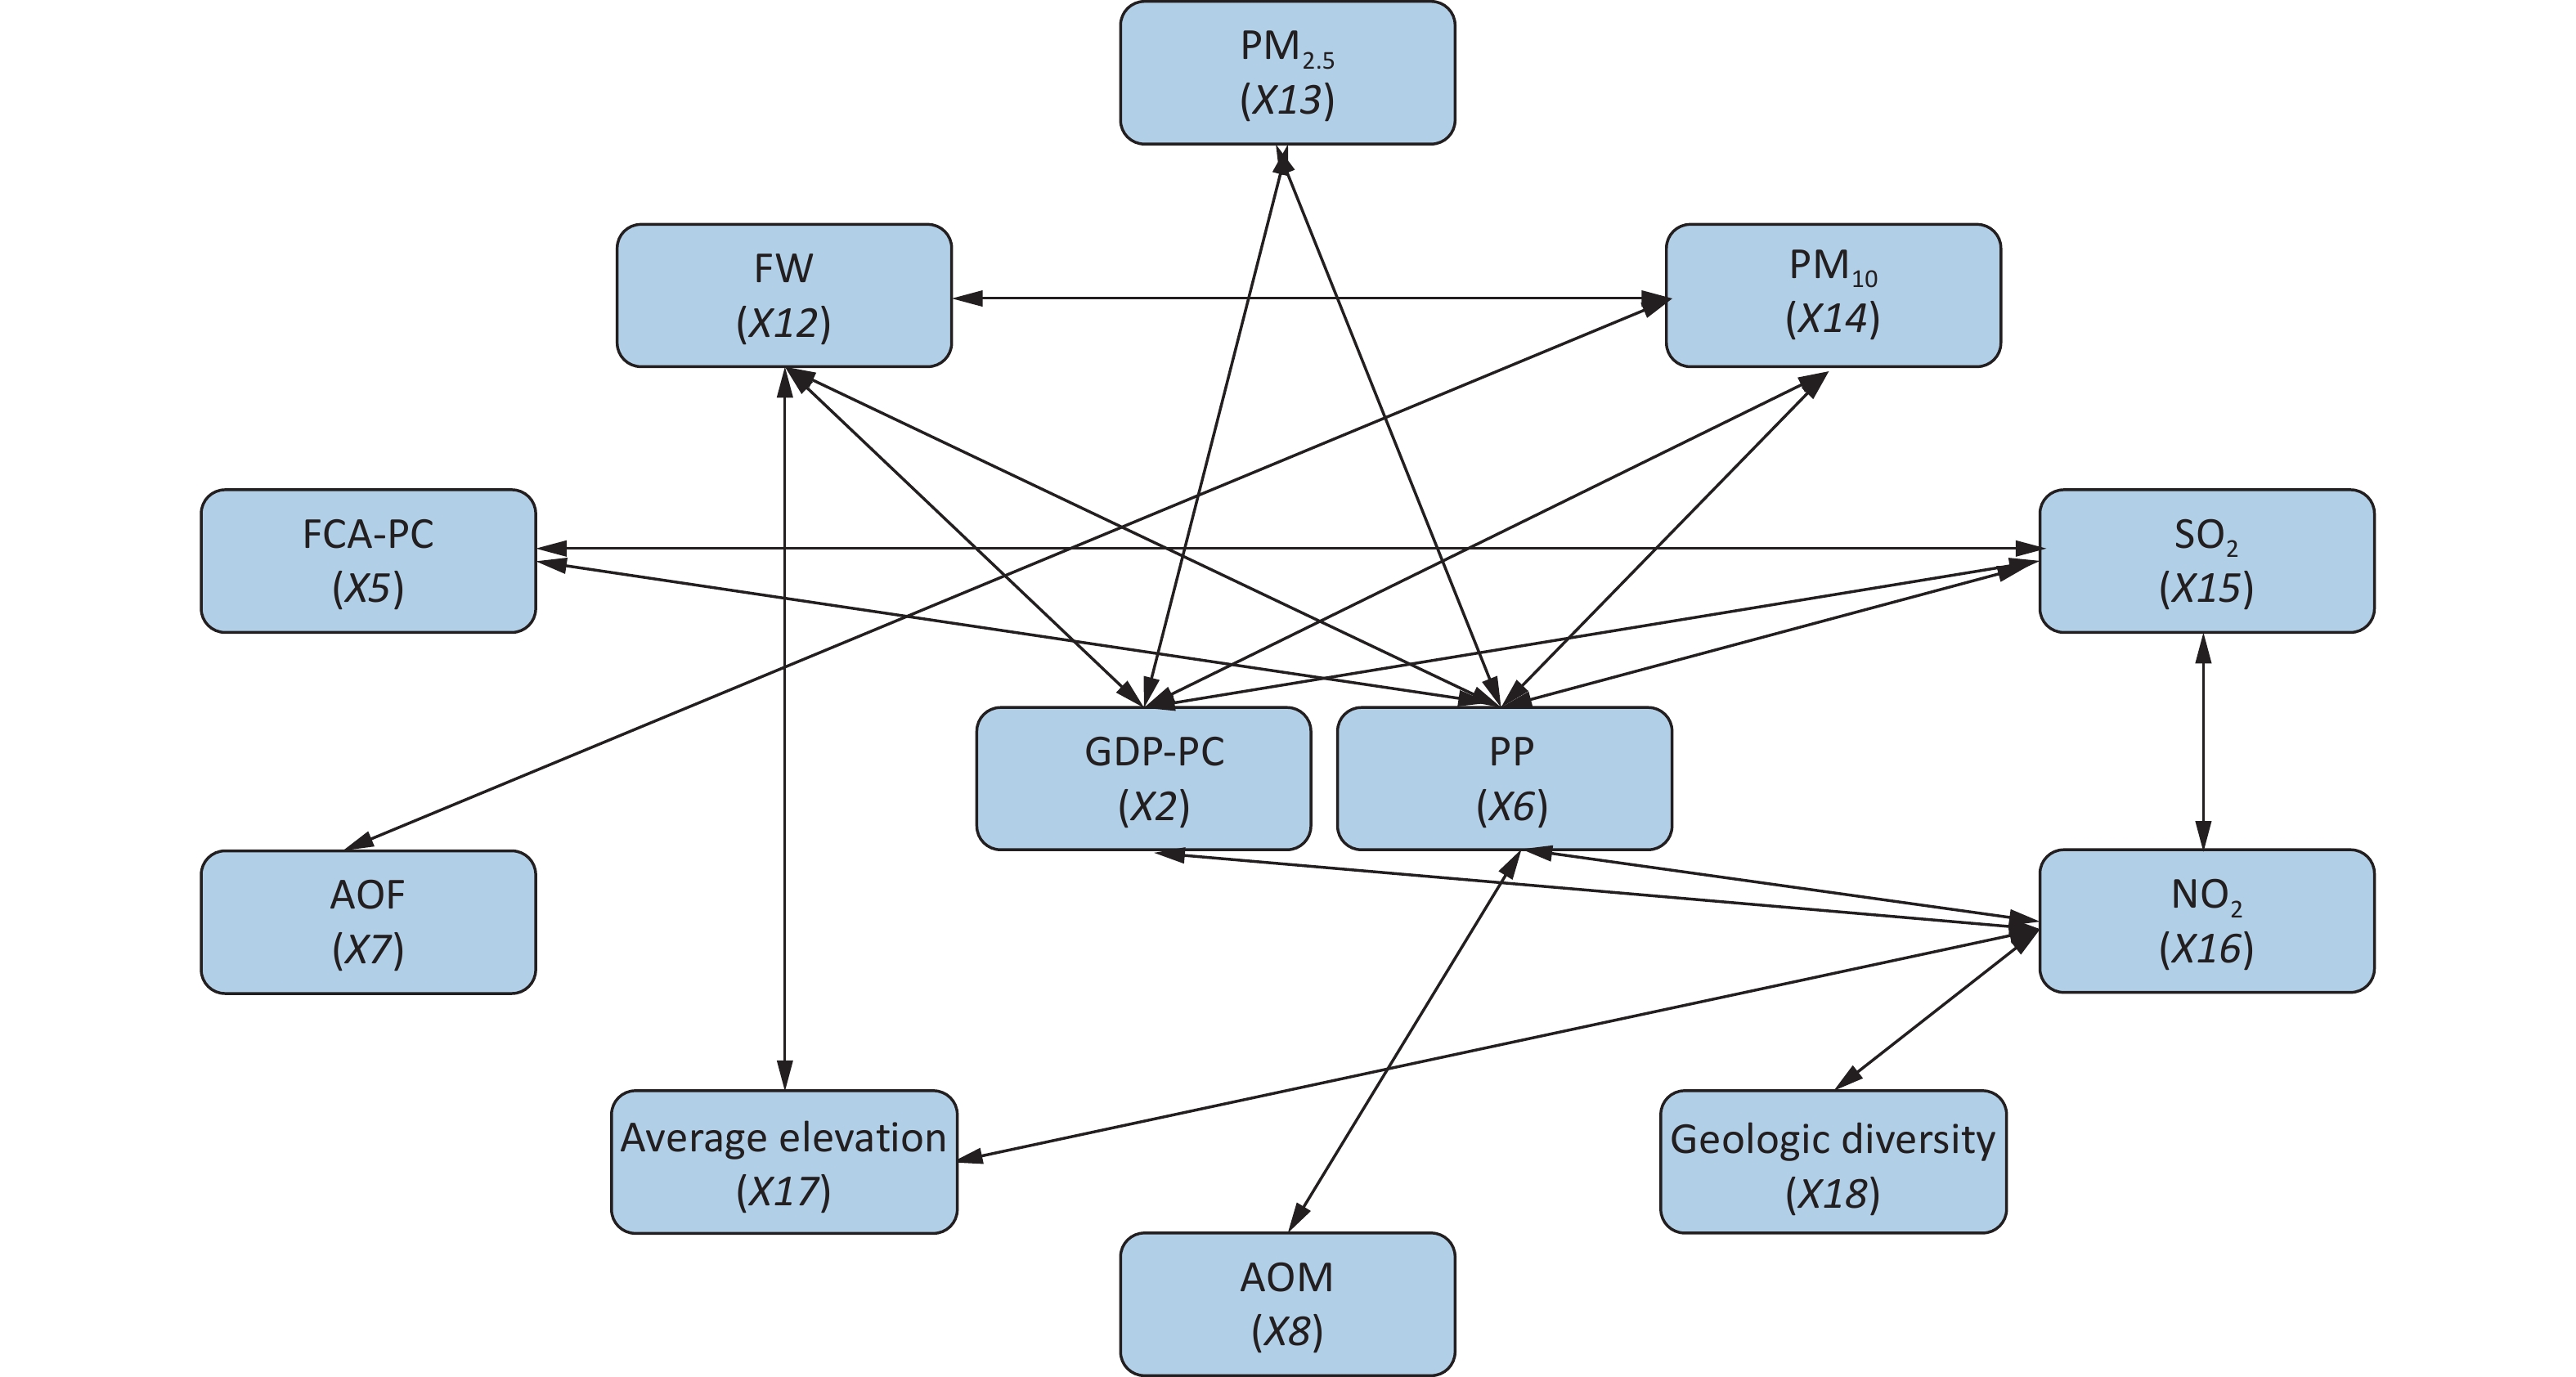
A network map illustrating the factors with interactive q-values exceeding 0.90 is depicted in Figure 3. The analysis revealed that PP exhibited the highest frequency of nonlinear enhanced interactions with other factors (AOM, FW, PM2.5, PM10, NO2, SO2), all above 90.0%.

Figure 3. The Network Diagram of the Fnteractive Factors. Whose Interactive q-values were Greater Than 0.90. X2: GDP-PC, gross domestic product per capita; X5: FCA-PC, farm corn area per capita; X6: PP, proportion of pupils; X7: AOF, annual output of fruits; X8: AOM, annual output of meat; X12: FW, fluoride concentration of water; X13: PM2.5, fine inhalable particles; X14: PM10, inhalable particles; X15: sulfur dioxide; X16: nitrogen dioxide; X17: average elevation; X18: geologic diversity.
-
Limited research exists in the literature on the spatial heterogeneity of caries, with a predominant focus on socioeconomic and medical factors, while often overlooking natural environmental influences and the interplay between multiple ecological factors in spatial disparities[26,27]. The current study aimed to assess the impact of geographic distribution on dental caries among a significant cohort of 12-year-old children in Shanxi Province. Findings revealed a trend of escalating caries rates from north to south in the spatial examination of dental caries distribution among these children in Shanxi Province, suggesting associations with socioeconomic, medical, and natural environmental factors.
Geo-Detector is a technique utilized to quantify spatial stratification heterogeneity. Previously, the Geo-Detector model has been effectively employed in public health domains, such as neonatal neural tube malformations and hand, foot, and mouth disease. When integrated with pertinent medical research, the broad applicability of the Geo-Detector model is confirmed. This study employed the Geo-Detector model to pinpoint spatial disparities in caries prevalence rates, depict these on maps, and explore underlying causes. This facilitated the strategizing and structuring of oral health services, proving crucial for directing interventions to diminish oral health service disparities across regions and enhance resource allocation based on the specific needs of each geographic area.
This study identified a correlation between the risk of developing dental caries and nine socioeconomic factors, offering a foundation for governments to craft targeted regional strategies for dental caries prevention. The research highlighted that children from lower socioeconomic backgrounds are prone to dental caries, underscoring the need for public welfare initiatives in rural areas. Additionally, fostering interprofessional collaboration among dental and non-dental health professionals is crucial to address the needs of low socioeconomic groups effectively[28].
The analysis revealed that socioeconomic factors (Q = 0.30) were critical in shaping the spatial distribution of dental caries. Specifically, the UPP (q = 0.51) had a notable impact on caries prevalence. Several potential mechanisms were identified linking UPP to caries, including how the urban population size affects income, education levels, oral health habits, dietary choices, health service utilization, and family or individual behavior patterns. In Shanxi Province, with its eleven cities covering extensive areas, 58.41% of the population resided in urban settings by the end of 2018. Notably, Yuncheng and Lyuliang had the lowest urbanization rates, with 50.20% and 50.59% of the population living in urban areas, respectively, whereas Taiyuan, the capital, boasted the highest at 84.88%. These findings underscore the significant influence of UPP on the spatial dynamics of caries prevalence, suggesting that UPP-related disparities between regions may contribute to the spatial heterogeneity in caries distribution.
Utilizing the Geo-Detector model, we examined the interactions among environmental factors, identifying the interaction between FCA-PC and PP as notably influential in shaping the spatial distribution of caries relative to FCA-PC. Shanxi’s distinct geographic and climatic attributes, characterized by its prominent mountain landscapes, have earned it the moniker “Kingdom of little grains” Corn, a predominant crop, is extensively cultivated across Taihang Mountain, Lyuliang Mountain, and the northwestern regions of Shanxi’s 11 cities. The province’s southern area, featuring the lowest elevation and highest thermal resources, is predominantly a wheat and cotton zone, comprising about 65% of the total cultivated area and serving as a key wheat producer. Here, residents primarily consume refined rice and flour, with a noted deficiency in whole grain and coarse cereal intake.
Moreover, we posited that a diversity in socioeconomic factors might mitigate the risk of dental caries, given the observed pattern of higher risk in the southern regions and lower risk in the northern areas. Refined grains, characterized by their diminished nutrient, mineral, dietary fiber, polyunsaturated fatty acids, and phytochemical content due to the removal of the grain’s outer bran layer and endosperm during refining[29], predominantly consist of starch. Hancock et al.[30] reported that the duration for which plaque pH remains below the critical threshold of 5.5 is significantly prolonged with the intake of processed starch and sugar-laden foods compared to foods with high sucrose levels alone, indicating an augmented caries risk with refined grain consumption, especially those incorporating sucrose. Additionally, refined grains enhance the propensity for acidogenic bacteria to adhere to teeth and form dental plaque, potentially leading to caries[31]. This finding corroborates the conclusions of this study from an alternate perspective.
Despite increasing interest in how hazardous gases affect climate and health, research on the link between the natural environment and oral health remains scant. Notably, sulfur dioxide and FW, compared to the average elevation and geologic diversity to reflect the geological environment of the areas where children live, are environmental factors with significant q-values.
Sulfur dioxide, a prevalent air contaminant, sees its highest concentrations globally in China[32]. This gas primarily emanates from burning sulfur-rich fuels like coal. Shanxi, China’s leading coal-producing region and a crucial energy hub, faces severe air pollution challenges[33,34]. Solanki et al. showed that exposure to adverse factors of industrial environments such as coal-fired particulate matter may affect the content of almost essential chemical elements in enamel and dentin, thereby increasing caries risk[35]. While the specific influence of sulfur dioxide on caries development is yet to be elucidated, but the researchers have indicated that exposure to soot smoke induces oxidative stress and generates excessive reactive oxygen species (ROS). The mechanism by which this leads to dental caries may involve the infiltration of inflammatory cells such as monocytes, macrophages, and neutrophils, exacerbating oral inflammation through oxidative stress. This, in turn, results in partial functional abnormalities or even cell apoptosis in the oral cavity, ultimately causing damage to the hard tissue of teeth[36].
Fluoride, prevalent in nature, readily dissolves in groundwater, making drinking water the primary source of daily fluoride intake, with approximately 90% of fluoride from water absorbed via the digestive tract[37]. In the early 1980s, Shanxi Province was identified as an area with high fluoride levels and endemic fluorine poisoning. Despite significant reductions in FW levels following comprehensive prevention and control measures, some regions in Shanxi still exceed national fluoride standards[38]. Notably, fluoride in small amounts is beneficial for dental caries prevention, enhancing enamel, aiding remineralization, and curbing bacterial proliferation. It integrates into tooth structure, bolstering resistance to acid erosion. Furthermore, fluoride disrupts bacterial acid production in dental plaque and diminishes their adhesion to teeth. Employing water fluoridation and fluoride-infused dental products is highly effective in caries prevention. Nevertheless, maintaining oral health also necessitates consistent oral hygiene practices and regular dental visits[39-41].
The limitations of this study warrant careful consideration. Initially, the calculation of the caries rate among 12-year-old children in Shanxi Province for 2018 may introduce variability. Moreover, certain findings require meticulous interpretation. For example, while the extent of corn cultivation reflects the region’s nutritional profile to some degree, it does not directly correlate with individual corn consumption. The potential existence of significant correlations at older ages also merits further exploration. Future research will incorporate more extensive samples from varied regions.
-
The primary aim of this study was to explore the spatial heterogeneity and identify risk factors for dental caries in 12-year-old children in Shanxi province, China. The findings confirmed notable spatial heterogeneity in caries prevalence, with socioeconomic factors significantly influencing this distribution. Therefore, it is recommended that the government bolster medical resources in the southern part of Shanxi Province, emphasizing ecological and environmental safeguards alongside economic growth. Strategies could include a moderate increase in water fluoride levels, reduction of sulfur dioxide emissions, and promotion of equitable medical resource distribution across regions.
HTML
Study Sample
Data Sources
Ecological Determinants of Dental Caries
Statistical Model
The Flow Diagram
Descriptive Statistics
Univariate Analysis
Multivariate Analysis
 24052+Supplementary Materials.pdf
|

|

 Quick Links
 DownLoad: