


-
Type 2 diabetes mellitus (T2DM) has emerged as a significant global public health concern, evolving into a worldwide epidemic. As of 2021, the prevalence of T2DM has reached 536.6 million individuals, with projections estimating an increase to 783.2 million by 2045[1]. Dysfunction in pancreatic β-cells is a primary contributor to diabetes[2]. However, a comprehensive understanding of the precise mechanisms underlying pancreatic β-cell dysfunction in T2DM necessitates further research[3].
Hyperlipidemia is a crucial characteristic of T2DM and plays a critical role in the disease progression[4]. Free fatty acids contribute significantly to the failure of pancreatic β-cells, triggering apoptosis, elevating basal insulin secretion, and suppressing glucose-stimulated insulin secretion (GSIS)[5]. Palmitate is a widely used in vitro model for studying lipotoxicity in pancreatic β-cells. Nevertheless, the precise pathological mechanisms responsible for lipotoxicity-induced injury to pancreatic β-cells remain unclear[6].
Ferroptosis, identified in 2012[7], is a mode of cell death marked by unstable iron overload, accumulation of iron-dependent lipid peroxides, and redox imbalance[8,9]. Emerging evidence indicates its implication in various diseases, including cancer, neurodegenerative diseases, and cardiovascular diseases[10]. Li et al. identified ferroptosis in pancreatic β-cells of a T2DM murine model[11]. Immunohistochemical staining revealed iron accumulation at the pancreatic center, along with mitochondrial shrinkage and cristae loss. This observation indicated that ferroptosis in pancreatic β-cells could contribute to the deterioration of pancreatic function, highlighting its potential as a target for T2DM intervention. However, alternative mechanisms and strategies for preventing ferroptosis in pancreatic β-cells require comprehensive exploration.
Mitochondria play a pivotal role in both oxidative stress and ferroptosis. Cells undergoing ferroptosis exhibit distinct mitochondrial morphological alterations characterized by crumpling and the loss of ridges[12]. Mitochondria are essential sites of intracellular production of reactive oxygen species (ROS)[13]. The imbalance between ROS formation and the cellular antioxidant defense system is a potential oxidative stress catalyst. Free fatty acids have been identified as potent inducers of ROS[14]. The peroxisomal β-oxidation of palmitate produces hydrogen peroxide[15]. Since pancreatic β-cells do not possess enzymes that deactivate hydrogen peroxide within peroxisomes, its generation contributes to palmitate-induced oxidative stress[16]. In clinical trials, conventional antioxidants have demonstrated inefficacy, possibly attributed to their inadequate delivery to subcellular sites where ROS is generated. Notably, the mitochondria-targeted antioxidant (Mito-TEMPO) has exhibited efficacy in mitigating ferroptosis in MIN6 cells[17], although the precise mechanism remains unclear.
Mitophagy, a targeted mechanism for the removal of impaired mitochondria, is primarily regulated by the PINK1/Parkin pathway[18]. Mitochondrial damage reduces the membrane potential, hindering PINK1 entry from the outer to the inner membrane and leading to PINK1 accumulation on the outer mitochondrial membrane. Accumulated PINK1 signals damaged mitochondria, “recruiting” Parkin from the cytoplasm, which localizes on the outer membrane and initiates mitophagy[19]. mtROS are hypothesized to play a crucial factor in successful mitophagy initiation[20]. Mitophagy removes excessive mtROS accumulation and maintains cellular homeostasis[21]. Previous studies have demonstrated that Mito-TEMPO activates PINK1 in porcine embryonic cells[22]. Yet, its impact on reducing mitochondrial damage and alleviating dysfunction in pancreatic β-cells through the PINK1/Parkin pathway remains unclear.
This study employed various concentrations (0, 25, 50, 100 μmol/L) of SP to establish a model simulating diabetic injury. The aim was to investigate the interplay among mtROS, mitophagy, and ferroptosis. Our findings offer novel perspectives on the association between Mito-TEMPO, mitophagy, and therapeutic intervention for ferroptosis in pancreatic β-cells.
-
Sodium palmitate (KC002) was procured from Xi’an Kunchuang, Mito-TEMPO (AB144644) from Abcam, CCCP (HY-100941) and Erastin(HY-15763) from MCE, FerroOrange (F374) from Tongrentang (Japan), and BODIPYTM 581591 C11(D3861) from Thermo Fisher (USA). Mito Tracker Green (C1048) was sourced from Biyuntian (China), while LysoTracker Red (L8010) was acquired from Solepol (China). MitoSox Red (M36008) was supplied by Thermo (USA). β-actin (TA-09) was obtained from Zhongshan Jinqiao, while p62 (18420-1-AP), LC3I/II (14600-1-AP), Parkin (66674-1-IG), TOMM20 (80501-1-RR), and FSP1 (20886-1-AP) antibodies were procured from Proteintech (USA). Additionally, Anti-GPX4 (AB125066), Anti-PINK1 (AB300623), Anti-Acsl4 (AB129177), and Anti-FE (AB75973) were purchased from Abcam (USA).
-
This study utilized mRNA expression profiling data from the GSE25724 dataset based on the GPL96 Affymetrix Human Genome U133A Array. GSE25724 includes data from 6 individuals with type 2 diabetes and 7 with nondiabetic pancreas. The GEO database, a public resource, ensured all included patients had received ethical approval, thus addressing ethical concerns and conflicts of interest. Our research relied on open-source data, eliminating ethical concerns or conflicts of interest. Differential genes were identified using the limma package in R version 3.6.2, with screening criteria set at |log fold change| > 1 and P < 0.05. A total of 259 ferroptosis-related genes were extracted from the FerrDb (Ferroptosis Database: http://www.zhounan.org/ferrdb/Legacy/index.html) and compared with those in the Gene Expression Omnibus (GEO) database. These ferroptosis-related genes from FerrDb were then intersected with the identified differential genes in GSE25724. The Venn diagram facilitated the identification of differentially expressed genes associated with ferroptosis. Subsequently, a heatmap was generated using the heatmap package, and Volcano maps were generated using the ggplot2 package.
-
To delve deeper into the association between diabetes and differentially expressed genes related to ferroptosis, Gene Ontology (GO) annotations were conducted using the “GO Plot,” “ggplot,” and “clusterProfile” packages in the R software. The GO analysis covered three key categories: Biological Processes (BP), Cellular Components (CC), and Molecular Functions (MF). Pathway enrichment analysis utilized the Kyoto Encyclopedia of Genes and Genomes (KEGG), focusing on genetic information processing, metabolic and environmental information-related processes, cellular physiological processes, and drug studies for biofunctional annotation. A significance threshold of P < 0.05 was applied to identify enriched pathways.
-
MIN6 cells, derived from a mouse pancreatic adenoma cell line[23], were cultured in 1640 medium supplemented with 10% FBS and 1% penicillin-streptomycin at 37 °C with 5% CO2. Once the cell density reached 70% to 80%, varying concentrations of SP (0, 25, 50, or 100 μmol/L) were introduced, followed by a 24-hour incubation period. The potential correlation between mtROS, mitophagy, and ferroptosis in MIN6 cell injury induced by SP was investigated. For further analysis, cells were pre-treated with Mito-TEMPO (20 μmol/L), Erastin (20 μmol/L) and CCCP (1 μmol/L) for 1 hour before co-treatment with 100 μmol/L SP for another 24 hours.
-
Lipid ROS levels were quantified using the molecular probe BODIPY581/591C11. MIN6 cells were cultured in 48-well plates, pre-treated with intervention and SP as outlined previously and exposed to a working concentration of 10 μmol/L of the kit reagent for 30 minutes in darkness. Subsequently, the cells were rinsed thrice with phosphate-buffered saline (PBS) and observed under a fluorescence microscope (Japan).
-
The FerroOrange fluorescent probe was employed in accordance with the manufacturer’s provided guidelines. Cellular treatment involved a 24-hour intervention aimed at attaining a confluency level within the range of 70%–80%. After undergoing three washes with PBS, a working solution of 1 μmol/L concentration was added to the cells and allowed to incubate in the laboratory incubator for a duration of 1 hour. Subsequently, the cells were promptly visualized using a fluorescence microscope. A minimum of three physiologically independent tests were conducted to ensure robustness and reliability of the experimental outcomes.
-
Cellular specimens underwent an incubation process in a culture medium composed of 1640 medium, enriched with a concentration of 200 nmol/L Mito-Tracker Green, for a duration of 30 minutes at a temperature of 37 °C followed by gentle rinsing with PBS. Subsequently, cells were exposed to a working solution with 5 µmol/L MitoSox-Red for 40 minutes at 37 °C in the dark. The cells were promptly examined using a fluorescence microscope from Japan. A minimum of three physiologically independent tests were executed.
-
Cells were cultured in 1640 medium with 200 nmol/L Mito-Tracker Green for 30 minutes at 37 °C. After gentle washing with PBS, a 75 nmol/L LysoTracker Red co-incubation was carried out at 37 °C for 30 minutes to label mitochondria and lysosomes. After staining, the solution was replaced with fresh medium, and the cells were observed and imaged under a fluorescence microscope (Japan). Fluorescence co-localization analysis was performed using Image J software, and Pearson correlation was calculated.
-
Total protein concentration extracted from MIN6 cells was assayed using a BCA kit. Proteins were separated by electrophoresis through sodium dodecyl sulfate-polyacrylamide gels and blotted using polyvinylidene difluoride (PVDF) membranes. After finishing, the gels were blocked with 5% skimmed milk for at least 1 h and then incubated with primary antibodies for 16–18 h at 4 °C. LC3 (1:500), p62 (1:20,000), PINK1 (1:1,000), Parkin (1:2,000), GPX4 (1:1,000), FSP1 (1:1,000), Acsl4 (1:10,000), FE (1:1,000), or TOMM20 (1:5,000) for 1.5 hours at room temperature. After protein incubation, protein bands were visualized with enhanced chemiluminescence reagent and the intensity of the bands was quantified using ImageJ software. The experiments were performed three times independently.
-
Data were generated using GraphPad Prism software (version 8). Results are based on multiple independent experiments and presented as mean ± standard deviation. Comparison among multiple groups was assessed using a one-way analysis of variance (ANOVA) followed by Tukey’s test. A significance level of P < 0.05 was used to determine statistical significance.
-
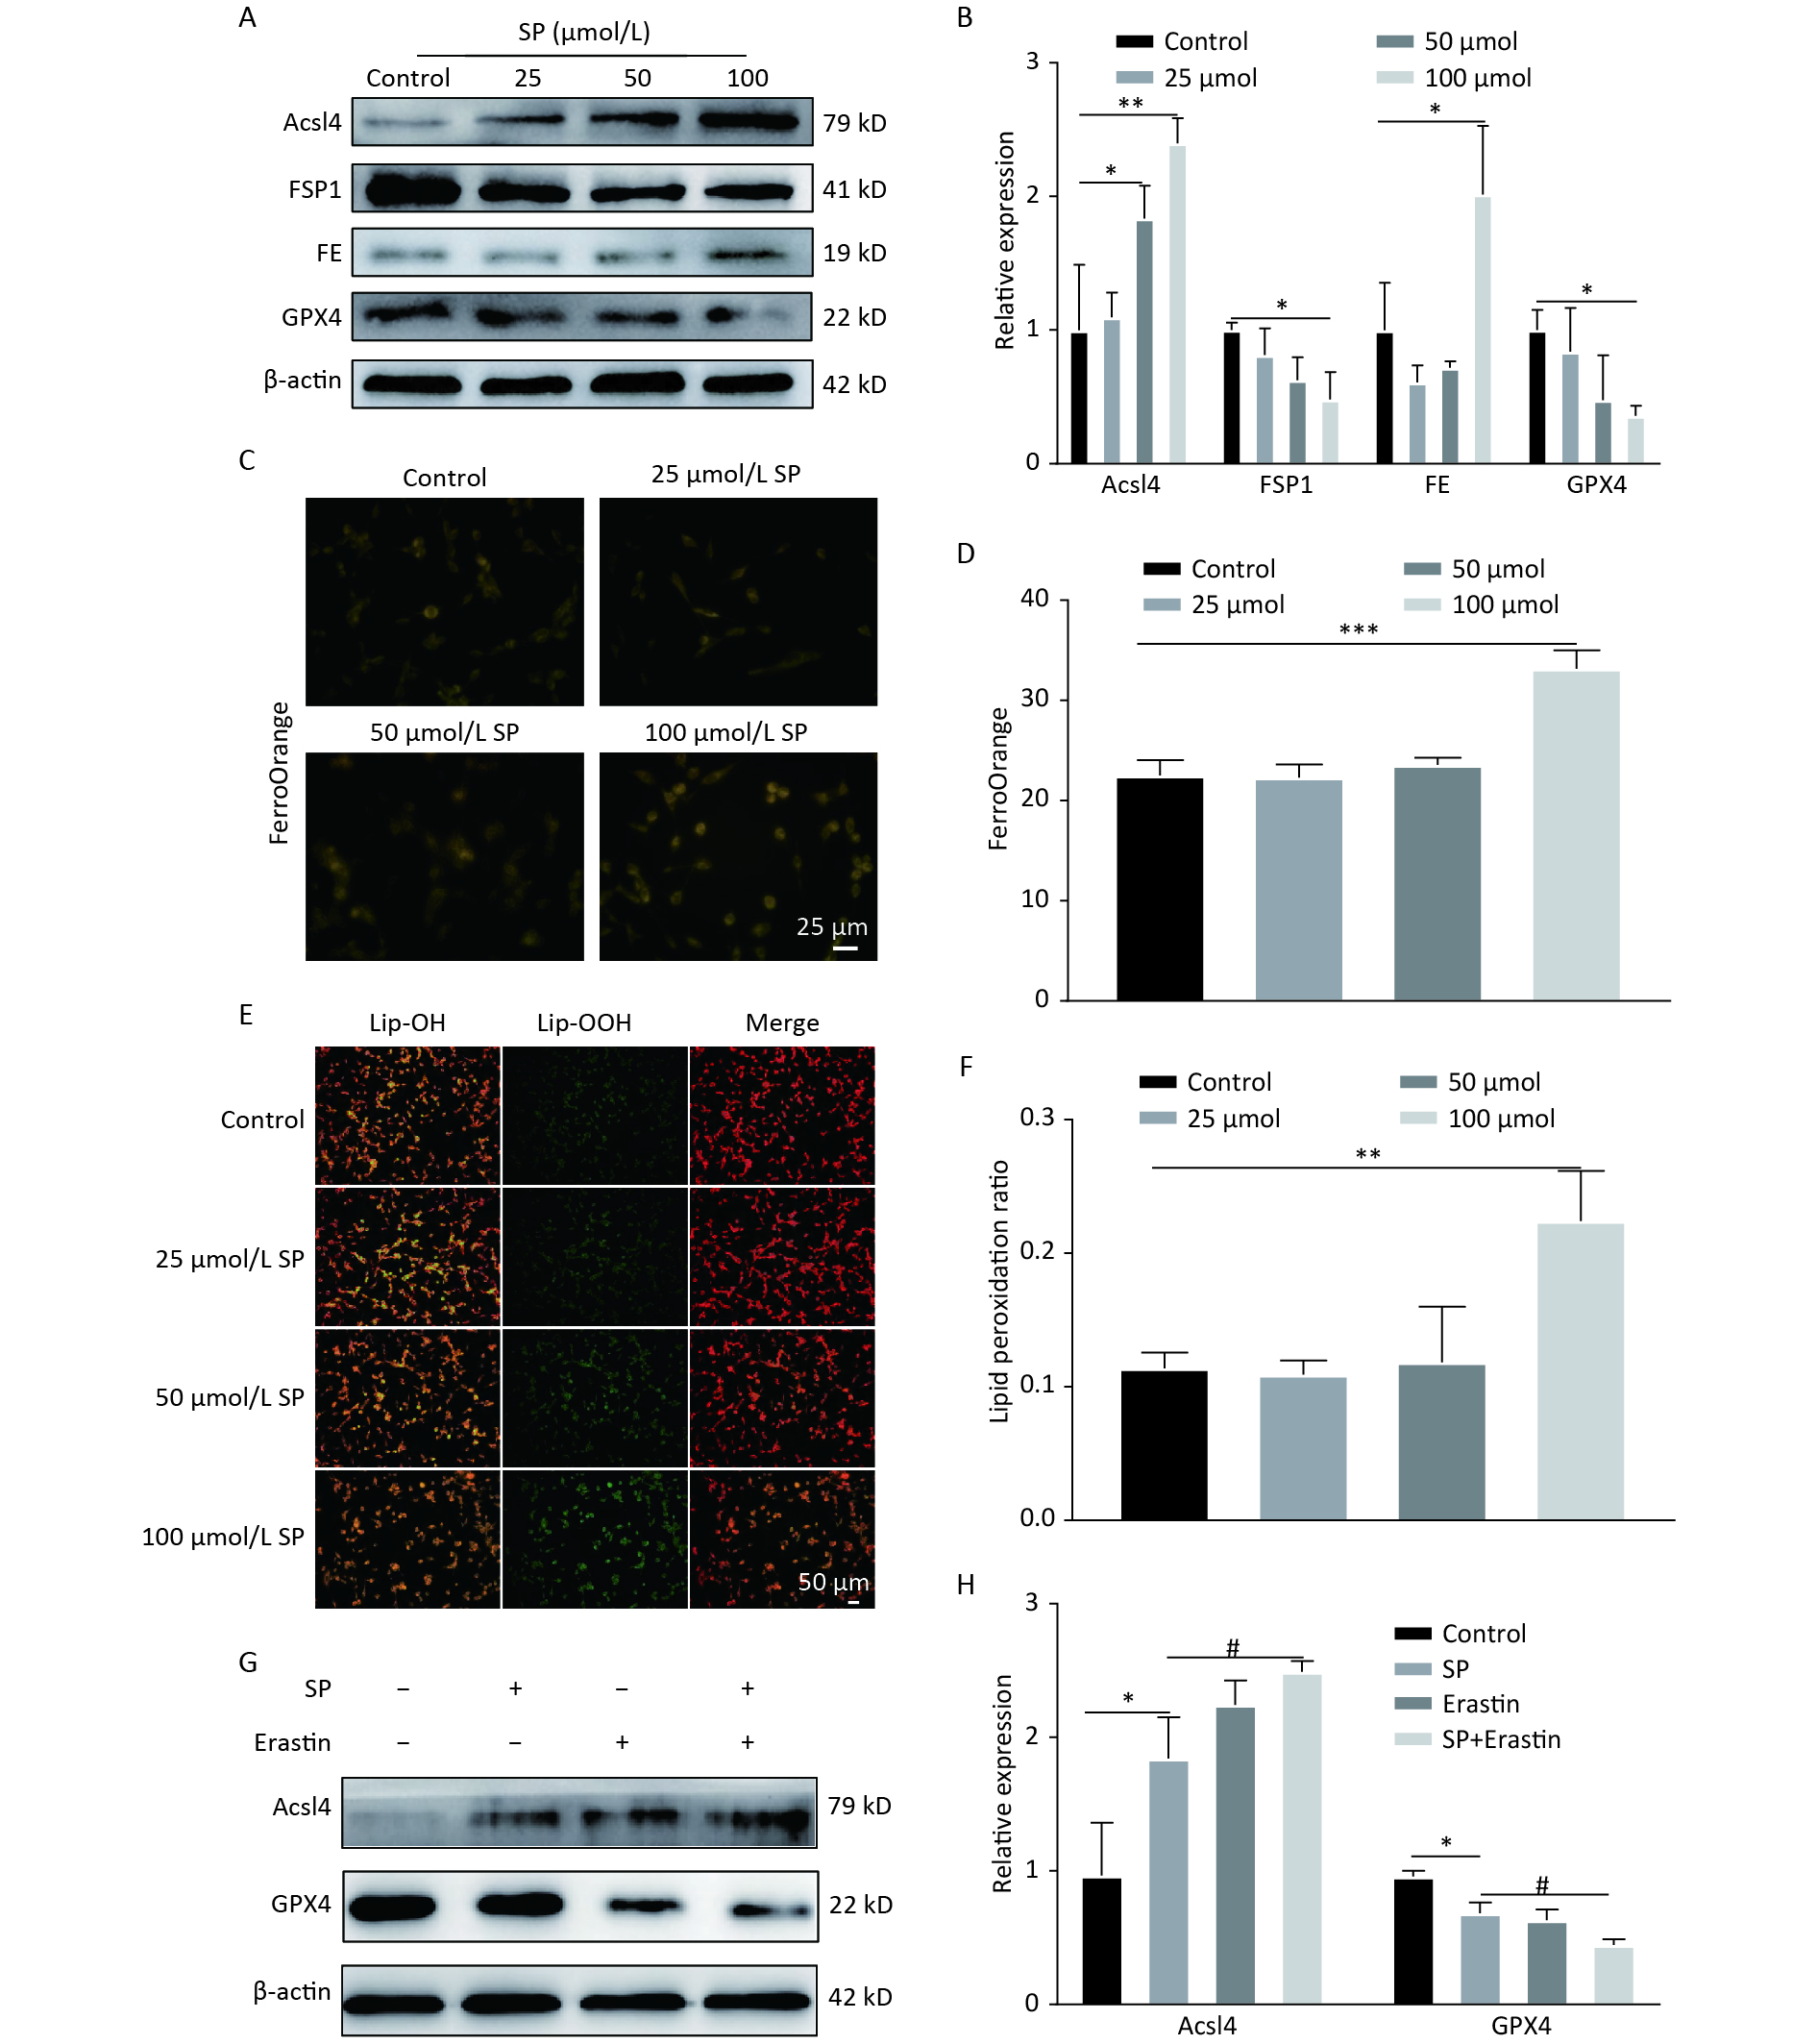
Treatment with SP downregulated GPX4 and FSP1 expression, accompanied by an upregulation of Acsl4 and FE in MIN6 cells compared to the control (P < 0.05) (Figure 1A, B). Furthermore, MIN6 cells treated with 100 μmol/L SP exhibited elevated levels of Fe2+ (P < 0.05, Figure 1C, D) and increased lipid ROS levels (P < 0.05, Figure 1E, F). Intervention with 20 μmol of Erastin showed that Erastin in conjunction with SP further increased Acsl4 and decreased GPX4 protein expression (P < 0.05, Figure1G, H).

Figure 1. Sodium palmitate induces ferroptosis in MIN6 cells. (A) Protein blotting was employed to assess the expression levels of key ferroptosis markers, including Acsl4, FSP1, FE, and GPX4, within the cellular milieu. (B) The study involved the quantitative assessment of key ferroptosis markers, namely Acsl4, FSP1, FE, and GPX4, within MIN6 pancreatic beta cells. (C) Measurement of Fe2+ content in MIN6 cells using FerroOrange (Scale bar: 25 µm). (D) Quantitative analysis of Fe2+ in (C). (E) Detection of cellular lipid ROS by BODIPY 581/591 C11 staining (Scale bar: 50 μm). (F) Quantitative analysis of lipid ROS in (E). (G) Expression of autophagy protein P62 and LC3 in MIN6 cells under SP combined with Erastin intervention. (H) Quantitative analysis of autophagy protein P62 and LC3. Data are expressed as mean ± standard deviation. Three independent experiments. *P < 0.05, **P < 0.01, ***P < 0.001 (compared to control). #P < 0.05 (compared with the SP group).
-
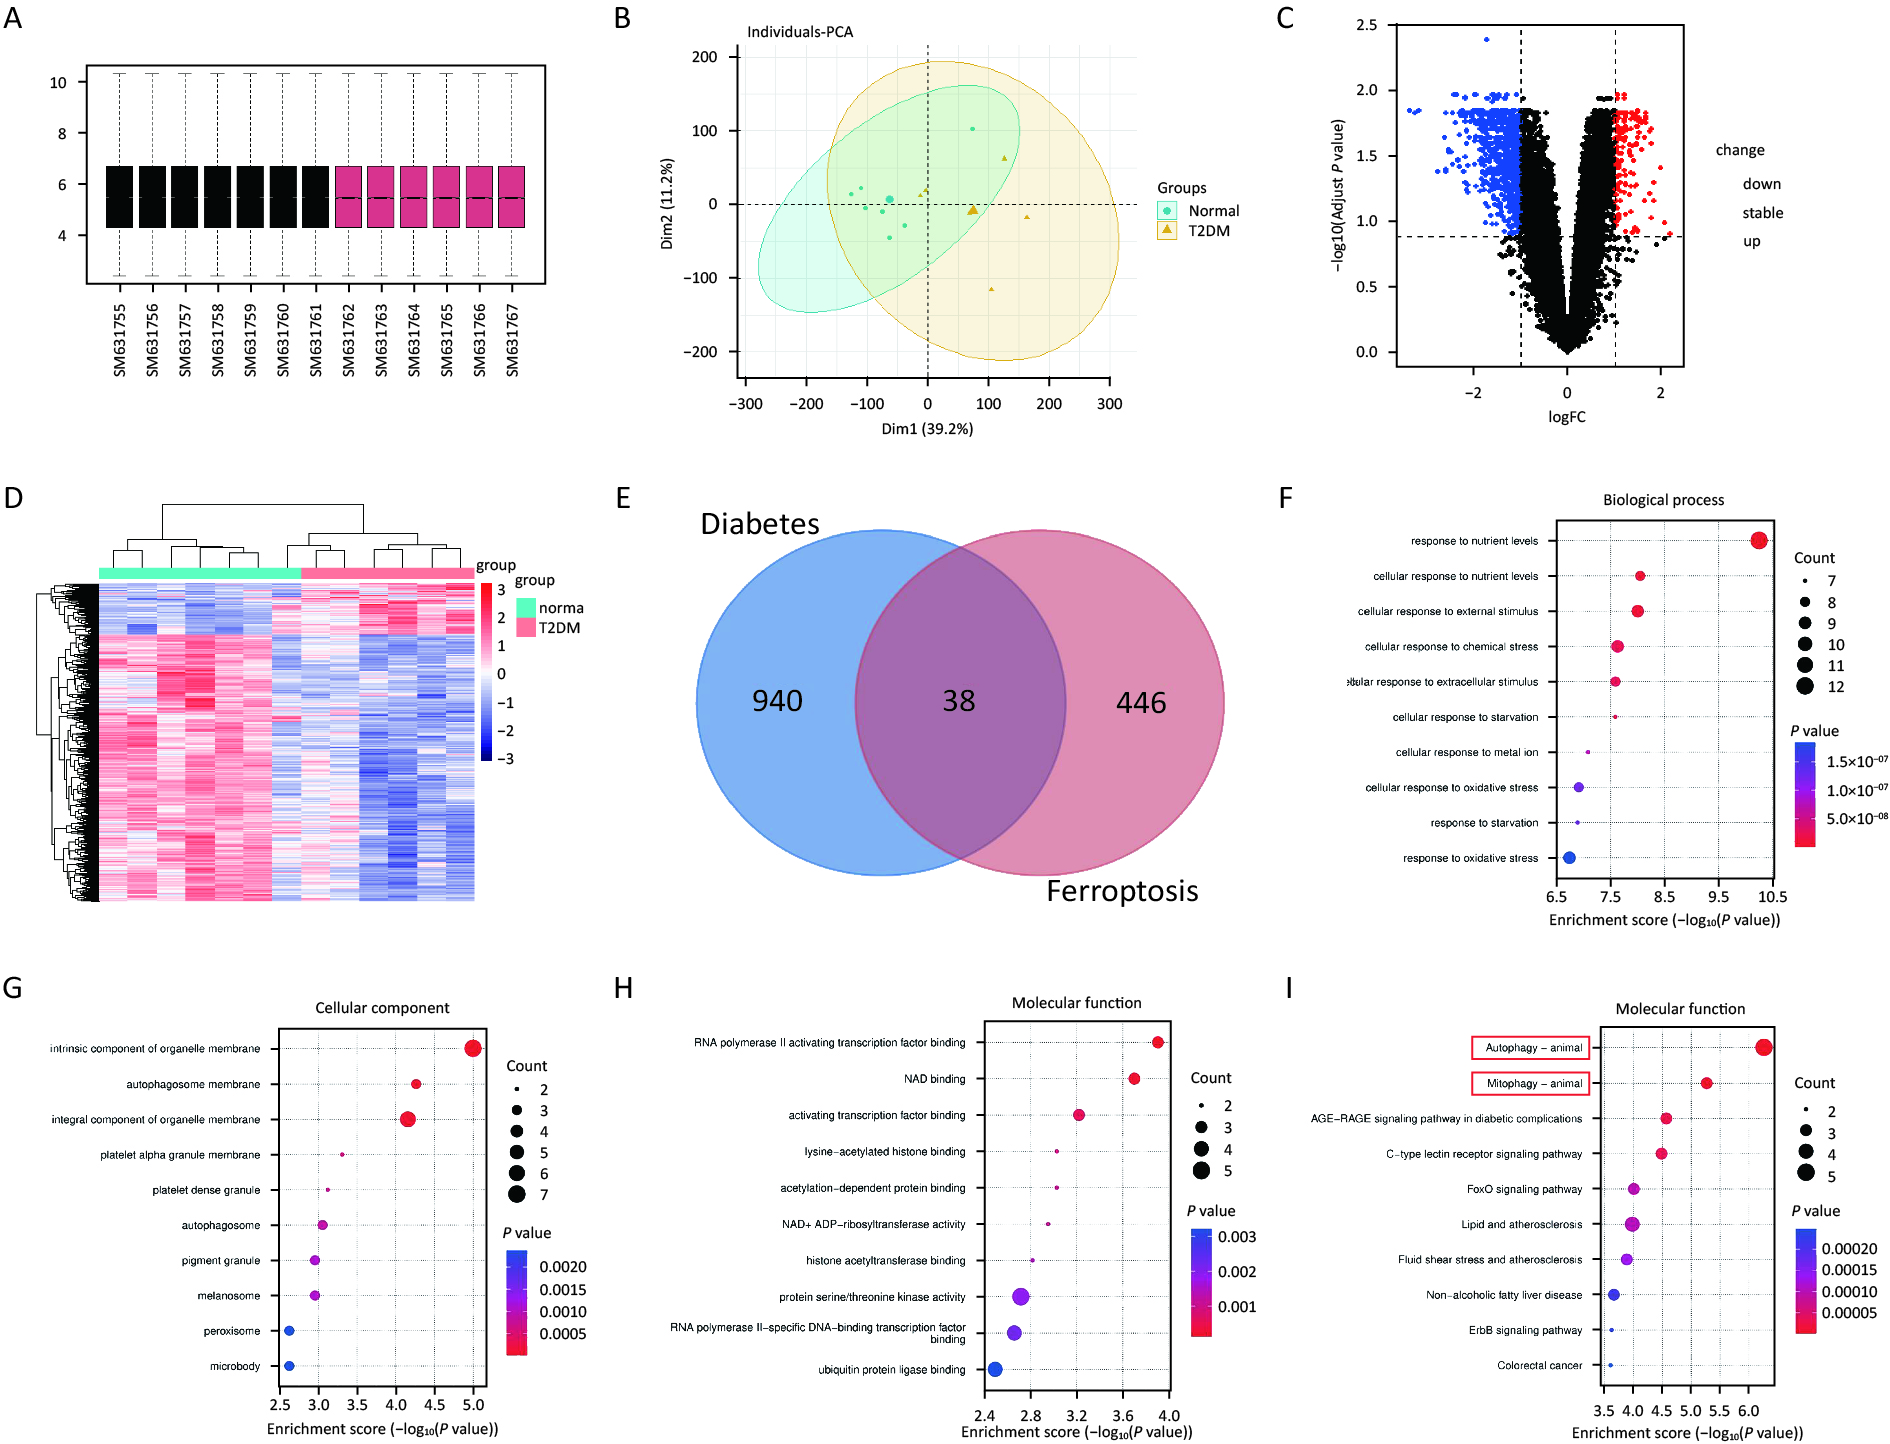
Normalization of the GSE25724 dataset using R software revealed 978 differential genes (Figure 2A, B), including 158 upregulated genes and 820 downregulated genes. Heatmaps and volcano plots are illustrated in Figure 2C, D. Venn diagrams of GSE25724 and ferroptosis-related genes identified 38 common differential genes (Figure 2E), with 13 upregulated and 25 downregulated genes. The results of GO and KEGG enrichment analyses of the standard differential genes using the ClusterProfiler package in R software are as follows: GO-BP was mainly enriched in the cellular response to nutrient levels and the cellular response to external stimulus (Figure 2F). GO-CC was enriched primarily on the intrinsic components of organelle membrane as well as autophagosome membrane (Figure 2G). GO-MF was mainly enriched in RNA polymerase ll activation transcription factor binding and NAD binding (Figure 2H). On the other hand, the KEGG signaling pathways were enriched and analyzed in 10 tracks (Figure 2I). The differential genes were primarily involved in Autophagy-animal, Mitophagy-animal, AGE-RAGE signaling pathway in diabetic complications, C-type lectin receptor signaling pathway.

Figure 2. Mitophagy plays a vital role in ferroptosis in diabetes. (A) Red boxes represent T2DM samples, black boxes represent standard samples, and the black line indicates the median of each data, whose distribution represents the degree of data standardization. (B) Visualization of GSE25724 principal component analysis. (C) Representation of the volcano plot of DE-mRNAs, including 152 upregulated (Red) and 820 downregulated (Green) genes. (D) Heatmap of DE-mRNAs in T2DM and normal islets. (E) Venn diagram for screening DE-mRNAs associated with ferroptosis. (F–H) Gene ontology (GO) enrichment analysis of BP (F), CC (G), and MF (H) aspects. (I) Kyoto Encyclopedia of Genes and Genomes analysis (KEGG) bubble diagram of 38 ferroptosis-related DE-mRNAs.
-
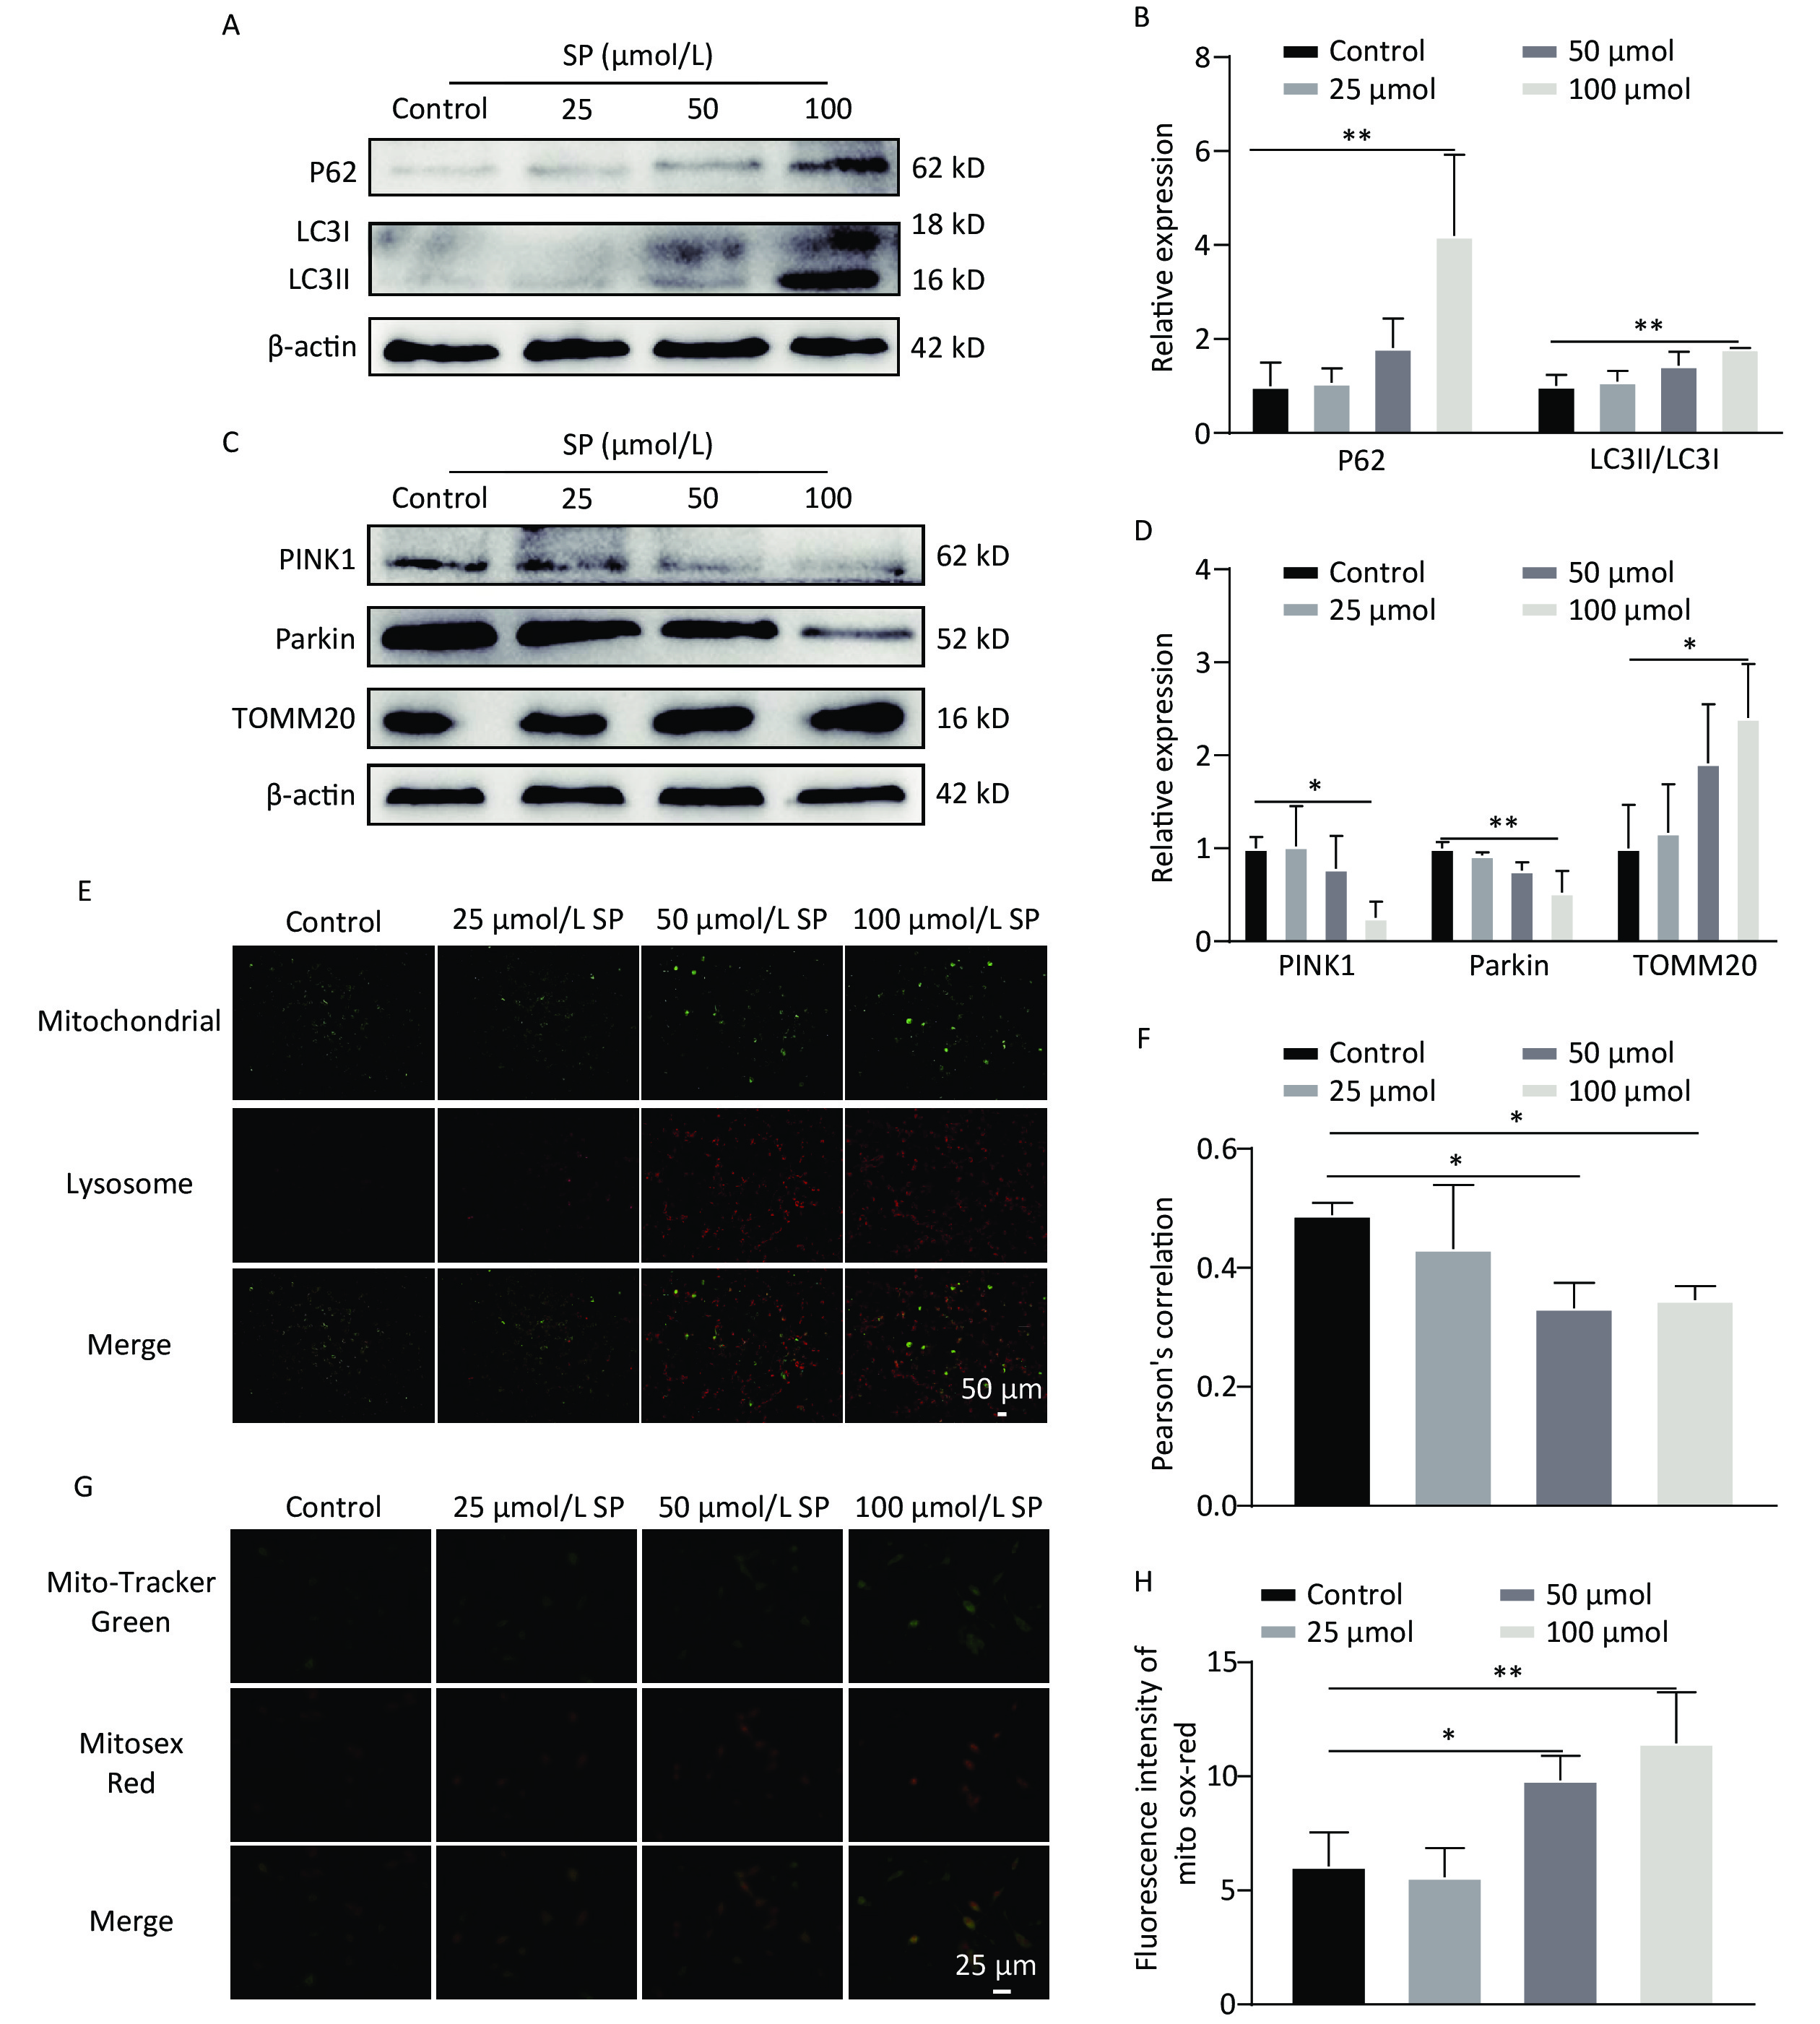
We further found that SP significantly enhanced LC3Ⅱ and P62 expression in MIN6 cells compared with the control (P < 0.05) (Figure 3A, B). Moreover, PINK1/Parkin protein expression was decreased (P < 0.05), and TOMM20 protein expression was increased (P < 0.05) compared to the control (Figure 3C, D). Following SP treatment, MitoTracker (green) and LysoTracker (red) were used to label mitochondria and lysosomes for co-localization analysis (Figure 3E, F). The co-localization of lysosomes and mitochondria formed yellow fluorescence, indicating that mitophagy was activated. We found that the yellow fluorescence gradually decreased with increasing SP concentration compared to the control (P < 0.05). Furthermore, mtROS levels gradually increased with the rising SP concentration compared to the control group (P < 0.05) (Figure 3G, H).

Figure 3. Sodium palmitate inhibits mitophagy and enhances mtROS in MIN6 cells. (A) The cellular expression of autophagy markers P62 and LC3 was detected by protein blotting. (B) Quantitative analysis results of autophagy markers P62 and LC3 in MIN6 cells. (C) The expression levels of mitophagy markers PINK1, Parkin, and TOMM20 in cells were detected by protein blotting. (D) Quantitative analysis of mitophagy markers PINK1, Parkin, and TOMM20 in MIN6 cells. (E) Representative images showing co-localization of Mito Tracker and Lyso Tracker staining. Scale bar: 50 μm. (F) Pearson correlation coefficient between mitochondria and lysosomes. (G) The identification of mtROS was conducted employing the fluorescent probes Mito-Tracker Green and MitoSox Red. (H) Quantitative analysis of the fluorescence intensity of mtROS. Data are expressed as mean ± standard from three independent experiments. *P < 0.05, **P < 0.01 (compared to control).
-
To explore the role of mtROS in SP-induced pancreatic β-cell dysfunction, a mtROS-specific scavenger, Mito-TEMPO, was employed. Mito-TEMPO effectively reduced mtROS in MIN6 cells compared to the SP group (P < 0.05) (Figure 4A–B). The fluorescence co-localization of mitochondria and lysosomes indicated that Mito-TEMPO activates mitophagy (Figure 4C–D) (P < 0.05). Furthermore, Mito-TEMPO significantly increased the expression of PINK1/Parkin and decreased the expression of TOMM20 (P < 0.05) (Figure 4E, F). Mito-TEMPO also effectively reduced P62 and increased LC3II protein expression in MIN6 cells (Figure 4G, H) (P < 0.05).
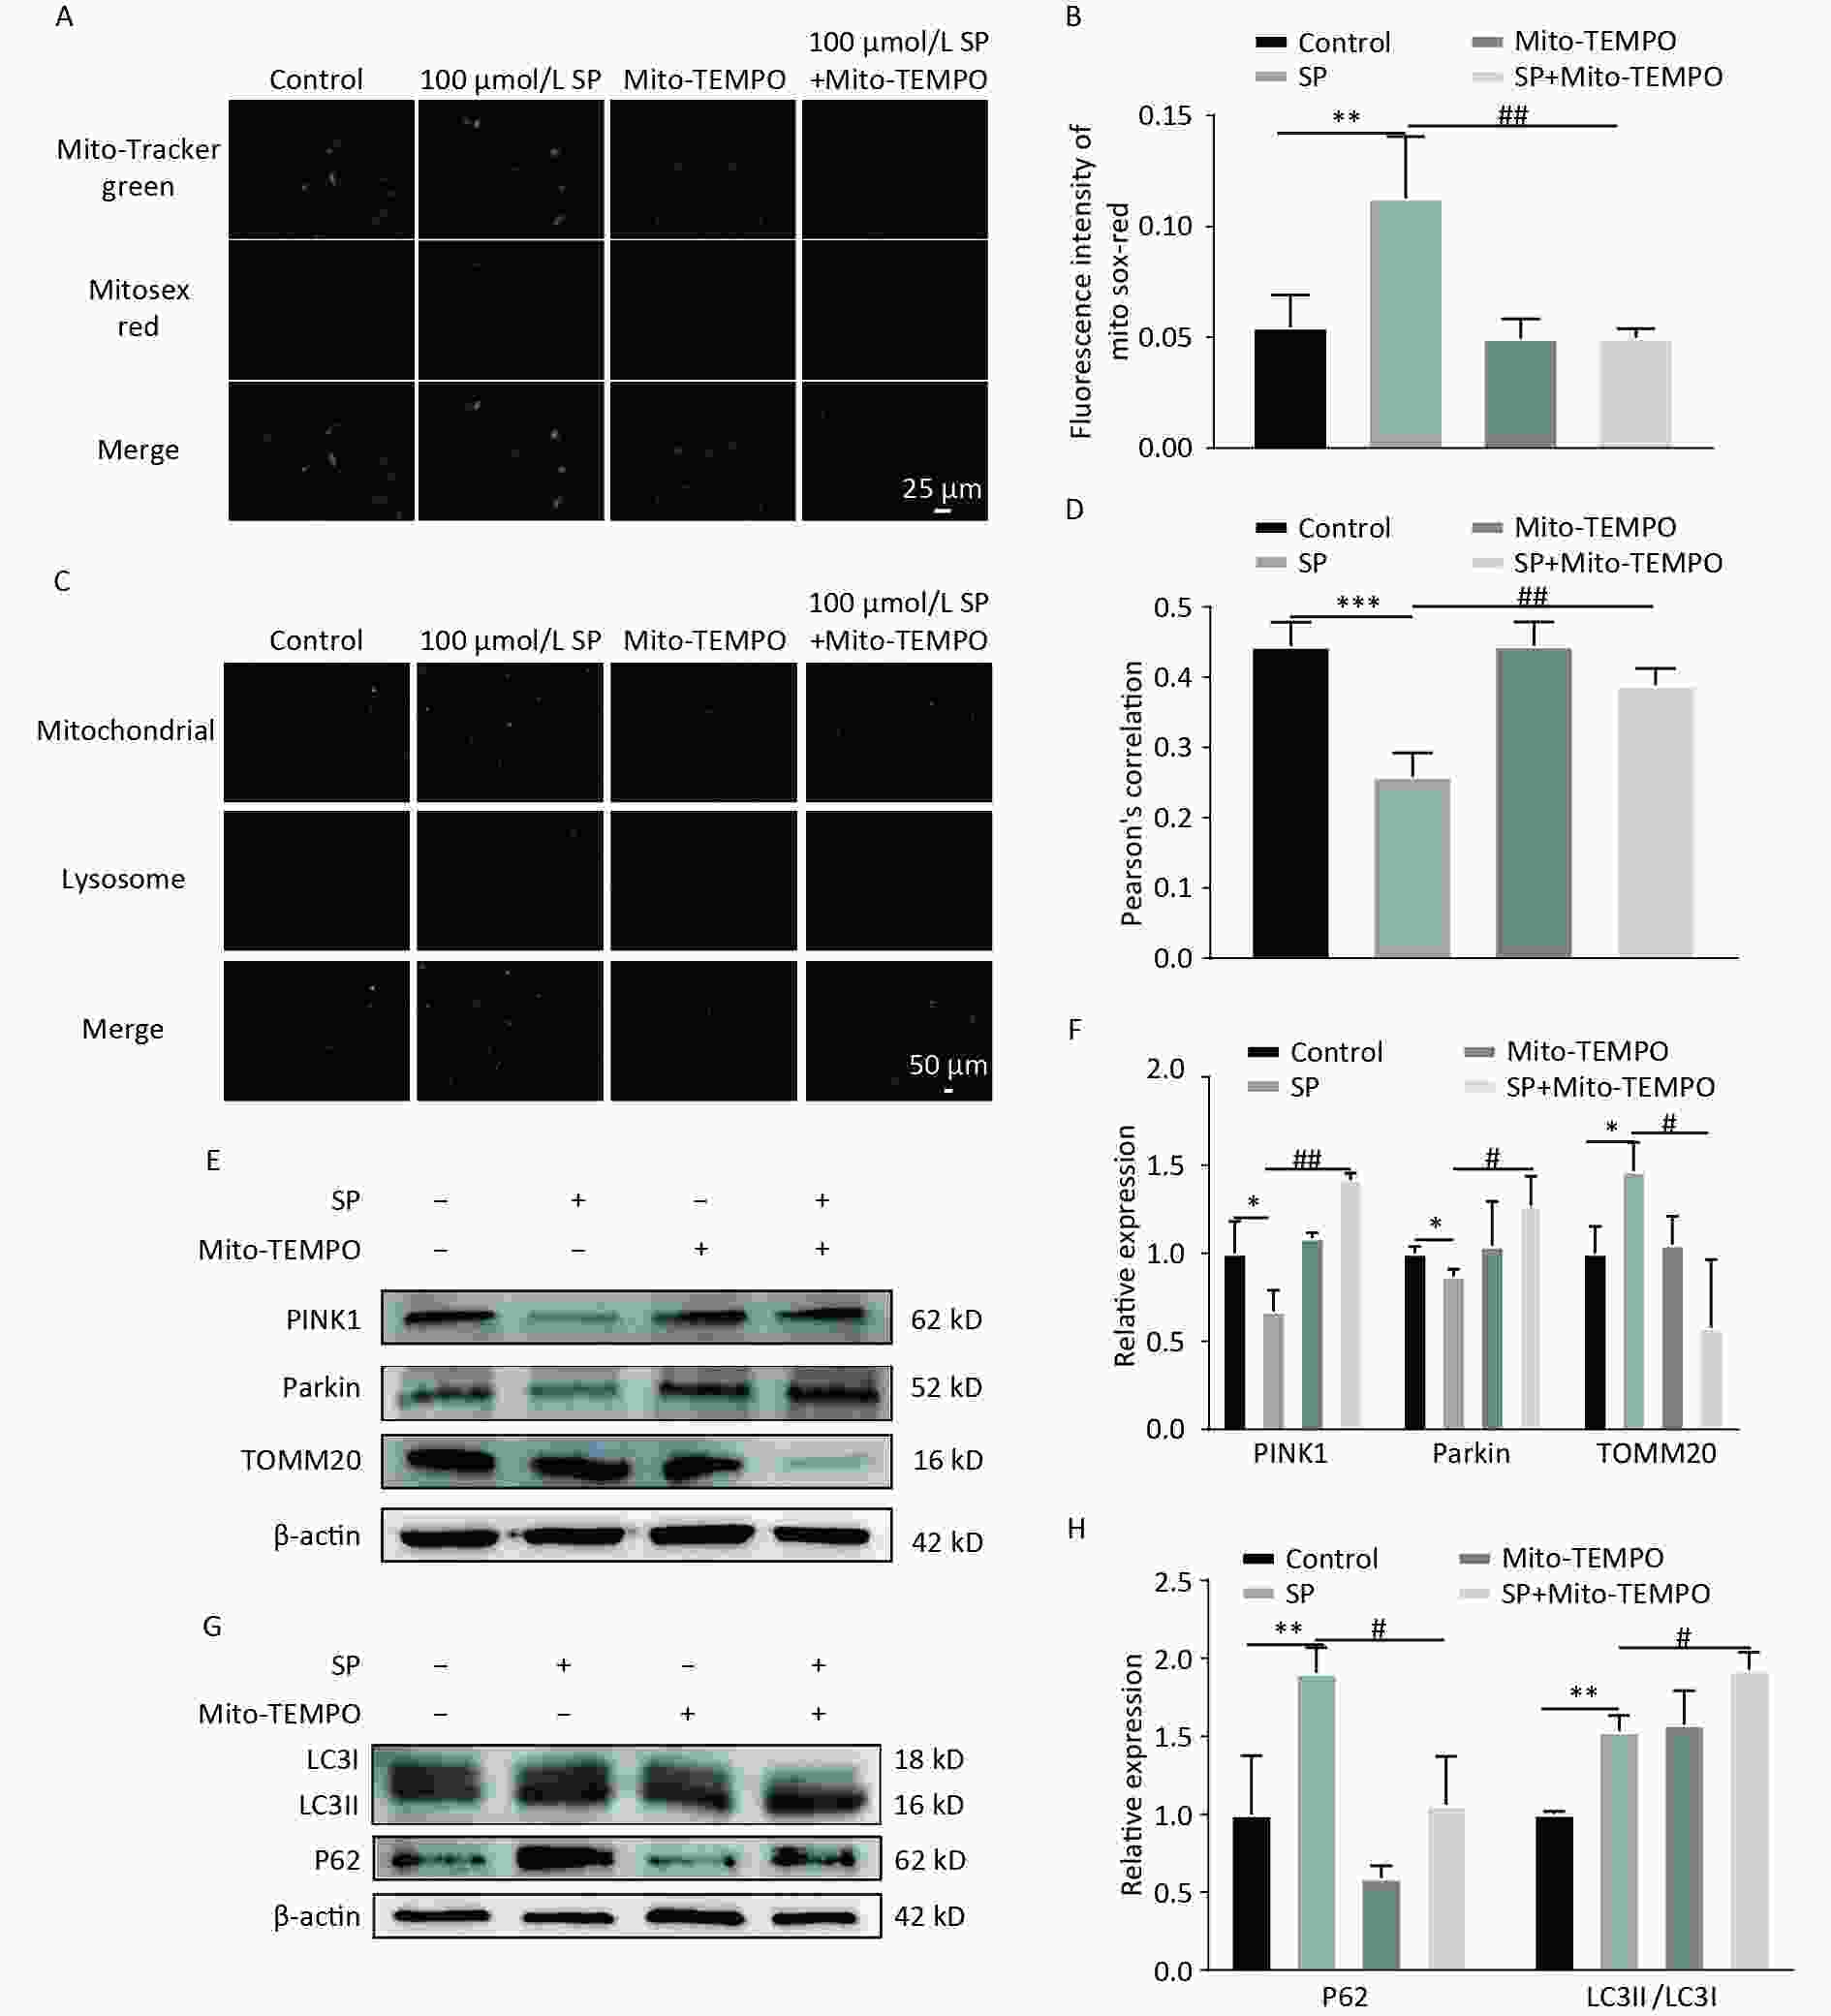
Figure 4. Mito-TEMPO reduces mtROS and activates mitophagy in MIN6 cells. (A) Detection of mtROS under Mito-TEMPO intervention using Mito-Tracker Green and MitoSox Red probes (Scale bar: 25 μm). (B) Quantitative analysis of fluorescence intensity of mtROS under Mito-TEMPO intervention. (C) Co-localization of Mito Tracker and Lyso Tracker staining to detect the level of mitophagy under Mito-TEMPO intervention (Scale bar: 50 μm). (D) Pearson’s correlation coefficient between mitochondria and lysosomes in (C). (E) Expression of mitophagy-related proteins PINK1, Parkin, and TOMM20 in MIN6 cells under SP combined with Mito-TEMPO intervention. (F) Quantitative analysis of mitophagy markers PINK1, Parkin, and TOMM20 in MIN6 cells. (G) Expression of autophagy protein P62 and LC3 in MIN6 cells under SP combined with Mito-TEMPO intervention. (H) Quantitative analysis of autophagy protein P62 and LC3. Data are expressed as mean ± standard from three independent experiments. *P < 0.05, **P < 0.01 ,***P < 0.001 (compared with the control group). #P < 0.05, ##P < 0.01 (compared with the SP group).
-
Further investigation of the impact of Mito-TEMPO on ferroptosis in MIN6 cells revealed that Mito-TEMPO could significantly increase GPX4 and FSP1 levels (P < 0.05) while decreasing the protein expression of FE and Acsl4 (P < 0.05) (Figure 5A, B). Lipid ROS levels were significantly reduced with Mito-TEMPO and SP co-treatment (Figure 5C, D) (P < 0.05), along with a significant decrease in the Fe2+ content (Figure 5E, F) (P < 0.05).

Figure 5. Mito-TEMPO reduces ferroptosis in MIN6 cells. (A) Expression levels of ferroptosis-related proteins ACSL, GPX4, FSP1, and FE in MIN6 cells after SP combined with Mito-TEMPO treatment. (B) Quantitative analysis of ferroptosis-related proteins Acsl4, FSP1, FE, and GPX4 in MIN6 cells. (C) Detection of cellular lipid ROS by BODIPY 581/591 C11 staining after Mito-TEMPO intervention (Scale bar: 50 μm). (D) Quantitative analysis of lipid ROS in (C). (E) Measurement of Fe2+ content in MIN6 cells using FerroOrange after Mito-TEMPO intervention (Scale bar: 25 µm). (F) Results of quantitative analysis of Fe2+ in (E). Data are expressed as mean ± standard from three independent experiments. *P < 0.05, **P < 0.01 (compared with the control group). #P < 0.05, ##P < 0.01 (compared with the SP group).
-
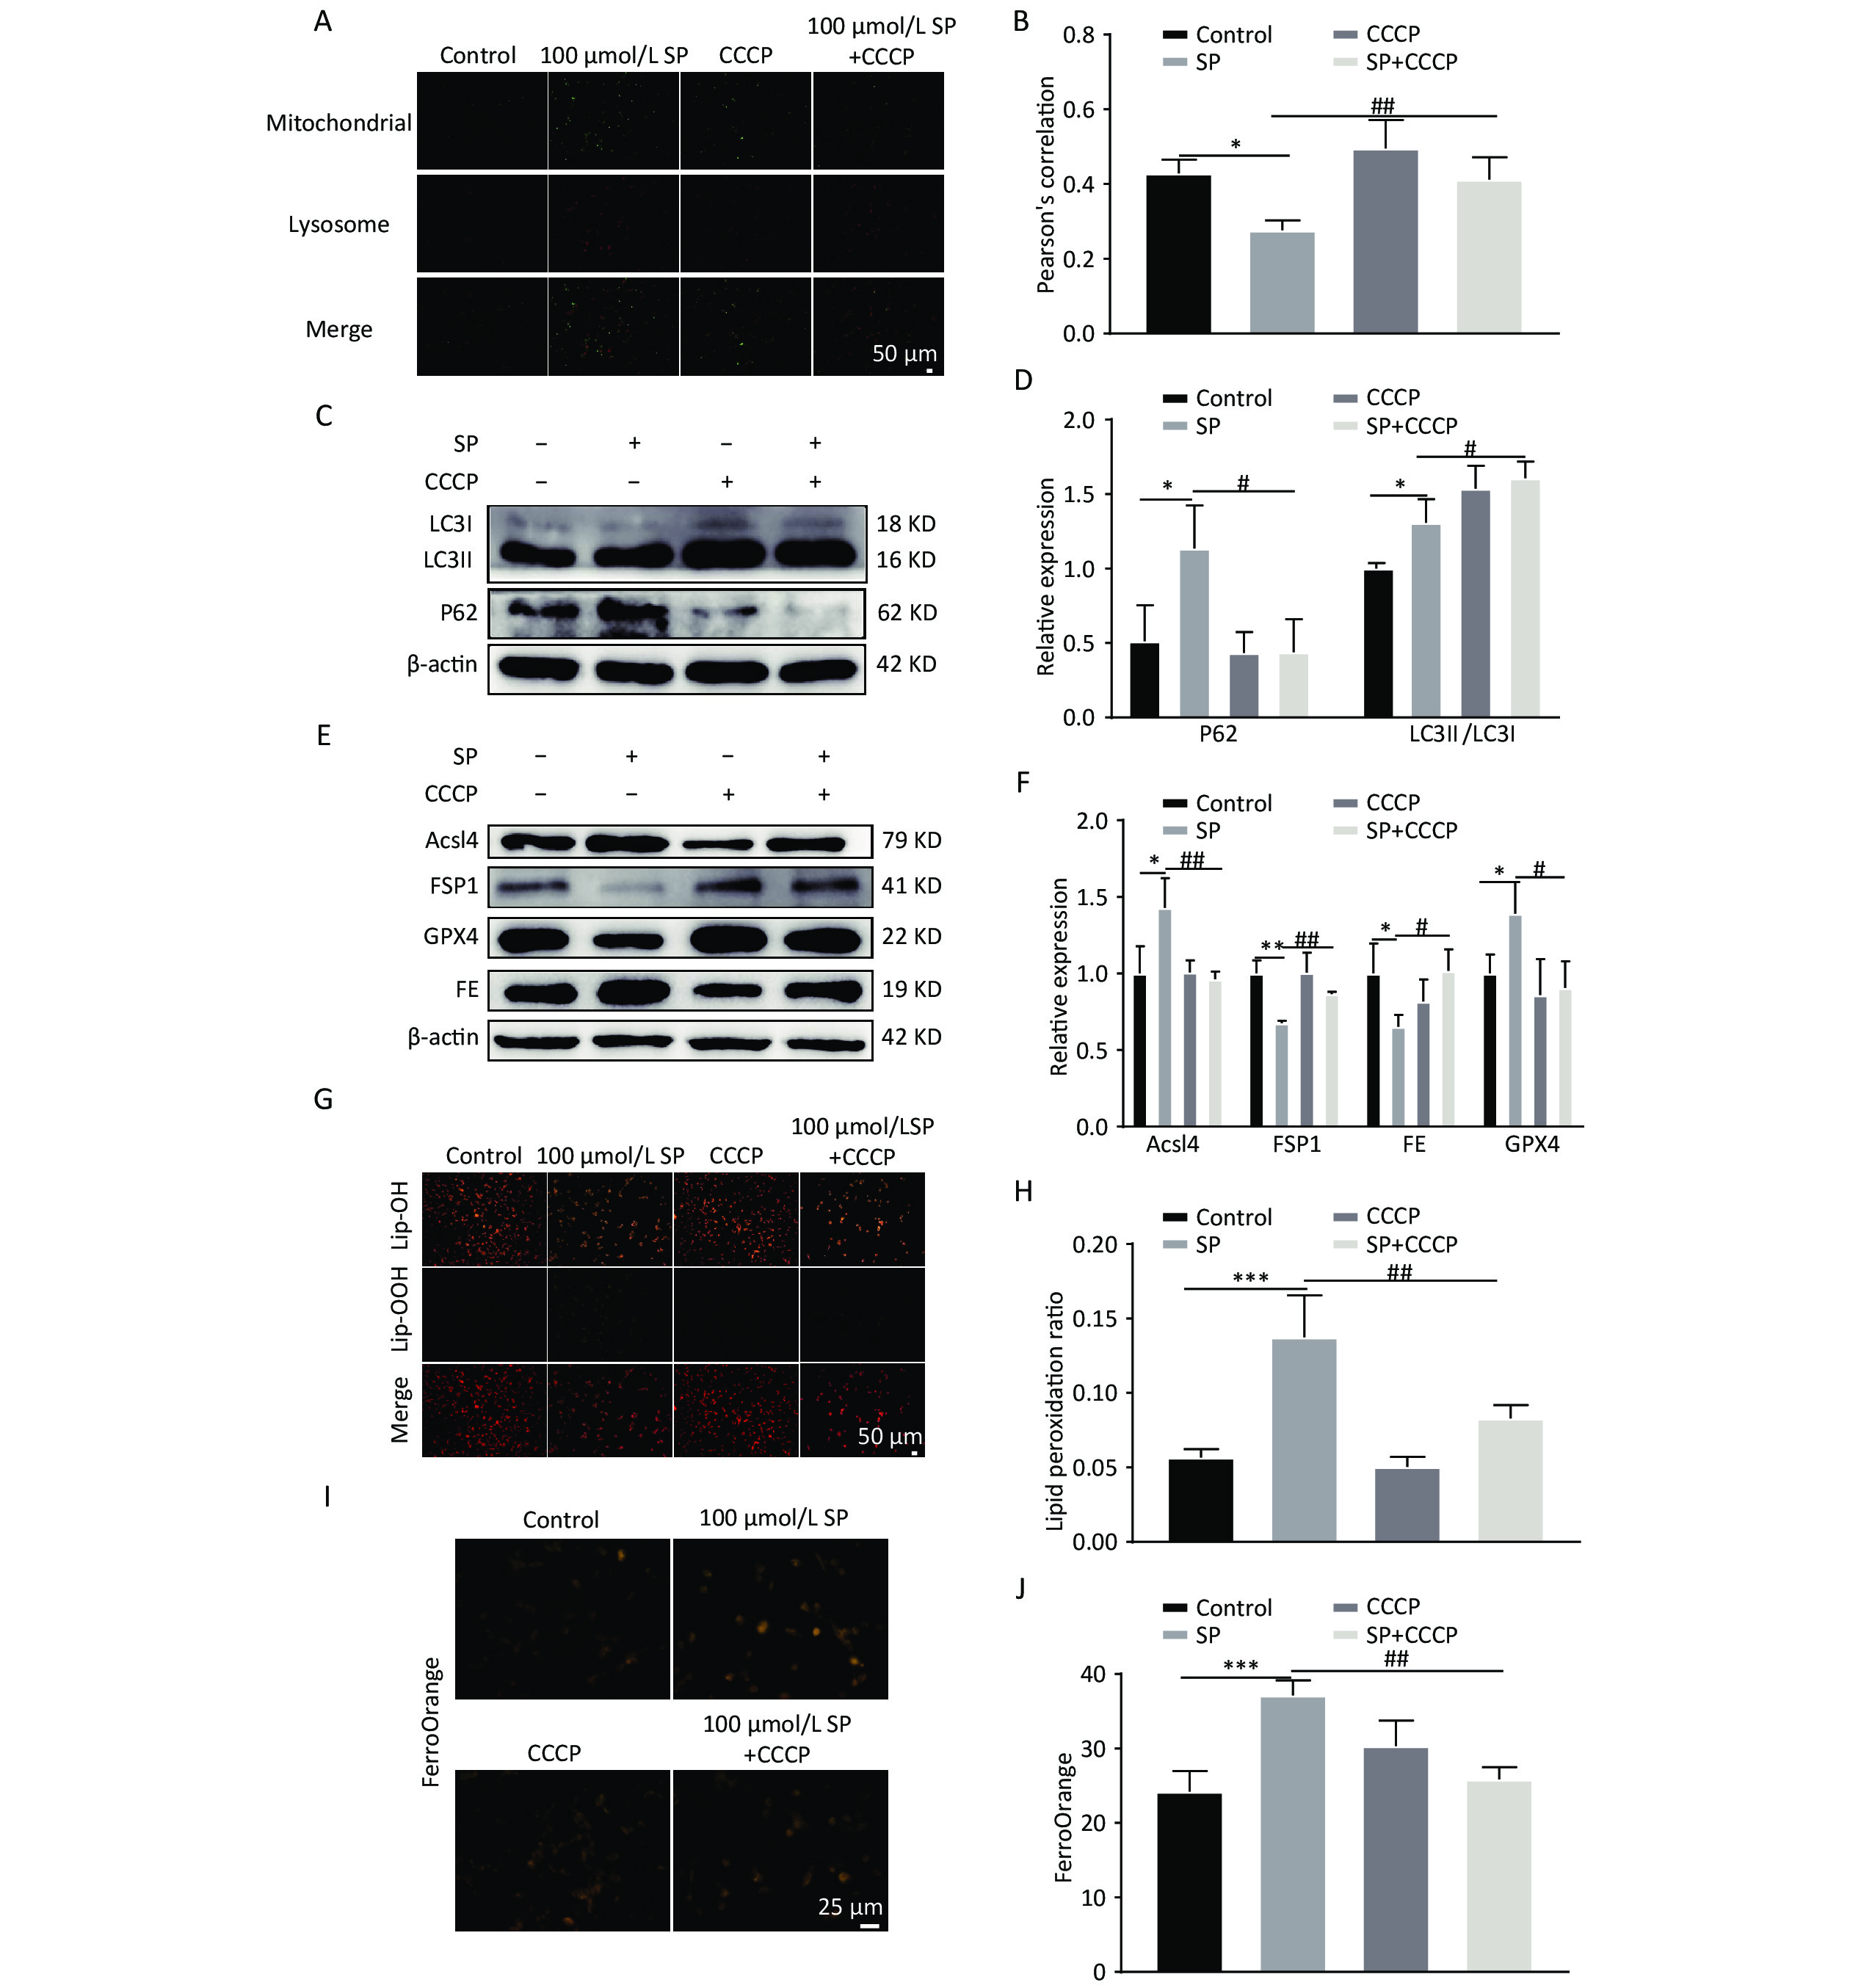
To elucidate the mechanism by which Mito-TEMPO protects MIN6 cells against ferroptosis injury, we pretreated MIN6 cells exposed to SP using the mitophagy-specific agonist CCCP. CCCP intervention increased the co-localization of mitochondria and lysosomes (Yellow fluorescence in Figure A, B) (P < 0.05). Furthermore, co-treatment of CCCP and SP significantly reduced P62 and increased the expression of LC3II protein. (P < 0.05) (Figure 6C, D), increased GPX4 and FSP1 expression (P < 0.05), and decreased the protein expression of FE and Acsl4 (P < 0.05) (Figure 6E, F). The intracellular levels of lipid reactive oxygen species decreased with the intervention of CCCP (Figure 6G, H, P < 0.05). Cellular Fe2+ content was also significantly reduced with CCCP intervention (Figure 6I, J, P < 0.05).

Figure 6. CCCP reduces ferroptosis in MIN6 cells. (A) Co-localization analysis of Mito Tracker and Lyso Tracker stainings to detect the level of mitophagy under CCCP intervention (Scale bar: 50 μm). (B) Quantitative analysis of fluorescence intensity in (A). (C) Expression of autophagy protein P62 and LC3 in MIN6 cells under SP combined with CCCP intervention. (D) Quantitative analysis of autophagy protein P62 and LC3. (E) Ferroptosis-related proteins Acsl4, GPX4, FE, and FSP1 were expressed in MIN6 cells after SP combined with CCCP treatment. (F) Quantitative analysis of ferroptosis-related proteins Acsl4, GPX4, FE, and FSP1 in MIN6 cells. (G) Detection of cytosolic lipid ROS by BODIPY 581/591 C11 staining after CCCP intervention (Scale bar: 50 μm). (H) Quantitative analysis of lipid ROS in (G). (I) Measurement of Fe2+ content in MIN6 cells using FerroOrange after CCCP intervention (Scale bar: 25 µm). (J) Results of quantitative analysis of Fe2+ in (I). Data are expressed as mean ± standard from three independent experiments. *P < 0.05, **P < 0.01, ***P < 0.001 (compared with the control group). #P < 0.05, ##P < 0.01 (compared with the SP group).
-
Our findings demonstrated that SP induced mtROS overproduction and mitophagy inhibition, leading to ferroptosis in pancreatic β-cells. Mito-TEMPO, a mitochondria-targeted antioxidant, proved effective in mitigating mtROS production and activating the PINK1/Parkin mitophagy pathway. This dual action reduced intracellular iron overload, diminished lipid ROS production, and protection against ferroptosis in MIN6 cells.
Studies have established T2DM as a chronic metabolic disease characterized by insulin resistance and pancreatic β-cell dysfunction[24]. Palmitic acid (PA), which accounts for 20%–30% of the total fatty acids in the body[25], is one of the significant factors inducing pancreatic β-cell death. Prolonged exposure to elevated free fatty acids with hyperglycemia activates multiple emergency pathways that impair pancreatic β-cell viability and function[26]. The emerging association between pancreatic β-cell failure and ferroptosis has garnered attention in the context of T2DM[10].
Ferroptosis has been implicated in the pathogenesis of T2DM, characterized by iron accumulation and lipid peroxidation within pancreatic β-cells[10]. Epidemiological evidence shows individuals with higher dietary iron intake have a higher risk of T2DM[27]. Although studies have highlighted the significance of iron deposition for the onset of T2DM, the precise mechanism remains incompletely understood. Iron functions as a pro-oxidant in the process, forming hydroxyl radicals, while elevated oxidative stress levels play a pivotal role in initiating ferroptosis[28]. Pancreatic β-cells exhibit diminished levels of antioxidant enzymes, specifically glutathione peroxidase (GPX), making them susceptible to oxidative stress and lipid peroxidation and prone to ferroptosis[29]. Reduced GPX4 levels, a crucial ferroptosis inhibitor, have been identified as a predictive factor for diabetic conditions like diabetic kidney disease (DKD) and diabetic erectile dysfunction (DMED)[30]. Another crucial iron-suppressing protein, FSP1, operates independently of GPX4 and possesses antioxidant and lipid radical-trapping abilities. Therefore, it could play a pivotal role in countering oxidative stress and ferroptosis triggered by diabetogenic factors like elevated glucose levels, hydrogen peroxide, and other stimuli associated with diabetes[31]. However, studies in this research area are still limited.
Our findings revealed that SP decreased the expression of the ferroptosis inhibitor GPX4 in MIN6 cells. This aligns with studies by Nian Wang et al., illustrating that palmitic acid could decrease GPX4 in cardiomyocytes while reducing the intracellular antioxidant level[32]. In addition to the glutathione protective mechanism, SP effectively reduced FSP1 expression, eliminating another defense mechanism of intracellular ferroptosis. Furthermore, SP increased the levels of Fe2+ total ferritin in MIN6 cells, exacerbating ferroptosis by generating excess lipid ROS through the Fenton reaction. Hao Kuang et al. found that palmitic acid-induced excess intracellular iron production and iron chelators (DFO) prevented this damage in colorectal cancer cells[33], further suggesting that the SP-induced cell death in MIN6 cells was accompanied by ferroptosis.
While ferroptosis is closely associated with pancreatic β-cell failure, the involvement of other mechanisms remains elusive. With the development of sequencing technology, expression profiling data for diabetes can be obtained from public databases, and an in-depth analysis of the datasets can be conducted unbiasedly with the help of bioinformatics. The intersection of diabetic differential genes with those associated with ferroptosis yielded 38 differential genes. Subsequent enrichment analysis revealed a potential correlation between diabetic ferroptosis and mitophagy. To validate our results, we examined the expression of mitophagy in the SP-induced ferroptosis model of MIN6 cells.
Mitochondria are the primary site of carbohydrate metabolism and fatty acid β-oxidation. Excess fatty acids increase the formation of lipid peroxides in the mitochondrial matrix, ultimately leading to mitochondrial damage[34]. Mitochondrial damage is a consistent feature in patients with T2DM[35], potentially leading to increased ROS production as a trigger for ferroptosis[36]. Our study revealed that SP leads to overproduction of mtROS. TOMM20, located on the outer surface membrane of mitochondria, facilitates the recognition and translocation of mitochondrial proteins for cytoplasmic synthesis[17]. Under SP treatment, TOMM20 protein expression is upregulated, suggesting a rise in mitochondria, potentially attributed to the impaired clearance of damaged mitochondria. The PINK1/Parkin-mediated mitophagy pathway is the most common signaling pathway for selective degradation of damaged mitochondria. Mitochondrial depolarization prevents PINK1 from entering the inner membrane, leading to PINK1 aggregation on the mitochondrial surface. This aggregation recruits Parkin from the cytosol to damaged mitochondria, where Parkin ubiquitinates various substrates, facilitating their autophagic removal[37,38]. Mitophagy is essential for preserving mitochondrial integrity in the presence of mitochondrial damage[39]. Our study showed that SP treatment decreased the expression of PINK1 and Parkin proteins, indicative of mitophagy inhibition. Additionally, the upregulation of autophagy proteins P62 and LC3II, coupled with disrupted autophagic flow, accentuated the impairment of damaged mitochondria clearance, exacerbating pancreatic β-cell dysfunction. This observation is consistent with the findings by Du et al., demonstrating mitophagy blockage in rat INS-1 cells exposed to high glucose and fat[40]. Consequently, our results suggest that SP inhibits mitophagy in MIN6 cells, aggravating the occurrence of mitochondrial damage.
Mito-TEMPO, characterized as a superoxide dismutase mimetic that targets mitochondria, has been shown to prevent pancreatic β-cell death by attenuating mitochondrial dysfunction[17]. In this study, Mito-TEMPO effectively reduced mtROS levels in MIN6 cells while increasing PINK1/Parkin protein expression and activating mitophagy. The reduction in TOMM20 protein expression indicated efficient clearance of damaged mitochondria—a phenomenon in line with findings by Seul-Gi Yang[22]. Mito-TEMPO not only reduced intracellular Fe2+ and lipid peroxidation levels but also activated two intracellular ferroptosis defense mechanisms in MIN6 cells, the FSP1 pathway and the GPX4 pathway, which played a protective role against ferroptosis. Collectively, our results support the hypothesis that SP induces ferroptosis in MIN6 cells by inhibiting mitophagy and subsequently causing overproduction of mtROS.
To explore the effect of mitophagy on ferroptosis in pancreatic β-cells, we used the mitophagy agonist CCCP, oxidative phosphorylation (OXPHOS) uncoupler. CCCP induces PINK1 activation, promoting Parkin phosphorylation at the Ser65 site. We chose 1 μmol of CCCP for our intervention and could observe improvements in both Fe2+ and lipid peroxidation levels in pancreatic β-cells after mitophagy activation. Our findings are consistent with Qisheng Lin’s research, indicating that PINK1/Parkin-mediated mitophagy can effectively alleviate cellular ferroptosis[41]. However, the regulation of mitophagy for ferroptosis remains controversial. Xindong Wang et al. found that mitochondrial ferritin deficiency could activate mitophagy to promote ferroptosis in type 2 diabetic osteoporosis[42]. Gilles Rademaker et al. found that inhibition of the Myoferlin protein promoted mitophagy and triggered ferroptosis[43]. The conflicting outcomes could be attributed to using different cell types. Palmitic acid has been shown to activate mitophagy in the podocytes, while in rat L6 skeletal muscle cells, it inhibits mitophagy[44,45]. The intricacies of these mechanisms warrant further experimental validation.
Despite our valuable insights, this study presents limitations. Experiments did not validate the critical role of mitophagy in ferroptosis in pancreatic β-cells. Additionally, the use of PINK1-specific siRNA did not elucidate PINK1’s precise involvement in regulating ferroptosis in vitro. Subsequent experiments will incorporate in vivo validation using PINK1-/- specific mice.
In summary, our findings demonstrated that SP can lead to ferroptosis in pancreatic β-cells. Bioinformatics tools revealed the crucial role of mitophagy in diabetic ferroptosis. Furthermore, SP inhibited the mitophagy process in pancreatic β-cells. However, the Mito-TEMPO application effectively attenuated mitochondrial damage and promoted mitophagy by activating the PINK1/Parkin pathway, thereby reducing the occurrence of ferroptosis in pancreatic β-cells. Our findings contribute to a deeper understanding of how Mito-TEMPO protects pancreatic β-cells from ferroptosis by regulating mitophagy. This finding provides a theoretical basis for elucidating the role of PINK1/Parkin-mediated mitophagy promoted by Mito-TEMPO in the mechanism of ferroptosis in pancreatic β-cells.
-
Baolei Chang: Investigation, formal analysis, methodology, and writing – original draft. Yanyu Su, Tingting Li and Hao Wang: Writing – review & editing. Yanxia Zheng and Ruirui Yang: Visualization and investigation. Heng Lu: Visualization. Yusong Ding: Writing – review & editing, resources, conceptualization, and funding acquisition.
Funds:
This study was supported by a grant from the Science and Technology Tackling Programme Project of Xinjiang Production and Construction Corps (2021AB030).
COMPETING INTEREST
The authors declare that they have no known competing financial interests or personal relationships that could have appeared to influence the work reported in this paper.
 Quick Links
 DownLoad: