
-
Non-alcoholic fatty liver disease (NAFLD) is a global health concern, particularly among children with obesity[1]. The prevalence of NAFLD in adults ranges from 33.71% to 42.49%[2]. Over the past two decades, the prevalence of NAFLD in children with obesity has increased to approximately 36.1% globally, similar to levels observed in adults[3]. A recent meta-analysis showed that the worldwide pooled prevalence of pediatric NAFLD was 13% in the general population and 47% in the obese population. In the general population, the prevalence of NAFLD was 15% in males and 10% in females. In the obese population, it was 54% in males and 39% in females. The prevalence of NAFLD was 15% in Asian studies and 11% in non-Asian studies[4]. Chronic liver injury is a direct consequence of NAFLD, affecting various systems in the body and significantly increasing the risk of metabolic syndrome, cardiovascular disease, type 2 diabetes, chronic kidney disease, and other disorders[5-7]. Despite its profound health implications, the molecular mechanisms underlying NAFLD pathology remain unclear.
Genetic predisposition is a key factor in the development of NAFLD[8]. Accumulating evidence suggests that the pathogenesis of NAFLD is influenced by genetic variations. Numerous candidate gene-association studies have identified genetic variants associated with NAFLD, including MTTP rs1800591[9,10], ENPP1 rs1044498[11,12], ADIPOQ rs266729[13], rs2241766[14], SOD2 rs4880[15,16], and TNF-238 G/A[17,18]. However, these studies often exhibited substantial heterogeneity, leading to inconsistent conclusions for the same loci. For example, in an association study of MTTP rs1800591 G/T polymorphism and NAFLD, Gouda et al.[9] showed that the variation in this locus significantly increased the risk of NAFLD in the Egyptian population, while Zusi et al.[10] did not find a statistically significant association in the study of children with obesity in Italy and Peng et al.[19] also showed no significant association in Chinese adults.
Genome-wide association studies is based on the single nucleotide polymorphism (SNP) chips, which is mainly based on the “common disease-common variant paradigm,” focusing on the genetic variation of minor allele frequency (MAF) > 0.05 and unable to explore low frequency/rare variation (MAF < 0.05). This results in a large degree of “missing heritability,”[20] which can be resolved by whole exome sequencing (WES). Candidate gene association studies that rely on published articles have limitations in comprehensively exploring genes. In contrast, WES, as an exploratory approach, overcomes these limitations by providing a broader exploration of genetic variations. Although a few studies have used WES to identify genes related to NAFLD, such as PNPLA3, TM6SF2[21], ATG7[22], PEMT[23], and HSD17B13[24], the findings are often contradictory and lack validation in independent studies. Additionally, these studies have frequently focused on a limited number of candidate gene polymorphisms and there is a lack of WES data for the Chinese population.
Considering the lack of a biological basis for genetic models and the unclear genetic patterns of each locus, this study analyzed four traditional genetic models. The co-dominant model (BA vs. AA and BB vs. AA) is the most commonly used genetic model in the association study of gene polymorphisms and disease if the alleles of A and B are represented by A and B, respectively, where A is the wild type and B is the mutant type. In the dominant model (AB + BB vs. AA), carrying one or two mutant alleles can affect disease occurrence. In the recessive model (BB vs. AA + AB), carrying two mutant alleles can affect the occurrence of the disease, whereas in the additive model (AA vs. AB vs. BB), each mutant allele has an effect on the occurrence of the disease and the risk of disease in the homozygous mutant genotype is two times higher than that in the heterozygous genotype[25].
Therefore, we sought to investigate the spectrum of genetic variant loads in the pathogenesis of obesity in children with NAFLD. First, we conducted an exploratory case-control study to identify the genes associated with NAFLD using WES. Subsequently, a case-control validation study was conducted to confirm the identified candidate genes. This study provides new clues and targets for elucidating the genetic mechanisms underlying NAFLD in children with obesity.
-
We conducted a two-step case-control study in children with obesity. We first performed an exploratory case-control study, with a sample of 93 children with obesity aged 6–18 years who attended Hunan Children’s Hospital (Changsha, China) between May and December 2019 for the management of obesity. Subsequently, we performed a validation case-control study between January 2020 and September 2021. The study protocol was approved by the Ethics Committee of the Xiangya School of Public Health in accordance with the principles of the Declaration of Helsinki (XYGW201804).
The inclusion criteria for the case group were as follows: children with obesity who were first diagnosed with NAFLD, simple fatty liver, or steatohepatitis; voluntarily participated in this study; and provided written informed consent. The diagnostic criteria of NAFLD in children with obesity refer to the, “Expert consensus on the diagnosis and treatment of NAFLD in children.” Those with any two of the following criteria can be diagnosed as children with NAFLD and obesity: (1) diffuse enhancement of near-field echo in liver ultrasound images; (2) the structure of intrahepatic ducts in liver ultrasound images was not clear; or (3) the far-field echo in liver ultrasound images was weakened. The exclusion criteria were as follows: (1) no drinking history, including any form of alcohol intake within 1 year; (2) no other specific diseases that can lead to fatty liver; (3) no fatty liver diagnosis due to drug consumption; (4) incomplete clinical data; (5) insufficient sample retention; and (6) comorbidities, such as infectious diseases, allergic diseases, and type 2 diabetes.
The inclusion criteria for the control group were as follows: (1) simple obesity; (2) normal B-ultrasound image of the liver; (3) and normal liver function. Exclusion criteria were as follows: (1) no drinking history, including any form of alcohol intake within 1 year; (2) no blood samples provided; (3) incomplete clinical data; (4) insufficient sample retention; and (5) comorbidities, such as infectious diseases, allergic diseases, and type 2 diabetes.
-
NAFLD was diagnosed using abdominal ultrasonography according to the guidelines for the diagnosis and management of NAFLD by the Chinese Society of Hepatology. The diagnosis of NAFLD was required for the following three conditions: (a) no history of alcohol consumption or consumption of < 30 g/d of alcohol equivalent for men and < 20 g/d for women; (b) diffusely enhanced echogenicity in the anterior field of the liver, i.e., bright liver, with stronger echogenicity than that in the kidney, poor visualization of intrahepatic ductal structures, and gradual attenuation of echogenicity in the far field of the liver; (c) no specific liver diseases that can cause fatty liver, such as alcoholic fatty liver, chronic hepatitis C virus infection, autoimmune hepatitis, and hepatomegaly; and specific conditions that cause fatty liver, such as drugs, total parenteral nutrition, inflammatory bowel disease, celiac disease, hypothyroidism, Cushing syndrome, β lipoprotein deficiency, α-1 antitrypsin deficiency, and certain insulin resistance-related syndromes.
-
Demographic data were obtained using structured interviews and questionnaires. Height and weight were measured twice while standing and wearing light clothing, and the average values were used for the analysis. Body mass index (BMI) was calculated as weight divided by height squared.
-
Venous blood (2 mL) was collected from all participants in the early morning fasting state, placed in an EDTA-K2 vacuum anticoagulant tube, and centrifuged at 4 °C and 2012.4 ×g (15 min). The plasma and blood cells were separated. DNA was extracted from white blood cells using QIAGEN's deoxyribonucleic acid extraction kit and stored at -20 °C. A total of 93 samples were sequenced on an Illumina NovaSeq 6000 sequencer using an Agilent SureSelect Human All Exon V6 Kit. The results were stored in FASTQ file format. First, the sequencing quality was evaluated, and samples that met the criteria were subjected to mutation detection and annotation. The effective data were compared to the reference genome (GRCh37/hg19) using the BWA software (version 7.7.8-r455) to obtain the comparison results in BAM format. The results were sorted using SAMtools (version 1.0), and repeat sequences were marked using Sambamba (version 6.6.6). The coverage and depth of the comparison results after repeated labeling were determined. According to the comparison results of the BAM format, SAMtools (version 1.0) was used to identify single nucleotide variants (SNVs) and insertion-deletions (indels), and make statistics and annotations. The number and type distribution of SNVs/indels in different regions of the genome were counted.
-
After the differentially expressed genes were identified in small samples, they were verified using large samples. The blood samples were centrifuged at 2012.4 ×g (15 min). After centrifugation, the supernatant and the lower blood cells were placed in the prelabeled cryovials, and stored in the -80 °C ultra-low temperature refrigerator. The QIAamp DNA Mini Kit (Qiagen, Valencia, CA, USA) was used to extract DNA from peripheral blood cells, according to the manufacturer’s instructions. After DNA extraction, specific primers were designed for each locus using multiplex PCR and high-throughput sequencing technology. Multiplex PCR amplification was carried out in a single tube. Different samples were distinguished using different barcoded primers, and high-throughput sequencing was performed for the amplicons. Different samples were distinguished in the sequencing results using bioinformatics methods, and the mutation information of each locus was obtained to complete SNP typing detection.
-
For the association analysis of common variants, PLINK software(v 1.07) was used to perform an association analysis on the loci that passed the quality control, adjusted for sex, age, and BMI, and calculate the significant P value and association statistic OR value of each locus associated with NAFLD. Common variants that were significantly associated with the test level was set at P<0.001. For low-frequency rare variants, the SKAT-O method was used for gene-based association analysis, focusing on genes with significant differences in harmful variation loads between the case and control groups (P<0.05). This analysis was performed using the SKAT package in R software (v. 4.0.3).
For multiplex PCR and high-throughput sequencing analysis, statistical analysis was performed using SPSS26.0 software. Continuous variables were described as means ± standard deviation (SD) or median (interquartile range). Different comparative analyses were performed using Student's t-test or Mann–Whitney U test for continuous variables, and Pearson's chi-square or Fisher’s exact probability test for categorical variables. Hardy–Weinberg equilibrium (HWE) was used to test whether the samples were from a genetically balanced population. Four traditional models (co-dominant, dominant, recessive, and additive) were used to explore the association between SNPs and NAFLD in children with obesity. MDR software was used to analyze gene-gene interactions.
-
The sociodemographic characteristics and anthropometric indicator distributions of children with obesity in this exploratory and validation case-control study are shown in Table 1. The case and control groups were evenly distributed in terms of sex (P > 0.05), and unevenly distributed in terms of age, height, weight, and BMI (P < 0.05). We also analyzed the baseline features of the participants in the exploratory and validation studies. The results showed that except for BMI, the differences in the other variables were statistically significant (P < 0.05). See in Supplementary Table S1 for details.
Variables Exploratory study Validation study Control group
(n = 31)NAFLD group
(n = 62)t/χ2/Z P−value Control group
(n = 511)NAFLD group
(n = 511)t/χ2/Z P−value Age (year) 10.29 ± 1.72 11.13 ± 2.15 −1.887 0.062 12.00 (10.00–15.00) 13.00 (11.00–15.00) −2.078 0.038 Sex − 1* 0.381 0.537 Male 29 (93.5) 58 (93.5) 356 (69.7) 365 (71.4) Female 2 (6.5) 4 (6.5) 155 (30.3) 146 (28.6) Height (cm) 145.44 ± 10.61 151.20±13.04 −2.133 0.036 157.00 (145.90–166.80) 160.20 (151.40–170.00) −3.553 <0.001 Weight (kg) 55.70 (51.40–65.00) 62.95 (51.65–74.40) −1.520 0.129 67.00 (53.00–77.00) 74.00 (60.70–87.00) −6.666 <0.001 BMI (kg/m2) 27.41 ± 2.20 28.02 ± 3.95 −0.960 0.340 27.01 (25.00–28.30) 28.33 (26.30–30.80) −8.881 <0.001 Note. NAFLD: Non-alcoholic fatty liver disease; BMI: Body mass index. *Fisher's Exact Test. Table 1. Basic Characteristics of Study Participants
-
The average sequencing depth of the original data and target region was higher than 166.90×and 115.17×, respectively. More than 95.00% of the target region nucleobases had a coverage depth higher than 10.00×. The proportion of valid data for all samples was between 95.77%–99.64% with an error rate of only 0.02%–0.03%, and the Q30 value was more than 90.00%. The GC ratio was 48.42%–54.33%, the comparison rate was as high as 99.89%–99.94%, and the coverage rate of the target area was 99.30–99.80%. The data quality met the requirements and could be used for bioinformatics analysis; the quality assessment results are shown in Supplementary Table S2.
-
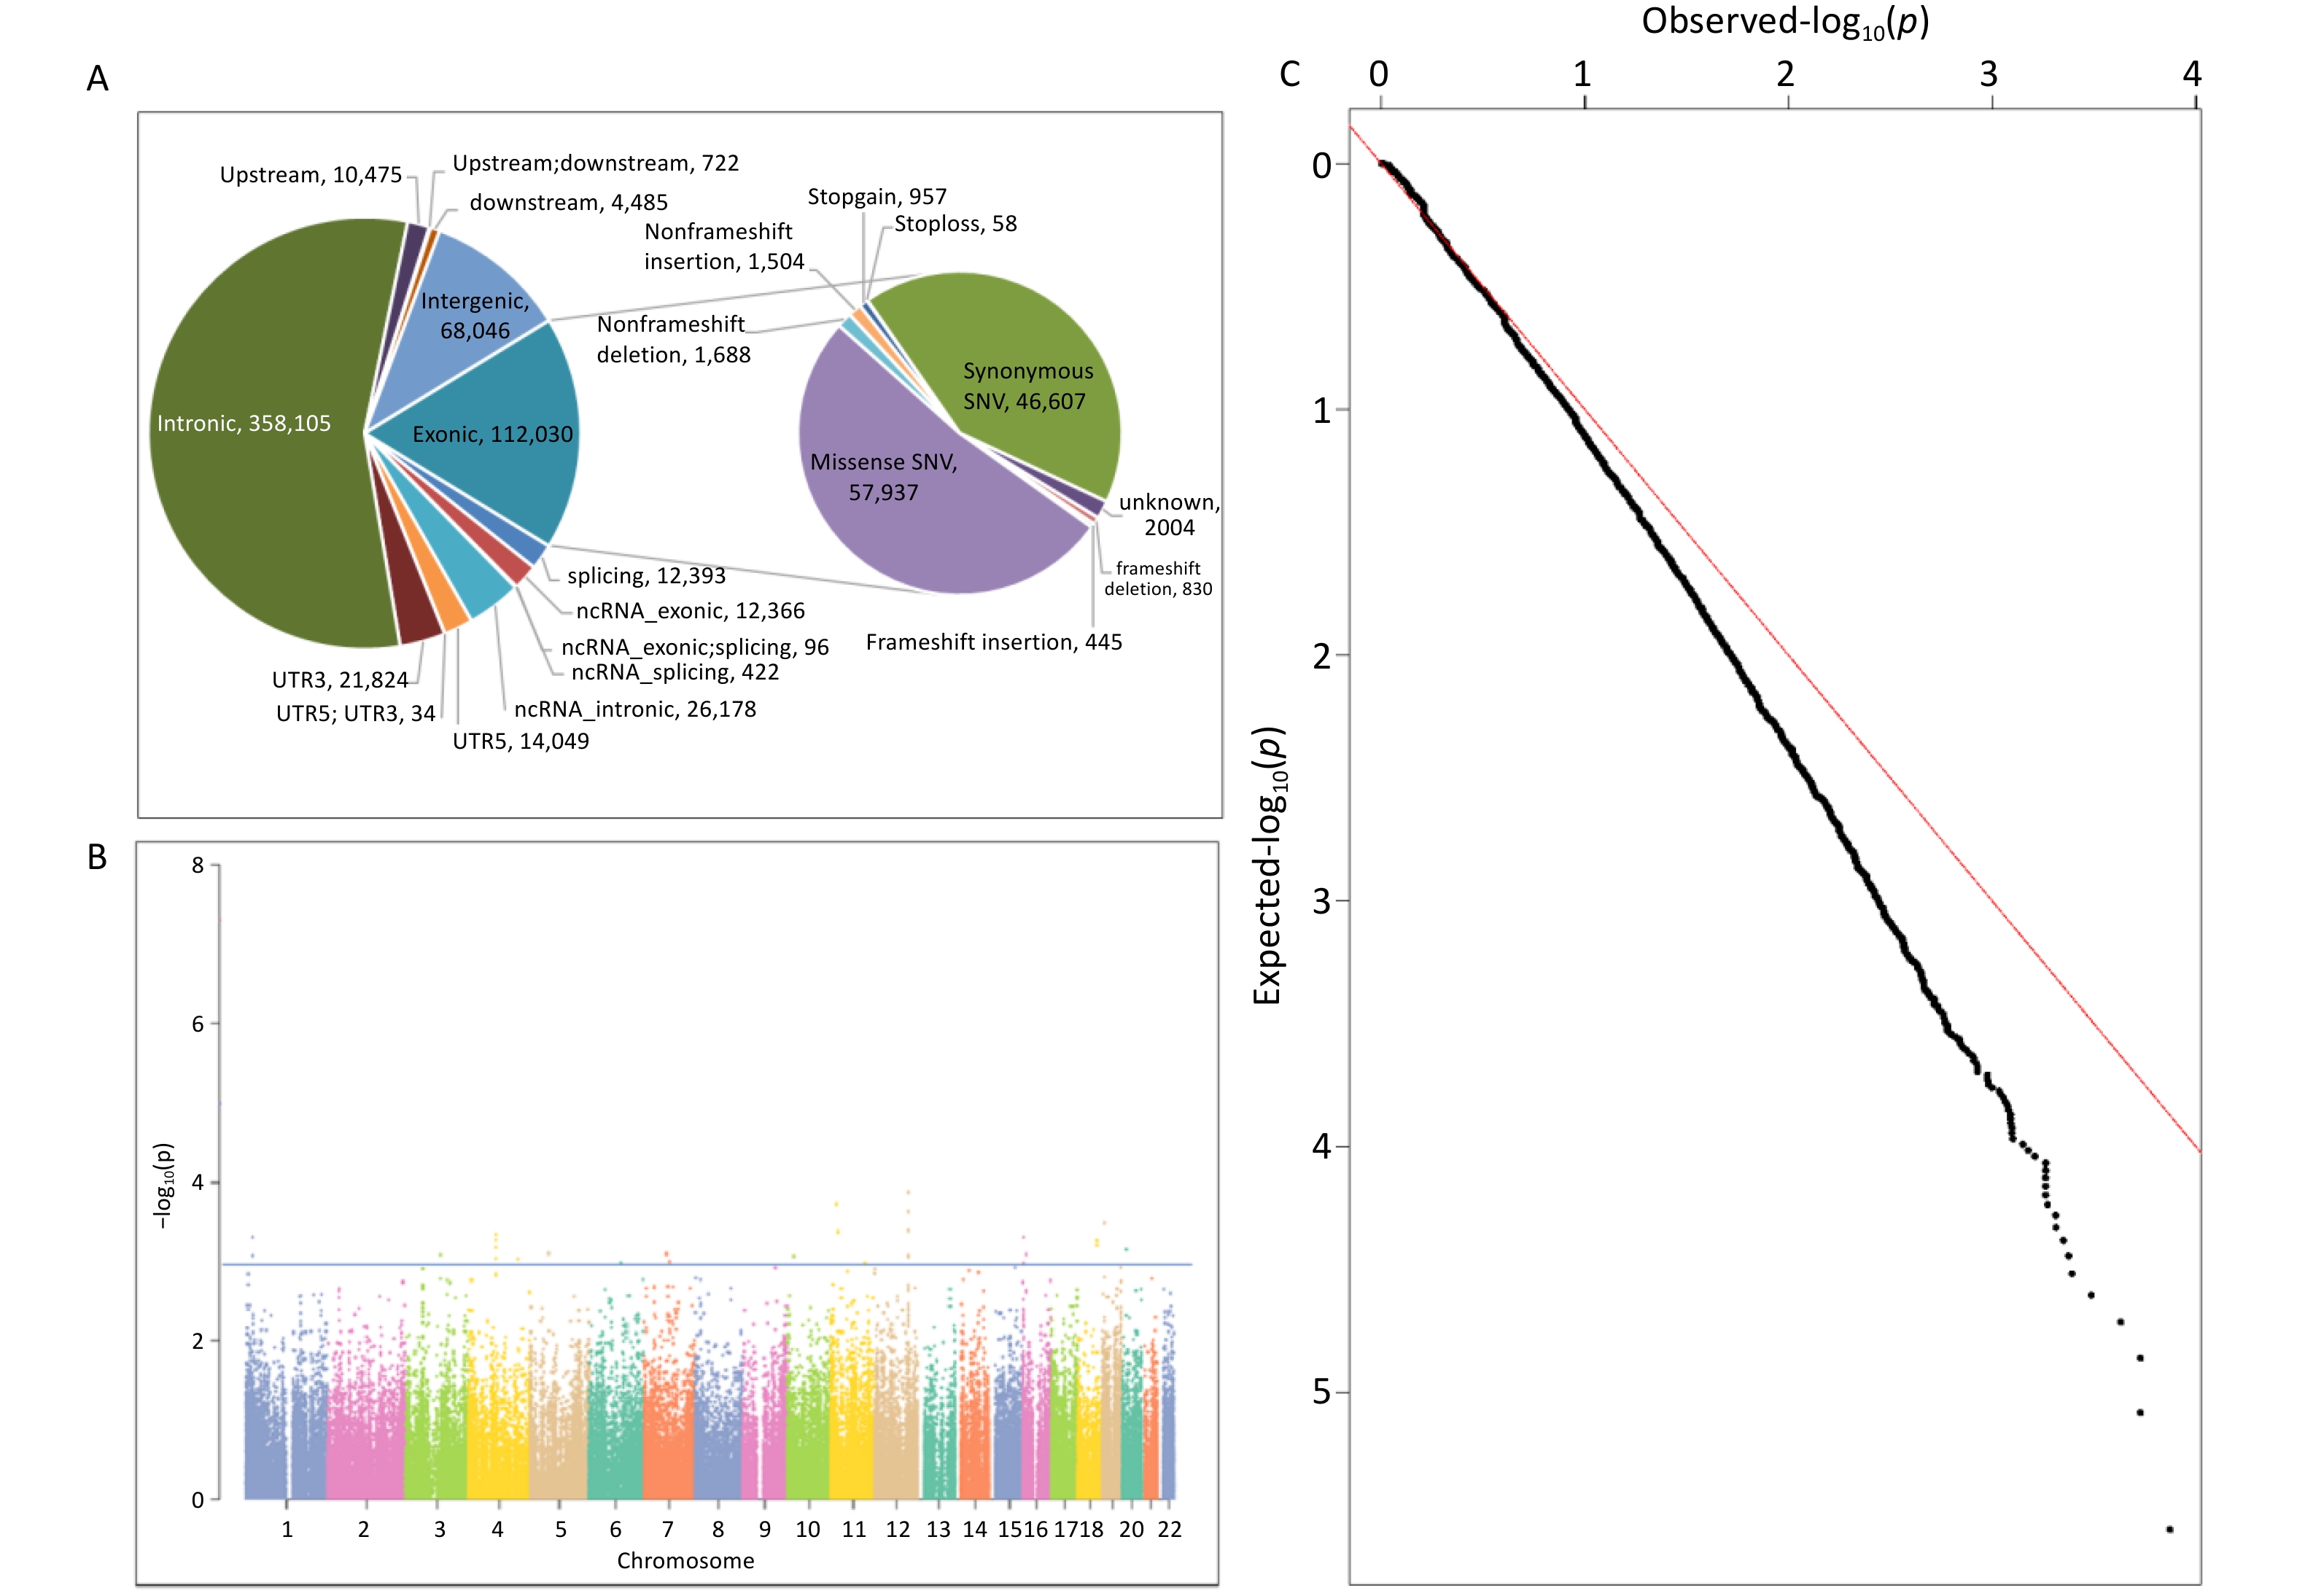
ANNOVAR software was used to annotate the sequencing data of the 93 samples, and the annotation content covered the location information, mutation type, and protein function prediction. Using a quality value of variation > 20 as the filtering standard, a total of 641,225 variants were identified, including 546,644 SNVs and 94,581 indels. Among these variations, intronic variation was the most prevalent, accounting for 55.85%, followed by exonic and intergenic variations, accounting for 17.42% and 10.61%, respectively. The composition ratio of the remaining regional variations was < 5.00%. See Supplementary Tables S2–S3, and Figure 1A.
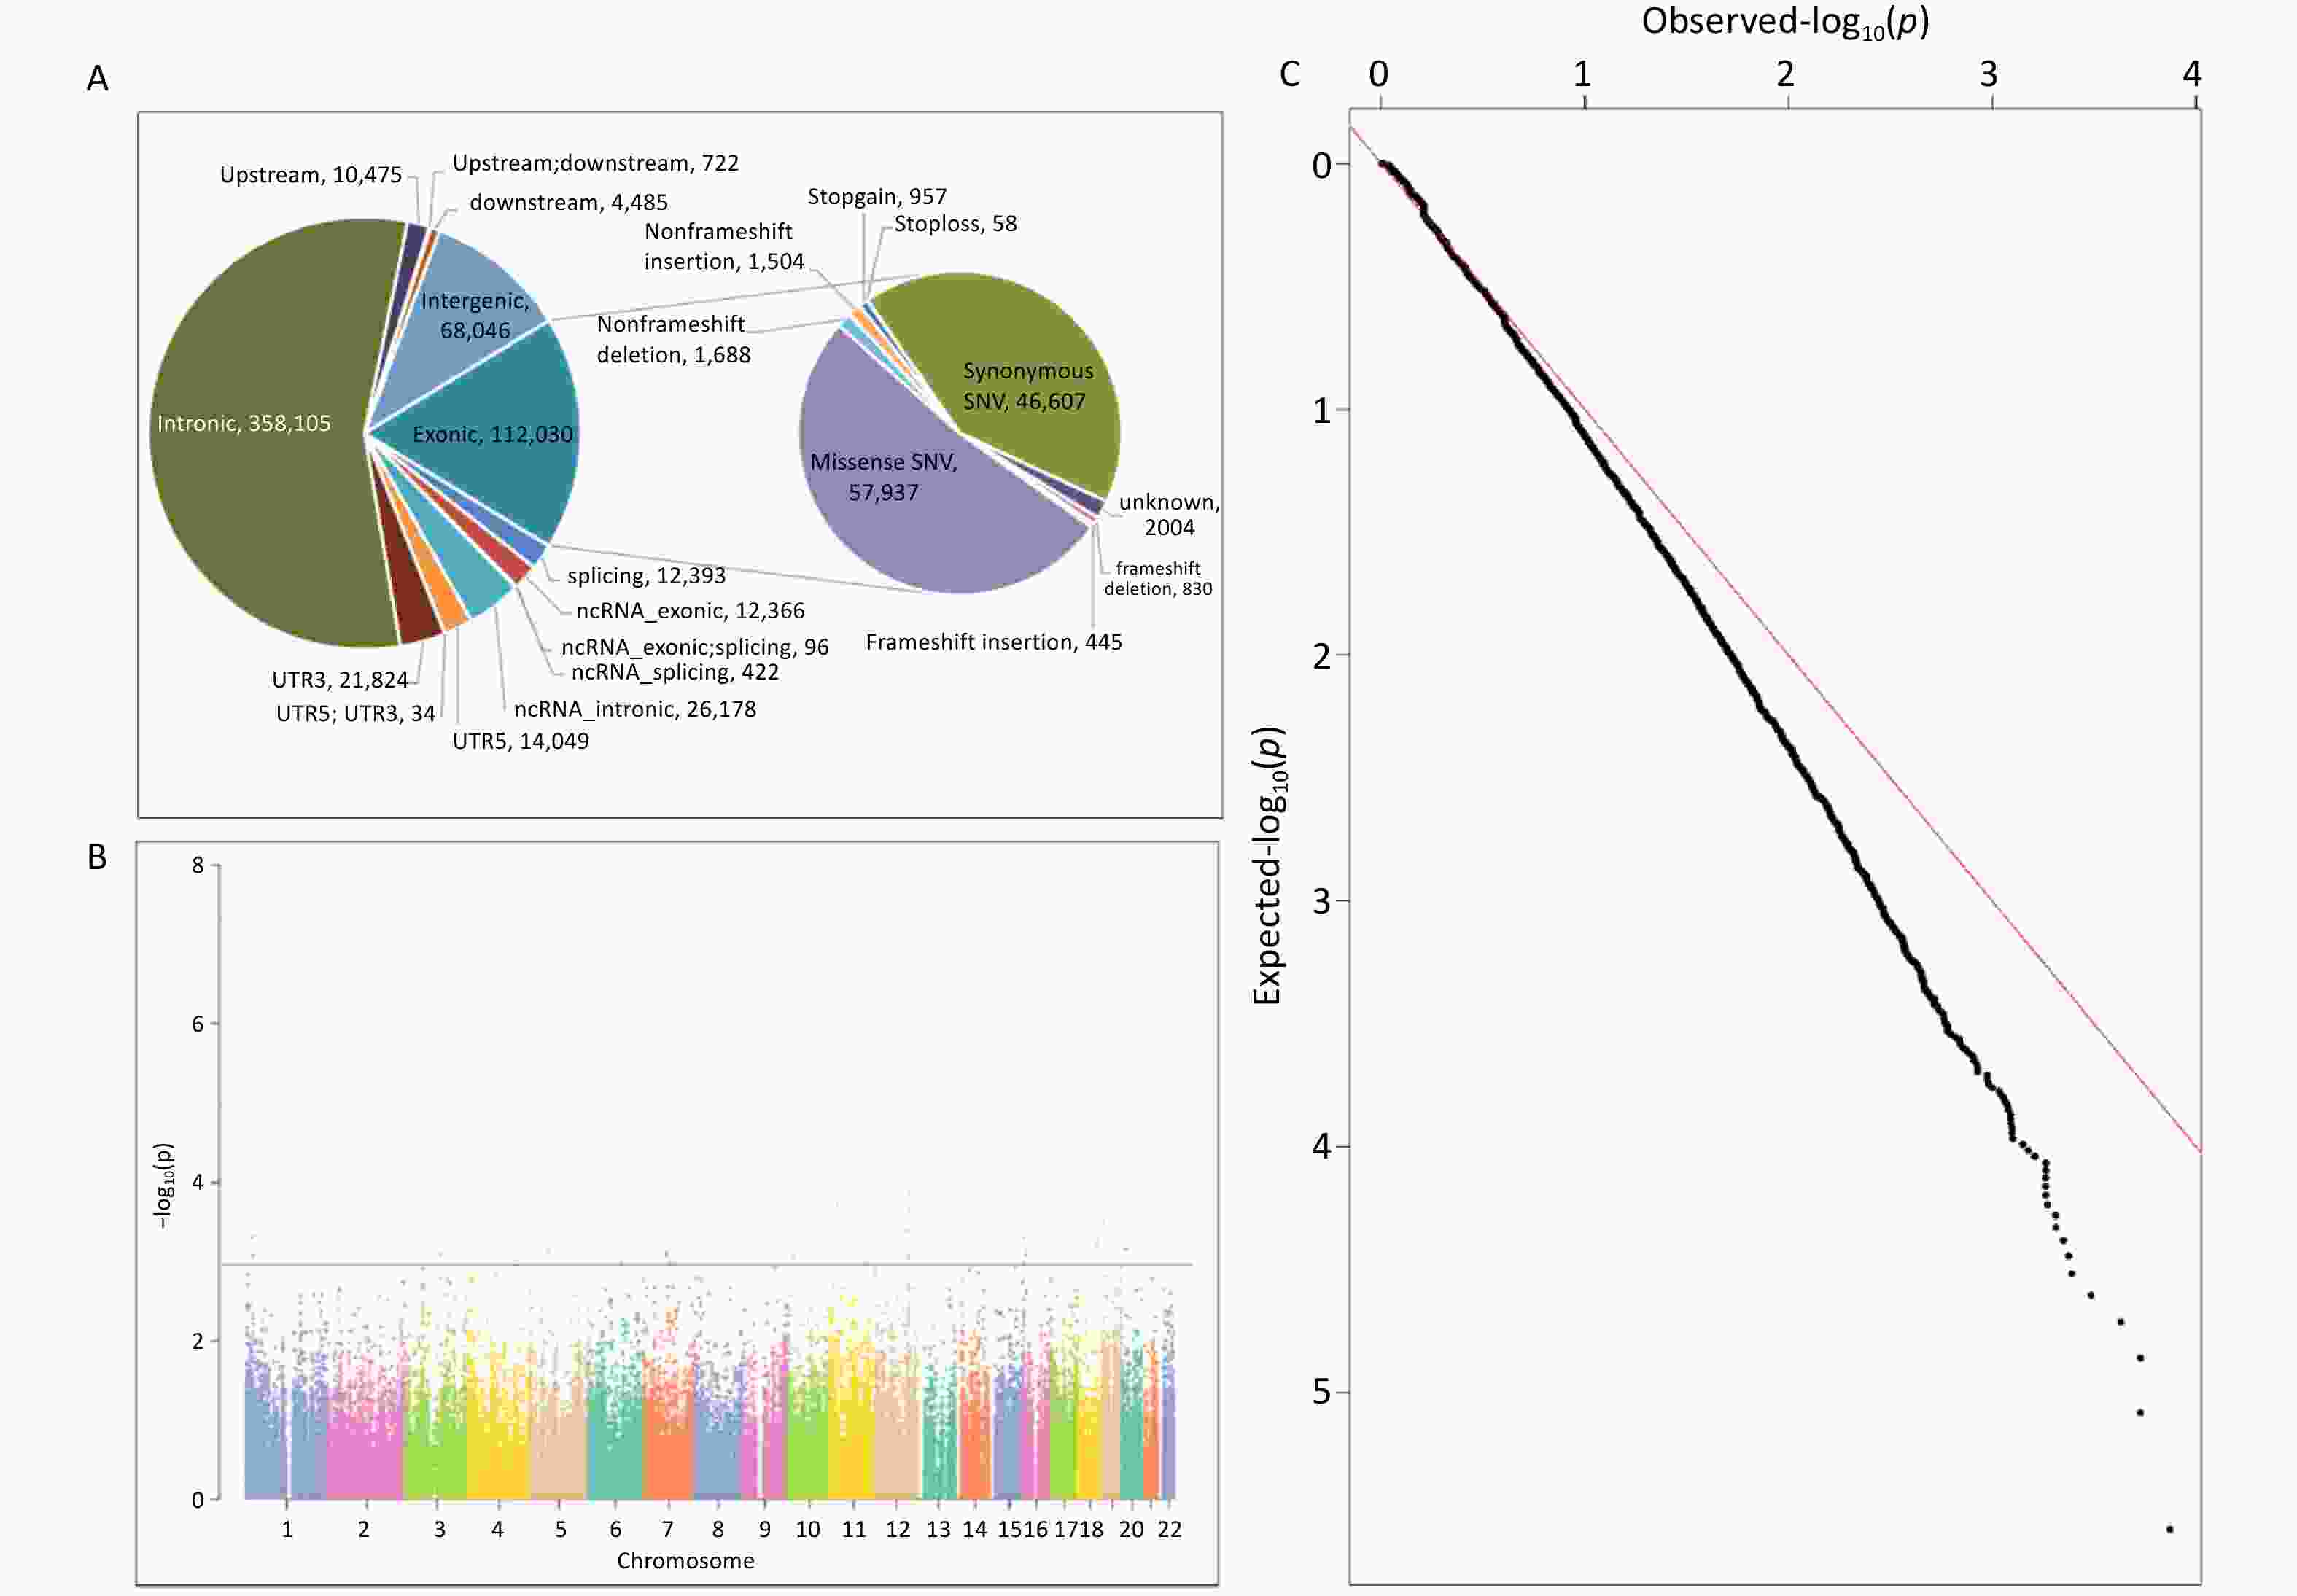
Figure 1. The Date Distribution of WES. (A) Variation location and functional annotation distribution in the exploration study; (B) Manhattan plot of association analysis of common variants of NAFLD in the exploration study; (C) Q-Q plot of association analysis of common variants of NAFLD in the exploration study. NAFLD, non-alcoholic fatty liver disease; WES, whole exome sequencing; ncRNA, non-coding RNA; UTR3, 3’-untranslated region; UTR5, 5’-untranslated region.
Based on the effect of exon variation on amino acid changes, SNV mutation types were classified as missense SNV (n = 57,937), stop-gain (n = 872), stop-loss (n = 51), synonymous SNV (n = 46,607), and unknown (n = 1,800). Indel mutations included frameshift insertions (n = 445), frameshift deletions (n = 830), stop-gain (n = 85), stop-loss (n = 7), non-frameshift insertions (n = 1,504), non-frameshift deletions (n = 1,688), and unknown (n = 204). Detailed information is provided in Supplementary Table S3 and Figure 1A.
-
In total, 641,225 variants were screened and filtered stepwise. According to the frequency information of the variants in the gnomAD_genome, gnomAD_exome, and ExAC databases, the variants with a frequency > 0.05 were filtered, leaving 408,758 variants. Next, according to the annotation of the variation region, intronic, intergenic, ncRNA, UTR, upstream, downstream, and other regional variations were removed, and 64,537 exon or spliced region variations were retained. Then, according to the annotation information, such as the mutation type and conservation prediction, the synonymous SNVs that were not predicted by the software to affect splicing and the mutations in the repeat region were removed, leaving 41,543 mutations. SIFT, Polyphen, MutationTaster, and CADD software were used to predict the effects of mutations on protein structure and function.
SIFT, Polyphen, MutationTaster, and CADD predicted 16,147, 17,767, 18,652, and 22,773 harmful mutations, respectively. Among these, 21,938 sites were predicted to have harmful mutations using more than two software programs. The 21,938 variants were subjected to a gene-based burden test. The results showed significant differences in the loads of the 184 gene variants between the case and control groups (P < 0.05). Combined with the ACMG harmful classification, seven pathogenic and possibly pathogenic variant gene loci were selected for validation (P < 0.05). The seven possible pathogenic variants are CES5A rs148234688, RAB11FIP1 rs151011205, ANXA7 rs3750575, SCG2 rs16864976, GANC rs79004308, SPINT1 rs116845898, and TTC23L rs77793555. Further details are presented in Table 2. details.
Gene Chromosome Reference allele Alternative allele Function P-value* CES5A chr16 G T Exonic 0.005 RAB11FIP1 chr8 A G Exonic 0.011 ANXA7 chr10 C T Exonic 0.011 SCG2 chr2 A G Exonic 0.026 GANC chr15 T A Exonic; splicing 0.026 SPINT1 chr15 G A Exonic 0.040 TTC23L chr5 G A Exonic 0.043 Note. chr: chromosome; G: guanine; A: adenine; C: cytosine; T: thymine. *Fisher's Exact Test. Table 2. Gene-based Burden Test of Rare Variants in the Exploration Study
-
For the gnomAD_genome, gnomAD_exome, or ExAC databases, 232,467 variants with frequencies > 0.05 in the East Asian population, were analyzed. First, a quality control assessments of samples and loci were carried out, and variants with sequencing quality values < 20, sex chromosome gene variants, loci that did not meet HWE (P < 0.001), and loci with a locus typing rate of < 90% in the case or control group were removed. Finally, 217,699 variants were analyzed. The results of the association analysis of the genetic additive model showed that the association between all loci and NAFLD was not significant in the entire exon group. There were 6036 loci with P < 0.05 and 31 loci with P < 0.001. Figure 1B and 1C show the Manhattan and Q-Q plots of the common variation association analysis, respectively.
The online tool DAVID was used to perform KEGG pathway enrichment analysis of candidate genes by screening and analyzing low-frequency rare variants, association analysis of common variants, and ACMG harmfulness classification to screen pathways related to non-alcoholic fatty liver disease in the KEGG database. A total of eight pathways were identified, including the Insulin signaling, insulin resistance, NF-kappa B signaling, adipocytokine signaling, TNF signaling, fatty acid metabolism, carbohydrate metabolic, and energy metabolism pathways. Based on the pathway enrichment results, seven possible susceptibility genes in the fatty acid, carbohydrate, and energy metabolism pathways were selected for large-sample validation. The specific pathways and related genes are listed in Table 3. Screening and validation of the susceptibility genes are shown in Figure 2.
SNP Function 1000g_Chinese 1000g_EAS 1000g_ALL KEGG_PATHWAY SCD5
rs3733228exonic 0.445 0.476 0.303 Fatty acid metabolism CALML5
rs10904516exonic 0.299 0.305 0.353 Fatty acid metabolism ECI2
rs2326408splicing 0.377 0.359 0.495 Fatty acid metabolism C6orf201
rs659305intronic 0.377 0.358 0.310 Energy metabolism PRKAG2
rs12703159intronic 0.083 0.097 0.181 Fatty acid metabolism ABCC8
rs1800851intronic 0.267 0.272 0.234 Carbohydrate metabolism COX11
rs17209882intronic 0.352 0.339 0.185 Fatty acid metabolism Note. KEGG: Kyoto Encyclopedia of Genes and Genomes; NAFLD: non-alcoholic fatty liver disease; SNP: single nucleotide polymorphism. Table 3. Candidate Common Variants Related to NAFLD-related Enrichment Pathways in the Exploration Study
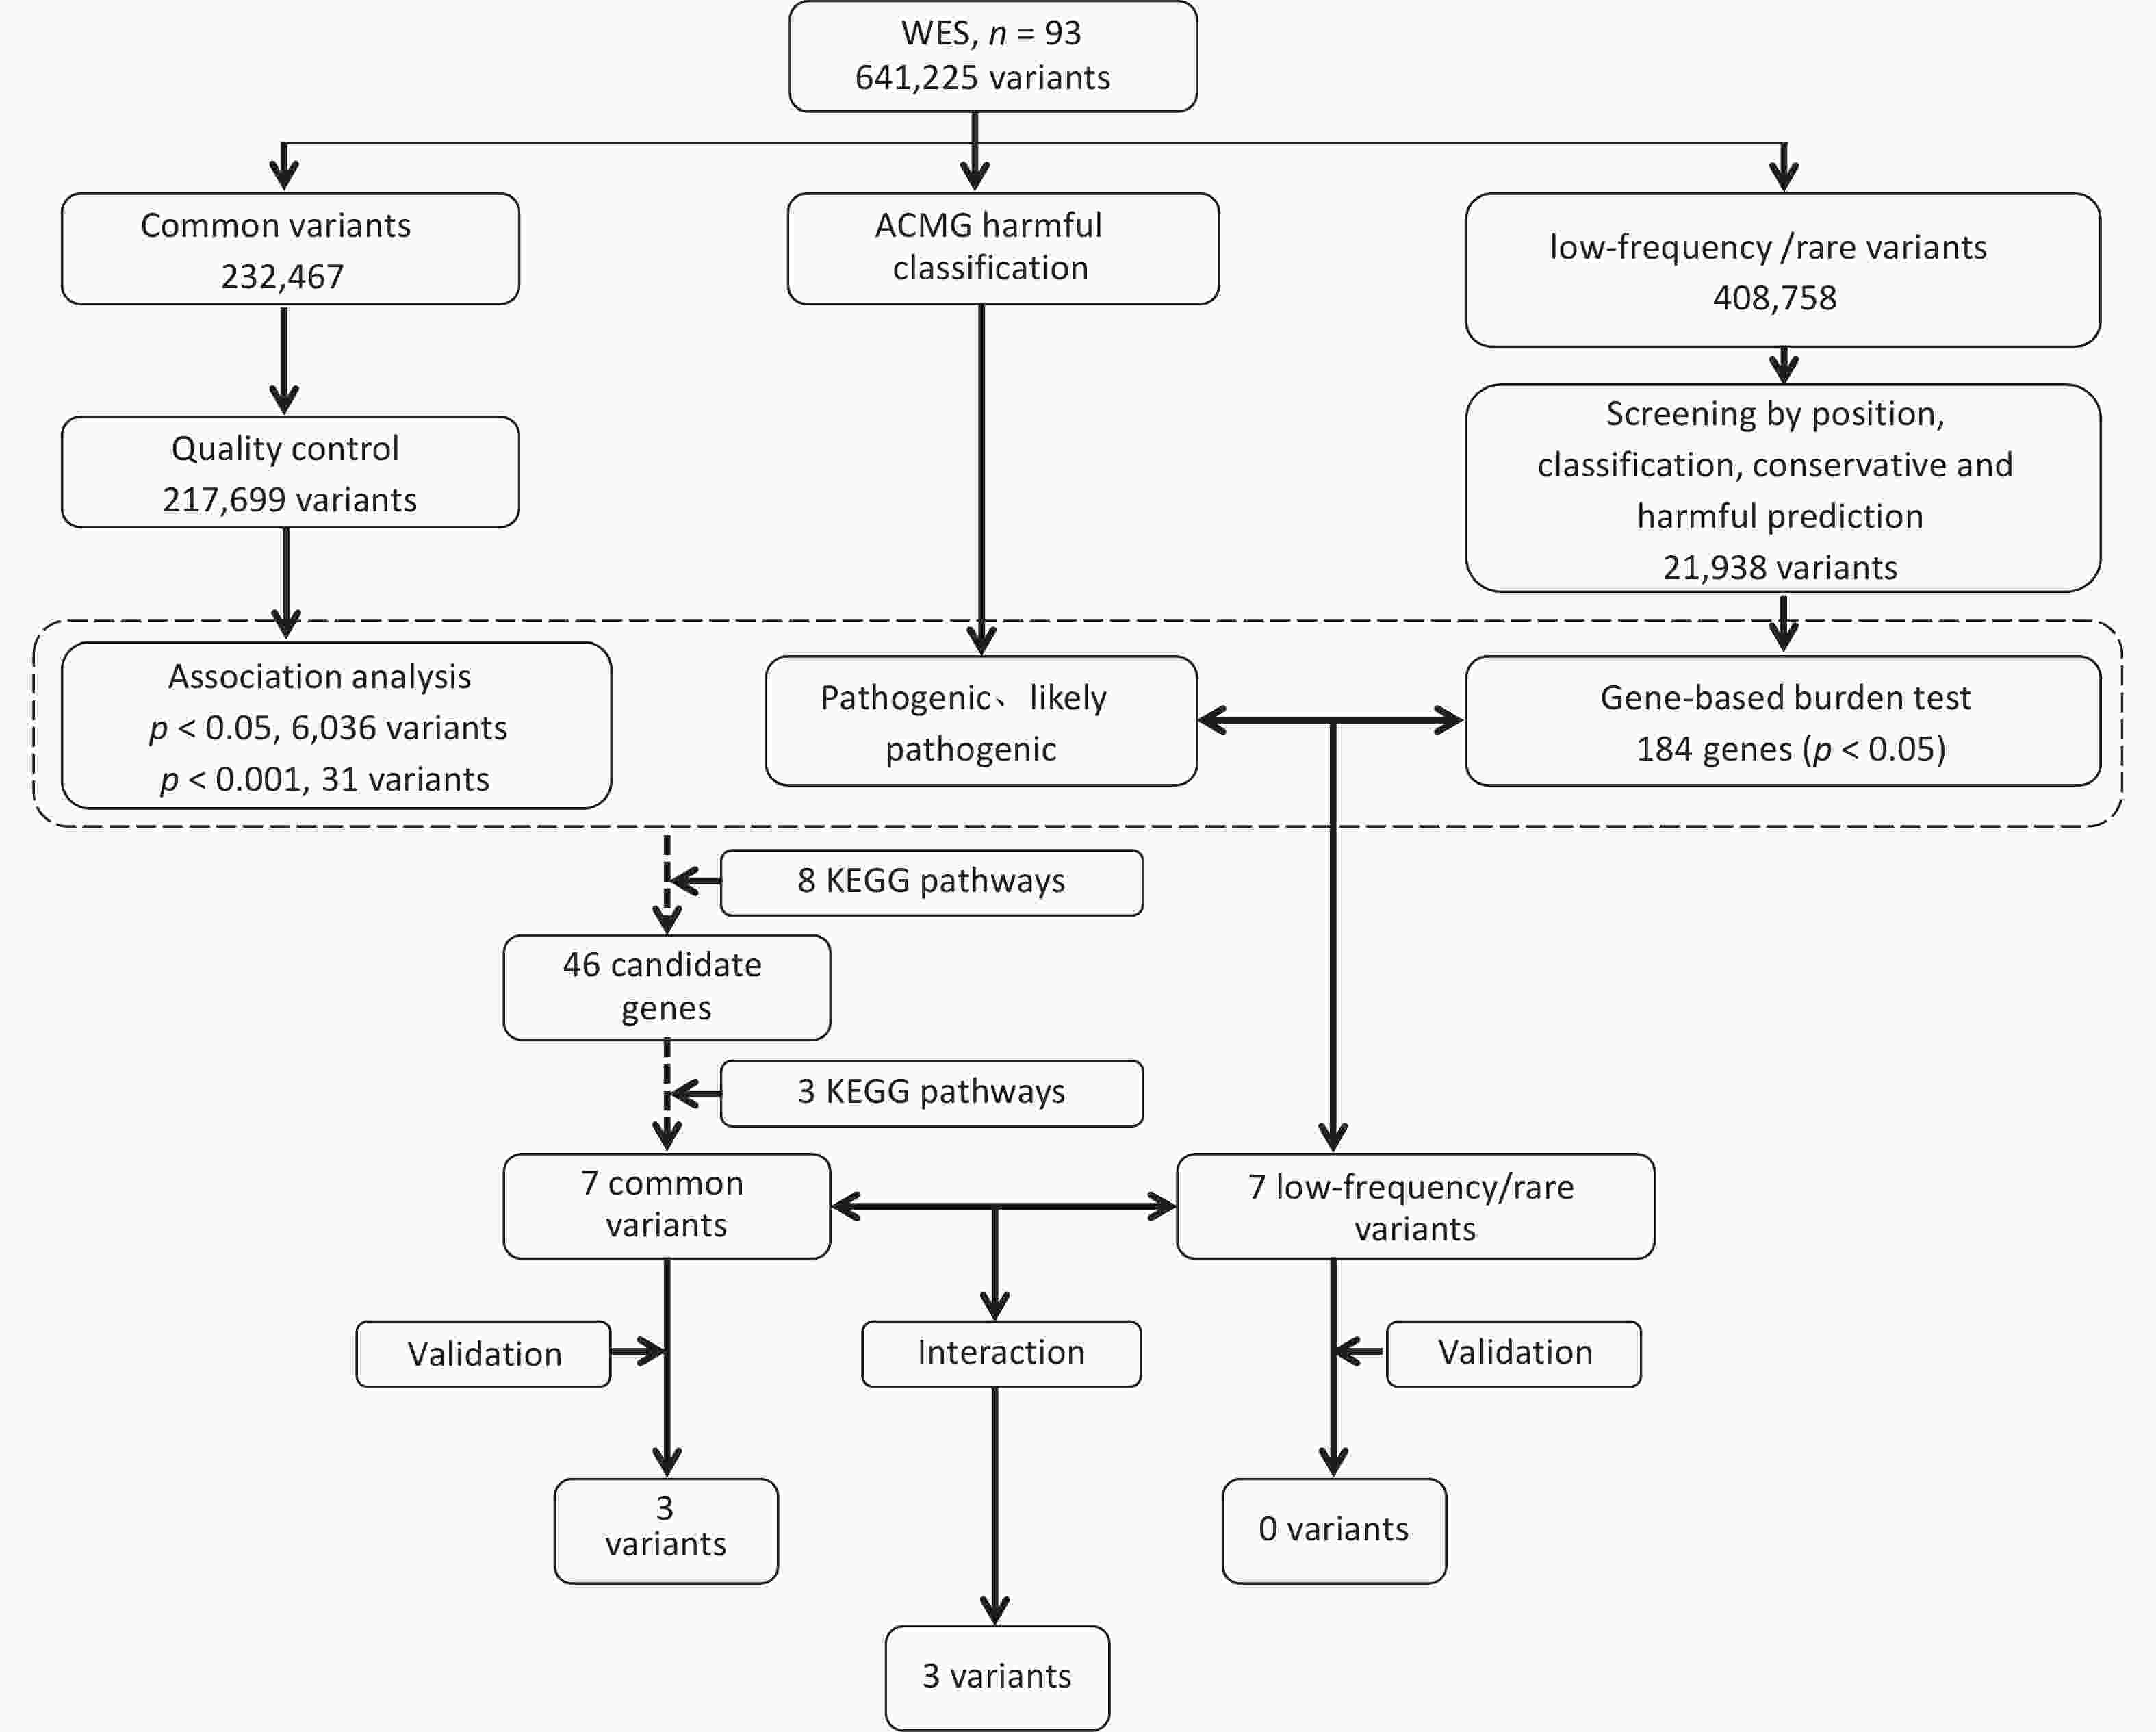
Figure 2. Screening and Validation of Susceptible Genes. WES: Whole Exome Sequencing; ACMG: The American College of Medical Genetics and Genomics; KEGG: Kyoto Encyclopedia of Genes and Genomes.
-
The genotype frequency distributions of the seven genes and seven SNPs related to low-frequency and rare mutation pathways in the case and control groups are shown in Supplementary Table S4. The success rate for each genotype was > 90%. In the control group, there were no significant differences between the actual and expected values of each genotype frequency, except GANC rs79004308, which was in line with the HWE principle, indicating that the samples in this study were from the genetic equilibrium population and had good representativeness.
The genotype frequency distributions of the seven common variation-related genes and seven SNPs in the case and control groups are shown in Supplementary Table S5. The success rate for each genotype was > 90%. There was no significant difference between the actual and expected values of each genotype frequency in the control group, which was consistent with the HWE principle, indicating that the samples in this study were from a genetically equilibrium population with good representativeness.
-
In this study, four traditional models, namely, the co-dominant, dominant, recessive, and additive models, were used to analyze the association between 14 SNPs in 14 related genes and NAFLD in children with obesity before and after adjusting for confounding factors (sex, age, and BMI).
The results showed that after adjusting for sex, age, and BMI, enoyl-CoA delta osomerase 2 (ECI2) rs2326408 (dominant model: OR = 1.33, 95% CI: 1.02–1.72; additive model: OR = 1.22, 95% CI: 1.01–1.47), C6orf201 rs659305 (dominant model: OR = 1.30, 95% CI: 1.01–1.69; additive model: OR = 1.21, 95% CI: 1.00–1.45), CALML5 rs10904516 (pre-adjusted dominant model: OR=1.36, 95% CI: 1.01–1.83, post-adjusted dominant model: OR = 1.40, 95% CI: 1.03–1.91; pre-adjusted additive model: OR=1.26, 95% CI: 1.01–1.58, or post-adjusted additive model: OR = 1.31, 95% CI: 1.04–1.66) polymorphism was significantly associated with NAFLD in children with obesity (P < 0.05). The remaining SNPs were not associated with NAFLD in children with obesity before or after adjustment (Table 4 and Supplementary Table S6).
Model OR (95% CI) P-value Adjust OR (95% CI)^ P-value SCD5 rs3733228 Co-dominant model 1 (Ref.) 1 (Ref.) 0.91 (0.65–1.26) 0.559 0.93 (0.66–1.31) 0.676 0.85 (0.60–1.21) 0.359 0.90 (0.63–1.30) 0.572 Dominant model 1.00 (0.78–1.28) 0.982 1.01 (0.78–1.31) 0.950 Recessive model 1.13 (0.83–1.54) 0.427 1.09 (0.79–1.50) 0.599 Additive model 1.03 (0.88–1.21) 0.692 1.03 (0.87–1.21) 0.754 ECI2 rs2326408 Co-dominant model 1 (Ref.) 1 (Ref.) 0.78 (0.52–1.15) 0.206 0.71 (0.47–1.06) 0.096 0.91 (0.61–1.36) 0.642 0.92 (0.61–1.39) 0.688 Dominant model 1.20 (0.94–1.54) 0.150 1.33 (1.02–1.72) 0.033 Recessive model 1.20 (0.83–1.75) 0.339 1.26 (0.85–1.85) 0.248 Additive model 1.15 (0.96–1.37) 0.135 1.22 (1.01–1.47) 0.037 C6orf201 rs659305 Co-dominant model 1 (Ref.) 1 (Ref.) 0.78 (0.54–1.18) 0.261 0.72 (0.48–1.08) 0.116 0.92 (0.62–1.37) 0.684 0.92 (0.61–1.40) 0.706 Dominant model 1.18 (0.92–1.50) 0.199 1.30 (1.01–1.69) 0.044 Recessive model 1.17 (0.81–1.70) 0.400 1.24 (0.84–1.82) 0.279 Additive model 1.13 (0.94–1.35) 0.184 1.21 (1.00–1.45) 0.049 PRKAG2 rs12703159 Co-dominant model 1 (Ref.) 1 (Ref.) 0.66 (0.25–1.75) 0.404 0.72 (0.26–2.01) 0.524 0.85 (0.31–2.30) 0.743 0.95 (0.33–2.74) 0.928 Dominant model 1.30 (0.97–1.73) 0.080 1.34 (0.99–1.81) 0.062 Recessive model 1.43 (0.54–3.80) 0.468 1.31 (0.47–3.67) 0.605 Additive model 1.27 (0.98–1.65) 0.076 1.29 (0.98–1.70) 0.068 CALML5 rs10904516 Co-dominant model 1 (Ref.) 1 (Ref.) 0.66 (0.40–1.10) 0.109 0.60 (0.35–1.02) 0.061 0.87 (0.52–1.46) 0.595 0.80 (0.47–1.38) 0.430 Dominant model 1.36 (1.01–1.83) 0.046 1.40 (1.03–1.91) 0.032 Recessive model 1.33 (0.82–2.17) 0.249 1.46 (0.87–2.44) 0.152 Additive model 1.26 (1.01–1.58) 0.043 1.31 (1.04–1.66) 0.024 ABCC8 rs1800851 Co-dominant model 1 (Ref.) 1 (Ref.) 1.03 (0.62–1.70) 0.913 1.12 (0.66–1.89) 0.677 0.99 (0.59–1.66) 0.968 1.08 (0.63–1.84) 0.790 Dominant model 0.96 (0.75–1.23) 0.769 0.95 (0.74–1.23) 0.709 Recessive model 0.99 (0.60–1.62) 0.960 0.91 (0.54–1.52) 0.713 Additive model 0.97 (0.80–1.19) 0.798 0.95 (0.78–1.17) 0.655 COX11 rs17209882 Co-dominant model 1 (Ref.) 1 (Ref.) 1.33 (0.89–1.98) 0.161 1.33 (0.88–2.00) 0.173 1.37 (0.91–2.05) 0.129 1.24 (0.81–1.88) 0.322 Dominant model 0.96 (0.75–1.22) 0.729 0.88 (0.68–1.14) 0.344 Recessive model 0.74 (0.51–1.08) 0.123 0.78 (0.53–1.15) 0.206 Additive model 0.91 (0.76–1.09) 0.324 0.89 (0.74–1.07) 0.198 Note. OR: odds ratio; CI: confidence interval; Ref: reference; ^ adjusted for sex, age, and BMI; NAFLD, non-alcoholic fatty liver disease; SNV, single nucleotide variant. Table 4. Association Analysis of Common Variant SNP and NAFLD in Validation Population
-
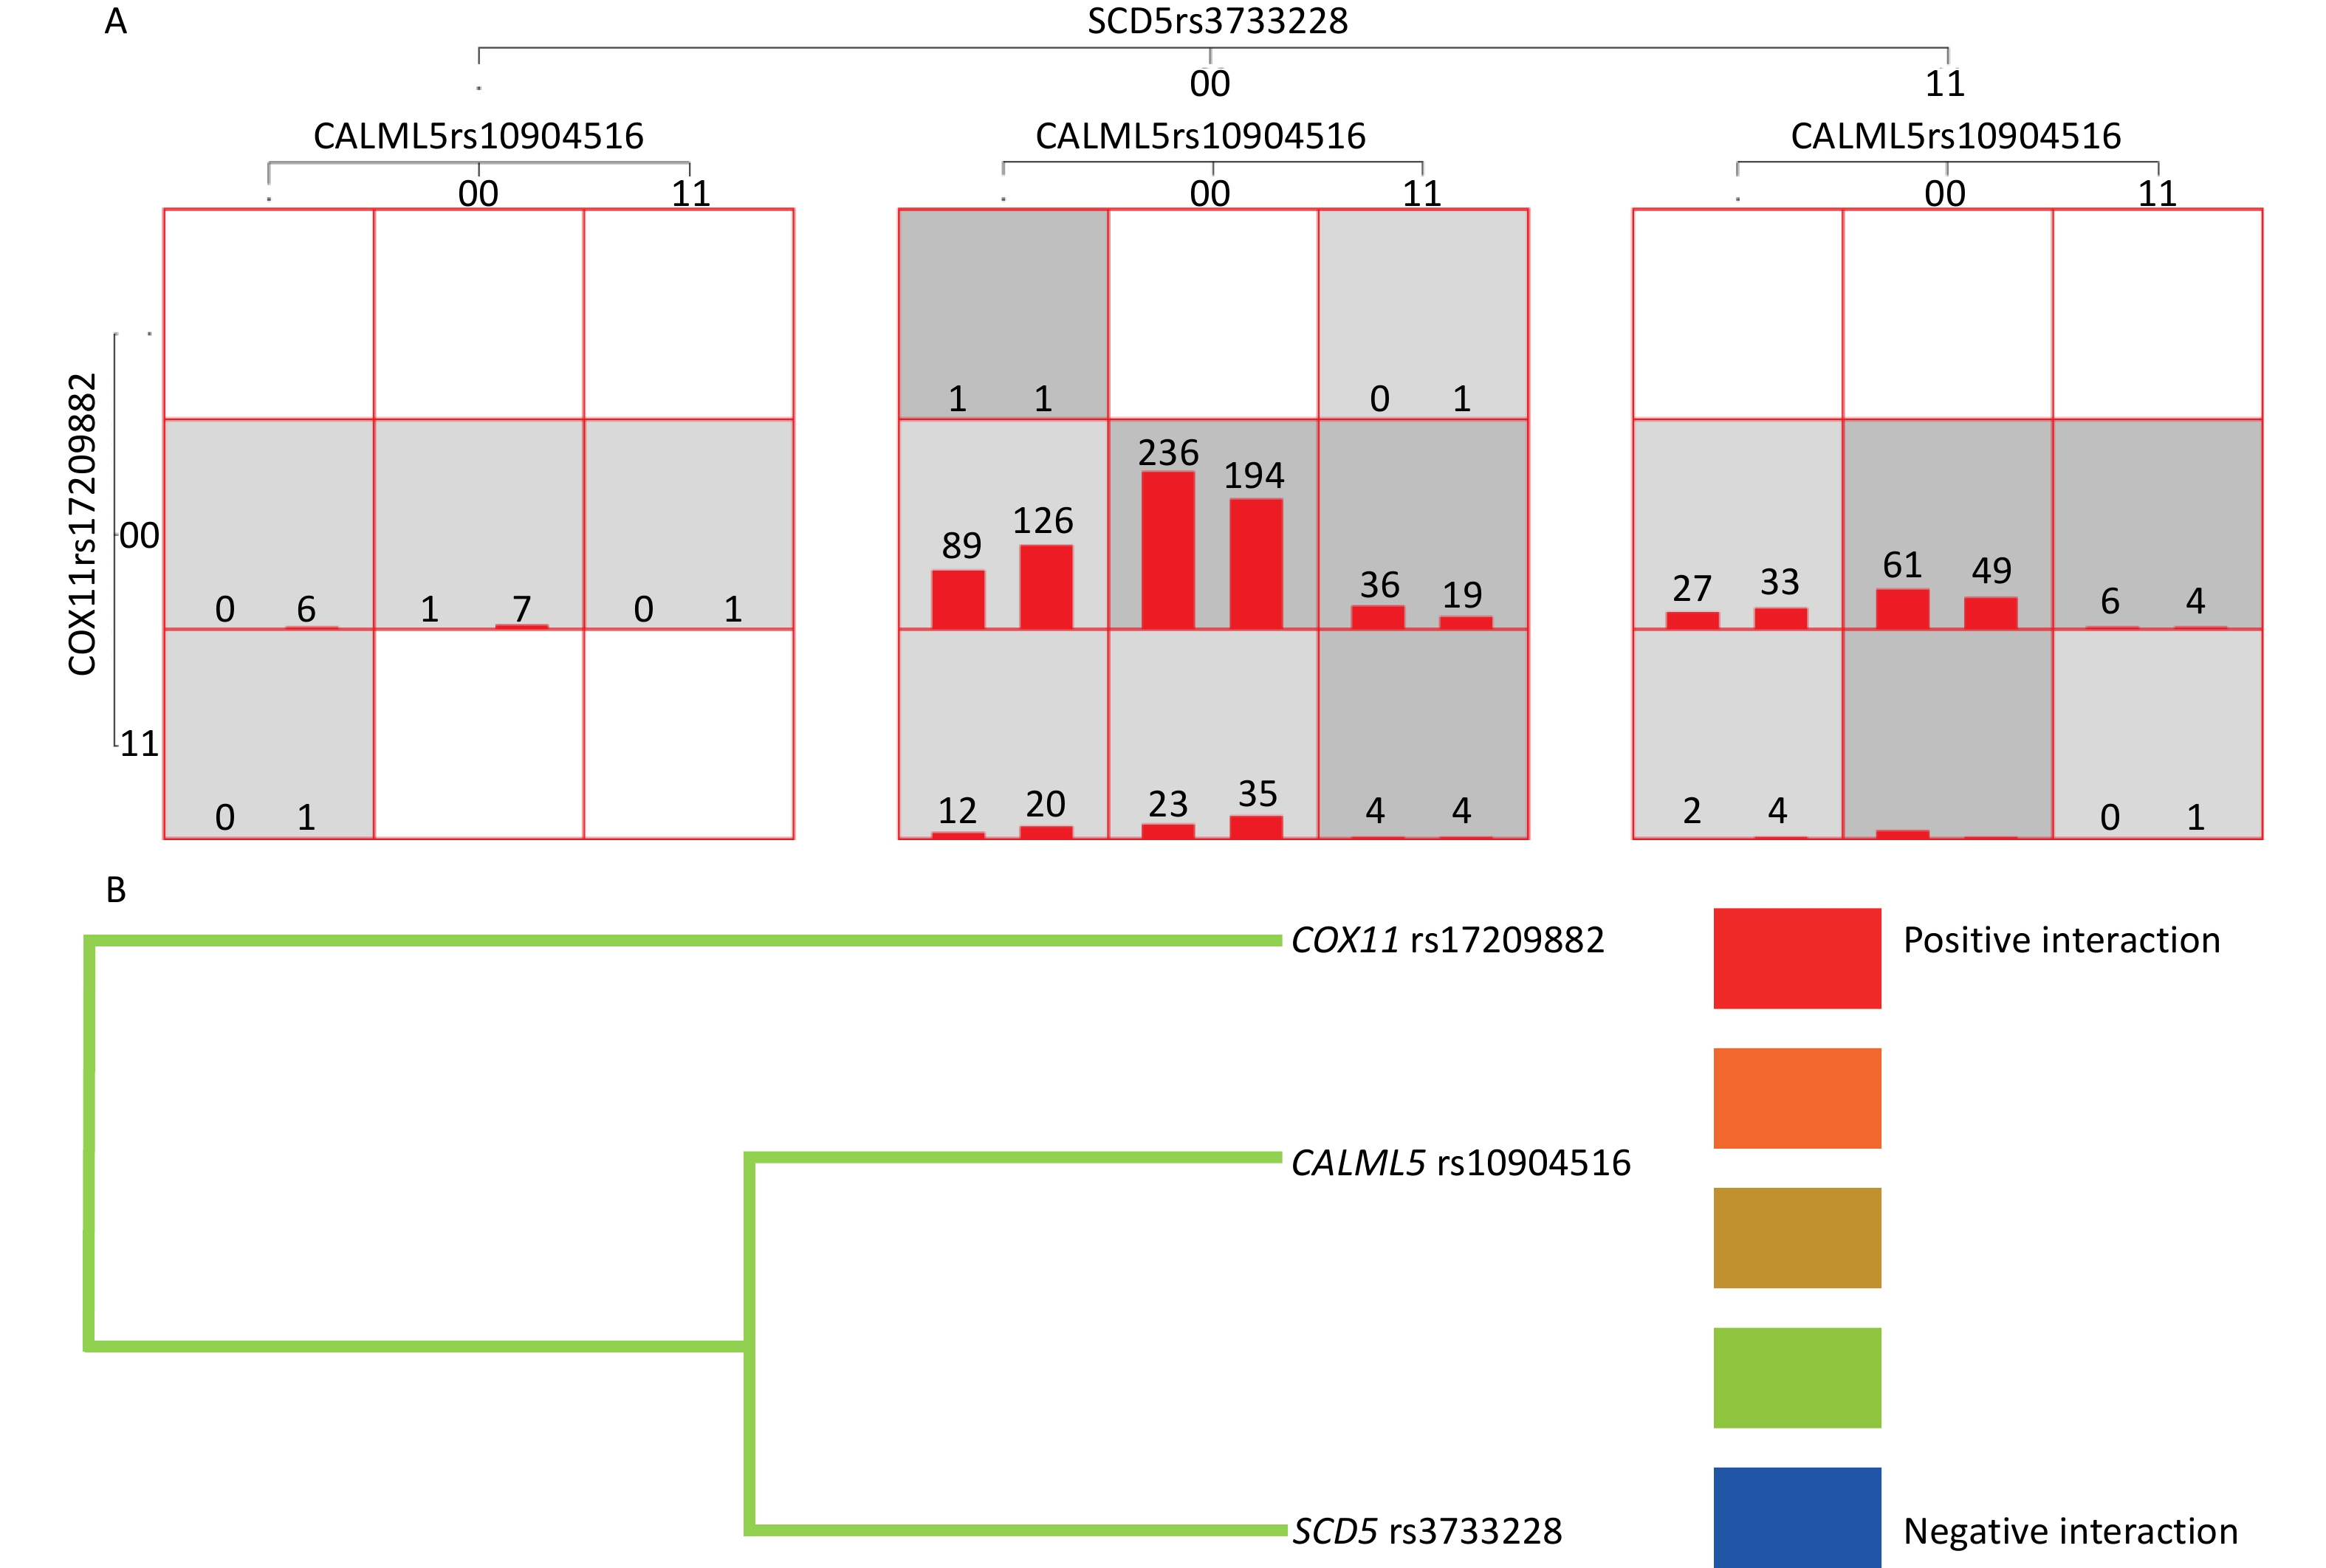
The results showed that the MDR software could be used to analyze the interactions of 14 SNP loci. The optimal model included CALML5 rs10904516, cytochrome C oxidase copper chaperone (COX)11 rs17209882, and stearoyl-CoA desaturase (SCD)5 rs3733228 (P < 0.05). The accuracy of the training set, test set was 0.571, symbolic test was P = 0.001, and cross-validation consistency coefficient was 10/10. Additionally, the one- and four-site models were statistically significant (P < 0.05), and the three-site model was the best model as judged by professional knowledge. Model 4 included CALML5 rs10904516, ABCC8 rs1800851, COX11 rs17209882, and SCD5 rs3733228 (P < 0.05). The accuracy of the training set was 0.592, test set was 0.568, symbol test was P = 0.001, and cross-validation consistency coefficient was 10/10. (Table 5 and Figure 3A). The tree diagram shows a negative interaction between CALML5 rs10904516, COX11 rs17209882, and SCD5 rs3733228 (Figure 3B).
Model
dimensionOptimal factor combination (best model) Training balance accuracy Test balance accuracy P-value CV 1 CALML5 rs10904516 0.559 0.559 9 (0.010) 10/10 2 CALML5 rs10904516*SCD5 rs3733228 0.567 0.545 8 (0.055) 4/10 3 CALML5 rs10904516*COX11 rs17209882*SCD5 rs3733228 0.580 0.571 10 (0.001) 10/10 4 CALML5 rs10904516*ABCC8 rs1800851*COX11
rs17209882*SCD5 rs37332280.592 0.568 10 (0.001) 10/10 Note. CV: Cross-Validation Count. Table 5. Analyzing the Association of the Interaction between the 14 Loci and NAFLD in the Validation Population Using the MDR Method
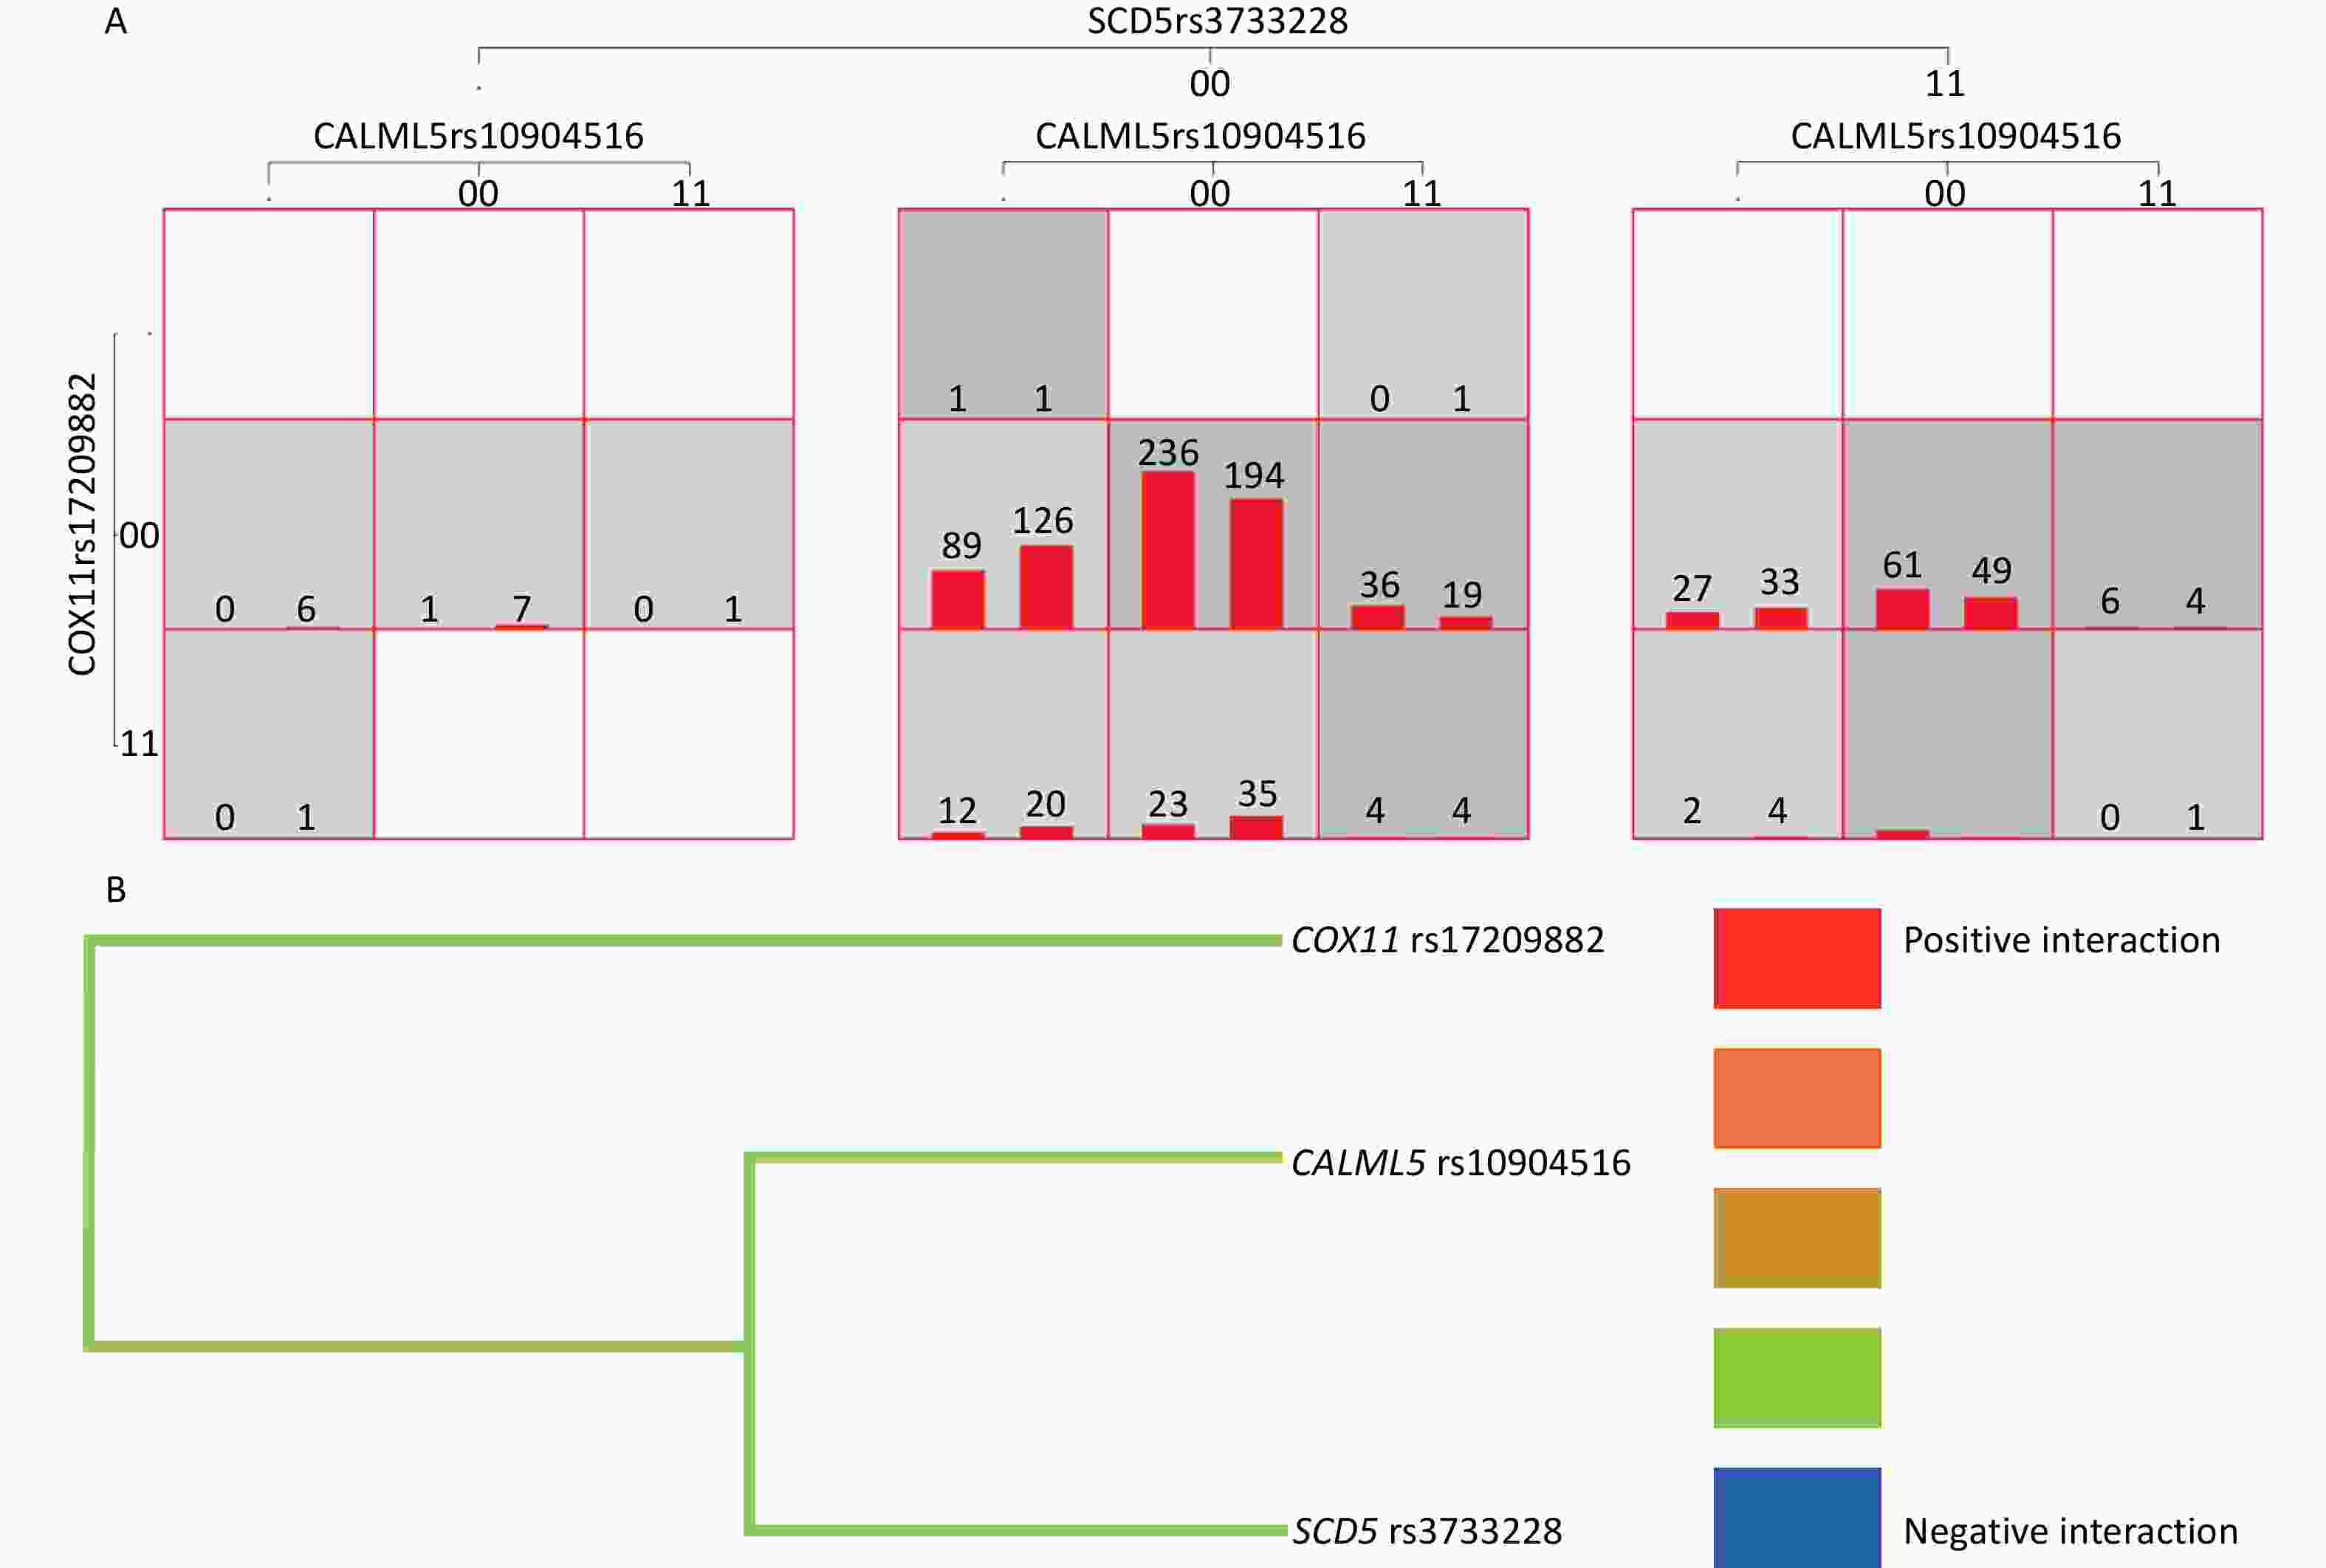
Figure 3. Gene-gene Interaction. (A) Gene-gene interaction model of CALML5 gene rs10904516 locus, COX11 gene rs17209882 locus and SCD5 gene rs3733228 in verification population. (B) Gene-gene interaction tree of CALML5 gene rs10904516 locus, COX11 gene rs17209882 locus and SCD5 gene rs3733228 in verification population. Red represents a high degree of positive interaction, orange represents a lesser degree, and gold represents the midway point between positive interaction and negative interaction. The blue color represents a high degree of negative interaction and green represents a lesser degree.
-
We conducted exploratory and validation studies to explore the relationship between genetic variant load and NAFLD in children with obesity. After adjusting for sex, age, and BMI, we identified some SNPs independently associated with NAFLD. ECI2 rs2326408, C6orf201 rs659305, and CALML5 rs10904516 polymorphisms were associated with NAFLD in children with obesity, and the interaction of CALML5 rs10904516, COX11 rs17209882, and SCD5 rs3733228 was significantly associated with NAFLD in children with obesity. However, these genes have not been previously reported to be involved in NAFLD. These findings provide new insights into the genetic risk factors of NAFLD and development of early interventions for the prevention and treatment of NAFLD.
The occurrence and development of NAFLD are regulated by multiple complex pathways. Based on the pathway enrichment results, seven possible susceptibility genes in the fatty acid, carbohydrate, and energy metabolism pathways were selected for large-sample validation. Fatty acids accumulate in the liver by hepatocellular uptake from the plasma and de novo biosynthesis. Fatty acids are eliminated by oxidation within the cell or by secretion into the plasma of triglyceride-rich very-low-density lipoproteins. In obesity, the hepatic fatty acid metabolism is altered, leading to the accumulation of triglycerides within hepatocytes and NAFLD[26]. The liver is an essential metabolic organ, and its metabolic function is controlled by insulin and other metabolic hormones. Aberrant energy metabolism in the liver promotes NAFLD[27]. When carbohydrates are abundant, the liver converts glucose into fatty acids, a process referred to as de novo lipogenesis[28]. Impaired hepatic lipid and carbohydrate metabolism results in various metabolic disorders, including obesity, diabetes, and insulin resistance[29].
This study found that ECI2 rs2326408 and C6orf201 rs659305 polymorphisms were associated with NAFLD in children with obesity. ECI2 encodes an enzyme involved in lipid metabolism. Researchers have used multiple metabolite analysis platforms and RNA-seq to prove that the inhibition of ECI2 expression leads to decreased glucose utilization, fatty acid accumulation, and downregulation of cell cycle-related genes[30]. The GeneCards database shows that ECI2 is located at 6p25.2 and a member of the enoyl-CoA hydratase/isomerase family. The encoded protein is a key mitochondrial enzyme involved in beta-oxidation of unsaturated fatty acids. ECI2 is associated with disorders of peroxisome biogenesis and Zellweger syndrome. The results of this study showed that ECI2 is a risk factor for NAFLD. Mutations in ECI2 gene may lead to the early termination of protein transcription encoded by ECI2 gene, formation of truncated mRNA, and changes in enzymes involved in lipid metabolism, thus inducing the occurrence of disease. ACBD2/ECI2-mediated peroxisome-mitochondrial interactions facilitate the exchange of metabolites and/or macromolecules between these two organelles to support steroid biosynthesis[31], fatty acid metabolism and steroid biosynthesis are the two main pathways shared by peroxisomes and mitochondria. Therefore, ECI2 may indirectly affect fatty acid metabolism via steroids, which are associated with the occurrence and development of NAFLD.
CALML5 rs10904516 polymorphism was associated with NAFLD in children with obesity. The GeneCards database shows that calmodulin-like 5 (CALML5) is a protein-coding gene located at 10p15.1, which encodes a calcium-binding protein expressed in the epidermis and associated with the calmodulin family of calcium-binding proteins. It is abundantly expressed in the reconstructed epidermis and limited to the differentiated keratinocytes. In addition, it binds to transglutaminase 3, a key enzyme involved in the terminal differentiation of keratinocytes. As a part of the calcium signal transduction pathway, calmodulin regulates the regulation of numerous enzymes, ion channels, aquaporins, and other proteins through calcium binding[32,33]. Activation of calmodulin requires calcium binding[32-34]. There are many protein kinases in the enzymes activated by the calmodulin-calcium complex, such as myosin light chain kinase and calmodulin-dependent protein kinase and phosphatase[32,34], together with CCP110 and Centrin, which are involved in the regulation of centrosome cycle and the genetic pathway through cytokinesis[32]. Calcium and calmodulin-dependent protein kinase may play an important part in the cellular control of insulin secretion[35], therefore, the gene may be related to the occurrence and development of NAFLD through insulin.
This study found that the interactions between CALML5 rs10904516, COX11 rs17209882, and SCD5 rs3733228 were significantly associated with NAFLD in children with obesity. The GeneCards database shows that the COX11 is located on 17q22, which is a protein-coding gene that plays a role in some terminal stages of cytochrome C oxidase synthesis. Thus, the binding of COX11 to Cu (I) is important. It receives copper ions from COX17 and presents them to COX1 to maintain the oxidative respiratory chain[36]. COX is the terminal component of the mitochondrial respiratory chain that catalyzes the transfer of electrons from reduced cytochrome C to oxygen. This component is a heteromeric complex comprising three catalytic subunits encoded by mitochondrial genes and multiple structural subunits encoded by nuclear genes. NAFLD is associated with liver mitochondrial dysfunction characterized by reduced adenosine triphosphate (ATP) synthesis and increased degradation of liver oxidative phosphorylation subunits leads to mitochondrial damage in NAFLD mice[37]. Knocking down COX11 can reduce ATP derived from respiration in cells[38]; therefore, this gene may also be related to NAFLD.
The GeneCards database shows that SCD5 is located on 4q21.22, a protein-coding gene. SCD is an integral membrane protein of the endoplasmic reticulum that catalyzes the formation of monounsaturated fatty acids from saturated fatty acids, and is associated with congenital generalized lipodystrophy type 3 (CGL3). SCD may be a key regulator of energy metabolism and may play a role in obesity and dyslipidemia[39]. SCD5 is a major regulator of fat distribution and plays an important role in determining the accumulation of visceral adipose tissue in the abdomen alone[40]. In addition, SCD5 can produce a mixture of C16:1 and C18:1 unsaturated fatty acids[39,41]. A polymorphism in the 3-UTR of the SCD5 gene may be associated with hepatocellular carcinoma in Korean men, according to a Korean study[42]. In each gene database, no functional annotations related to ECI2 and C6orf201 genes was found, and related functional exploration is required in the future.
This study showed that CES5A, RAB11FIP1, ANXA7, SCG2, GANC, SPINT1, TTC23L, PRKAG2, and ABCC8 are not associated with NAFLD in children with obesity. Studies have shown that SPINT1 may be associated with immune infiltration, fibrosis progression, and activity scores[43], while the other genes have not been reported.
There is consistency among different populations and different genotypes may lead to the early onset of NAFLD. This study has several strengths. First, these genes are associated with susceptibility to NAFLD in children with obesity in China. Secondly, these genes may lead to an earlier onset of NAFLD. Third, the sample size of this study was large and had high statistical efficiency. Fourth, this study used WES to compensate for the lack of heritability loss caused by the genome-wide association analysis. However, there are still some limitations. First, participants were recruited from a hospital, which may limit the generalizability of this study. Further multicenter studies are needed to validate our results, which can provide more credibility. Second, this study did not use histological methods to verify the diagnosis of NAFLD because a noninvasive assessment is more feasible in clinical practice. Therefore, further histological studies are needed to confirm our results in the future, including with non-alcoholic fatty liver and non-alcoholic steatohepatitis. Third, our study was limited by its case-control design and we could not clarify the causal relationship between related genes and NAFLD.
-
Our results suggest that ECI2 rs2326408, C6orf201 rs659305, and CALML5 rs10904516 polymorphisms are associated with NAFLD in children with obesity. The interactions between CALML5 rs10904516, COX11 rs17209882, and SCD5 rs3733228 from the common variant were significantly associated with the occurrence of NAFLD in children with obesity, suggesting that novel genetic variants may be involved in its pathogenesis.
Exploration of New Susceptible Genes Associated with Non-Alcoholic Fatty Liver Disease among Children with Obesity using Whole Exome Sequencing
doi: 10.3967/bes2025.045
- Received Date: 2024-06-21
- Accepted Date: 2025-01-07
-
Key words:
- Non-alcoholic fatty liver disease /
- Susceptible genes /
- Interaction /
- Single nucleotide polymorphism /
- Whole-exome sequencing /
- Obese children
Abstract:
All authors disclosed no relevant relationships.
Written informed consent was obtained from each participant and their parents. Ethical approval was obtained from the Ethics Committee of the Xiangya School of Public Health, Central South University (No. XYGW-2018-04).
&These authors contributed equally to this work.
| Citation: | Xiongfeng Pan, Cailian Wei, Jiayou Luo, Junxia Yan, Xiang Xiao, Jie Wang, Yan Zhong, Miyang Luo. Exploration of New Susceptible Genes Associated with Non-Alcoholic Fatty Liver Disease among Children with Obesity using Whole Exome Sequencing[J]. Biomedical and Environmental Sciences. doi: 10.3967/bes2025.045

|

 Quick Links
 DownLoad: