
-
Considering the dramatic increase in the global population aging trend, sarcopenia, a condition associated with aging, has emerged as a critical concern owing to its rising prevalence and detrimental effects on the older population[1]. Sarcopenia is a progressive disease characterized by a widespread reduction in skeletal muscle mass associated with aging, accompanied by diminished muscle strength and/or compromised physical function[2]. Sarcopenia has been linked to various physiological and clinical consequences, including mobility limitations[3], physical disabilities[4], depression[5], and increased mortality[6], which contribute to a heightened economic burden on healthcare systems and pose significant challenges to public health.
As one of the primary components for evaluating sarcopenia, skeletal muscle mass constitutes approximately 40% of an individual’s total body mass and exhibits the capacity for adaptation, changing dynamically in response to physical activity, load, disease, and aging[7,8]. A pronounced decrease in muscle mass can be observed after the age of 60[9]. The molecular mechanisms that mediate the process of muscle mass reduction remain inadequately defined. Various factors may participate in the pathogenic mechanisms underlying the reduction in muscle mass, including oxidative stress, mitochondrial damage, endocrine abnormalities, undernutrition, and hormonal fluctuations[10-13]. Chronic low-level inflammation, commonly observed in the older population, significantly contributes to the progression of muscle mass reduction, among the diverse pathological mechanisms associated with this condition[14,15].
Different inflammatory cytokines have been identified as being linked to the reduction of muscle mass, including C-reactive protein, interleukin-6 (IL-6), and tumor necrosis factor alpha (TNF-α), which have also been recognized as predictive biomarkers for a common chronic conditions and mortality rates among older individuals[16,17]. However, these inflammatory markers are not typically identified in community health centers when patients exhibit no indications of inflammation, and their use in clinical and research environments remains constrained. White blood cell (WBC) count, platelet (PLT) count, and their derivatives such as the PLT-to-WBC ratio (PWR) are recognized as valuable and economical markers of low-grade chronic inflammation and are frequently evaluated in diverse clinical settings. Recent evidence indicates that WBC count, PLT count, and PWR correlate with low muscle mass[18-20]. However, prior studies concerning the older population in China present several limitations, including small sample sizes, controversial results, a restricted geographical scope, and a significant lack of studies specifically targeting the population aged ≥ 80 years[21,22].
According to the data from Healthy Ageing and Biomarkers Cohort Study (HABCS), a representative, nationwide cross-sectional study, the present study aimed to evaluate the association between systemic inflammatory indices (WBC count, PLT count, and PWR) and muscle mass loss among community-dwelling older adults in China aged ≥ 65 years.
-
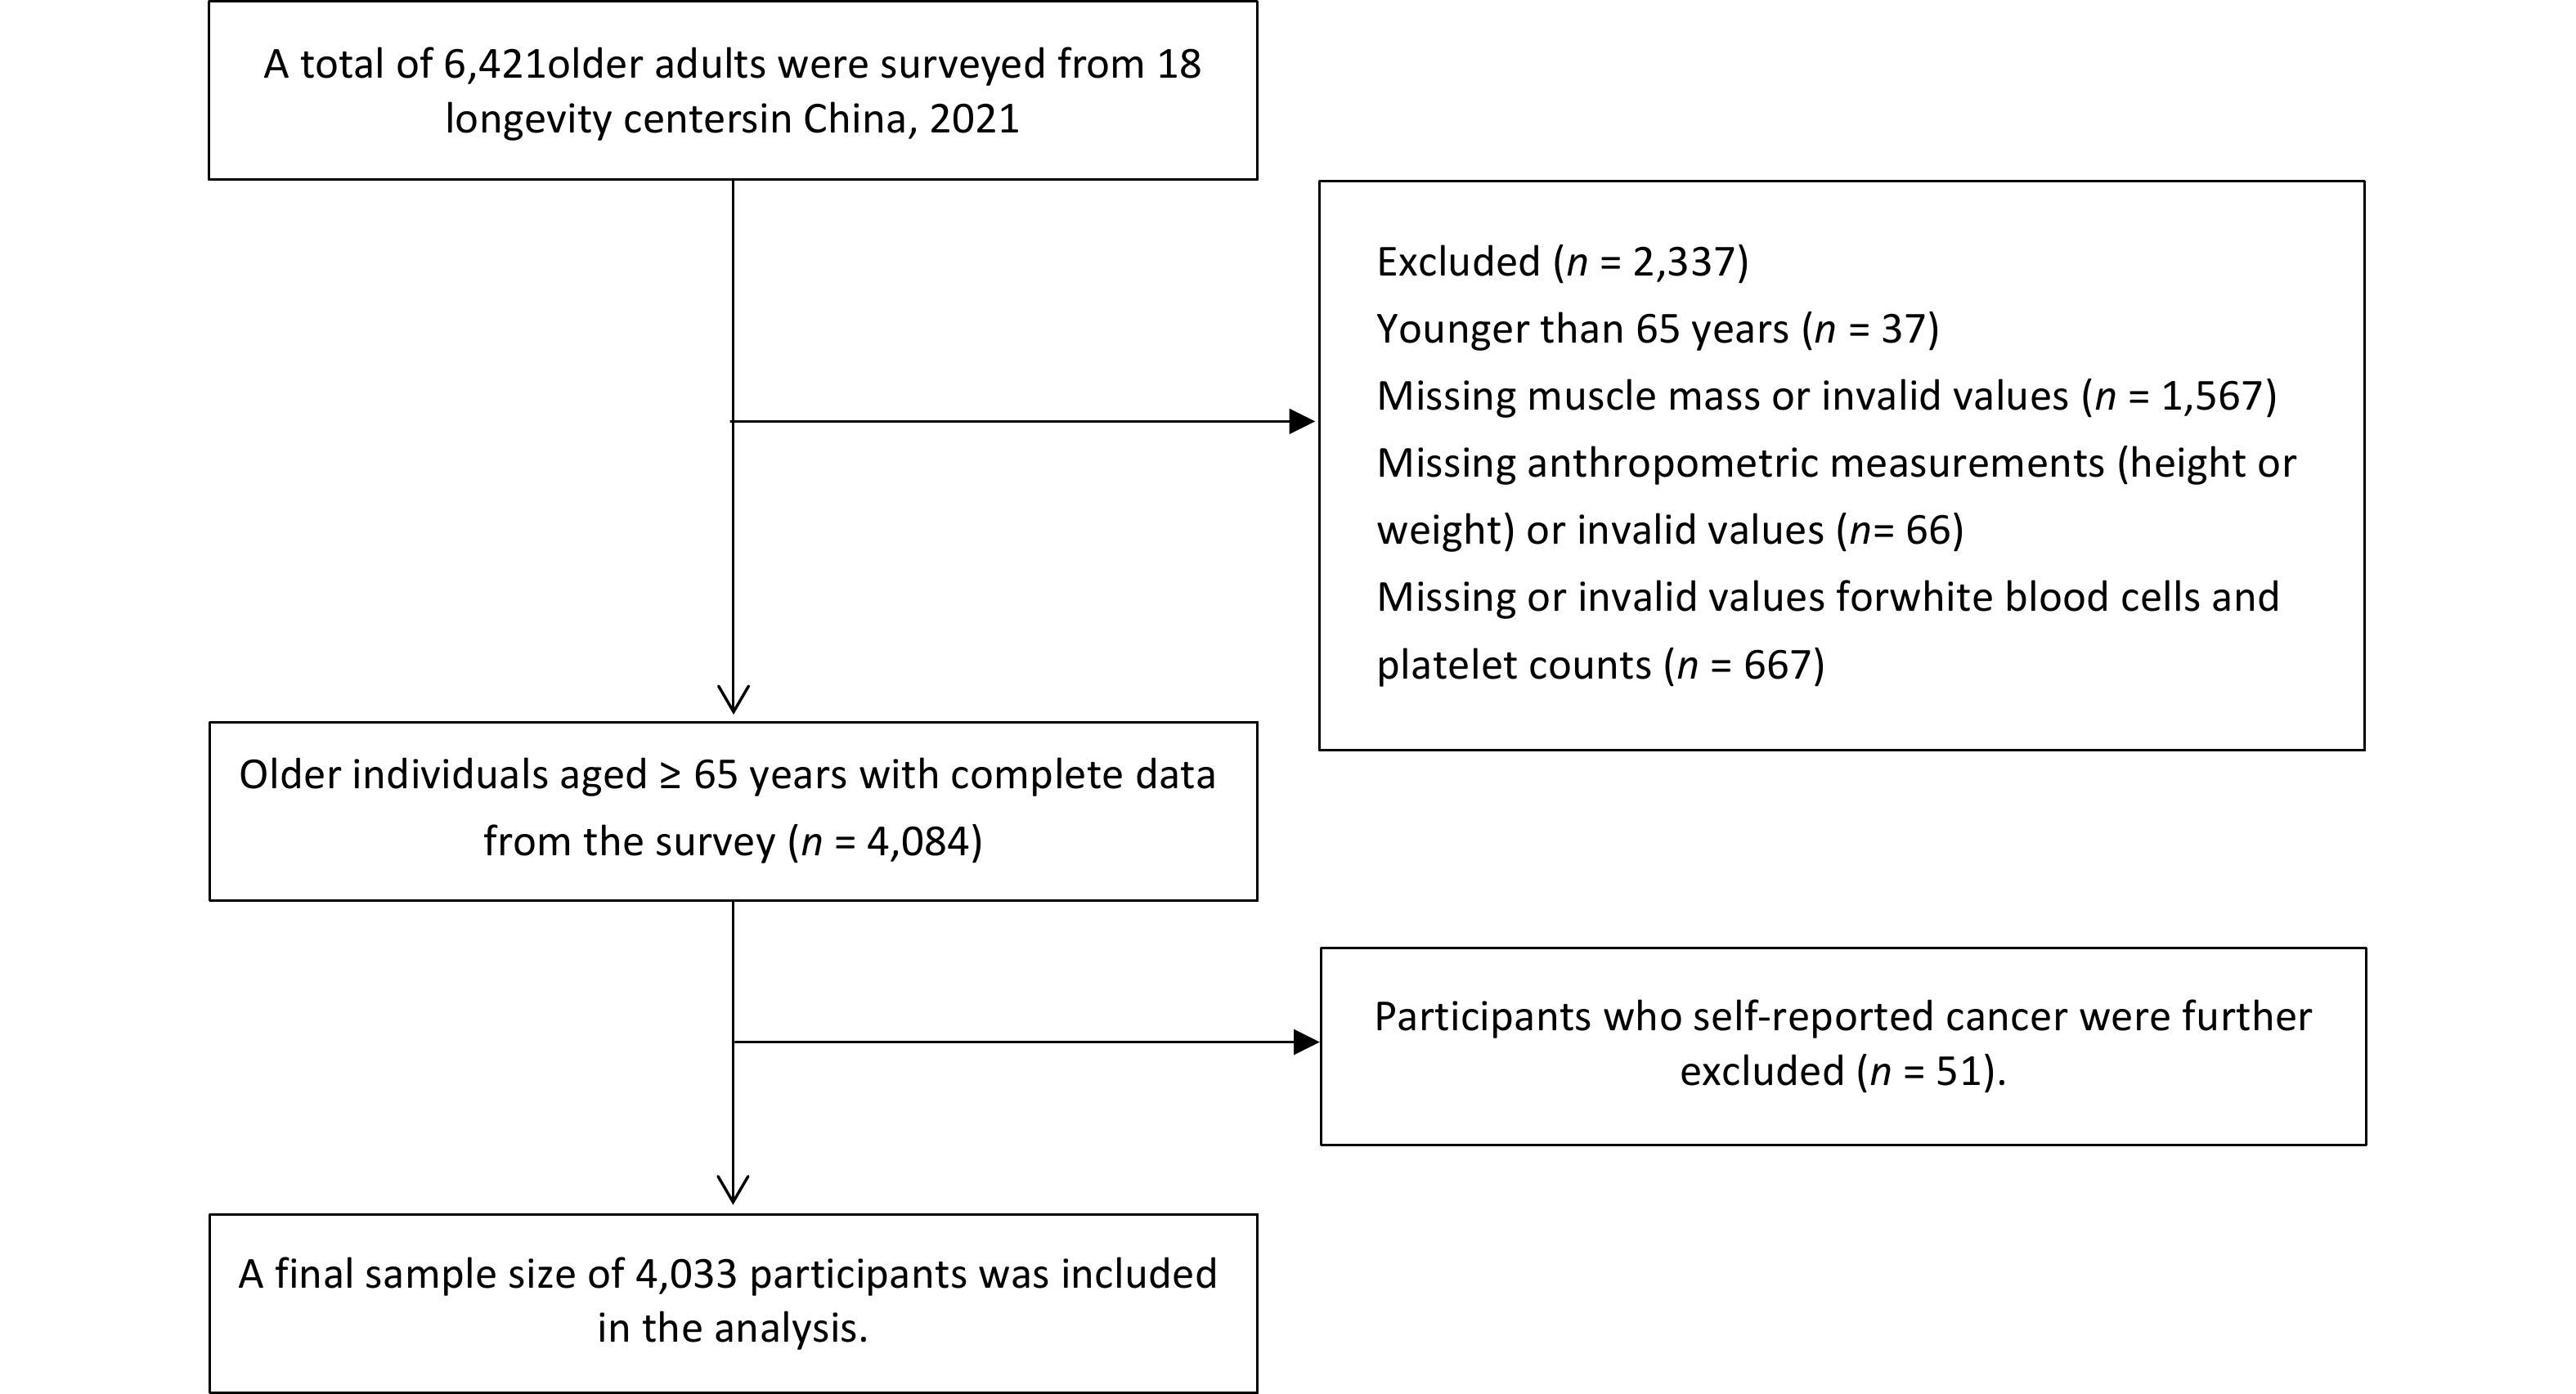
The HABCS is a dynamic, community-based cohort study initiated in 2008 that has expanded from nine longevity regions in 2008 to 18 longevity regions by 2021[23,24]. This study included data from a comprehensive cohort of participants in 2021 (n = 6,421). Participants aged < 65 years (n = 37), those lacking muscle mass or presenting invalid values (n = 1,567), those with missing or invalid anthropometric measurements (height or weight) (n = 66), and those with missing or invalid values for WBC and PLT counts (n = 667) were excluded. Additionally, 51 participants who self-reported a cancer diagnosis were excluded, resulting in a total sample size of 4,033 participants (Figure 1). The HABCS was approved by the Ethics Committee of the National Institute of Environmental Health, Chinese Center for Disease Control and Prevention (201922), and all participants or their proxy respondents provided informed consent.
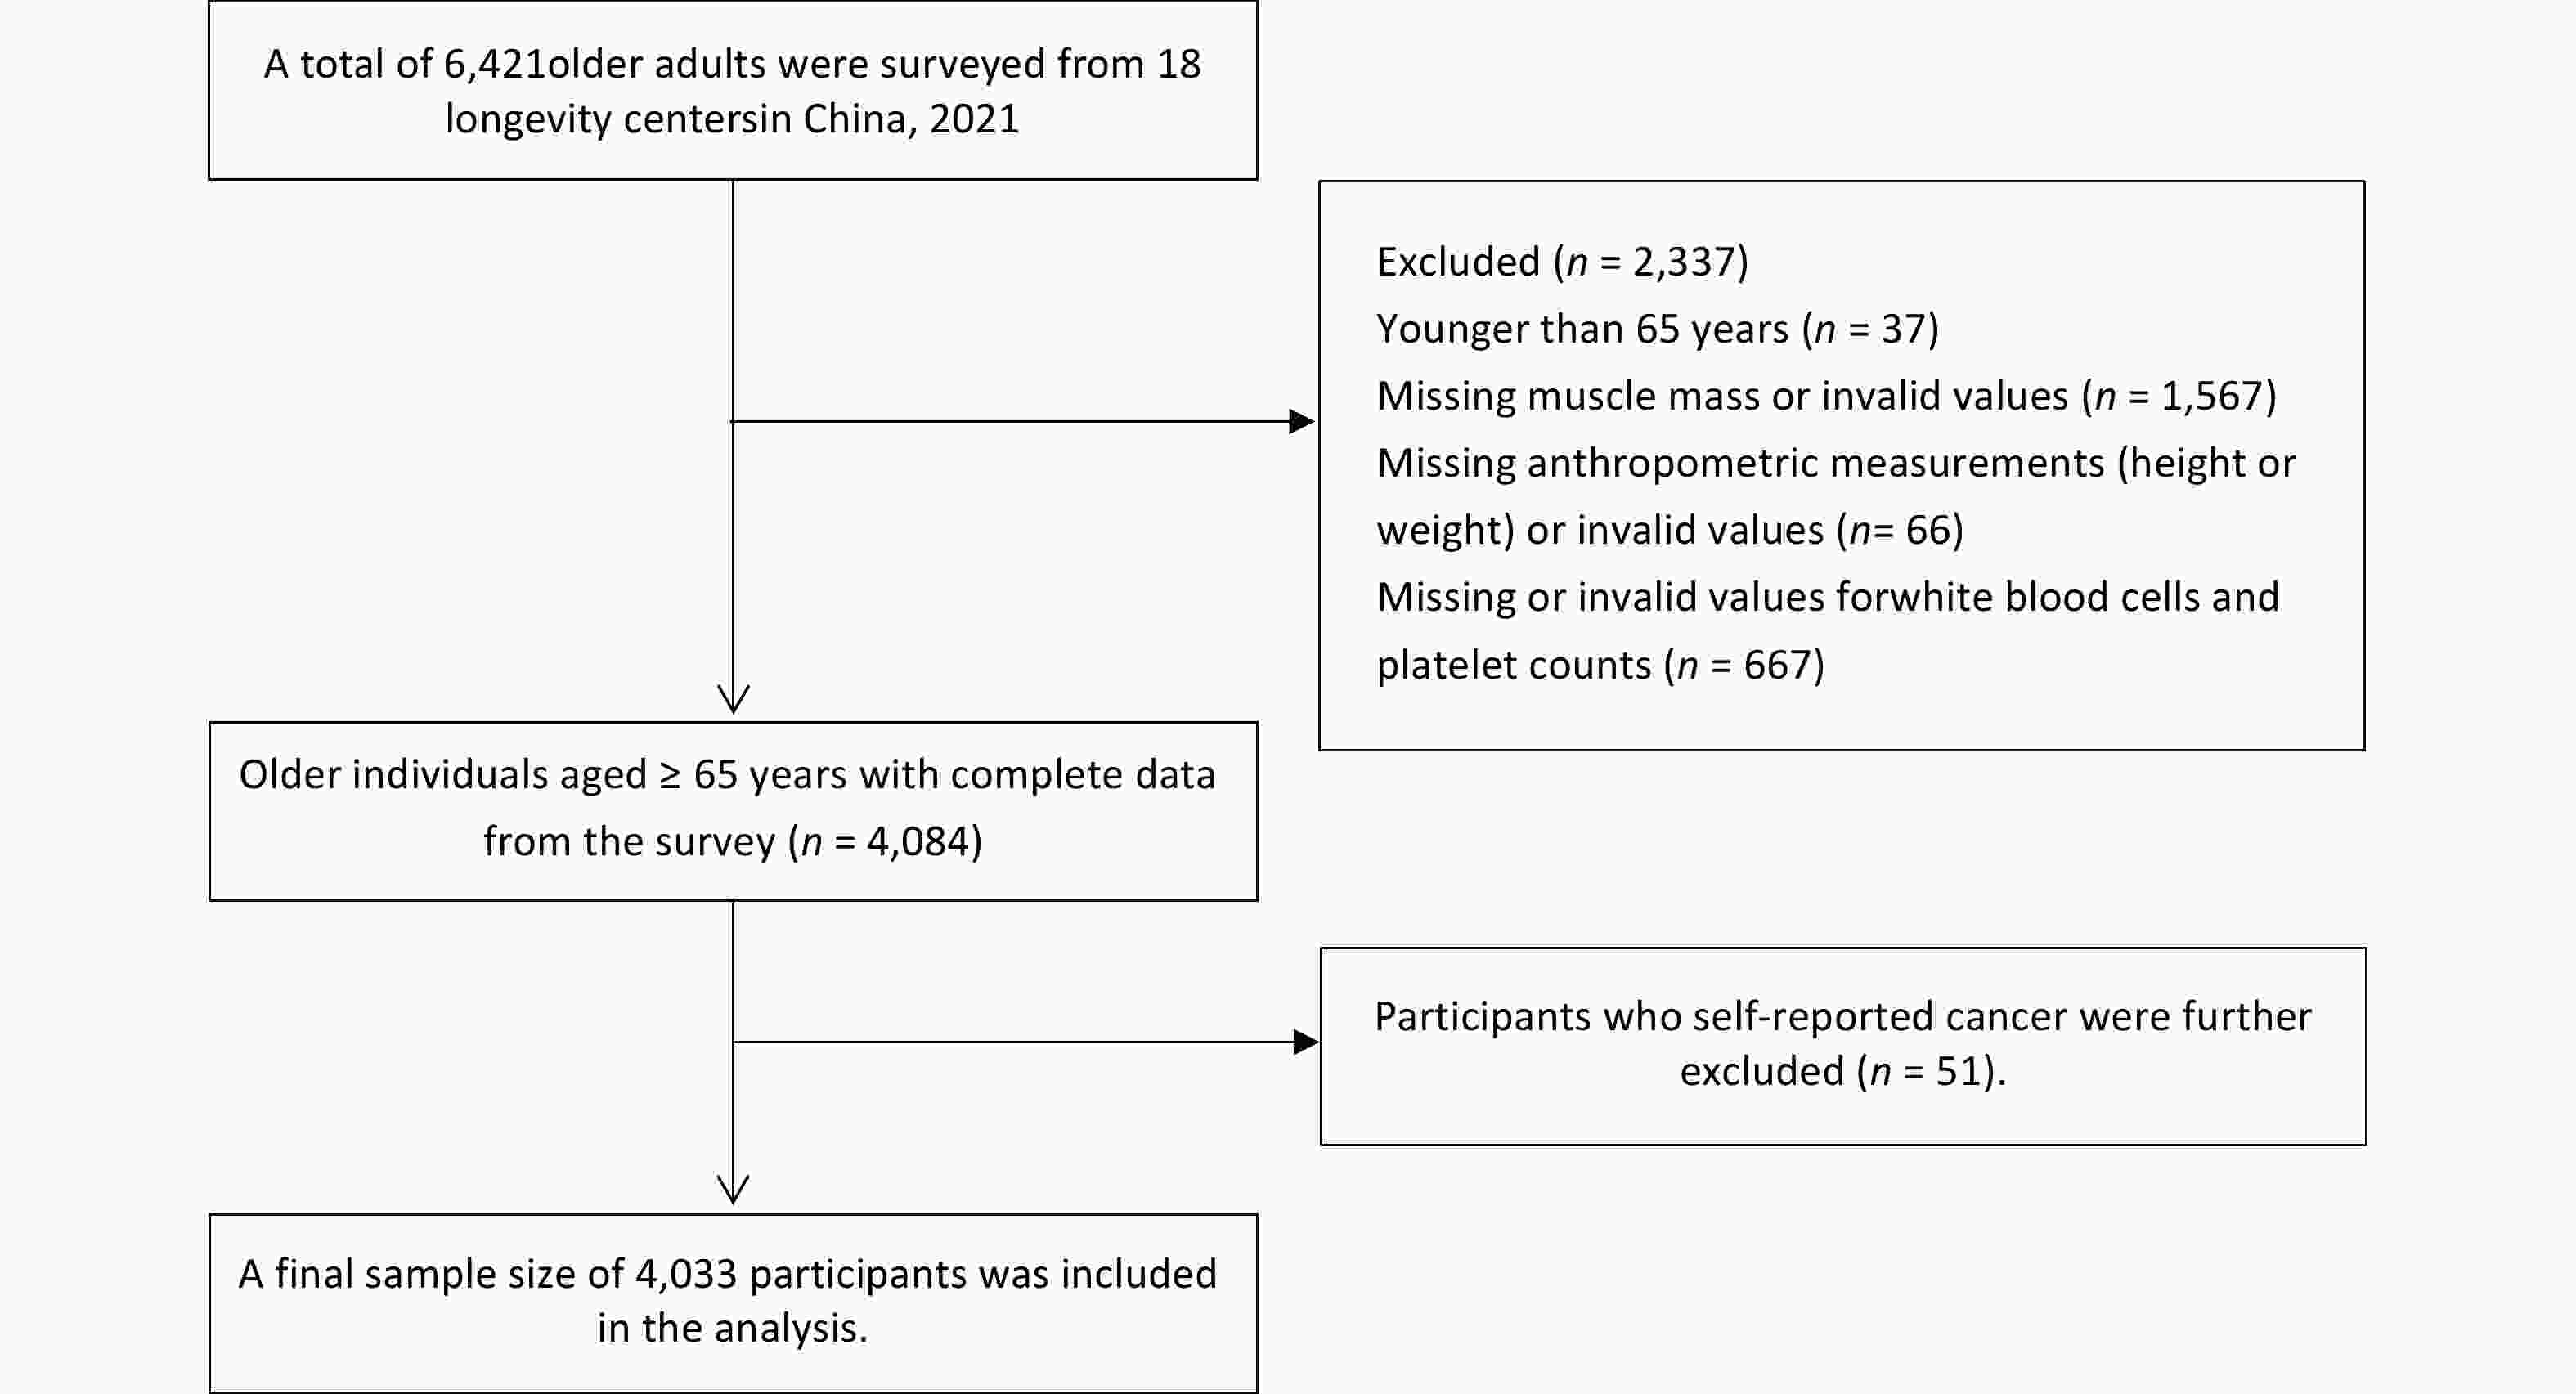
Figure 1. Flowchart of participant enrollment.
-
Trained medical personnel and physicians conducted anthropometric measurements, including height and weight, of all participants before breakfast. Height was measured to the nearest centimeter (cm) and weight to the nearest kilogram (kg) with participants dressed in light clothing. Body mass index (BMI) was calculated using the following equation: BMI = body weight/height2 (kg/m²). Systolic blood pressure (SBP) and diastolic blood pressure (DBP) were measured twice using a Baumanometer (Omron HEM-7211,Omron Healthcare Co., LtD, Matsusaka, Japan) on the right arm while the participants were seated. WBC and PLT counts were assessed from blood samples collected after a fasting period of > 8 h, using a fully automatic blood analyzer. PWR was calculated using the following equation: PWR = PLT/WBC. Participants were categorized by sex and subsequently divided into tertiles according to WBC counts, PLT counts, and PWR as follows: T1, < 5.19; T2, 5.19–6.51; and T3, ≥ 6.51 (109/L) for WBC counts in men; T1, < 5.02; T2, 5.02–6.30; and T3, ≥ 6.30 (109/L) for WBC counts in women; T1, < 158; T2, 158–210; and T3, ≥ 210 (109/L) for PLT counts in men; T1, < 172; T2, 172–227; and T3, ≥ 227 (109/L) for PLT counts in women; T1, < 26.84; T2, 26.84–35.81; and T3, ≥ 35.81 for PWR in men; and T1, < 29.80; T2, 29.80–39.58; and T3, ≥ 39.58 for PWR in women.
-
Muscle mass was evaluated using bioelectric impedance analysis (BIA) with InBodyDial H20 (InBody Co., LtD., Cheonan-si, South Korea), a home-based body composition measurement device developed in South Korea. This instrument assesses the impedance value of the entire body, which represents the vector sum of resistance and reactance, and computes various metrics including total muscle mass and fat mass. Muscle mass, when adjusted for BMI, is a more accurate predictor of adverse clinical outcomes in older populations than unadjusted muscle mass[25]. Therefore, in the current study, the total skeletal muscle mass index (TSMI), a relative index, was determined by dividing the total skeletal muscle mass by the BMI.
-
The sociodemographic indicators utilized in this study included age, sex, marital status (married or unmarried), and occupation (differentiating between farming and other professions). The lifestyle variables included smoking status, alcohol consumption, and BMI. The term “married” refers to individuals who are legally married regardless of cohabitation status. The category “other occupations” includes a range of professions, such as healthcare providers, educators, administrative personnel, service workers, laborers, military personnel, and those who are unemployed. Current smoking or alcohol consumption status was defined as active smoking or alcohol consumption. Additionally, we accounted for the presence of chronic diseases including hypertension, diabetes, ischemic heart disease, stroke, cerebrovascular disease, chronic respiratory diseases (such as bronchitis, emphysema, pneumonia, and asthma), arthritis, and dementia. Hypertension is defined as an SBP ≥ 140 mmHg or a DBP ≥ 90 mmHg, or as self-reported by individuals diagnosed with hypertension. Information regarding the aforementioned chronic diseases was obtained through self-reports from individuals who indicated that they had been diagnosed by a medical professional. The number of chronic diseases was classified into three categories: 0, 1, and 2.
-
Categorical variables are presented as numbers and percentages, and chi-square tests were used to compare the differences between groups by sex. Prior to conducting the analysis, the normality of continuous variables was assessed using the Shapiro–Wilk test. Thus, for continuous variables, the data are presented as medians (interquartile ranges [IQRs]), and differences between groups were evaluated using the Mann–Whitney U test. Bonferroni correction was applied to adjust the significance level for pairwise comparisons. The distributions of WBC count, PLT count, and PWR in older adults across various age groups were analyzed using generalized additive models for location, scale, and shape. Additionally, percentile curves (P5, P10, P25, P50, P75, P90, and P95) for WBC count, PLT count, and PWR were developed to illustrate age-related variations. To investigate the potential nonlinear or irregular relationships between TSMI and the three inflammatory markers, a restricted cubic spline (RCS) function was used with four knots located at the 5th, 35th, 65th, and 95th percentiles of WBC counts, PLT counts, and PWR. Multiple linear regression models were used to evaluate the associations between the three inflammatory indices and TSMI after controlling for various covariates. Inflammatory markers were examined as continuous (per SD increase) and categorical (utilizing tertile cutoff points) variables. Model 1 was adjusted for sex, age, occupation, and marital status. Model 2 included model 1 plus smoking status, alcohol consumption, and BMI. Model 3 included model 2 plus the number of chronic diseases. Effects were characterized by the coefficient of β and 95% confidence intervals (CIs) for muscle mass. A stratified analysis was performed to assess the potentially modifiable effects based on age (< 80 vs. ≥ 80 years), and sex (male vs. female). All analyses were conducted using the R software (version 4.3.0, Auckland, New Zealand), and two-tailed P < 0.05 were considered significant.
-
Table 1 provides an overview of the participants’ characteristics. Among the 4,033 older adults, the median (IQR) age was 81 (74–91) years, and 47.24% were male. The majority of participants were married (54.78%), and a significant proportion were farmers (83.32%). Smoking was reported by 762 participants (18.96%), whereas alcohol consumption was noted by 826 participants (20.62%). The median serum WBC count, PLT count, and PWR were 5.72 (IQR, 4.80–6.90) × 109/L, 193.00 (IQR, 150.00–235.00) × 109/L, and 33.06 (IQR, 25.76–40.94) × 109/L, respectively. Overall, the male participants in our study demonstrated lower PLT count, PWR and higher WBC count than their female counterparts (Table 1).
Characteristics Total population(n = 4,033) Men (n = 1,905) Women (n = 2,128) P value Age(years) 81 (74–91) 81 (74–89) 82 (74–92) < 0.001 Age group (years), n (%) 0.156 65–79 1,746 (43.29) 881 (46.25) 865 (40.65) ≥ 80 2,287 (56.71) 1,024 (53.75) 1,263 (59.35) Marital status, n (%) < 0.001 Married 2,208 (54.78) 1,285 (67.45) 923 (43.41) Single 1,823 (45.22) 620 (32.55) 1,203 (56.59) Occupation, n (%) < 0.001 farmer 3,248 (83.32) 1,377 (76.46) 1,871 (89.22) other 650 (16.68) 424 (23.54) 226 (10.78) Smoking, n (%) < 0.001 Yes 762 (18.96) 673 (35.46) 89 (4.19) None 3,258 (81.04) 1,225 (64.54) 2,033 (95.81) Alcohol, n (%) < 0.001 Yes 826 (20.62) 633 (33.42) 193 (9.14) None 3,179 (79.38) 1,261 (66.58) 1,918 (90.86) Hypertension, n (%) < 0.001 Yes 1784 (45.38) 770 (41.53) 1014 (48.82) No 2147 (54.62) 1084 (58.47) 1063 (51.18) Diabetes 0.036 Yes 376 (9.69) 157 (8.60) 219 (10.65) No 3506 (90.31) 1668 (91.40) 1838 (89.35) Dschemic heart disease, n (%) 0.004 Yes 438 (11.41) 177 (9.81) 261 (12.83) No 3401 (88.59) 1627 (90.19) 1774 (87.17) Stroke or CVD, n (%) 0.304 Yes 345 (8.97) 172 (9.50) 173 (8.50) No 3500 (91.03) 1638 (90.50) 1862 (91.50) Chronic respiratory diseases, n (%) < 0.001 Yes 333 (8.62) 210 (11.56) 123 (6.00) No 3532 (91.38) 1606 (88.44) 1926 (94.00) Arthritis, n (%) 0.003 Yes 545 (14.24) 223 (12.42) 322 (15.86) No 3281 (85.76) 1573 (87.58) 1708 (84.14) Anthropometrics Muscle mass (kg) 20.50 (17.30–23.90) 23.40 (20.50–26.30) 15.80 (18.30–20.80) < 0.001 Height (m) 1.54 (1.47–1.61) 1.61 (1.56–1.66) 1.49 (1.43–1.54) < 0.001 Weight (kg) 55.40 (47.30–64.00) 60.30 (52.50–67.90) 50.70 (43.70–59.30) < 0.001 BMI (kg/m2) 23.15 (20.65–25.77) 23.18 (20.77–25.62) 23.11 (20.49–25.93) 0.839 Biochemistry WBC (109/L) 5.72 (4.80–6.90) 5.82 (4.90–7.02) 5.63 (4.73–6.80) < 0.001 PLT (109/L) 193.00 (150.00–235.00) 185.00 (146.00–224.00) 200.00 (154.00–245.00) < 0.001 PWR (109/L) 33.06 (25.76–40.94) 31.31 (24.49–38.89) 34.85 (27.22–43.14) < 0.001 Note. Values are expressed as the median (IQR) for continuous variables, and as numbers with corresponding percentages for categorical variables. CVD,cerebrovascular disease; BMI, body mass index; WBC, white blood cell; PLT, platelet; PWR, PLT-to-WBC ratio. Table 1. Characteristics of study participants from the Healthy Ageing and Biomarkers Cohort Study survey in 2021 according to sex
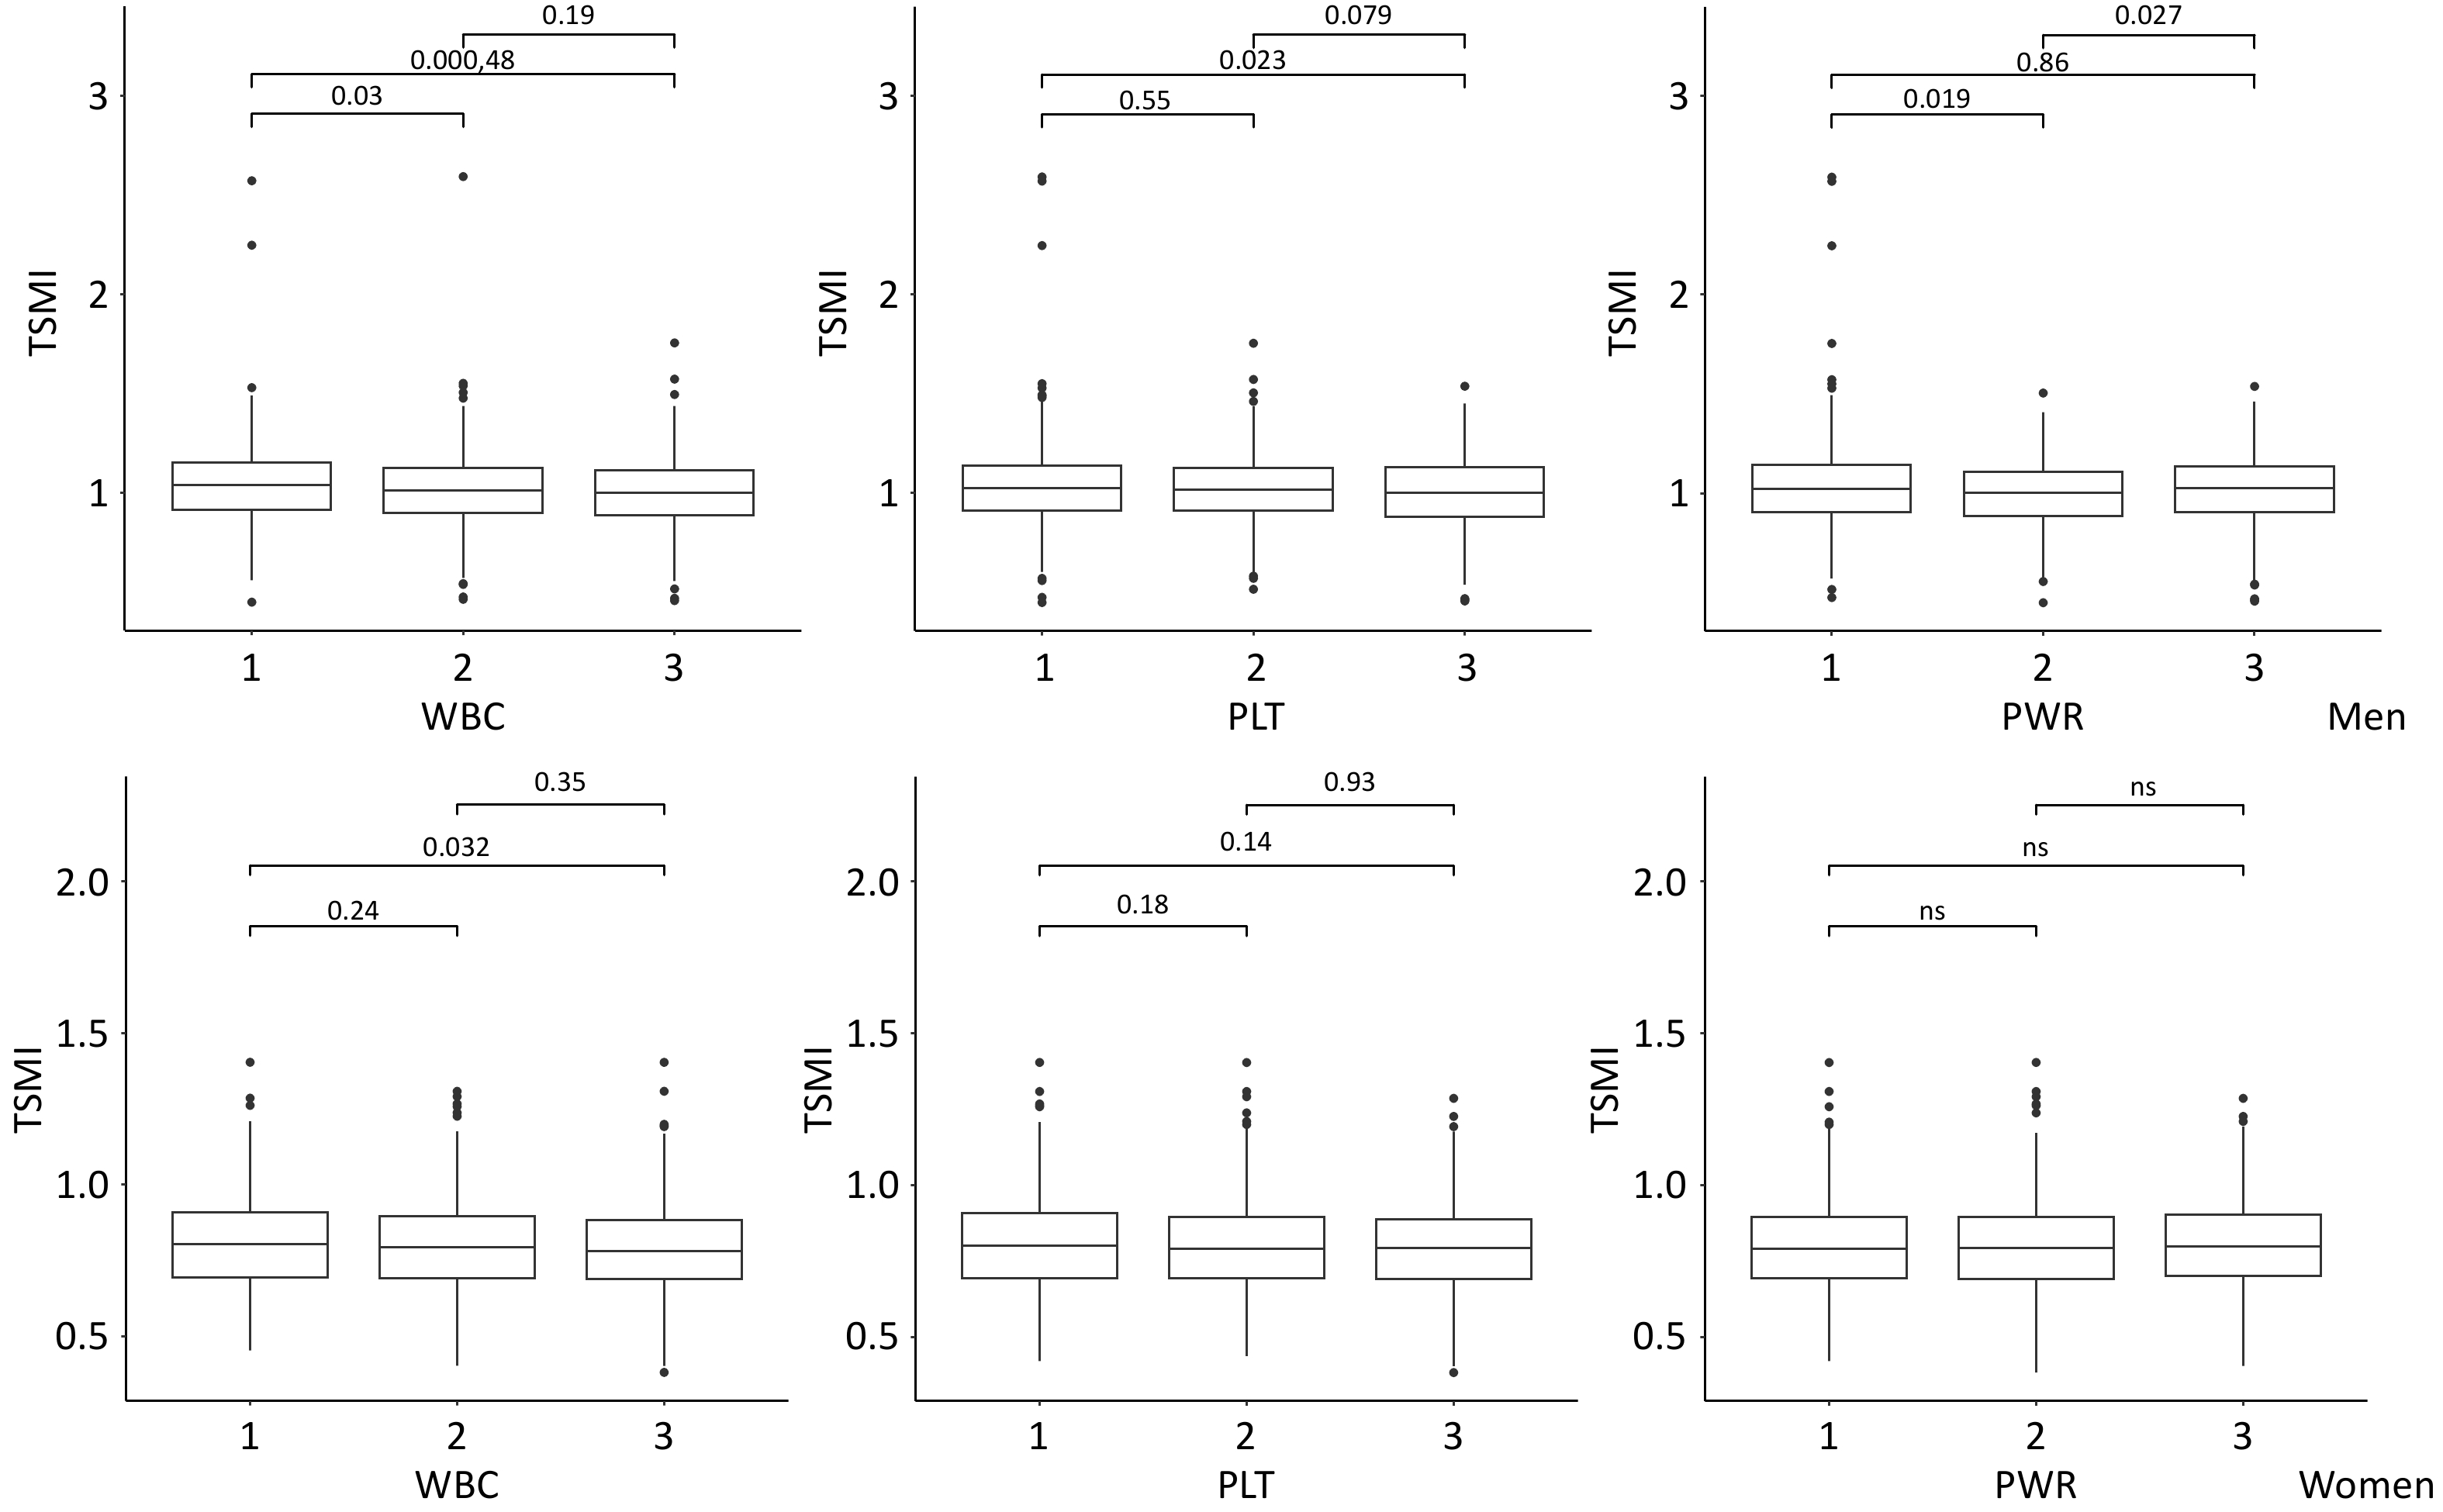
Figure 2 presents the TSMI in older men and women, categorized by tertiles of WBC count, PLT count, and PWR. TSMI was significantly lower in the highest tertile of WBC count than in the lowest tertile, with this association achieving statistical significance in both sex. Among male participants, the median TSMI (IQR) was 1.039 (0.913–1.150) at T1 and 0.999 (0.889–1.111) at T3 (P < 0.001), whereas female participants demonstrated median TSMI values (IQR) of 0.805 (0.696–0.910) at T1 and 0.782 (0.691–0.885) at T3 (P = 0.032). Interestingly, the lowest TSMI value was observed in the highest tertile of PLT count, although this trend was statistically significant only in female participants. Females exhibited a median TSMI value (IQR) of 0.801 (0.694–0.907) at T1 compared to 0.792 (0.692–0.886) at T3 (P = 0.140).

Figure 2. TSMI based on the tertiles of PLT count, WBC count, and PLT-to-WBC ratio.
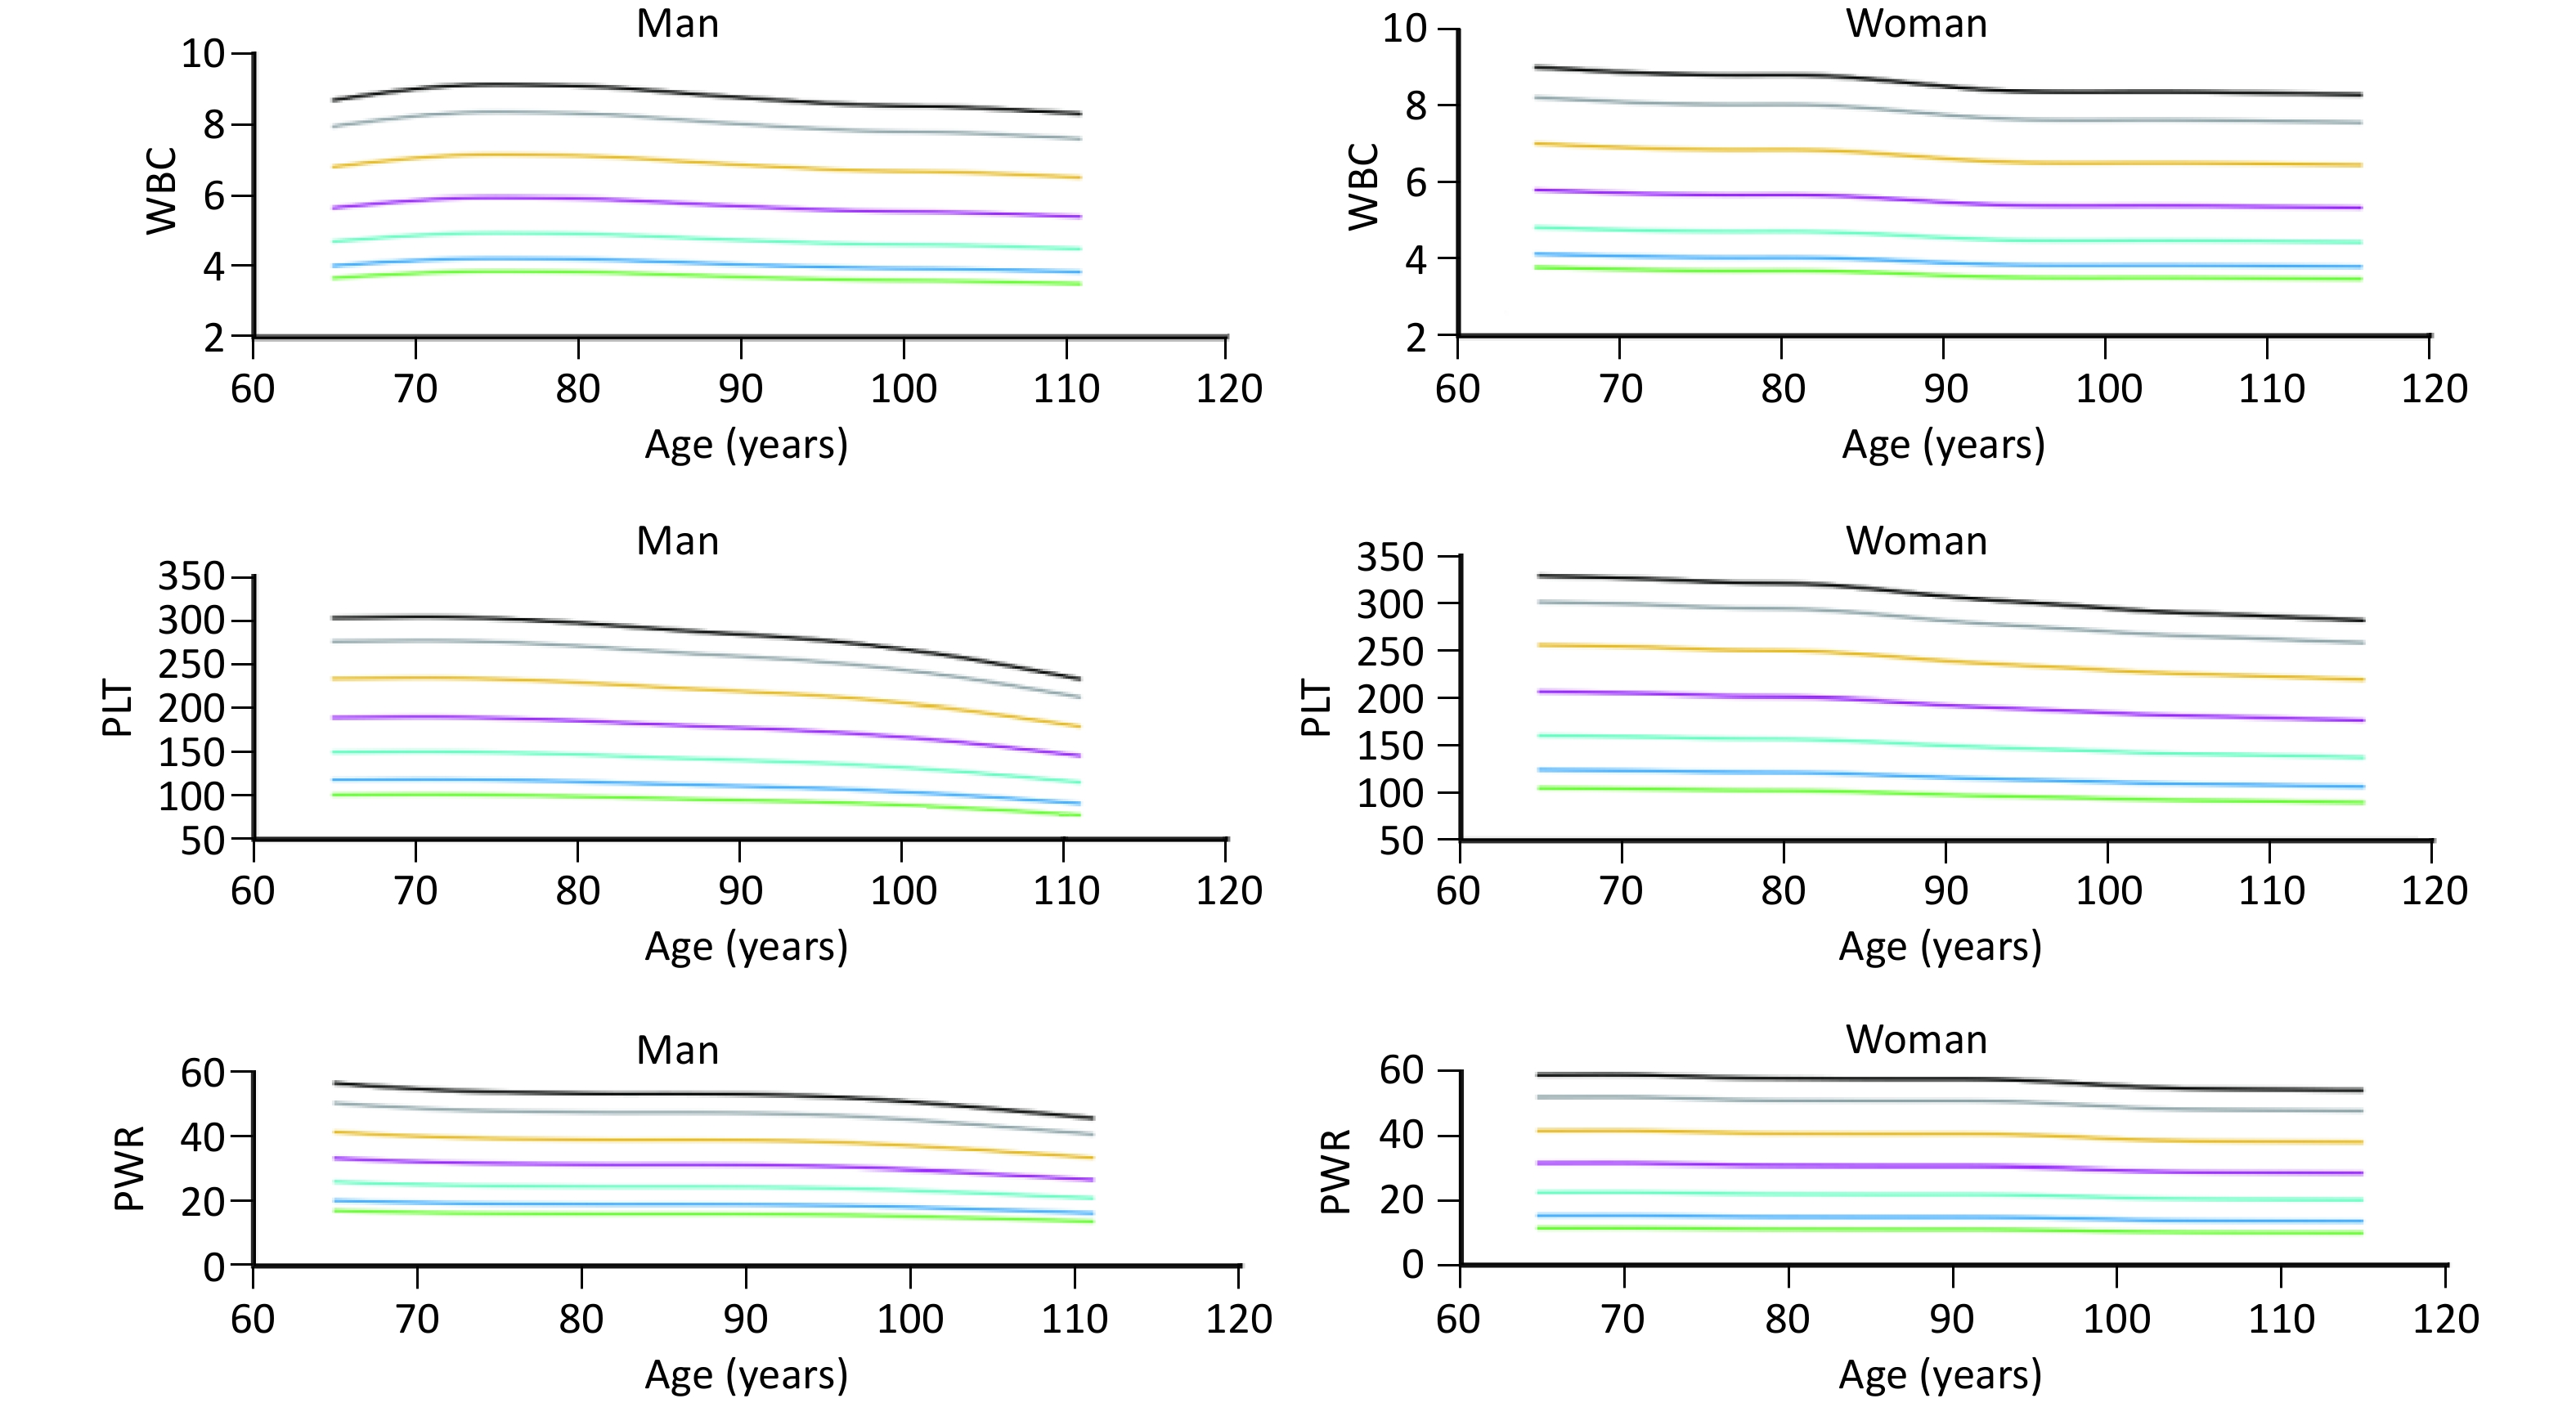
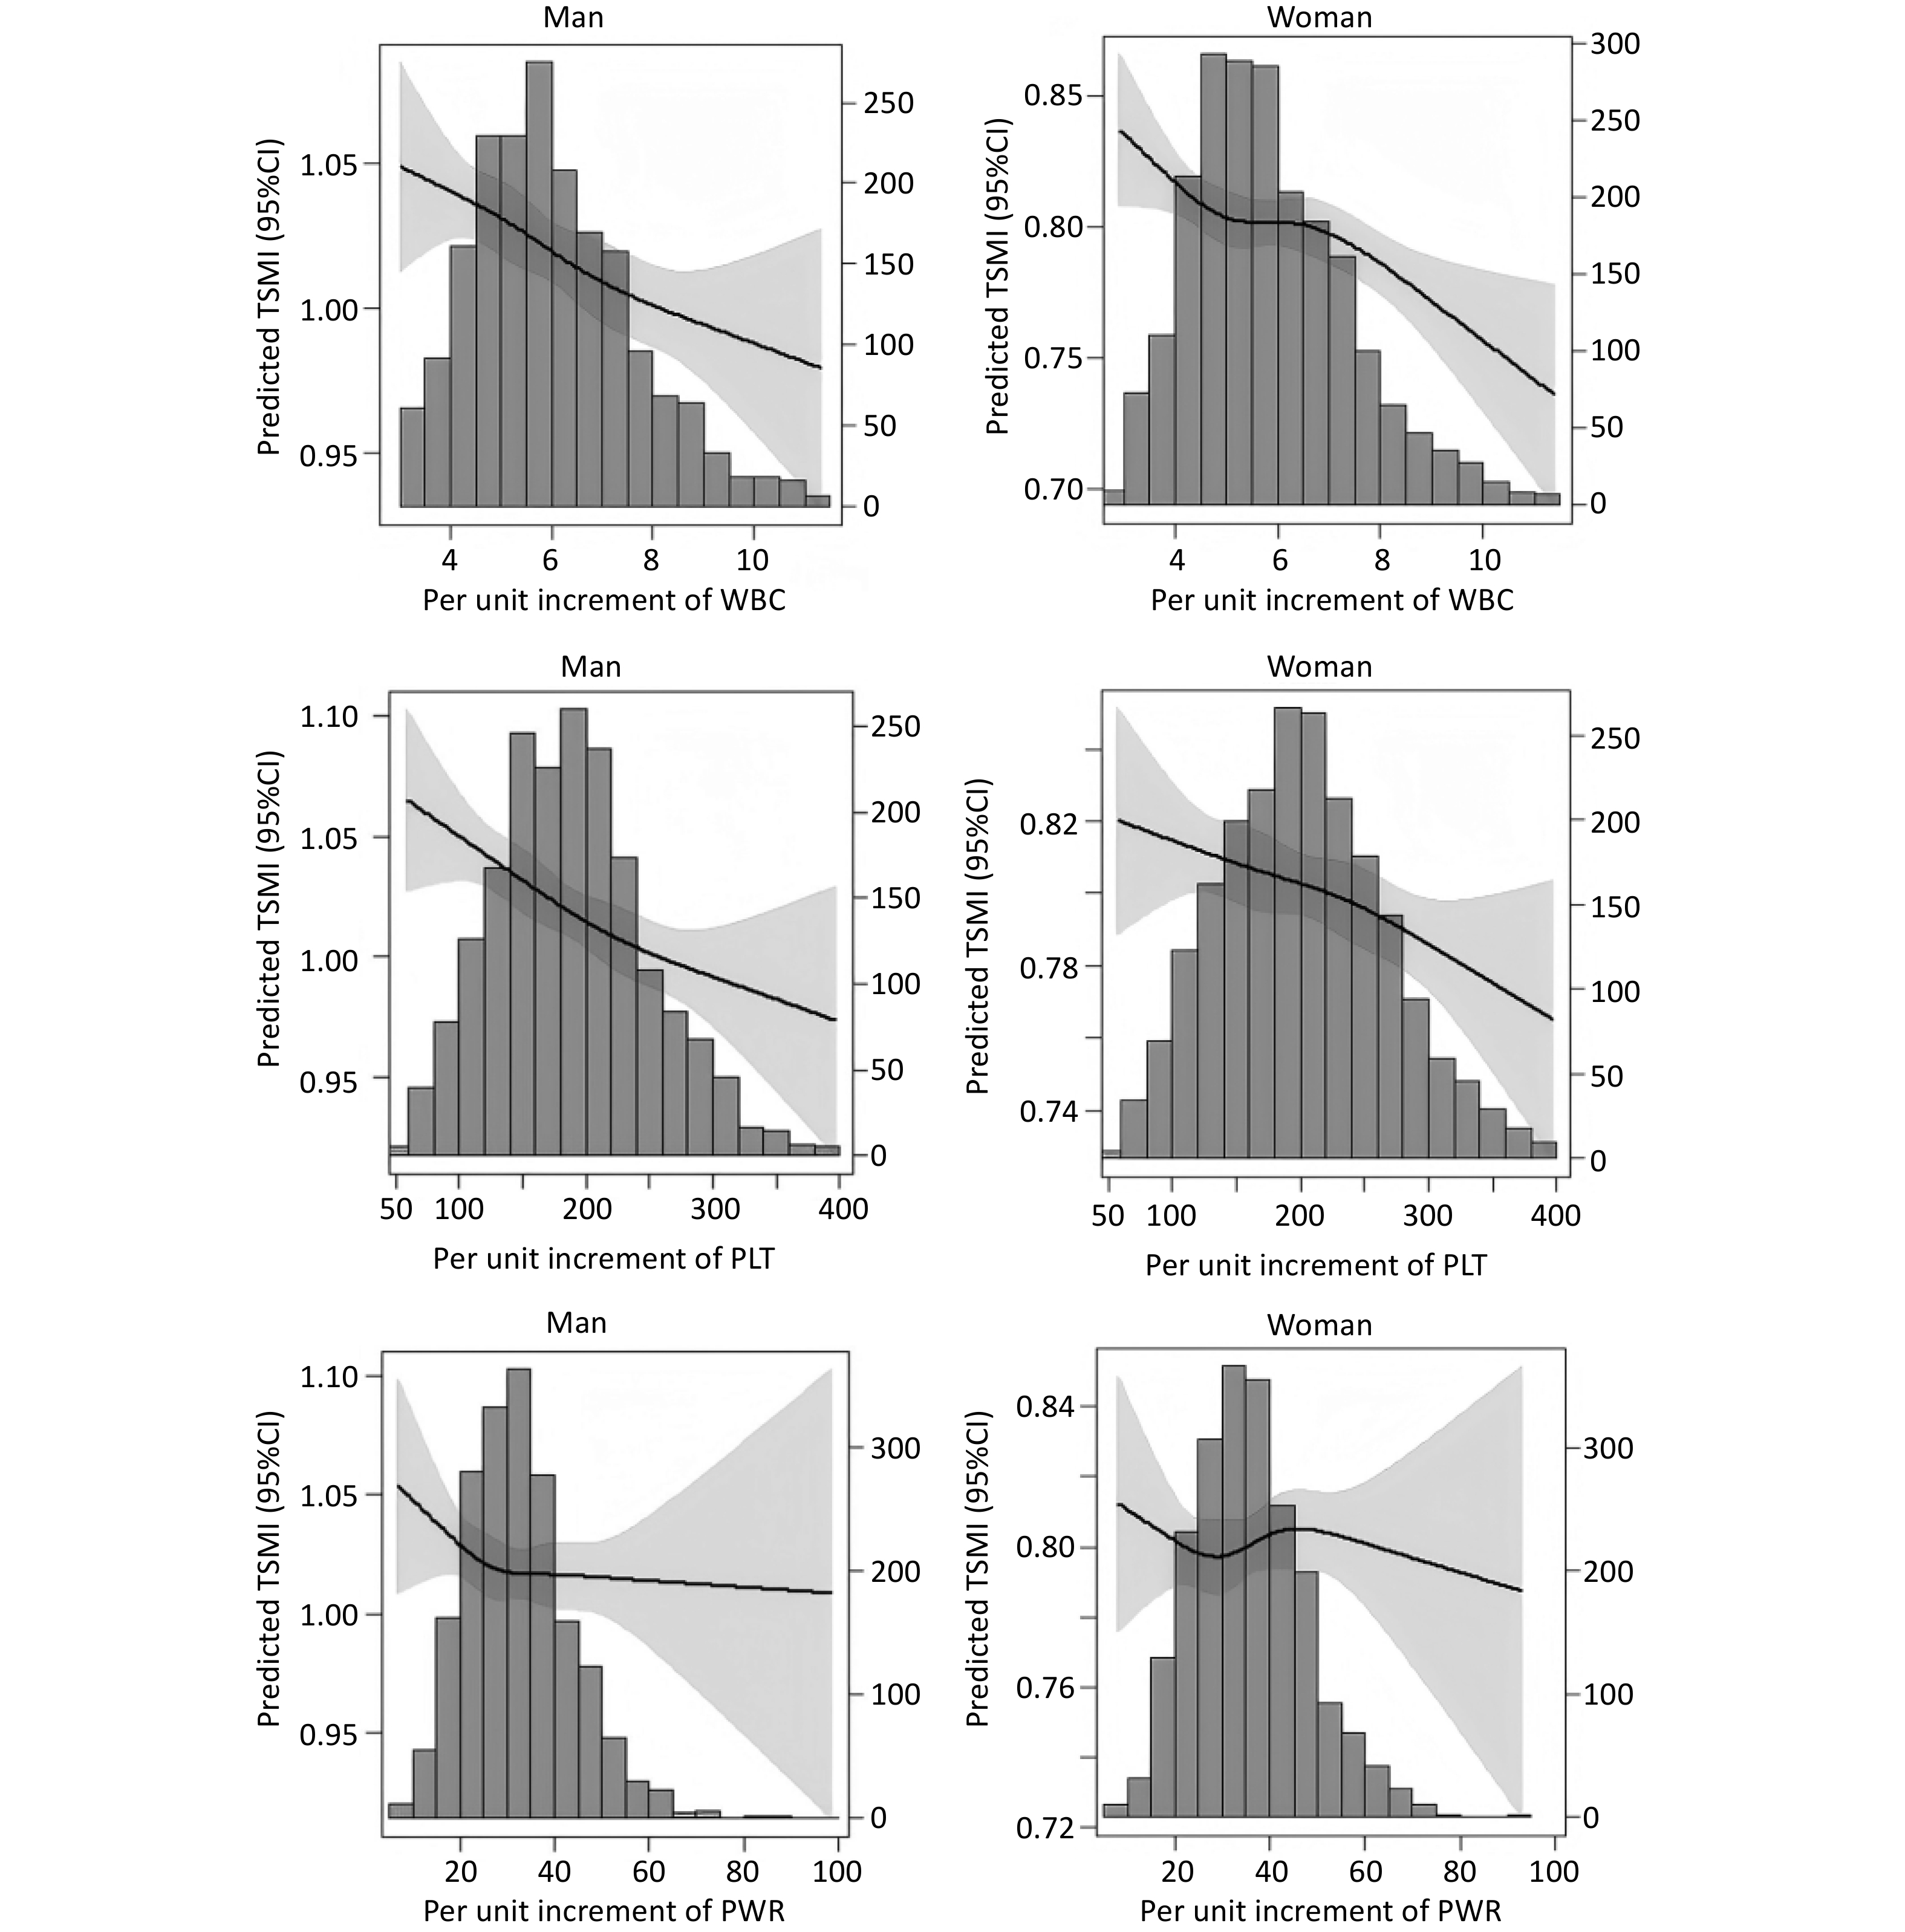
The percentile curve indicated that PLT count decreased at a rapid rate with advancing age both in older men and women. Conversely, WBC count and PWR exhibited a slower rate of decline with age in both sexes (Figure 3). The RCS curves showed linear associations between TSMI and WBC, PLT count, and PWR in both sexes (Figure 4).
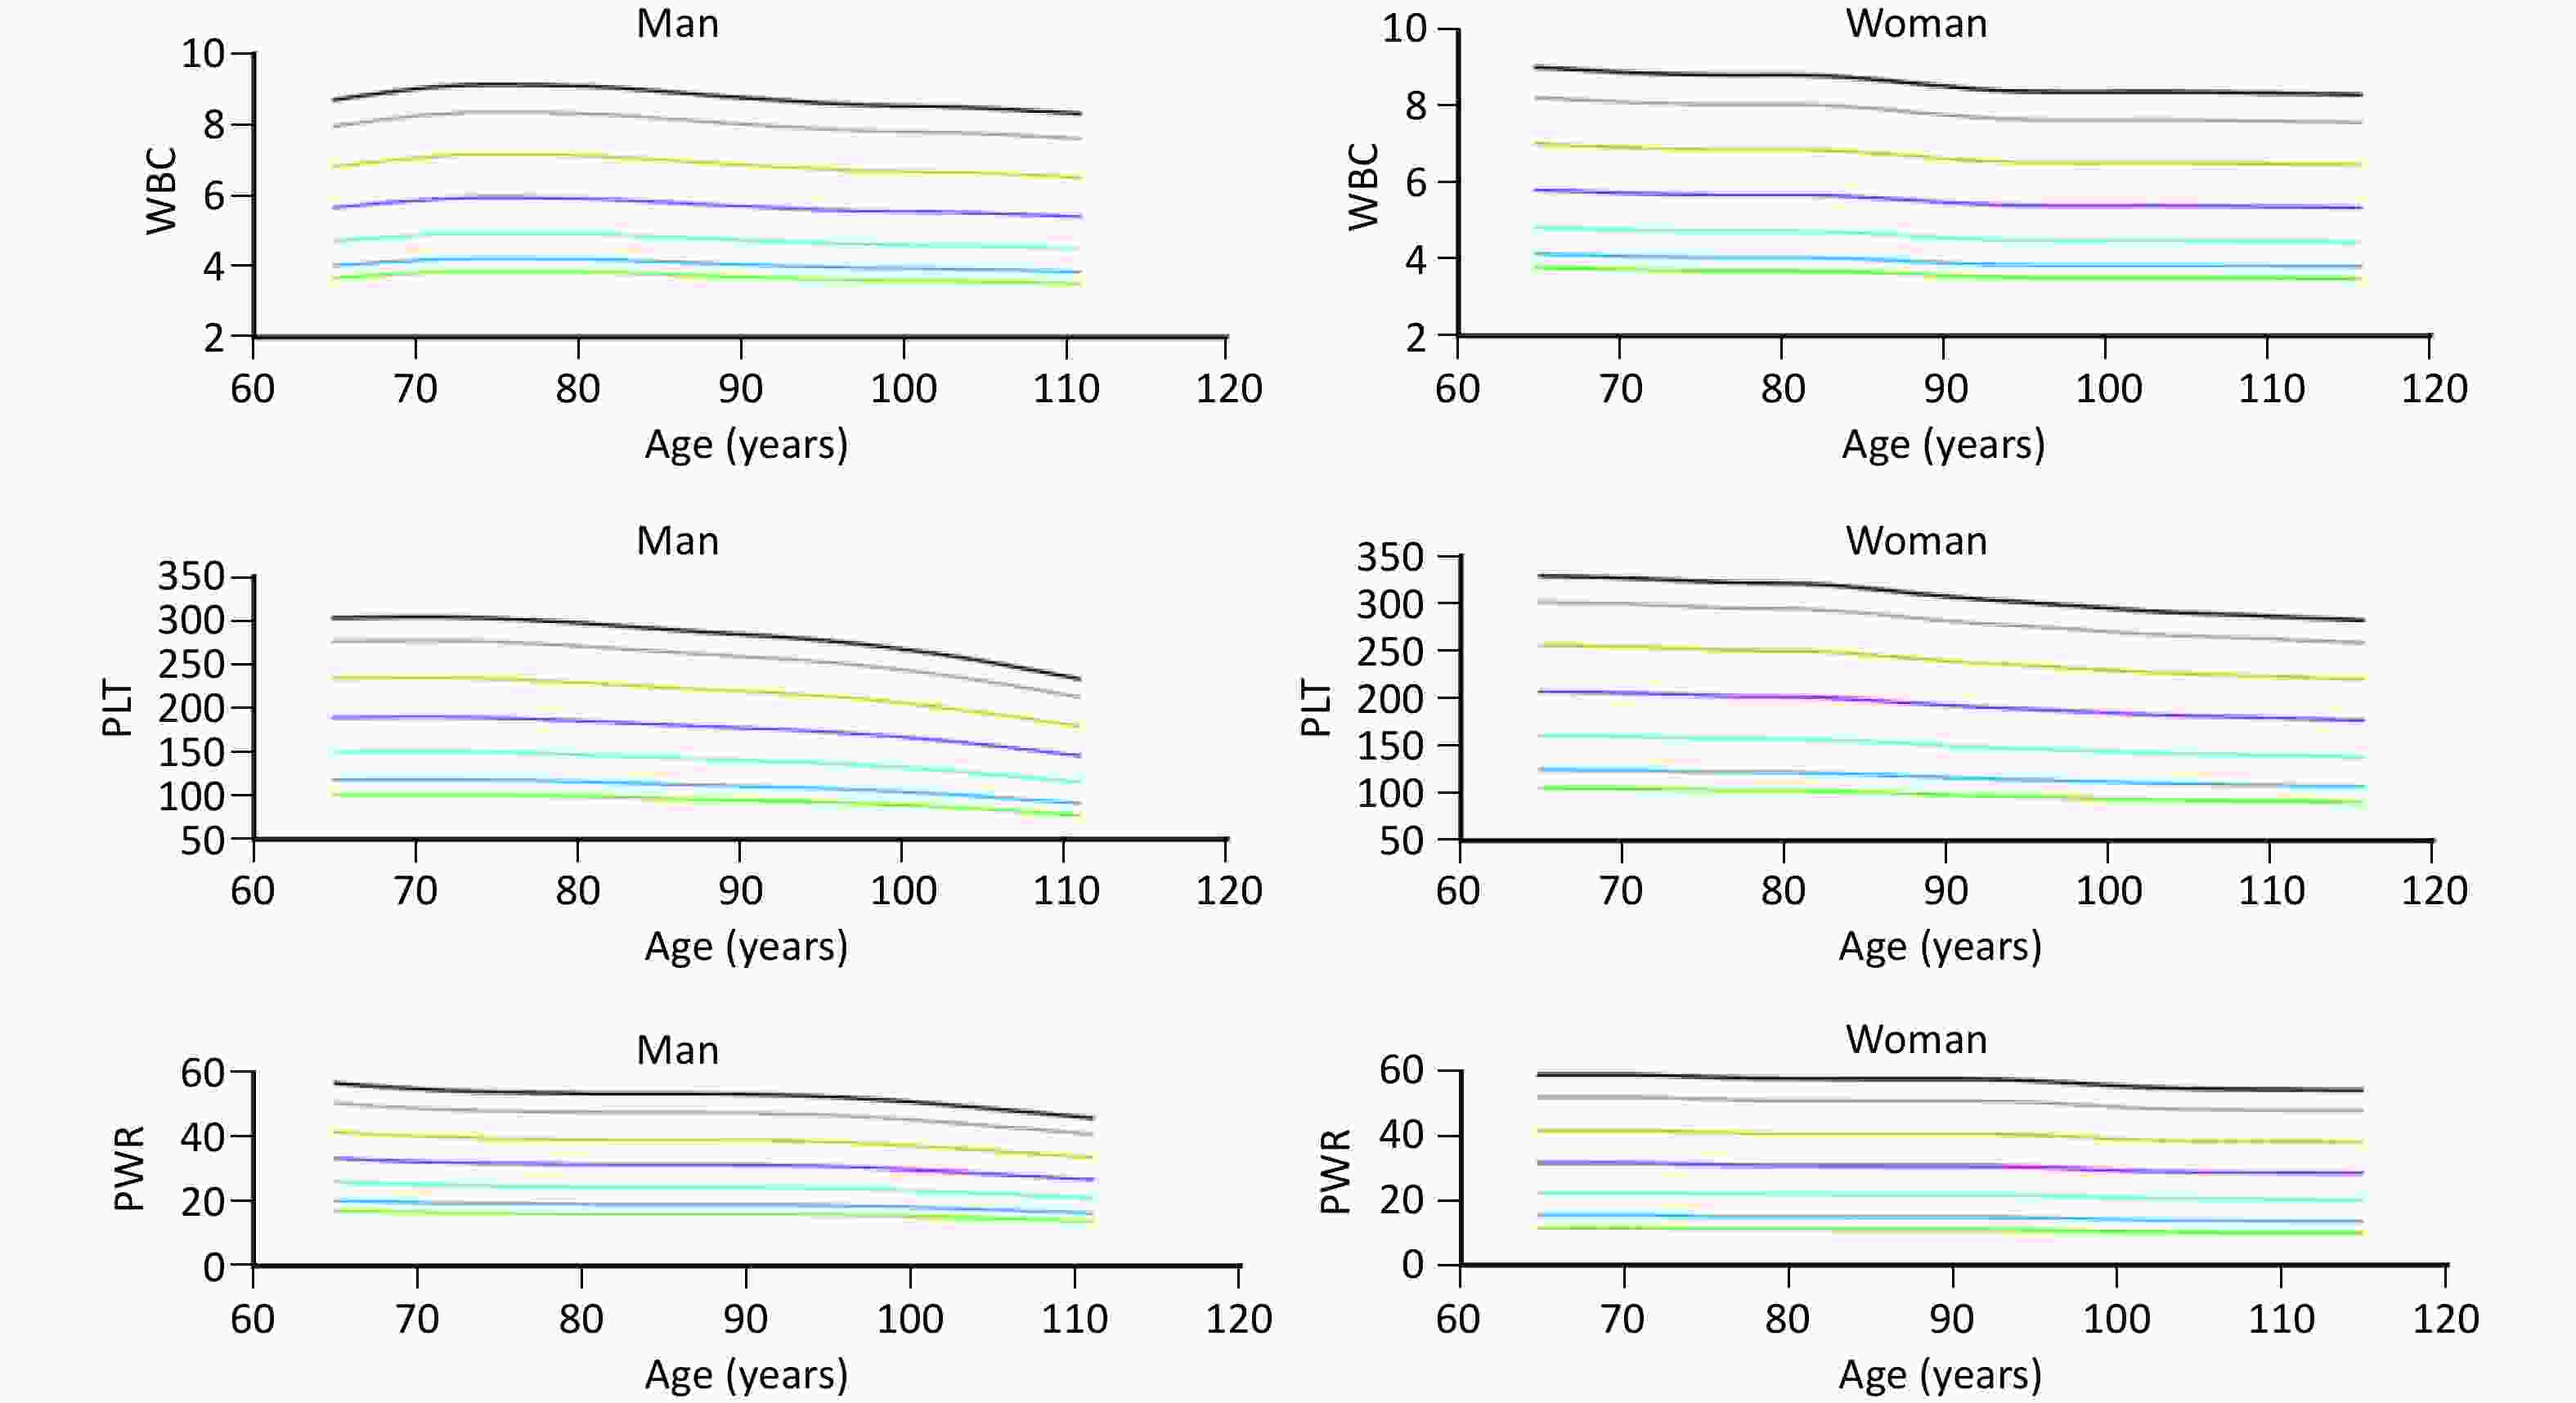
Figure 3. Trends in WBC, PLT, and PWR with age in older men and women (≥ 65 years). WBC, white blood cell; PLT, platelet; PWR, PLT-to-WBC ratio.
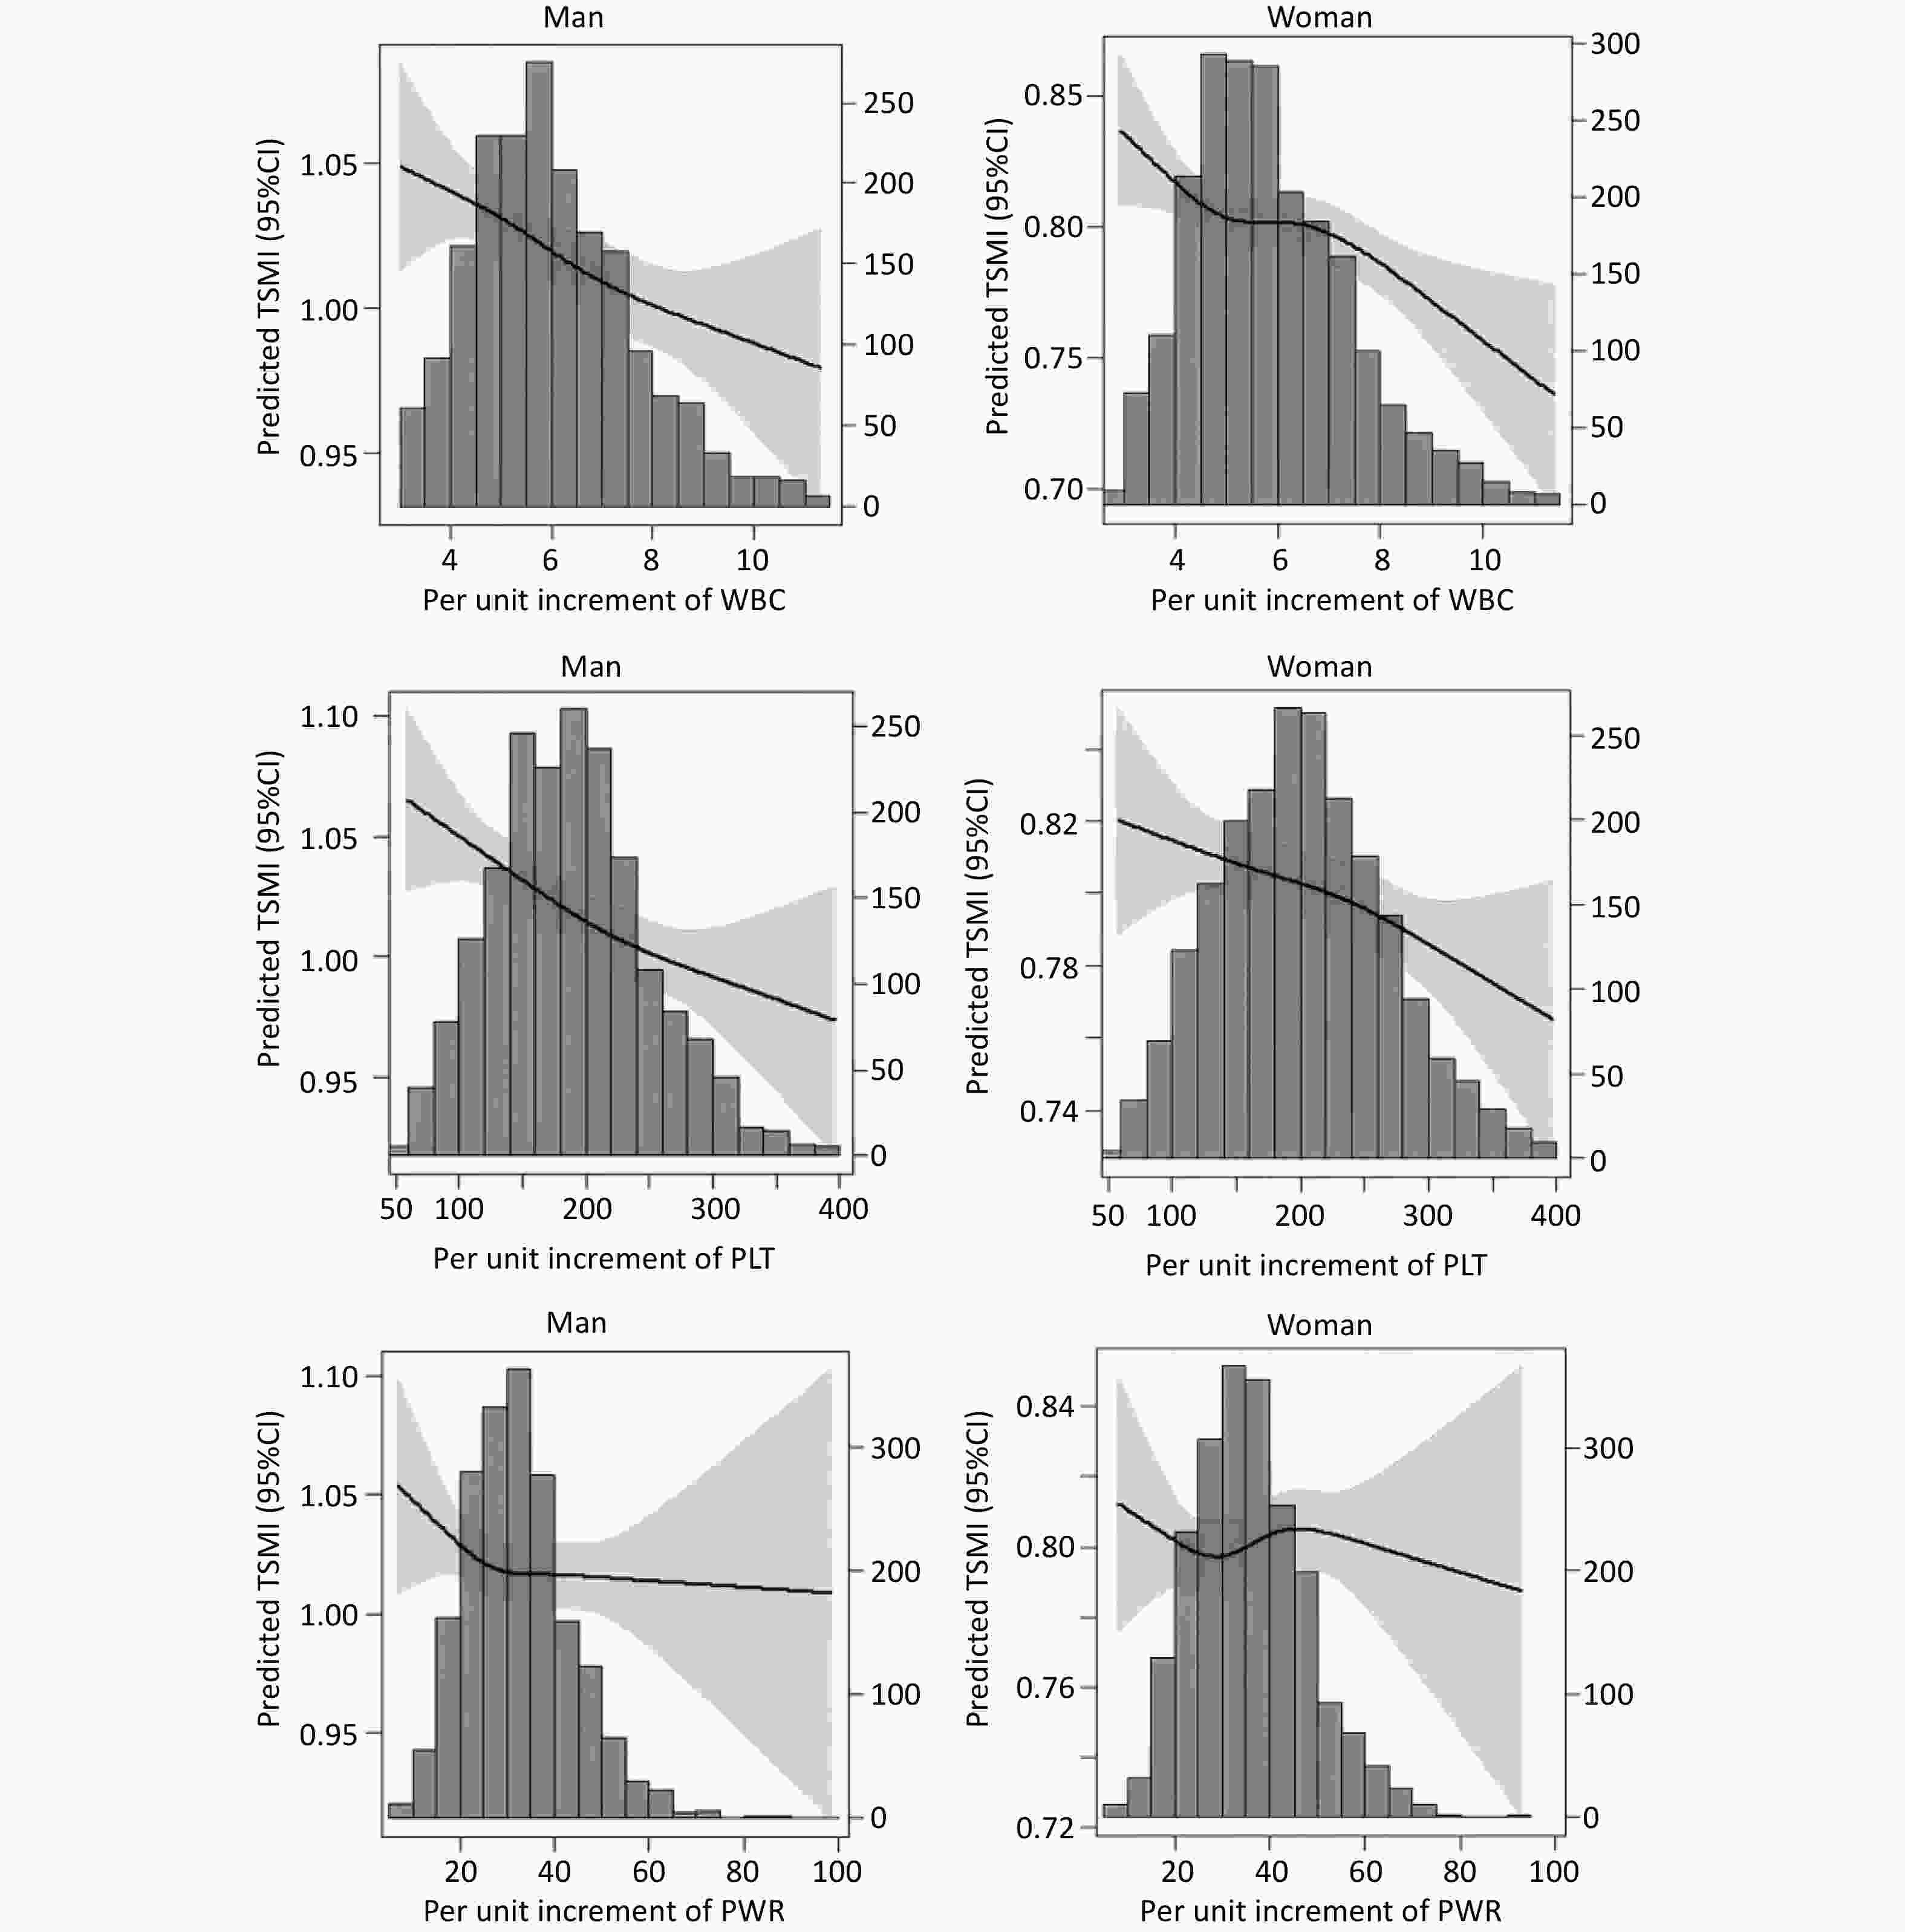
Figure 4. Relationships of WBC, PLT, and PWR with TSMI in Chinese older adults aged ≥ 65 years. TSMI, total skeletal muscle mass divided by body mass index; WBC, white blood cell; PLT, platelet; PWR, PLT-to-WBC ratio.
Table 2 presents the linear associations of WBC count, PLT count, and PWR with TSMI, as assessed using multi-factor linear regression models. WBC count, PLT count, and PWR were inversely associated with TSMI, with coefficients of −0.0091 (95% CI = −0.0142 to −0.0041, P < 0.001), −0.0119 (95% CI = −0.0170 to −0.0068, P < 0.001), and −0.0051 (95% CI = −0.0102 to −0.0001, P = 0.047), after controlling for variables including age, sex, marital status, occupation, smoking status, alcohol consumption, BMI, and the number of chronic diseases. Additionally, WBC count, PLT count, and PWR were analyzed as categorical variables, demonstrating a consistent trend. In the adjusted model, individuals in the T3 of the WBC count, PLT count, and the T2 of PWR categories showed a markedly increased probability of experiencing a reduction in muscle mass (Table 2).
Inflammatory markers Model 1 Model 2 Model 3 β (95%CI) P value β (95%CI) P value β (95%CI) P value WBC WBC (per SD increase) –0.0137 (–0.0187, –0.0086) < 0.001 –0.0100 (–0.0149, –0.0052) < 0.001 –0.0091 (–0.0142, –0.0041) < 0.001 T1 Ref Ref Ref Ref Ref Ref T2 –0.0176 (–0.0300, –0.0052) 0.005 –0.0127 (–0.0246, –0.0008) 0.036 –0.0148 (–0.0271, –0.0025) 0.018 T3 –0.0300 (–0.0423, –0.0176) < 0.001 –0.0208 (–0.0327, –0.0090) 0.001 –0.0202 (–0.0325, –0.0078) 0.001 PLT PLT (per SD increase) –0.0133 (–0.0184, –0.0082) < 0.001 –0.0120 (–0.0169, –0.0072) < 0.001 –0.0119 (–0.0170, –0.0068) < 0.001 T1 Ref Ref Ref Ref Ref Ref T2 –0.0127 (–0.0251, –0.0003) 0.045 –0.0130 (–0.0249, –0.0012) 0.031 –0.0144 (–0.0267, –0.0021) 0.021 T3 –0.0304 (–0.0428, –0.0180) < 0.001 –0.0279 (–0.0397, –0.0161) < 0.001 –0.0281 (–0.0404, –0.0158) < 0.001 PWR PWR (per SD increase) –0.0024 (–0.0075, 0.0027) 0.353 –0.0044 (–0.0093, 0.0004) 0.074 –0.0051 (–0.0102, –0.0001) 0.047 T1 Ref Ref Ref Ref Ref Ref T2 –0.0176 (–0.0300, –0.0051) 0.006 –0.0163 (–0.0281, –0.0044) 0.007 –0.0179 (–0.0303, –0.0055) 0.005 T3 –0.0058 (–0.0181, 0.0065) 0.357 –0.0096 (–0.0214, 0.0022) 0.110 –0.0114 (–0.0237, 0.0008) 0.067 Note. Model 1: Multiple linear regression was used after adjusting for age, sex, marital, and occupation; Model 2: was adjusted for variables in Model 1, and smoking, alcohol and body mass index; Model 3: was adjusted for variables in Model 1 plus the numbers of chronic diseases; TSMI, total skeletal muscle mass divided by body mass index; CI, confidence interval; WBC, white blood cell count; PLT, platelet; PWR, PLT-to-WBC ratio. Table 2. Associations of PLT, WBC, and PWR with TSMI
Sex-specific analyses indicated an inverse relationship between the inflammatory makers (WBC count, PLT count, and PWR) and TSMI in older male participants. By contrast, among older female participants, only the WBC count demonstrated a significant association with TSMI (Table 3). Moreover, we conducted age group-specific analyses, classifying participants into younger old group (65–79 years) and the oldest old group (≥ 80 years). WBC count, PLT count, and PWR levels showed significant associations with TSMI in both the younger-old group and the oldest-old group of male participants. Conversely, none of these three markers demonstrated a significant association with TSMI among the oldest old women aged ≥ 80 years (Table 4).
Inflammatory markers Men Women Model 1 Model 2 Model 3 Model 1 Model 2 Model 3 WBC WBC (per SD increase) –0.0144 (–0.0224, –0.0065)*** –0.0121 (–0.0197, –0.0045)** –0.0117 (–0.0197, –0.0036)** –0.0127 (–0.0191, –0.0064)*** –0.0085 (–0.0146, –0.0023)** –0.0079 (–0.0143, –0.0015)* T1 Ref Ref Ref Ref Ref Ref T2 –0.0285 (–0.0482, –0.0088)** –0.0222 (–0.0410, –0.0033)* –0.0275 (–0.0471, –0.0079)** –0.0091 (–0.0245, 0.0064) –0.0056 (–0.0205, 0.0092) –0.0051 (–0.0203, 0.0102) T3 –0.0394 (–0.0590, –0.0197)*** –0.0304 (–0.0493, –0.0116)** –0.0304 (–0.0503, –0.0079)** –0.0205 (–0.0359, –0.0052)** –0.0122 (–0.0270, 0.0025) –0.0113 (–0.0267, 0.0040) PLT PLT (per SD increase) –0.0190 (–0.0274, –0.0106)*** –0.0187 (–0.0267, –0.0106)*** –0.0215 (–0.0299, –0.0131)*** –0.0093 (–0.0154, –0.0032)** –0.0073 (–0.0132, –0.0014)** –0.0049 (–0.0111, 0.0013) T1 Ref Ref Ref Ref Ref Ref T2 –0.0189 (–0.0387, 0.0008) –0.0178 (–0.0366, 0.0010) –0.0212 (–0.0408, –0.0017)* –0.0105 (–0.0260, 0.0050) –0.0116 (–0.0264, 0.0033) –0.0112 (–0.0265, 0.0041) T3 –0.0449 (–0.0646, –0.0252)*** –0.0443 (–0.0630, –0.0255)*** –0.0511 (–0.0707, –0.0315)*** –0.0187 (–0.0342, –0.0033)* –0.0145 (–0.0293, 0.0003) –0.0093 (–0.0246, 0.0060) PWR PWR (per SD increase) –0.0064 (–0.0147, 0.0020) –0.0084 (–0.0164, –0.0004)* –0.0123 (–0.0207, –0.0039)** –0.0002 (–0.0060, 0.0063) –0.0015 (–0.0074, –0.0044) –0.0001 (–0.0059, 0.0062) T1 Ref Ref Ref Ref Ref Ref T2 –0.0349 (–0.0546, –0.0152)** –0.0307 (–0.0495, –0.0119)** –0.0352 (–0.0549, –0.0155)*** –0.0026 (–0.0181, 0.0129) –0.0030 (–0.0178, 0.0118) –0.0022 (–0.0176, 0.0132) T3 –0.0196 (–0.0393, < 0.0001) –0.0224 (–0.0412, –0.0037)* –0.0308 (–0.0504, –0.0111)** (–0.0102, 0.0205) (–0.0130, 0.0164) (–0.0097, 0.0206) Note. TSMI, total skeletal muscle mass divided by body mass index; CI, confidence interval; WBC, white blood cell; PLT, platelet; PWR, PLT-to-WBC ratio. *P < 0.05; * *P < 0.01; ***P < 0.001. Table 3. Associations of PLT, WBC, and PWR with TSMI in different sex groups [β (95%CI)]
Variables Men Women Model 1 Model 2 Model 3 Model 1 Model 2 Model 3 65–79 years WBC WBC (per SD increase) –0.0172 (–0.0289, –0.0056)** –0.0133 (–0.0241, –0.0024)* –0.0115 (–0.0231, 0.0002) –0.0181 (–0.0277, –0.0085)*** –0.0122 (–0.0211, –0.0033)** –0.0099 (–0.0192, –0.0007)* T1 Ref Ref Ref Ref Ref Ref T2 –0.0194 (–0.0477, 0.0088) –0.0073 (–0.0336, 0.0190) –0.0122 (–0.0397, 0.0154) –0.0043 (–0.0280, 0.0194) –0.0023 (–0.0242, 0.0196) –0.0011 (–0.0235, 0.0213) T3 –0.0420 (–0.0701, –0.0137)** –0.0278 (–0.0541, –0.0013) –0.0284 (–0.0565, –0.0003)* –0.0257 (–0.0487, –0.0027)* –0.0165 (–0.0378, 0.0047) –0.0129 (–0.0349, 0.0090) PLT PLT (per SD increase) –0.0164 (–0.0283, –0.0045)** –0.0147 (–0.0257, –0.0037)** –0.0178 (–0.0295, –0.0062)** –0.0162 (–0.0252, –0.0073)*** –0.0117 (–0.0200, –0.0034)** –0.0097 (–0.0184, –0.0009)* T1 Ref Ref Ref Ref Ref Ref T2 –0.0170 (–0.0464, 0.0123) –0.0172 (–0.0443, 0.0098) –0.0176 (–0.0457, 0.0105) –0.0146 (–0.0386, 0.0095) –0.0111 (–0.0334, 0.0112) –0.0124 (–0.0353, 0.0105) T3 –0.0448 (–0.0732, –0.0164)** –0.0420 (–0.0683, –0.0157)** –0.0491 (–0.0766, –0.0216)*** –0.0394 (–0.0623, –0.0166)** –0.0280 (–0.0491, –0.0068)** –0.0228 (–0.0447, –0.0010)* PWR PWR (per SD increase) –0.0032 (–0.0154, 0.0089) –0.0054 (–0.0167, 0.0058) –0.0090 (–0.0208, 0.0028) –0.0030 (–0.0123, 0.0062) –0.0036 (–0.0121, 0.0050) –0.0085 (–0.0304, 0.0135) T1 Ref Ref Ref Ref Ref Ref T2 –0.0450 (–0.0736, –0.0163)** –0.0362 (–0.0628, –0.0096)** –0.0397 (–0.0676, –0.0118)** –0.0185 (–0.0421, 0.0051) –0.0137 (–0.0355, 0.0081) –0.0122 (–0.0347, 0.0103) T3 –0.0241 (–0.0525, 0.0042) –0.0267 (–0.0530, –0.0004)* –0.0356 (–0.0632, –0.0080)* –0.0118 (–0.0348, 0.0112) –0.0101 (–0.0314, 0.0113) –0.0085 (–0.0304, 0.0135) ≥ 80 years WBC WBC (per SD increase) 0.0108 (–0.0219, 0.0003) –0.0093 (–0.0201, 0.0015) –0.0097 (–0.0212, 0.0018) –0.0086 (–0.0170, –0.0002)* –0.0048 (–0.0131, 0.0035) –0.0053 (–0.0140, 0.0034) T1 T2 –0.0331 (–0.0610, –0.0053)* –0.0302 (–0.0573, –0.0030)* –0.0365 (–0.0650, –0.0080)* –0.0118 (–0.0322, 0.0086) –0.0075 (–0.0276, 0.0125) –0.0068 (–0.0276, 0.0141) T3 –0.0328 (–0.0606, –0.0051)* –0.0269 (–0.0540, 0.0003) –0.0264 (–0.0550, –0.0022) –0.0151 (–0.0356, 0.0054) –0.0064 (–0.0266, 0.0139) –0.0073 (–0.0285, 0.0138) PLT PLT (per SD increase) –0.0176 (–0.0297, –0.0055) –0.0181 (–0.0297, –0.0063)** –0.0202 (–0.0325, –0.0078)** –0.0035 (–0.018, 0.0048) –0.0021 (–0.0102, 0.0061) 0.0004 (–0.0081, 0.0090) T1 T2 –0.0129 (–0.0401, 0.0144)** –0.0102 (–0.0367, 0.0163) –0.0142 (–0.0420, 0.0135) –0.0078 (–0.0280, 0.0124) –0.0104 (–0.0302, 0.0094) –0.0094 (–0.0299, 0.0112) T3 –0.0381 (–0.0715, –0.0103)** –0.0390 (–0.0660, –0.0119)** –0.0445 (–0.0731, –0.0158)** –0.0029 (–0.0237, 0.0179) –0.0001 (–0.0210, –0.0197) 0.0045 (–0.0167, 0.0257) PWR PWR (per SD increase) –0.0067 (–0.0184, 0.0050) –0.0086 (–0.0200, 0.0028) –0.0120 (–0.0241, 0.0001) –0.0024 (–0.0058, 0.0107) –0.0007 (–0.0074, 0.0088) 0.0032 (–0.0051, 0.0116) T1 T2 –0.0306 (–0.0583, –0.0030)* –0.0310 (–0.0579, –0.0041)* –0.0375 (–0.0659, –0.0091)* –0.0080 (–0.0124, 0.0284) 0.0064 (–0.0136, 0.0264) 0.0071 (–0.0138, 0.0280) T3 –0.0121 (–0.0398, 0.0156) –0.0153 (–0.0422, 0.0117) –0.0227 (–0.0511, 0.0057) –0.0160 (–0.0045, 0.0366) 0.0110 (–0.0092, 0.0312) 0.0164 (–0.0046, 0.0374) Note. TSMI, total skeletal muscle mass divided by body mass index; CI, confidence interval; WBC, white blood cell; PLT, platelet; PWR, PLT-to-WBC ratio. *P < 0.05; * *P < 0.01; ***P < 0.001. Table 4. Associations of PLT, WBC, and PWR with TSMI in different sex and age groups [β (95% CI)]
-
Among community-dwelling older adults in China in this study, WBC count, PLT count and PWR were negatively associated with muscle mass. Furthermore, this association varied according to sex and age. Regularly monitoring serum inflammatory markers may be an effective strategy for evaluating and managing sarcopenia in older individuals in China, with the exception of women aged ≥ 80 years. To the best of our knowledge, this study is the first to investigate the correlation between inflammatory markers and muscle mass specifically within the oldest old population, defined as individuals aged ≥ 80 years.
WBC count is a widely utilized biomarker for assessing systemic inflammation and reflects the activity of the innate immune system. Numerous studies have established a strong association between elevated WBC counts and various pathological conditions, including coronary heart disease, cerebrovascular events, viral infections, and increased mortality rates[26-29]. A cross-sectional study among community-dwelling older women has further demonstrated that higher WBC counts were negatively correlated with frailty, suggesting a link between systemic inflammation and age-related functional decline[30]. Our findings, which revealed a significant association between WBC and muscle mass in older adults, align with those of prior research highlighting the role of WBC in muscle homeostasis[18,31]. Although our data confirm the predictive value of the WBC count for muscle mass, the pathophysiological mechanisms underlying leukocytosis-mediated muscle loss remain unclear. Current evidence suggests that elevated circulating leukocyte levels drive systemic inflammation through enhanced secretion of pro-inflammatory cytokines (e.g.,IL-6)[32]. Increased inflammatory marker levels can activate skeletal muscle proteolysis and promote insulin resistance, thus lowering the inhibition of protein catabolism by insulin and eventually causing muscle atrophy[16,33,34]. Additionally, neutrophils may mediate skeletal muscle pathology through the coordinated release of inflammatory mediators, proteolytic enzymes, and neutrophil extracellular trap (NET)[35]. Moreover, aging shifts macrophages toward a pro-inflammatory M1 phenotype, reducing the regenerative capacity of skeletal muscles[36].
PLT is implicated not only in hemostasis and arterial thrombosis, but also serves as a reliable biomarker characterized by minimal intra-individual variability and plays a significant role in inflammatory processes[37]. PLT count decreased in older adults, with a reduction of approximately 10% observed after the age of 60 years; this decline is particularly pronounced in men[38]. Although PLT counts decreased after the age of 65 years, the reduction in PLT levels was uniform among the participants regardless of sex. The observed PLT reduction in older populations may arise from the progressive depletion of hematopoietic stem cell reserves or represent an evolutionary adaptation favoring individuals with attenuated PLT production to mitigate age-associated thrombotic complications[38]. Nevertheless, these propositions remain speculative, and additional research is necessary to elucidate the mechanisms that contribute to age-related alterations.
After controlling for relevant confounders, the PLT count demonstrated a significant correlation with a reduction in muscle mass in older people in our study. This finding is consistent with those of the previous studies. For instance, in a cross-sectional study involving postmenopausal women, elevated PLT counts were negatively associated with sarcopenia[31].Although the impact of PLT on muscle mass loss is significant, the specific mechanisms by which PLT contribute to this decline are uncertain. Emerging evidence has redefined the multifaceted roles of PLT beyond their classical hemostatic functions, positioning them as critical mediators of inflammatory regulation and immunomodulatory pathways[39]. PLT serve as dynamic coordinators of leukocyte trafficking by facilitating endothelial rolling and firm adhesion via surface receptor interactions, subsequently initiating a cascade of proinflammatory signaling events[40]. Of particular significance is the PLT–monocyte cellular crosstalk, which induces the phenotypic polarization of circulating monocytes, characterized by upregulated pro-inflammatory surface markers and enhanced cytokine secretion profiles[41]. PLT–leukocyte interplay has been implicated in NET generation through chromatin decondensation mechanisms, potentially mediating cross-tissue effects on musculoskeletal cellular components[42]. Furthermore, studies have identified vitamin D receptor–mediated pathways through which PLTs may modulate bone remodeling and muscle metabolism, suggesting their participation in the bidirectional regulation of tissue formation and resorption processes[43]. This expanded understanding of PLT functionality establishes their dual capacity as hematopoietic elements and systemic regulators of the inflammatory–immune axis coordination.
Blood cell count ratio can function as an inflammatory index, providing a comprehensive reflection of the balance between innate and adaptive immunity[44,45]. The PWR is a novel, readily quantifiable, and economically viable marker that assesses the impact of PLT and WBC concurrently[46]. Considering the significant functions of PLT and WBC in the inflammatory response, PWR has been identified as a crucial indicator of systemic inflammation. Several studies have indicated that the PWR is associated with numerous pathological conditions, including ischemic stroke[47], poor functional outcomes[48], and hepatitis B virus-associated decompensated cirrhosis[49]. Moreover, our results also indicated a significant negative correlation between PWR and TSMI among individuals aged ≥ 65 years in China, which is consistent with findings from previous studies[20].
In the current study, after stratifying participants by sex, significant associations were identified between PLT count, PWR, and decline in muscle mass exclusively in male participants. The observed differences in sex may also be associated with age-associated reductions in sex hormones and various physiological processes, particularly in menopausal women, who experience a more significant reduction than their male counterparts[50]. Moreover, a decrease in estrogen levels in postmenopausal women may correlate with loss of muscle mass. This may be linked to the regulatory influence of estrogen on pro-inflammatory cytokines, as well as its direct protective effects on muscle tissue, both of which are significantly reduced in postmenopausal women[51]. Additionally, the associations between the three inflammatory indices and muscle mass were not significant among the oldest women (≥ 80 years). The underlying mechanisms contributing to the observed age-related variations remain unclear and may be linked to the reduction in stem cell reserves associated with aging[52].
This study had several strengths. First, we comprehensively investigated the older population using the HABCS dataset, which is distinguished by its extensive representation of older adults in China. This dataset demonstrated homogeneity across all 18 study centers regarding protocol adherence and data quality control. Second, to the best of our knowledge, this study represents the first investigation into the relationship between inflammatory markers and muscle mass, specifically within the oldest old population. Finally, our findings indicate that the three inflammatory markers, which are cost-effective and readily obtainable through routine blood tests, can be used to evaluate muscle health in clinical settings.
Nevertheless, some limitations must be recognized when interpreting the findings of this study. First, owing to the study’s cross-sectional design, a causal relationship could not be established. Second, muscle mass was evaluated using BIA, which is subject to inherent measurement errors associated with this technique. We exclusively measured total skeletal muscle mass without differentiating the weights of the limb bones. Lastly, the inflammatory indices were assessed using a single measurement, which may compromise the accuracy of the findings owing to possible inaccuracies in laboratory measurements and inherent biological variability. Future studies should investigate the relationship between longitudinal variations in inflammatory biomarkers and muscle mass in older adults in China.
-
Elevated WBC count, PLT count, and PWR levels were significantly associated with reduced muscle mass among Chinese community-dwelling older individuals. Relationships between the three inflammatory indices and muscle mass were more pronounced in male participants as well as in female participants aged < 80 years. Regular follow-up of WBC count, PLT count, and PWR may be an inexpensive, easy, and effective strategy for the screening and management of sarcopenia. Additional prospective studies are required to determine whether interventions aimed at reducing these markers can effectively prevent muscle mass decline. In clinical practice, WBC count, PLT count, and PWR should be considered potential predictors of sarcopenia in older adults.
Associations of White Blood Cell, Platelet Count, Platelet-to-White Blood Cell Ratio with Muscle Mass among Community-Dwelling Older Adults in China
doi: 10.3967/bes2025.051
- Received Date: 2025-01-21
- Accepted Date: 2025-04-14
-
Key words:
- White blood cell count /
- Platelet /
- Platelet to white blood cell ratio /
- Older adults /
- Muscle mass
Abstract: Abstract
| Citation: | Zhenwei Zhang, Yuming Zhao, Hongzhou Chen, Li Qi, Chen Chen, Jun Wang, Wenhui Shi, Yuebin Lyu, Xiaoming Shi. Associations of White Blood Cell, Platelet Count, Platelet-to-White Blood Cell Ratio with Muscle Mass among Community-Dwelling Older Adults in China[J]. Biomedical and Environmental Sciences. doi: 10.3967/bes2025.051

|

 Quick Links
 DownLoad: