
-
Cardiovascular and respiratory diseases are the leading causes of morbidity and mortality worldwide. Numerous epidemiological studies have demonstrated that risks associated with these diseases are increasingly influenced by climate factors and air pollution[1–3]. In real-world contexts, individuals are frequently exposed to multiple environmental stressors such as extreme heat and air pollution, which may interact in nonlinear and multiplicative ways[4]. Although extensive studies have explored the health impacts of individual exposure, relatively few have examined their synergistic effects. Limited evidence from Canada[5], France[6], and Hungary[7] suggests that exposure to pollutants and meteorological conditions can significantly affect hospitalization risks. However, findings across studies remain inconsistent, partly due to heterogeneity in exposure contexts and because conventional statistical models often struggle to accommodate multicollinearity and complex interactions.
Traditional models, such as Generalized Additive Models (GAMs), Generalized Linear Models (GLMs), and Distributed Lag Nonlinear Models (DLNMs), are widely used in environmental epidemiology. However, these models are often constrained by their inability to process high-dimensional data, resolve multicollinearity, and capture intricate and dynamic interactions among environmental variables[8]. Machine learning (ML) offers a promising alternative. Most ML approaches are capable of modeling nonlinear associations, handling multilag structures, and processing large-scale high-dimensional datasets. By capturing the complex and dynamic relationships among multiple exposures, ML-based models enhance the ability to predict diseases, support early public health interventions, and improve healthcare resource planning[9]. Among these, deep learning models, particularly Long Short-Term Memory (LSTM) networks, are well-suited for modeling temporal dynamics[10], effectively accounting for both lag effects and long-term dependencies under rapidly changing environmental conditions[11,12].
In Asia, particularly Japan, research on the synergistic health impacts of climate change and air pollution remains limited, despite rising environmental health risks[13]. Urban centers such as Tokyo, Osaka, and Nagoya are characterized by high population densities, rapid aging, frequent extreme weather events driven by the Siberian High and Pacific currents[14], and persistent air pollution. These overlapping vulnerabilities make Japan a critical setting for investigating the combined impact of environmental exposure. However, most studies have focused on either temperature[15] or air pollutants[16,17] in isolation. Furthermore, most prior research has emphasized mortality as an outcome, whereas hospital admission, an earlier and more actionable health outcome, has received comparatively less attention.
This study investigated the cumulative synergistic effects of climatic conditions and air pollution on hospital admissions for cardiovascular and respiratory diseases across Tokyo’s 23 wards, Osaka City, and Nagoya City. Specifically, we (1) applied machine learning models to quantify the synergistic exposure effects of climate and air pollution, as well as their relative contributions across multiple short-term lag periods (lag0, lag3, and lag7); and (2) used these insights to inform the selection of key input and lag structures for hybrid deep learning models, with the goal of improving the accuracy of daily hospital admission prediction. By advancing both exposure assessment and predictive modeling, this study provides a more comprehensive understanding of environmental health risks in Japan and contributes to the development of proactive public health strategies to compound climate–pollution stressors.
-
This study focused on three major metropolitan areas in Japan: Tokyo’s 23 wards, Osaka City, and Nagoya City, located along the Pacific coast of Honshu Island (34°–36°N), within the humid subtropical climate zone (Köppen Cfa), which is characterized by hot, humid summers and mild, relatively dry winters. These cities aret Japan’s most densely populated and industrially active regions with high pollution levels and pronounced climate variability. Their well-established environmental monitoring infrastructure provides detailed data on air quality, meteorological conditions, and health outcomes, making them ideal sites for examining the health impacts of climate change and air pollution.
-
Hospital admission data for the period from January 1, 2017, to December 31, 2019, were obtained from the JMDC Claims Database As the largest civilian epidemiological dataset in Japan, which compiled anonymized inpatient and outpatient medical claim data from participating health insurance associations, covering approximately 17 million individuals. The dataset included standardized information on inpatients, outpatients, pharmacies, and health checkup records. The variables extracted included the date of visit, location, sex, age, number of first visits, hospital admissions, and follow-ups. Diagnoses were made using the International Classification of Diseases, 10th Revision (ICD-10). For this study, daily counts of first visits and admissions were aggregated, and disease codes corresponding to cardiovascular diseases (CVD: I10–I15 [hypertension], I20 [ischemic heart disease], I21–I22 [acute myocardial infarction], I25 [chronic ischemic heart disease], and I70–I79 [arterial and capillary diseases]) and respiratory diseases (RD: I26–I28 [pulmonary heart disease], and J20–J22; J40–J47 [lower respiratory infections]) were extracted for analysis.
-
The meteorological variables included daily mean temperature, wind speed, solar insolation, atmospheric pressure, relative humidity, and precipitation, all of which were obtained from the Japan Meteorological Agency (JMA). The JMA measures meteorological conditions using its automatic weather observation system (AMeDAS), with observation stations are located approximately every 21 km throughout the country. For each city, daily averages were calculated across all available observation stations to represent city-level exposure. Air pollution data included daily mean concentrations of nitrogen oxides (NOx), carbon monoxide (CO), photochemical oxidants (Ox), suspended particulate matter (SPM), particulate matter ≤ 2.5 μm (PM2.5), and sulfur dioxide (SO2). These data were sourced from the representative environmental agencies of Tokyo’s 23 wards in Osaka City and Nagoya City. For each pollutant, the daily mean concentrations were computed by averaging the values from all observation stations: 28 stations in Tokyo, 26 in Osaka, and 18 in Nagoya.
-
To quantify the short-term cumulative effects of environmental exposure on hospital admission, Random Forest regression models (RandomForestRegressor) were applied for the lag0, lag3, and lag7 period. Each model incorporated all environmental variables for the current day, previous 3 days, and the previous 7 days. Feature importance was extracted to evaluate the relative contribution of each variable. To optimize model performance, hyperparameters, including the number of trees (150, 200, and 300), maximum features per split (3 and 4), and minimum samples per split, were tuned using a grid search to improve model accuracy and reduce overfitting. All the analyses were conducted using Python 3.12.7 (Python Software Foundation, Wilmington, Delaware, USA).
-
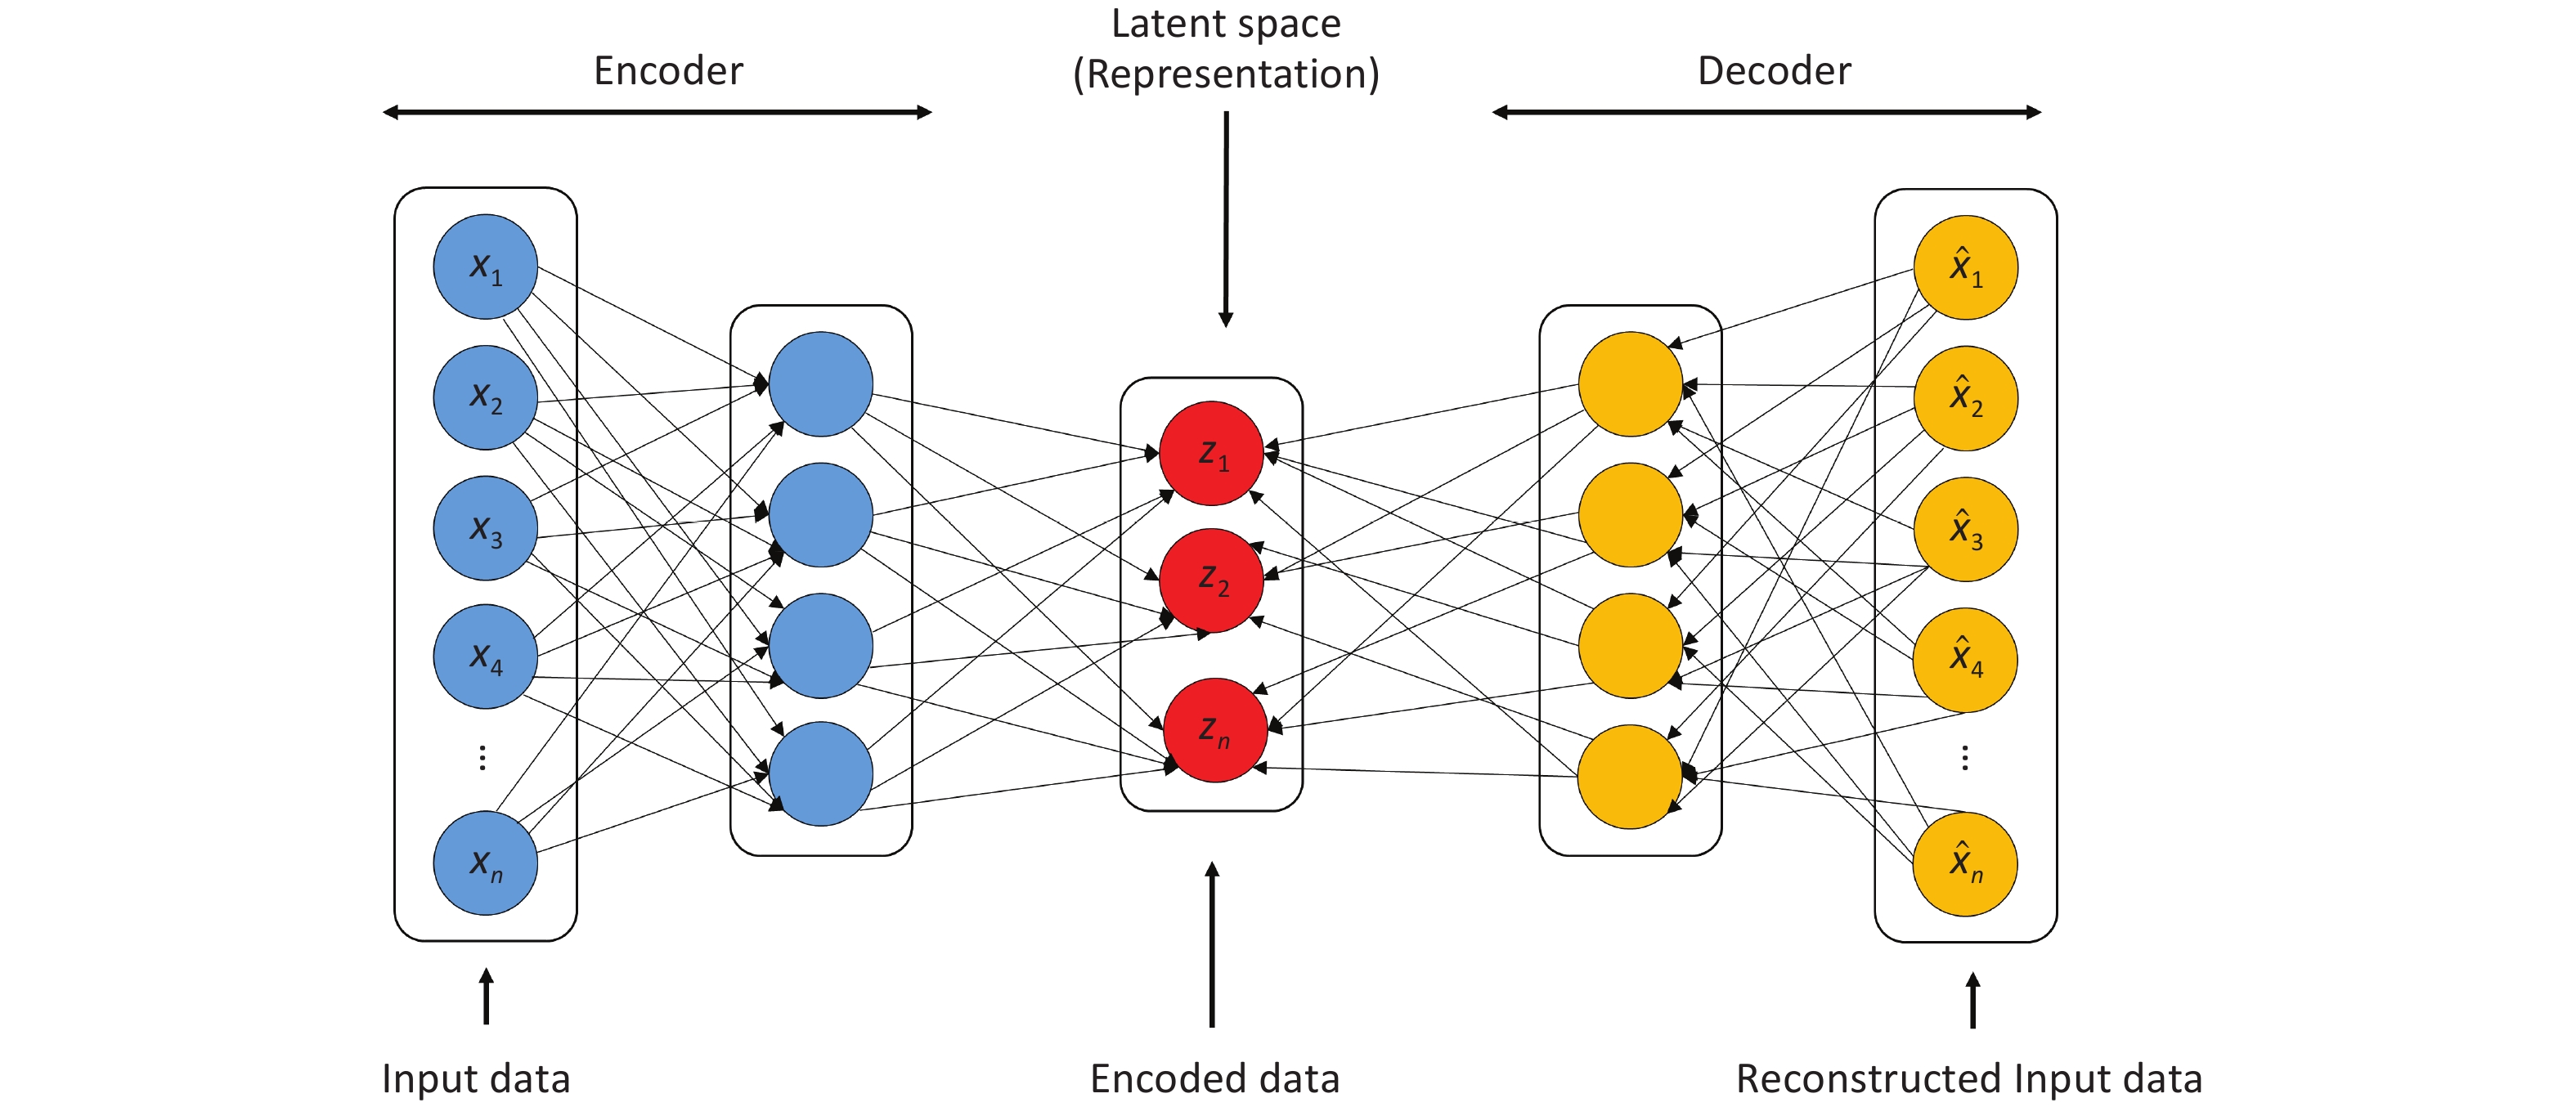
To improve the prediction of daily disease-related hospital admissions, a hybrid deep learning model combining an autoencoder (AE) and LSTM network was developed. The encoder component of the AE compresses the raw input data into latent space Z (Figure 1), which is then reconstructed by the decoder. Through unsupervised learning, the AE autonomously extract key features relevant to hospital admission prediction. This architecture enables dimensionality reduction and denoising, allowing the model to focus on the salient patterns in the data. The encoded features were then input into the LSTM, which captured the long-term dependencies for time-series prediction.
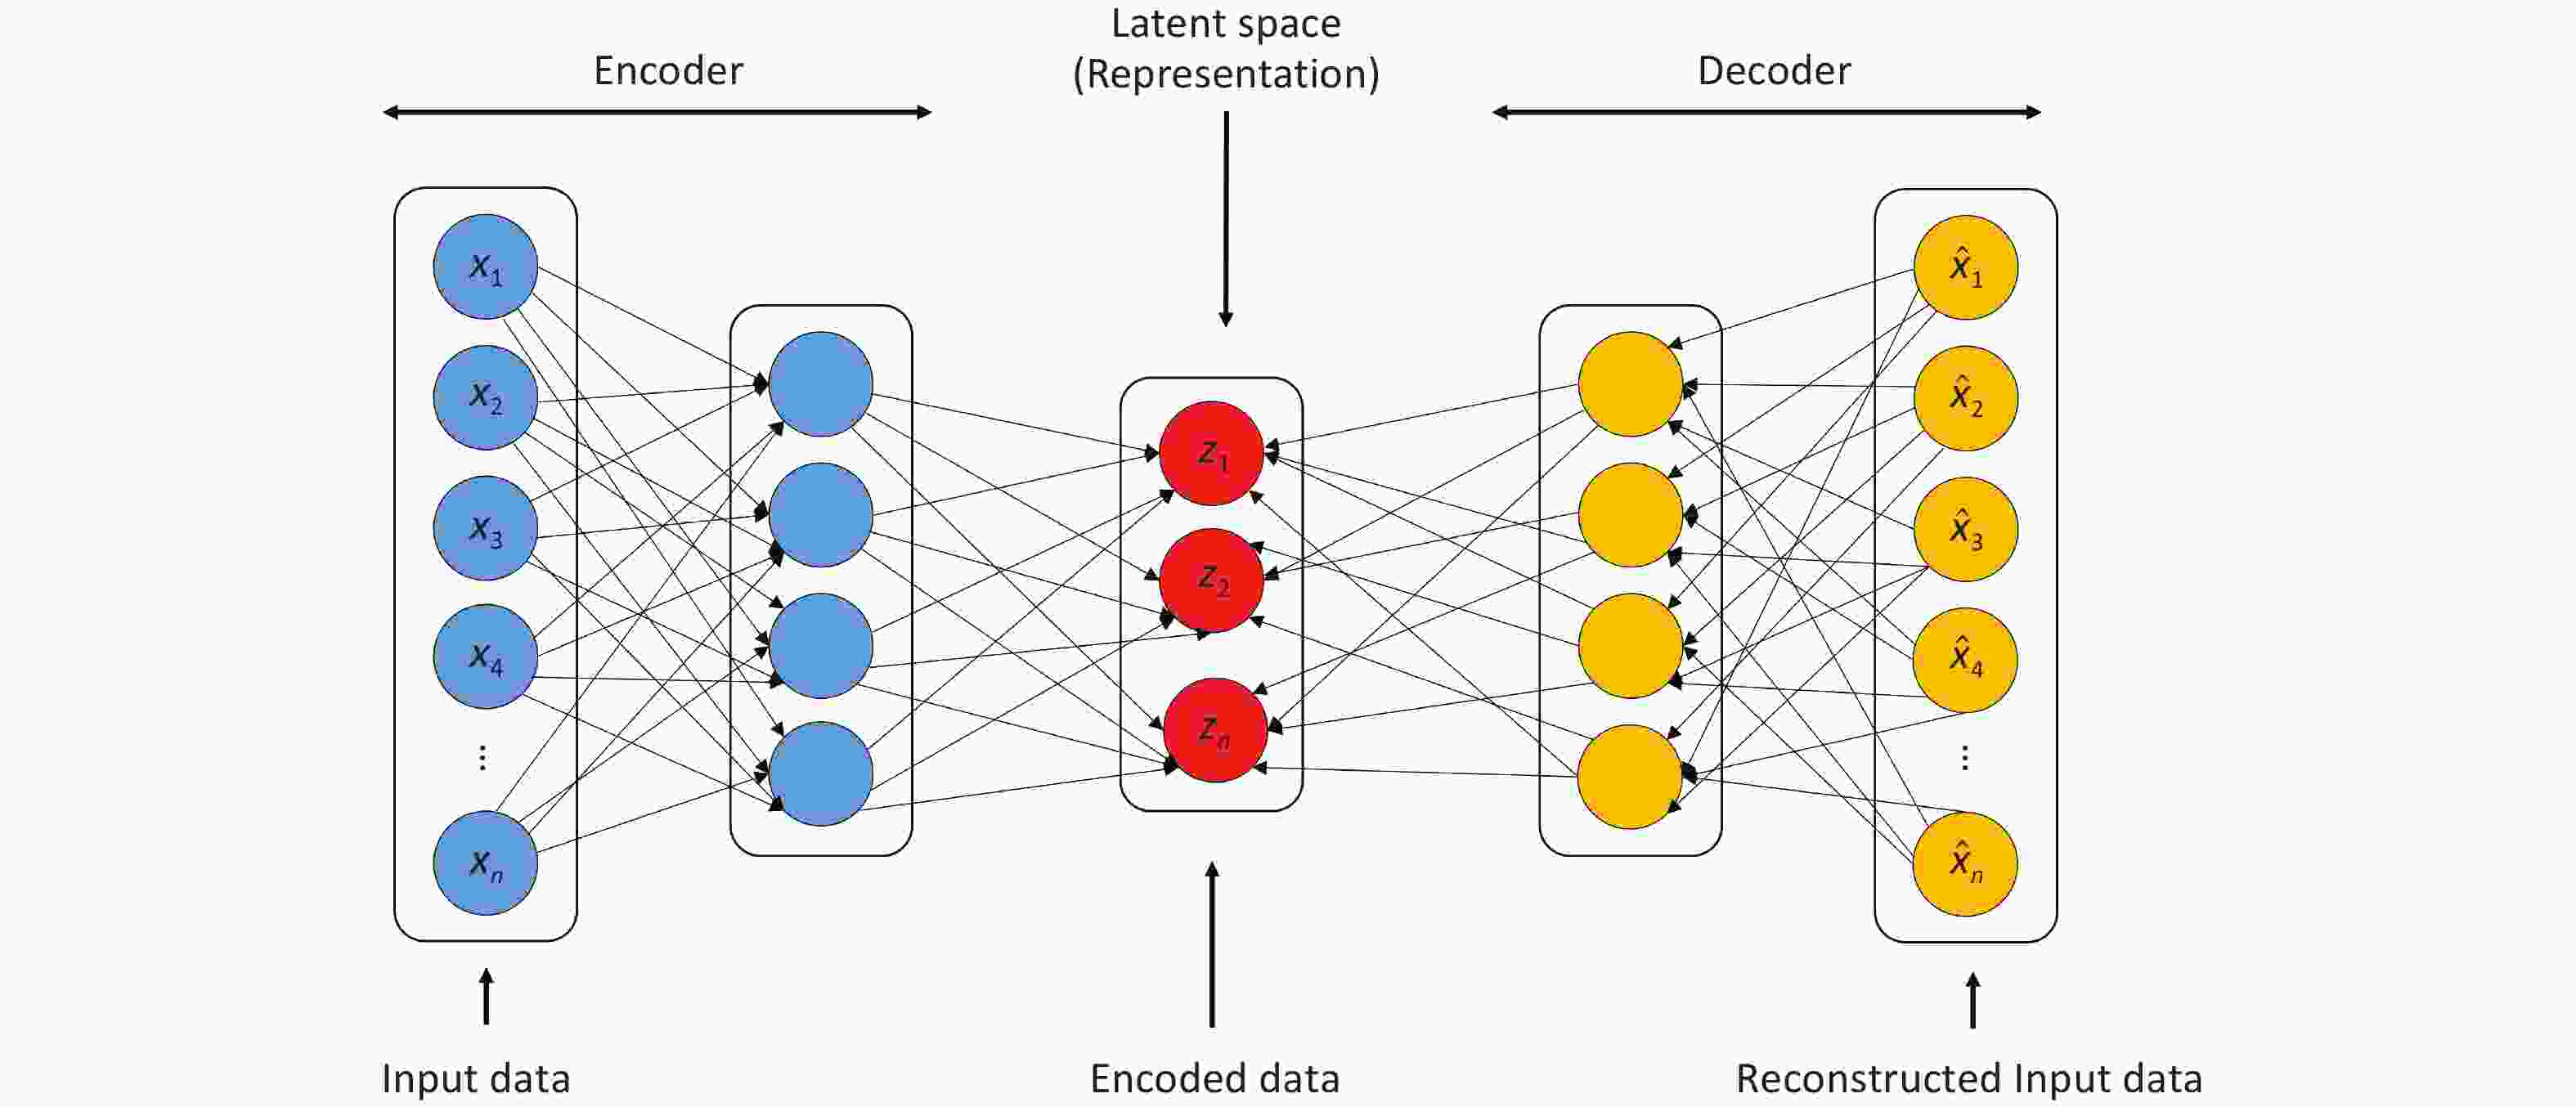
Figure 1. Structure of an autoencoder.
Hyperparameter tuning was performed for both the model components. For the AE, the encoding dimensions (2–8), batch size (32 and 64), epochs (200–400), and dropout rate (0.1–0.5) were optimized. For LSTM, the number of hidden layers (2 and 3), time steps (3, 7, and 14), learning rates (0.001–0.01), and training epochs (200–1000) were used to improve the prediction performance.
To ensure an adequate sample size, disease-related hospital admissions were grouped into two categories based on ICD-10 codes: total respiratory and total cardiovascular diseases. This aggregation was necessary because of the low case counts for certain diseases (e.g., I21, I22, and I26–I28) and minimal differences in feature contributions across subgroups. All model developments and evaluations were performed using Python version 3.12.7. (Python Software Foundation, Wilmington, DE, USA).
-
Given the time-series nature of the dataset, a 10-fold cross-validation was employed to tune the model hyperparameters. The model performance was evaluated using the Mean Absolute Error (MAE) and Root Mean Square Error (RMSE) as the primary metrics using the following formula:
$$ \mathrm{M}\mathrm{A}\mathrm{E}=\frac{1}{N}\sum _{i=1}^{N}\left|\widehat{{y}_{i}}-{y}_{i}\right| $$ $$ \mathrm{R}\mathrm{M}\mathrm{S}\mathrm{E}=\sqrt{{\left(\frac{1}{N}\sum _{i=1}^{N}\left({y}_{i}-\widehat{{y}_{i}}\right)\right)}^{2}} $$ where i is the ith day, $ {y}_{i} $ represents the actual hospitalization for each disease, and $ \widehat{{y}_{i}} $ represents the predicted hospitalization for each disease.
-
Table 1 summarizes the disease-specific hospital admissions in the three study cities from 2017 to 2019. Lower respiratory infections (J20–J22; J40–J47) accounted for the highest number of admissions, exceeding 600,000, followed by hypertension (I10–I15). Among the three cities, Tokyo’s 23 wards recorded the highest number of admissions, with more than 37,000 for cardiovascular diseases (CVD) and 38,000 for respiratory diseases (RD). Nagoya City ranked second, with more than 16,000 CVD admissions and 220,000 RD admissions. Osaka City reported the lowest figures with over 9,000 CVD and 67,000 RD cases.
Disease
codeI10–I15 I20 I21–I22 I25 I70–I79 I26–I28 J20–J22;
J40–J47Total
CVDsTotal
RDsTokyo 23,532 4,774 497 1,191 7,645 404 381,029 37,639 381,433 Osaka 6,126 1,312 112 343 1,825 61 67,666 9,718 67,727 Nagoya 10,666 2,570 208 330 2,512 365 224,207 16,286 224,572 Table 1. Hospitalization of each disease in Tokyo, Osaka, and Nagoya
According to Supplementary Table S1, Nagoya experienced the highest daily maximum temperature (33.31 °C), solar insolation (31.17 MJ/m2), and wind speed (8.71 m/s), but also recored the lowest minimum temperature (–1.10 °C). Osaka reported the highest average temperature (17.33 °C), slightly above Tokyo (16.40 °C) and Nagoya (16.66 °C). Tokyo exhibited the highest average atmospheric pressure (1010.90 hPa) and relative humidity (69.49%).
For air pollutants, Osaka had the highest average concentration of NOx (0.029 ppm) and SO2 (0.004 ppm). Tokyo reported the highest CO concentration (0.43 ppm), followed by Nagoya (0.34 ppm) and Osaka (0.33 ppm). Ox levels were similar across all three cities (0.024–0.030 ppm). PM2.5 and SPM showed minimal variation, ranging from 11.64 to 14.47 μg/m3 and 16.40 to 19.43 μg/m3, respectively.
-
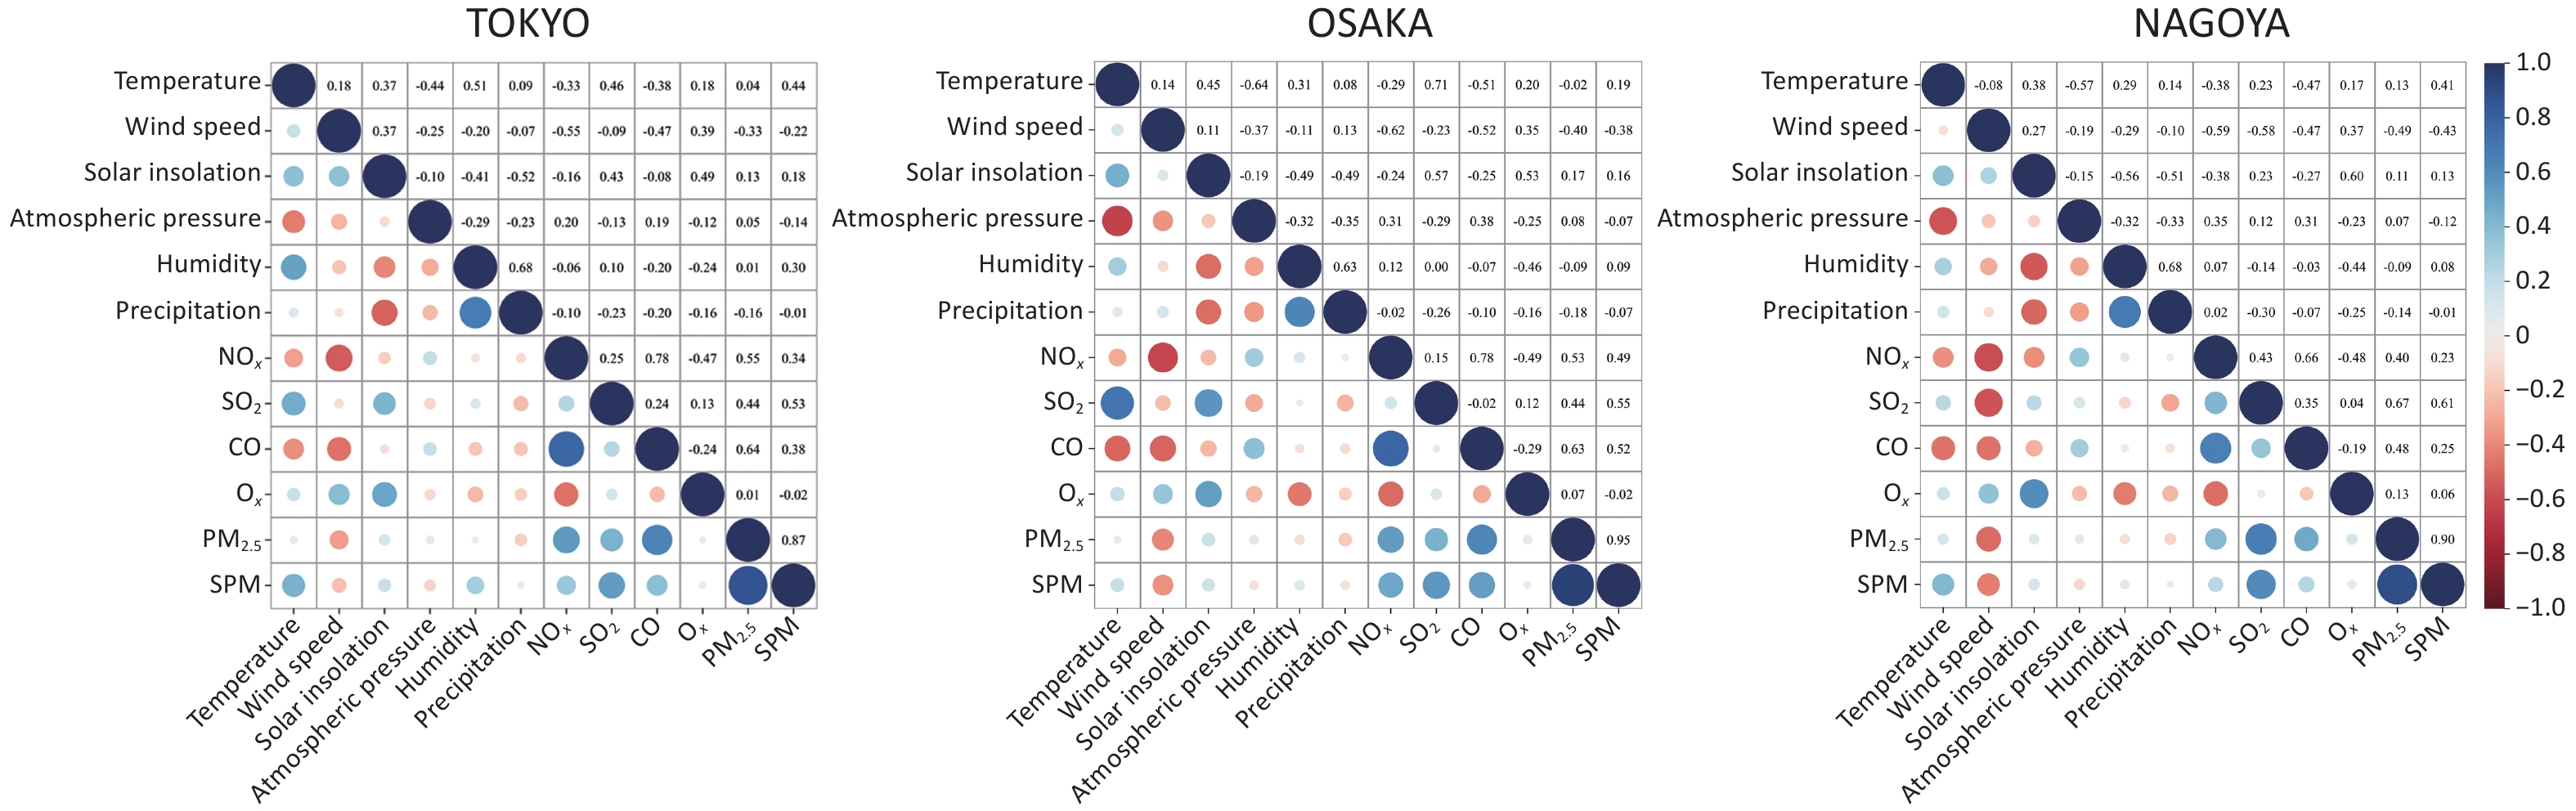
Spearman’s correlation analysis was conducted to examine the relationships between climate and air pollution variables across the three cities (Figure 2). Among the climatic variables, humidity and precipitation were positively correlated, whereas temperature and atmospheric pressure showed a consistent inverse relationship. For pollutants, NOₓ, CO, and SO2 were strongly correlated with PM2.5 concentrations, with the highest correlation observed between CO and PM2.5 in Tokyo (r = 0.64). Temperature consistently showed negative correlations with SO2 and NOₓ, particularly in Osaka (r = –0.71 for SO2). Wind speed was positively associated with Ox and negatively with NOₓ (r = –0.62 in Osaka).
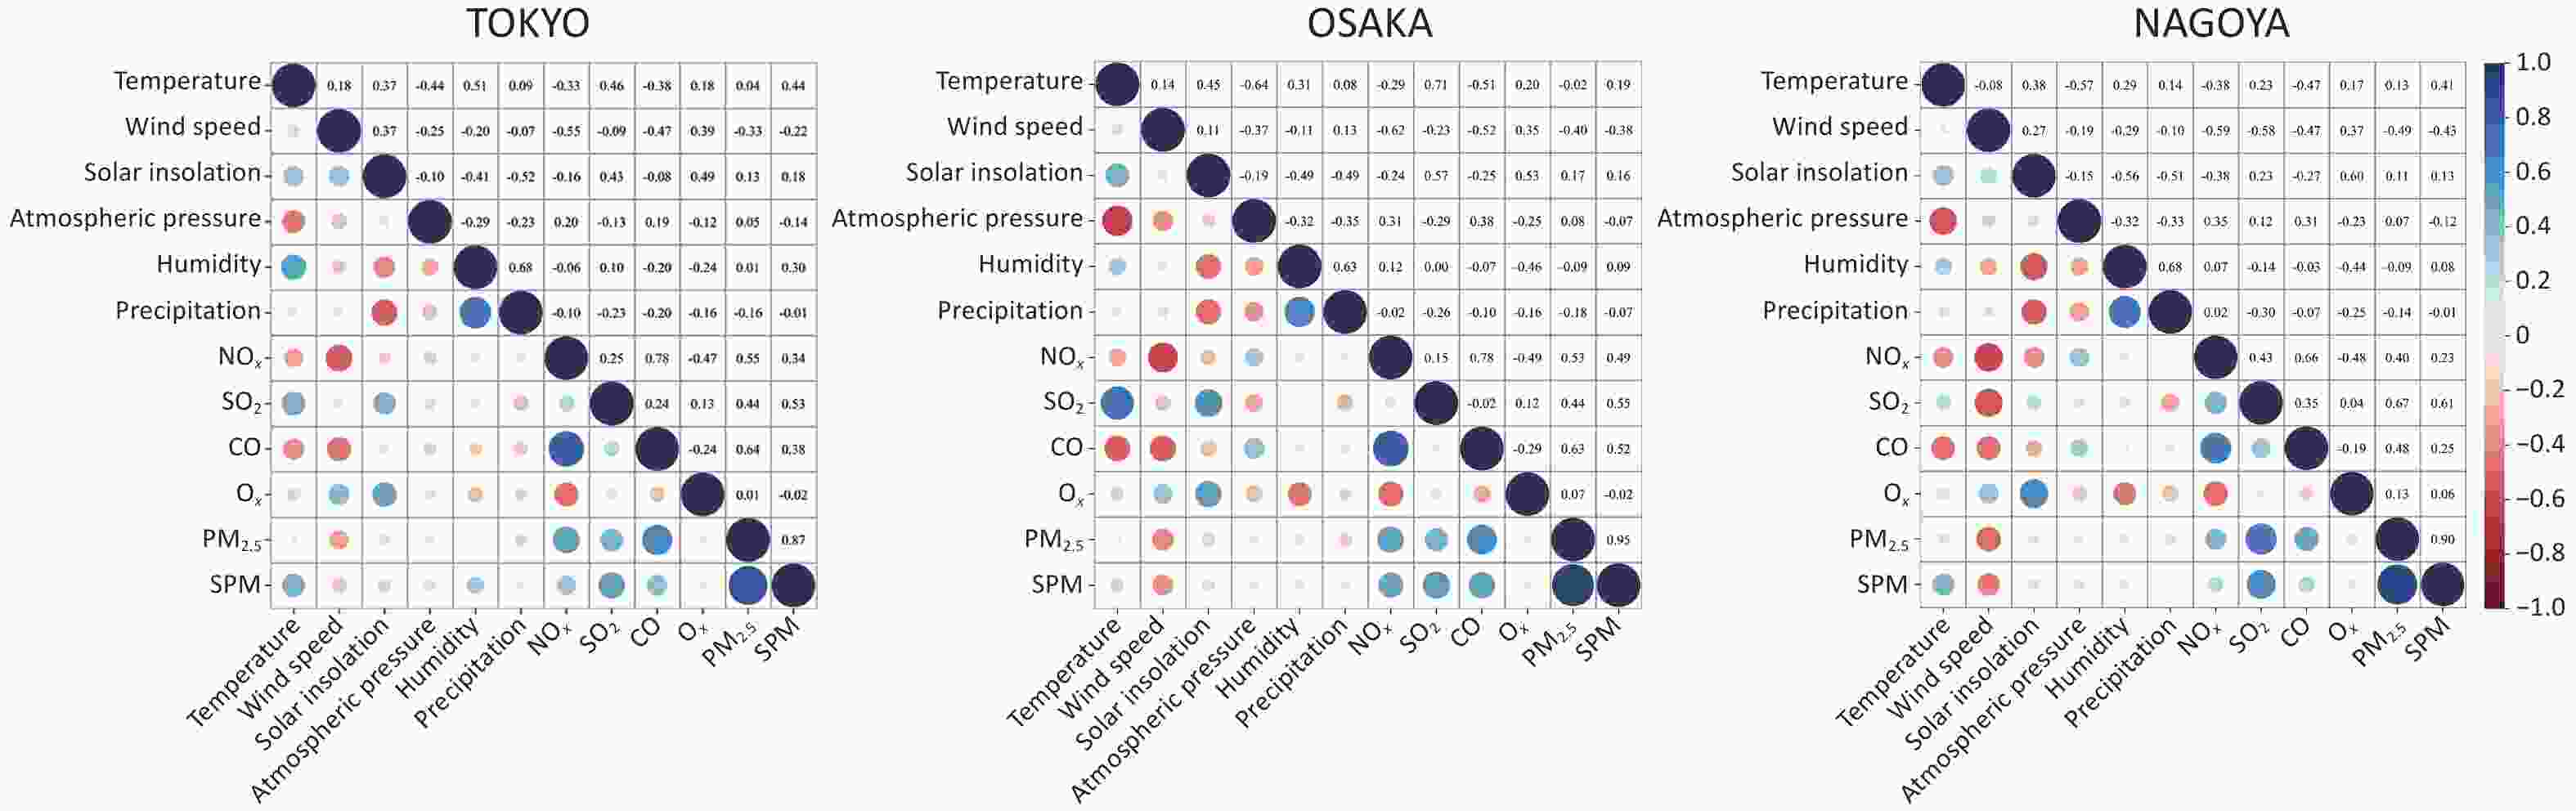
Figure 2. Heat map of the interaction between climate and air pollution factors. Red indicates a negative correlation, blue indicates a positive correlation, and the size of the dot represents the strength of the correlation, with larger dots indicating stronger correlations.
Despite these general patterns, regional differences were evident. For instance, humidity correlated negatively with NOₓ in Tokyo but positively in Nagoya and Osaka. Similarly, temperature showed a moderate positive correlation with NOₓ in Tokyo, in contrast to the negative associations observed in other cities. These findings highlight the spatial heterogeneity in climate–pollution interactions, which are likely influenced by local climatic, topographic, and anthropogenic factors.
-
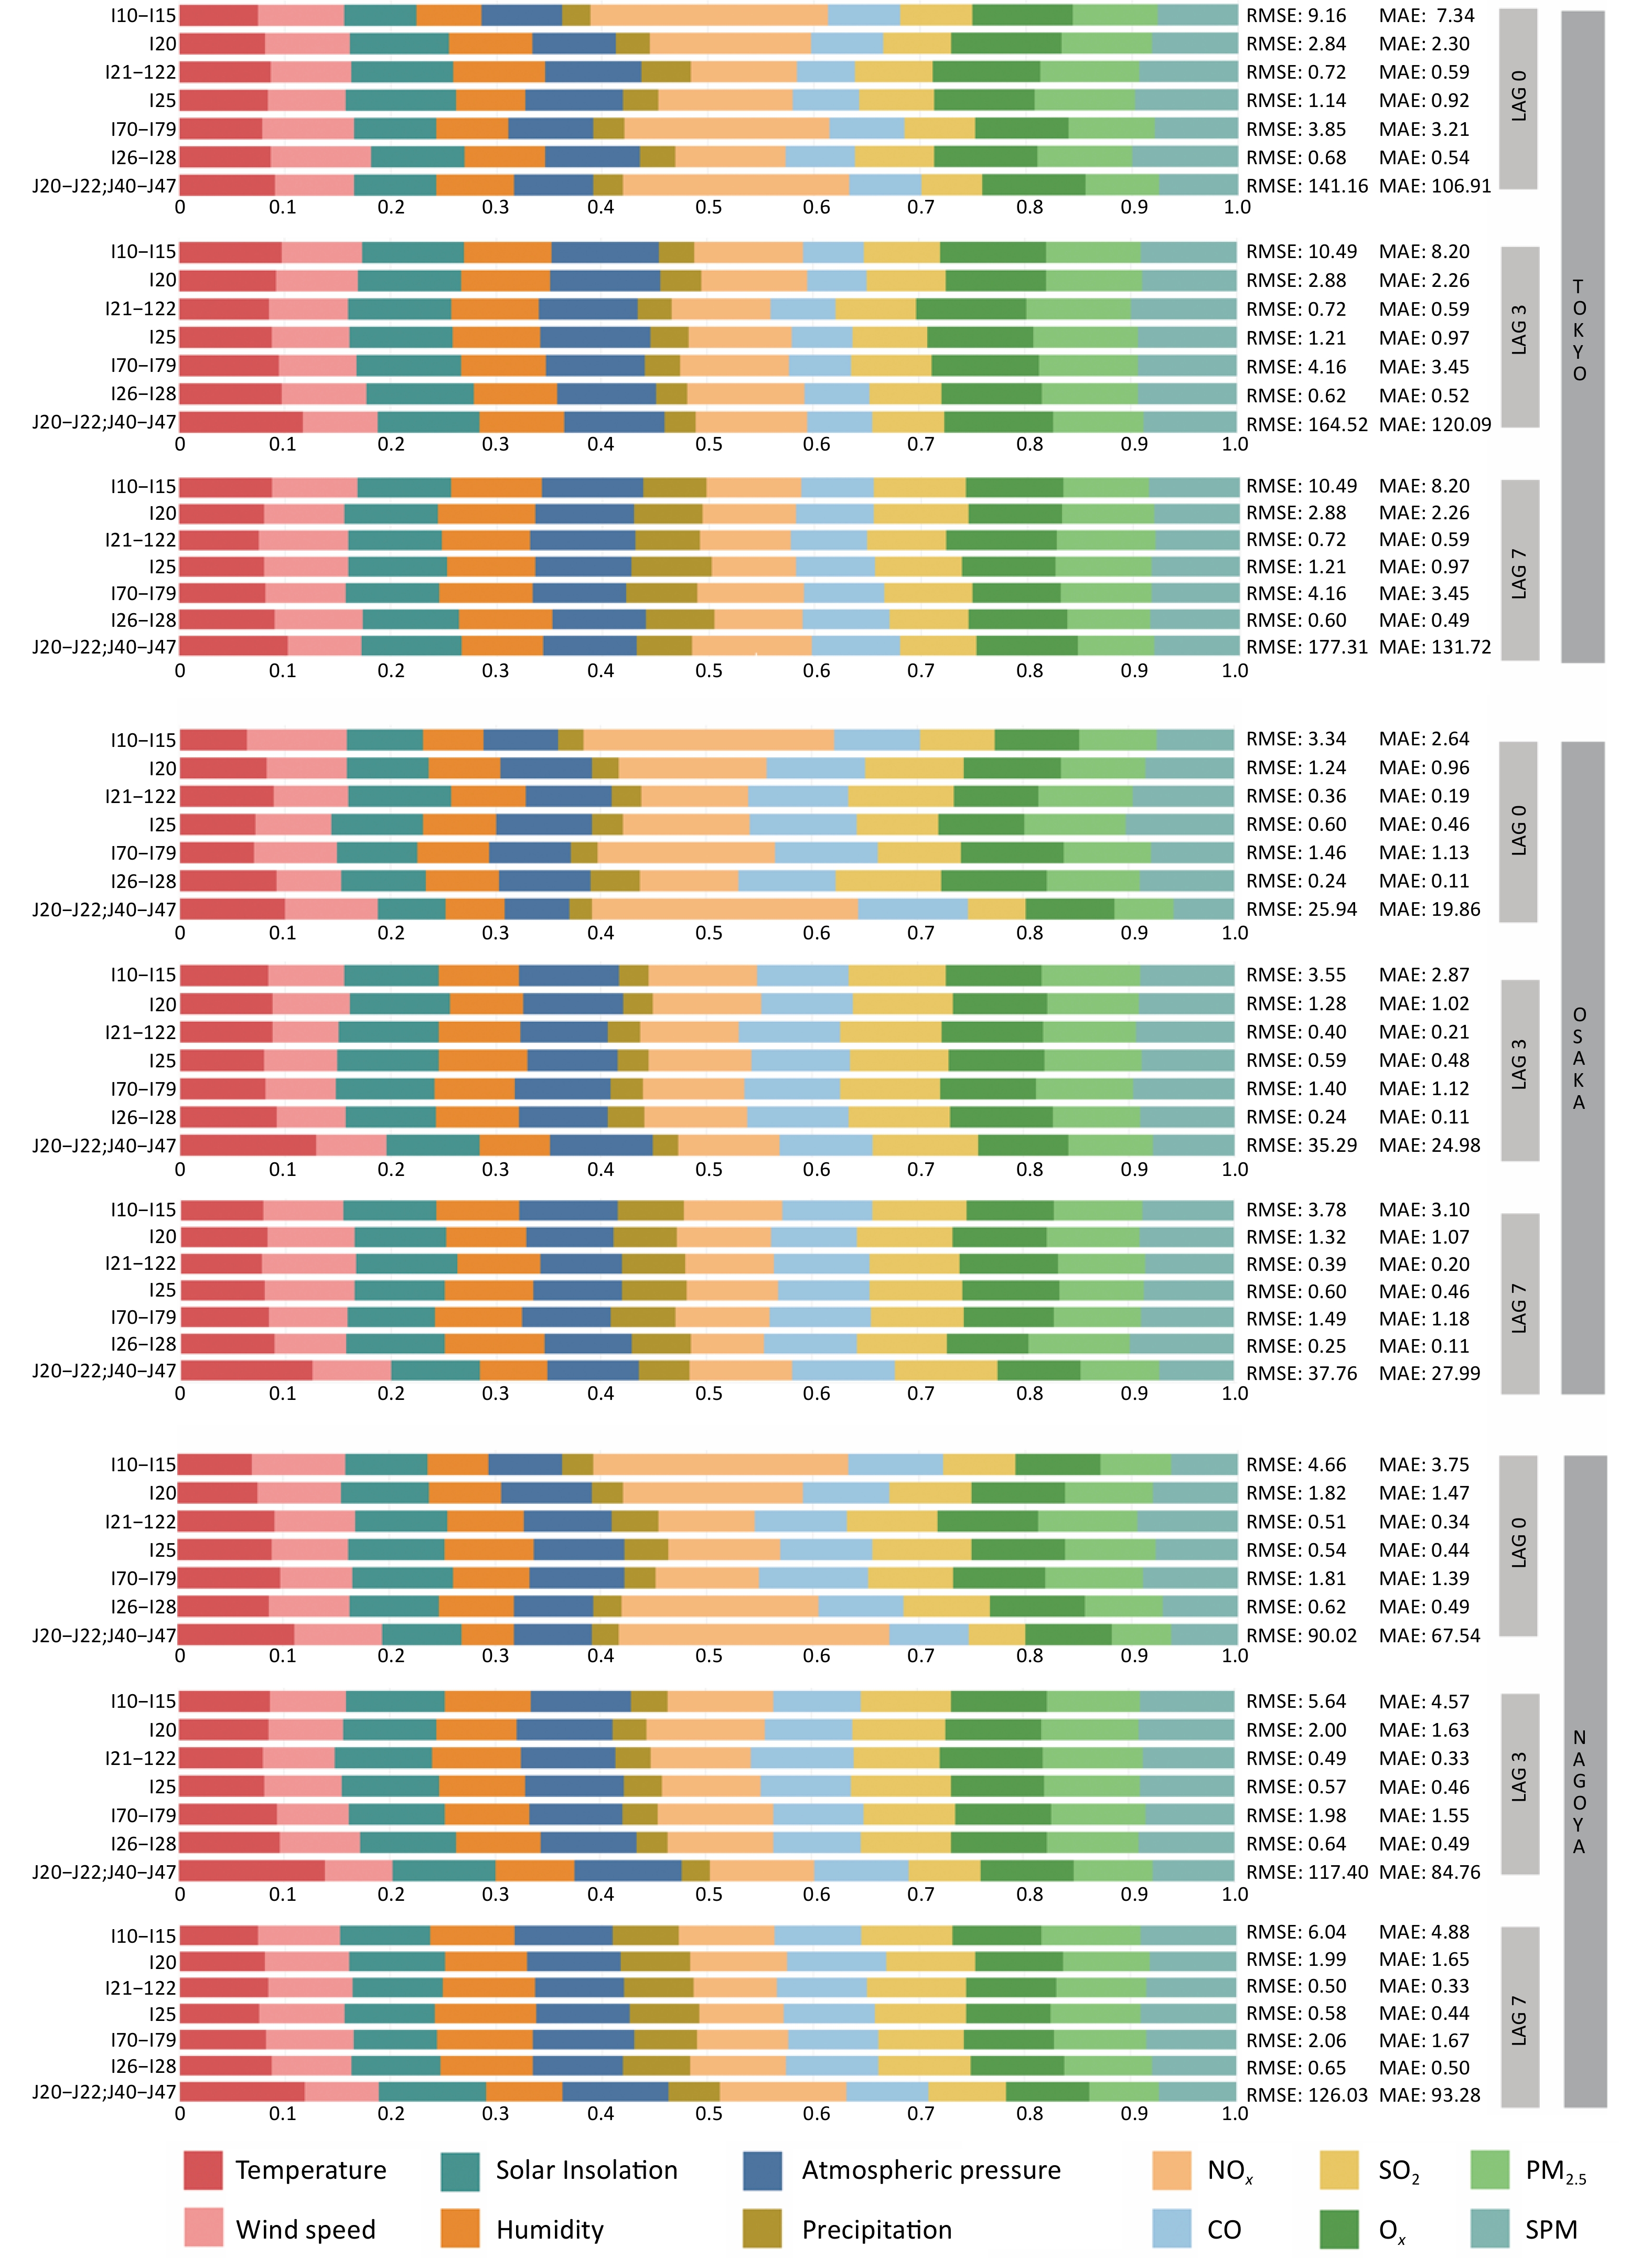
As shown in Figure 3 and Supplementary Table S2, on the day of exposure (lag0), air pollution exhibited a substantially greater total feature contribution to disease-related hospital admissions than climate variables in all three cities. Among the predictors, NOx was the most influential with a feature contribution of 0.24 in Osaka, 0.22 in Tokyo, and 0.21 in Nagoya. Its effect was particularly strong on hypertension (I10–I15), arterial capillary diseases (I70–I79), and lower respiratory infections (J20–J22, J40–J47). PM2.5 and SPM also showed notable contributions to cardiovascular-related admissions, especially for acute myocardial infarction (I21–I22), chronic ischemic heart disease (I25), and pulmonary heart disease (I26–I28). Regional variation was evident; CO contributed more in Osaka (0.16) and Nagoya (0.15) than in Tokyo (0.11). Similarly, SO2 had a greater influence on most diseases in Osaka and Nagoya, except for lower respiratory infections (J20–J22 and J40–J47), in which its effect remained consistently low.
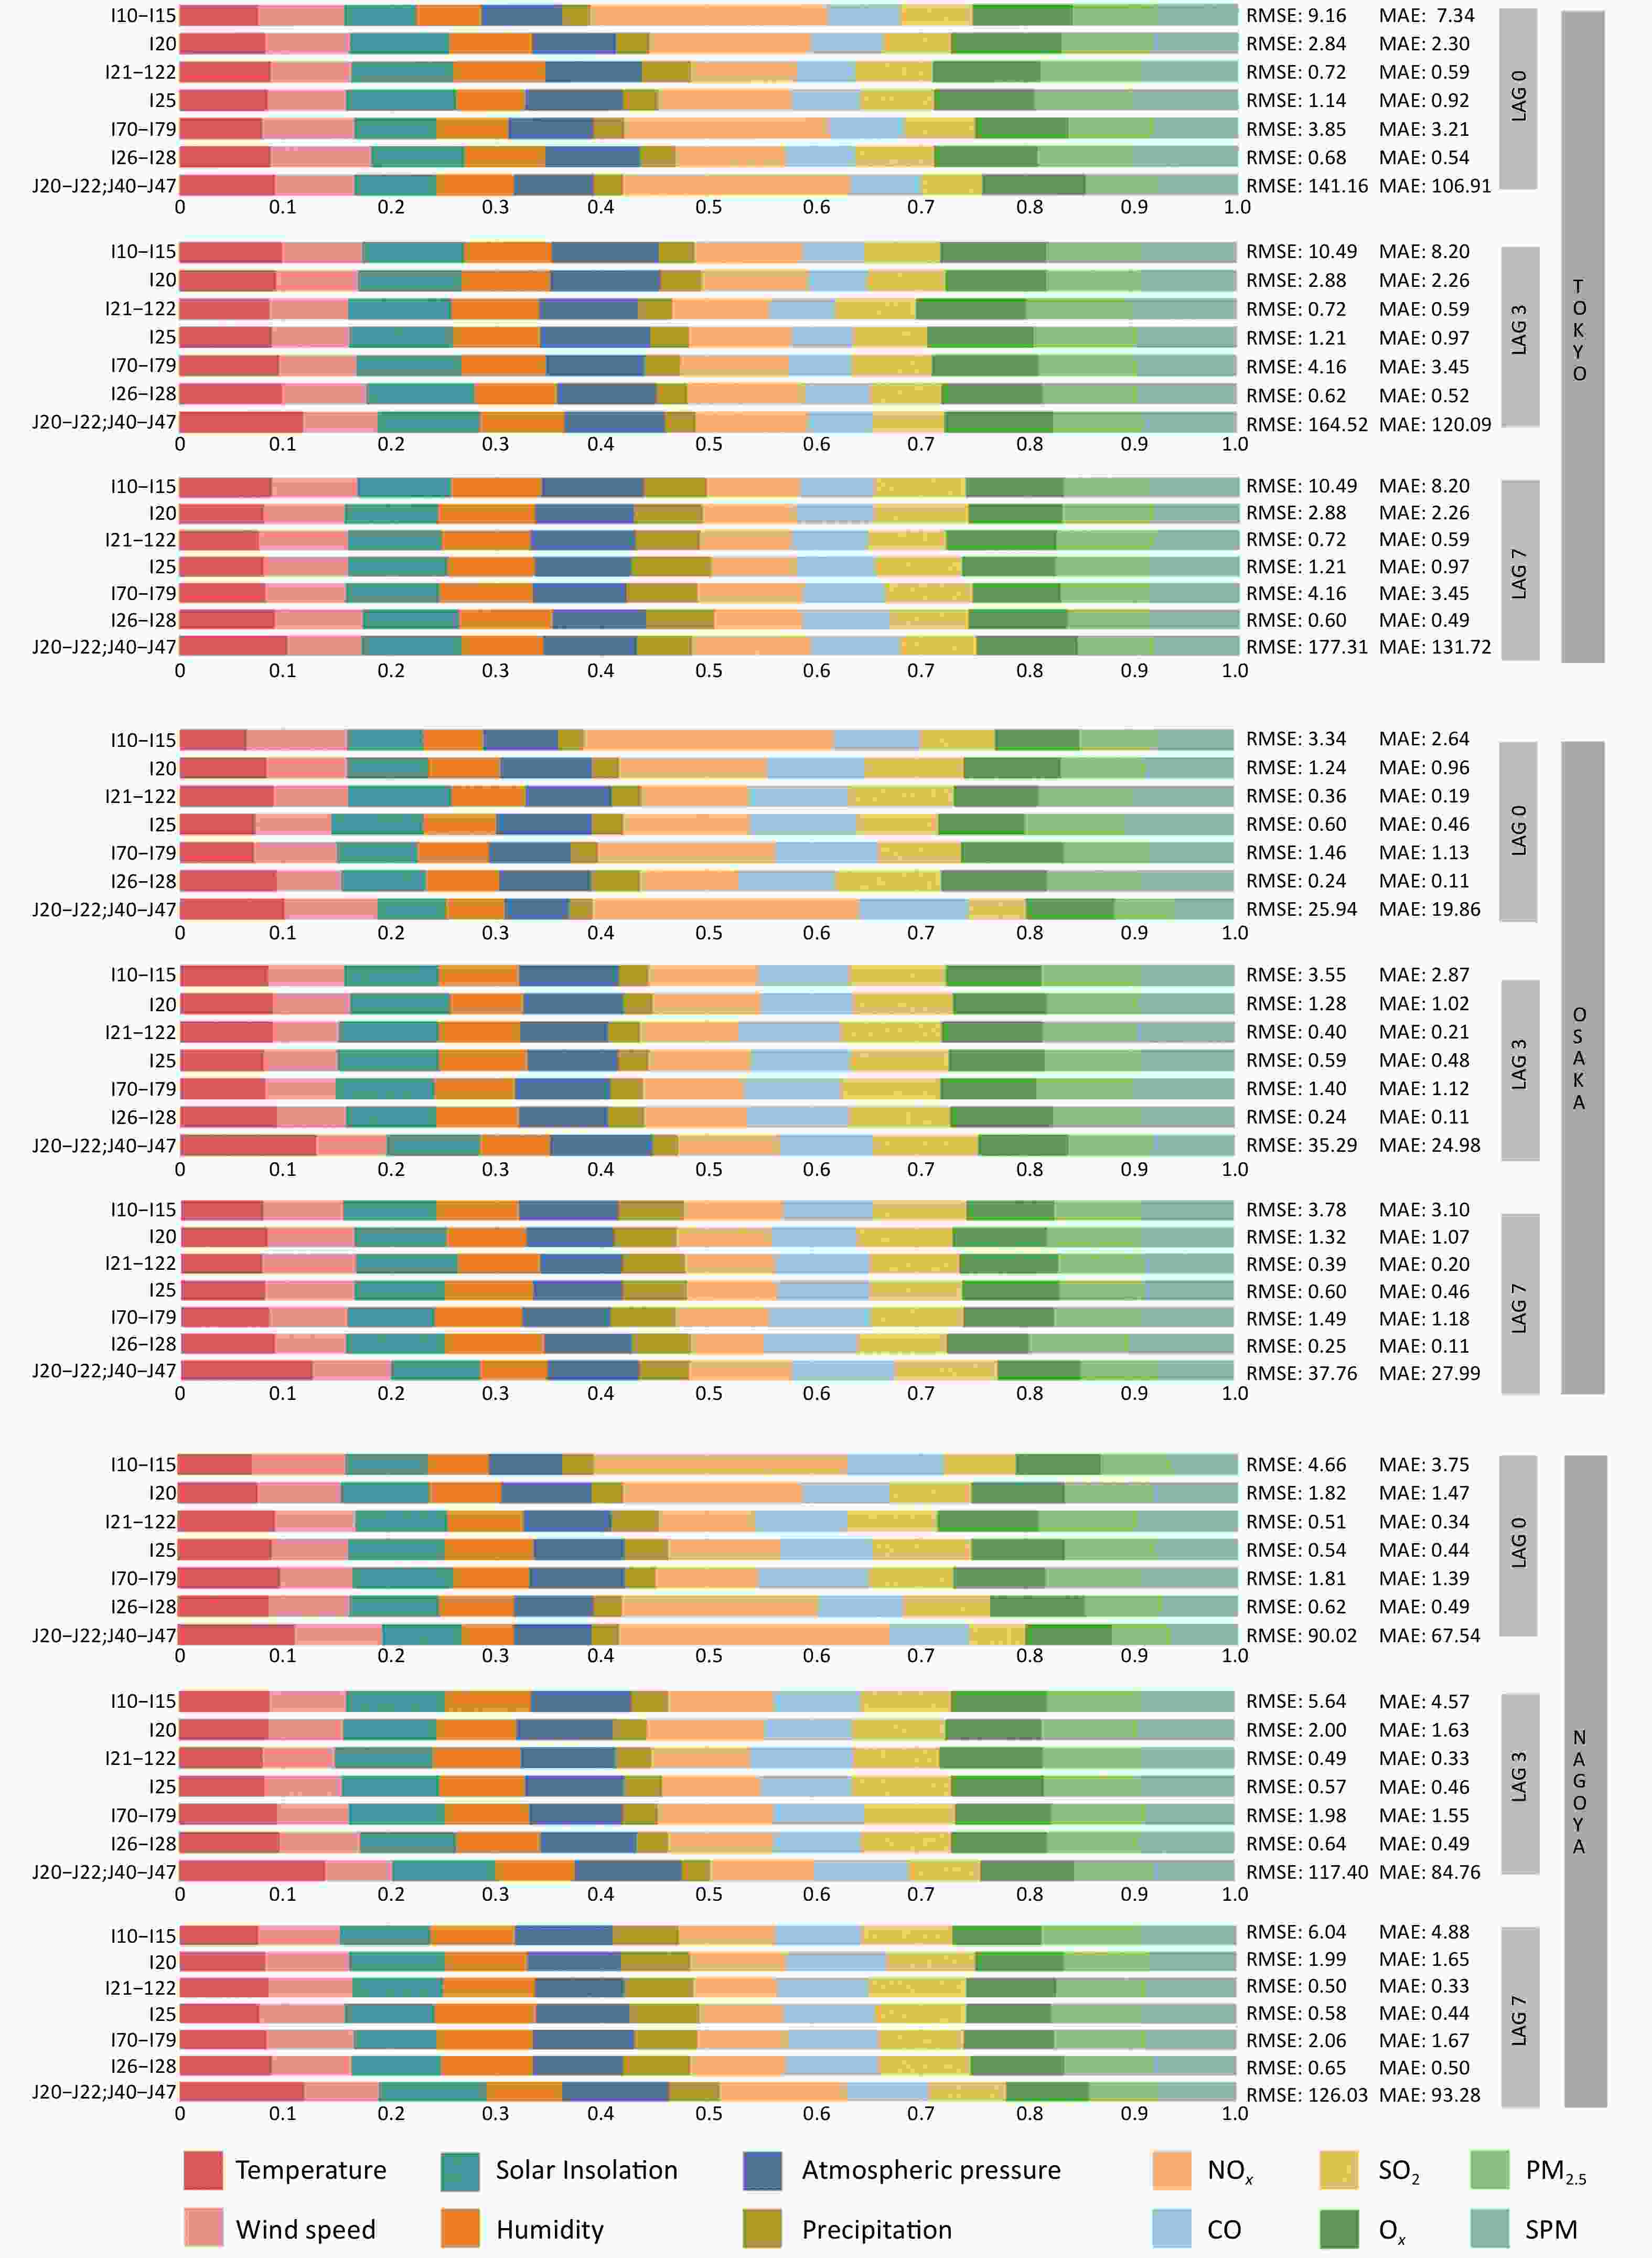
Figure 3. Feature contribution of climate and air pollution factors to disease-related hospitalizations across different cumulative lag days in Tokyo’s 23 wards, Osaka, and Nagoya. Climate variables include temperature, wind speed, solar insolation, humidity, atmospheric pressure, and precipitation, while air pollutants comprise NOx, SO2, CO, Ox, PM2.5, and SPM. Lag0, lag3, and lag7, respectively, measure the immediate, 3-day delayed, and 7-day delayed impacts of these meteorological factors on disease-related hospitalization.
At a 3-day lag (lag3), the contribution of most air pollutions declined, whereas the importance of climate variables increased. Temperature became a more significant predictor of lower respiratory tract infections (J20–J22 and J40–J47), with contributions reaching 0.09–0.11 across cities. In contrast, the contribution of NOx declined by more than 40% across all diseases, particularly hypertension (I10–I15) and respiratory diseases. CO and SO2 also exhibited modest decreases in their contributions.
At 7-day (lag7), the combined contribution of the climate variables approached that of the air pollutants. Precipitation became more influential, especially in admissions for acute myocardial infarction (I21–I22) and chronic ischemic heart disease (I25), with contributions reaching 0.06–0.08 in Osaka and Nagoya. Temperature was strongly associated with respiratory admissions in both cities, whereas the overall contribution of air pollution diminished.
Comparing the feature contributions across lag days, NOx showed the steepest decline, being dominant at lag0 but substantially reduced by lag3 and lag7. Conversely, temperature, solar insolation, humidity, and atmospheric pressure increased steadily over time, with their combined contributions increasing by 20%–30% from lag0 to lag7. PM2.5 and SPM remained relatively stable across lag periods but contributed slightly more to the acute disease categories. Notably, on the day of exposure, climatic variables contributed more to hospital admissions for acute myocardial infarction (I21–I22) than for other diseases, a pattern that was reversed at lag3 when air pollution became the dominant contributor. Across all lags, SPM and PM2.5 consistently contributed more to acute than chronic disease admissions.
-
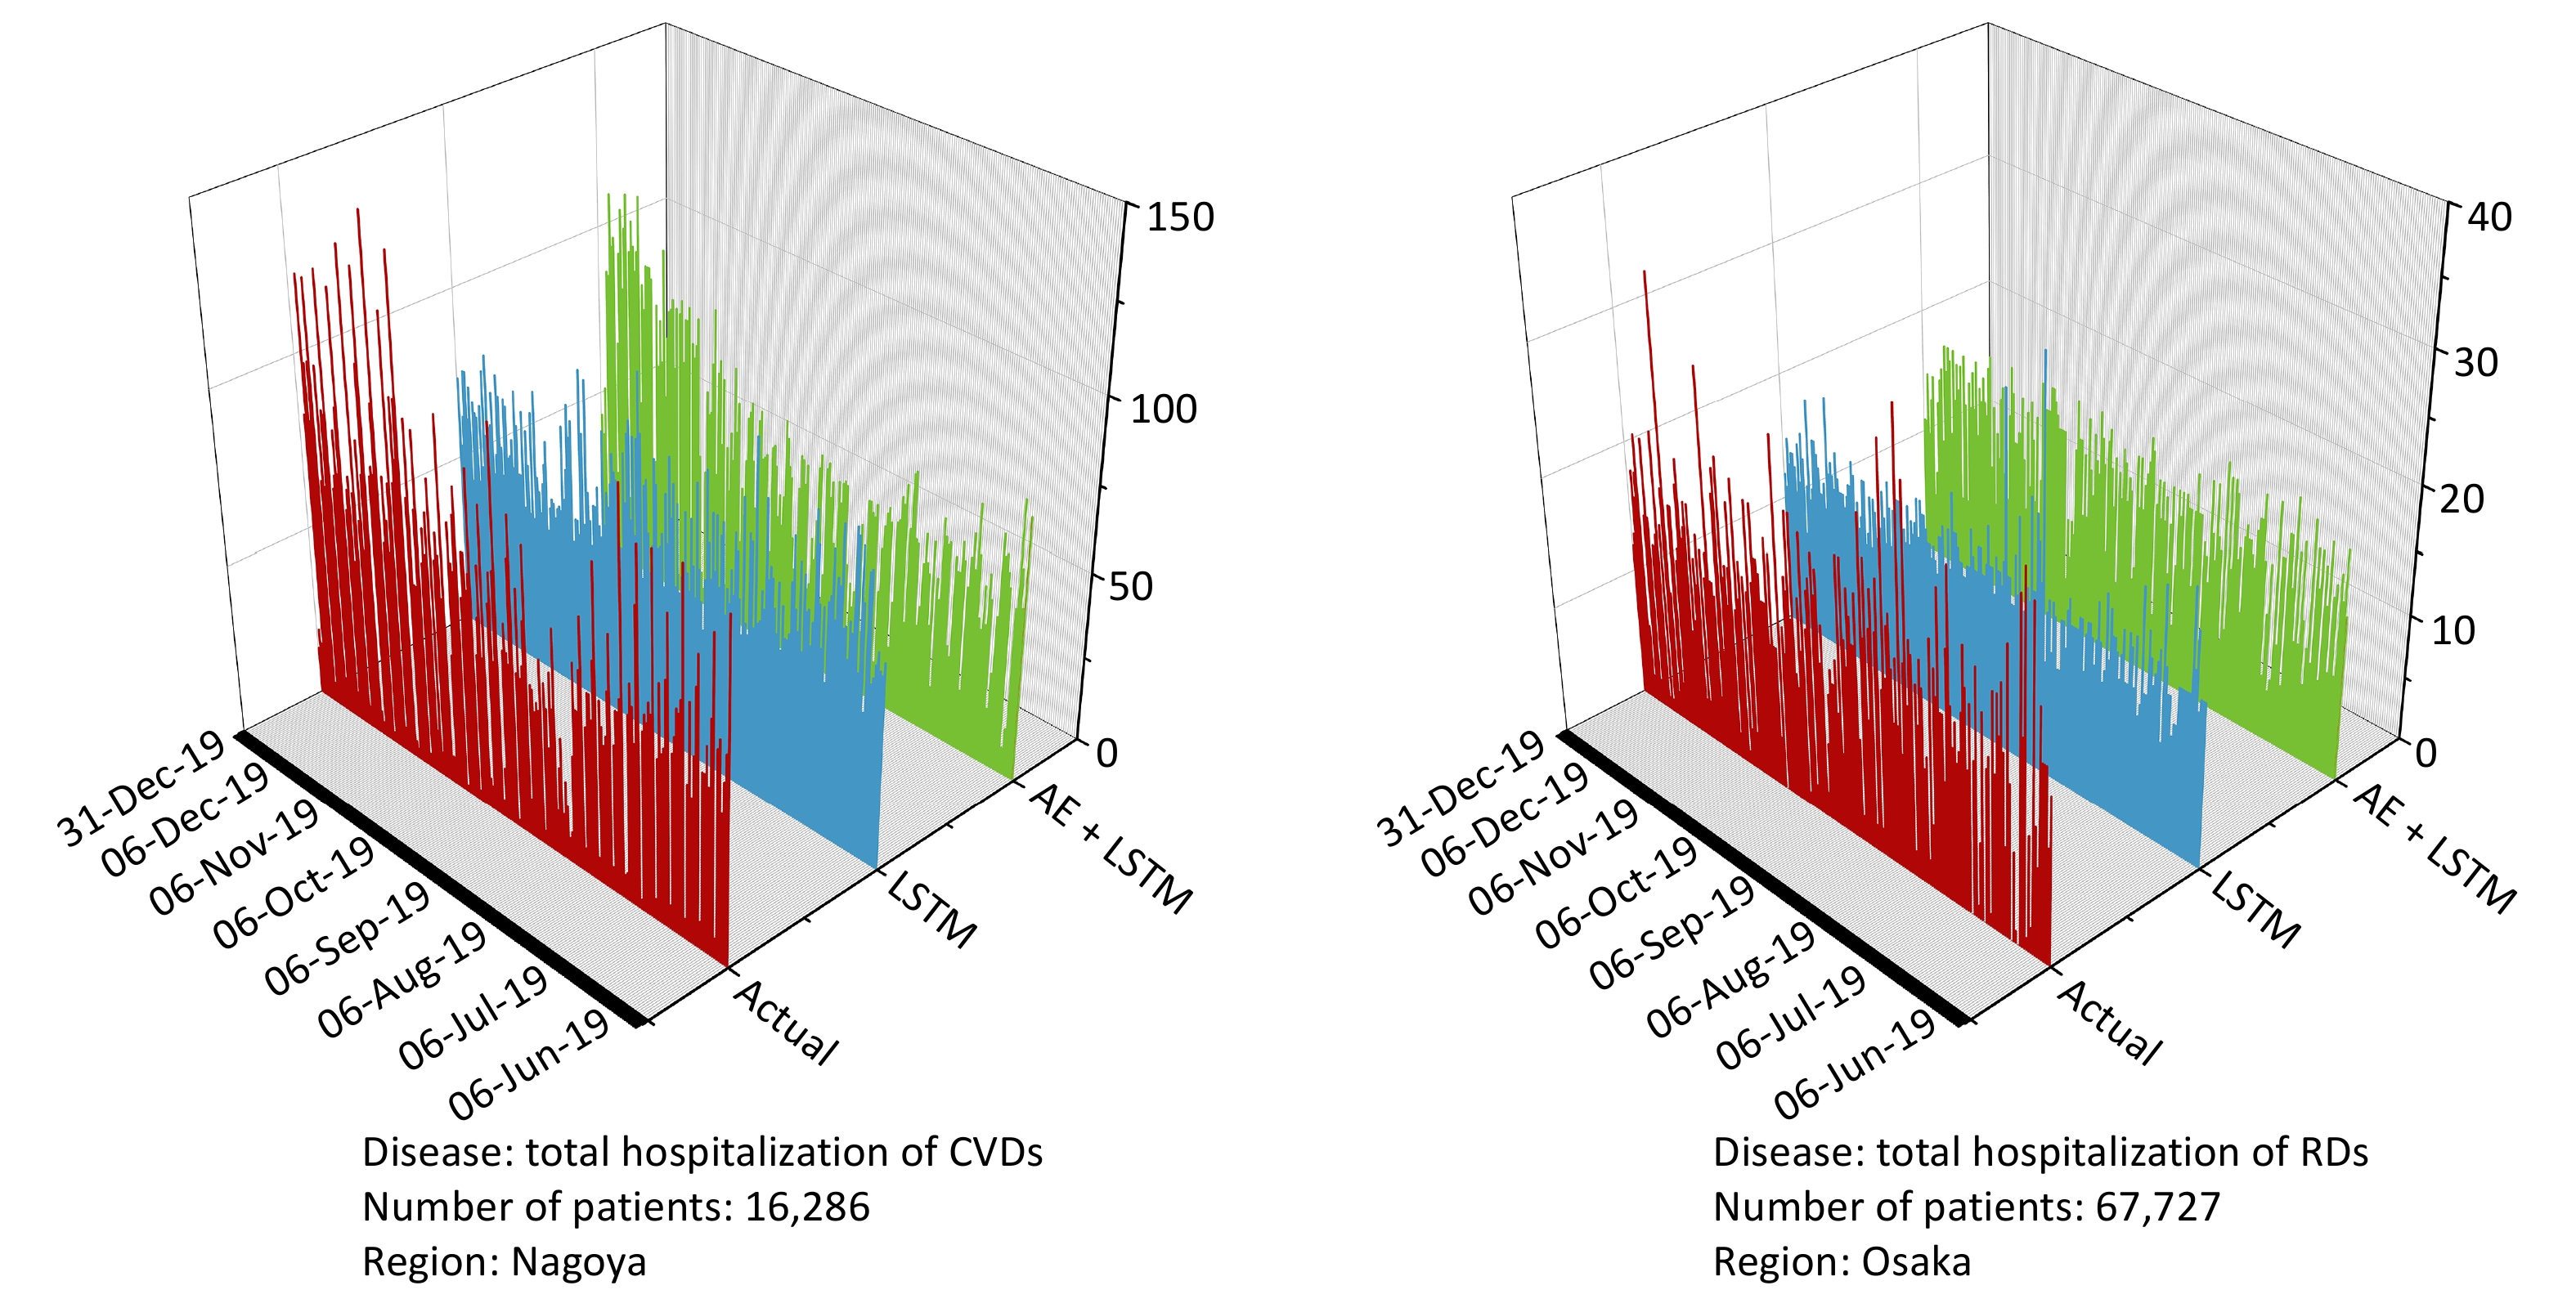
The AE+LSTM model consistently outperformed the standard LSTM model in predicting daily hospital admissions in all three cities. As shown in Table 2, in Nagoya, AE+LSTM achieved the largest gains for cardiovascular admissions (CVD), reducing the RMSE and MAE by 1.56 and 1.59, corresponding to improvements of 20.94% and 25.90%, respectively. The model also performed well for respiratory diseases (RD), with RMSE and MAE reductions of 25.02% and 22.61%, respectively. In Osaka, the greatest improvements were observed for respiratory diseases, where the RMSE decreased from 35.86 to 24.24 and the MAE from 26.92 to 18.33, representing improvements of 32.40% and 31.91%, respectively. Tokyo, although the performance gains were smaller, AE+LSTM still showed consistent improvements: for cardiovascular admissions, RMSE and MAE decreased by 10.45% and 9.77%, respectively, while for respiratory diseases, the reductions were 6.73% and 7.10%, respectively. Figure 4 shows the prediction results of the models.
LSTM AE+LSTM Relative improvement Tokyo Osaka Nagoya Tokyo Osaka Nagoya Tokyo Osaka Nagoya RMSE Total CVDs 13.78 4.68 7.45 12.34 4.47 5.89 10.45% 4.49% 20.94% Total RDs 171.72 35.86 116.43 160.17 24.24 87.32 6.73% 32.40% 25.00% MAE Total CVDs 10.75 3.82 6.14 9.7 3.63 4.55 9.77% 4.97% 25.90% Total RDs 129.60 26.92 85.33 120.40 18.33 66.01 7.10% 31.91% 22.64% Table 2. Comparison of RMSE and MAE and relative improvement (%) of prediction performance of LSTM and AE+LSTM

Figure 4. Visualization of prediction results with the best model performance in testing datasets. The vertical axis represents the number of daily hospitalizations. The left figure represents the prediction results of CVD-related hospitalization in Nagoya city, and the right figure illustrates the prediction results of RD-related hospitalization in Osaka city. The red line represnts actual hospitalization, the blue line represents the prediction value of the LSTM model, and the green line represents the prediction value of the AE+LSTM. CVDs, cardiovascular diseases; RDs, two respiratorydiseases; RMSE, Root Mean Square Error; MAE, Mean Absolute Error; LSTM, Long Short Term Memory; AE, autoencoder.
-
This study provides evidence of the differential temporal effects of climate and air pollution exposure on hospital admissions for cardiovascular and respiratory diseases across three major cities. We identified distinct lag structures for the climate and pollution variables, suggesting divergent biological mechanisms and risk dynamics.
The observed lag effects of climatic variables, particularly temperature and precipitation, were consistent with the findings of prior large-scale epidemiological studies. For instance, multi-country studies have shown that the risk of cardiovascular and respiratory admissions associated with ambient temperature often peaks at lag days 5 to 10, especially under extreme heat or cold events[18–20]. Similarly, extreme precipitation has been associated with an increased risk of myocardial infarction and infectious respiratory diseases, with both single-day and cumulative lag effects extending up to two weeks[21]. These effects likely reflect the complex physiological pathways through which the climate influences disease onset and progression[22], including changes in blood pressure, blood viscosity, and inflammatory responses[23]. Therefore, seasonal changes, temperature fluctuations, and extreme weather events are widely recognized as triggers of delayed health effects[24].
In contrast, the effects of air pollution were most pronounced on the day of exposure and declined rapidly thereafter, consistent with findings from time-series and controlled exposure studies[25]. NOx has emerged as a dominant short-term contributor to both cardiovascular and respiratory admissions, likely due to its role in inducing oxidative stress and endothelial dysfunction[26], particularly in traffic-dense urban environments. In addition, the (PM2.5 and SPM) demonstrated more sustained effects across lag periods. This supports existing evidence that fine and suspended particulates can penetrate deep into the lungs and enter the circulatory system, leading to systemic inflammation and coagulation disturbances that persist beyond initial exposure[27–29].
The AE+LSTM hybrid model consistently outperformed the conventional LSTM model in predicting admissions across all the cities. Its superior performance may be attributed to the ability of the autoencoder to extract latent features and reduce the input dimensionality, thereby enhancing temporal pattern recognition[31]. This finding aligns with prior studies that incorporated autoencoder modules into predictive architectures for cardiovascular risk modeling[32,33]. Such models hold the potential for integration into real-time surveillance systems, enabling timely and targeted public health responses under high-risk environmental conditions.
This study had several limitations. First, it focused on short-term lag effects and did not account for cumulative or chronic exposure, which are crucial in environmental epidemiology. Second, the use of city-level average environmental data may obscure intra-urban variability, thereby limiting spatial precision. Third, while the AE+LSTM model improved predictive accuracy, interpretability remains a challenge, and further work could incorporate SHAP (SHapley Addictive exPlanations) or LIME (local interpretable model-agnostic explanation) frameworks to enhance transparency.
-
This study reveals the distinct temporal dynamics through which climate and air pollution exposure affect cardiopulmonary hospital admissions in urban areas. Air pollution exhibited strong immediate effects, whereas the climatic variables demonstrated more persistent effects over extended lag periods. The AE+LSTM model consistently outperformed the standard LSTM models across all cities, achieving relative improvements of 5%–33%, demonstrating its ability to capture nonlinear multivariate dependencies. These findings highlight the value of integrating advanced machine-learning approaches with environmental surveillance to improve predictive performance and support timely evidence-based public health interventions.
Short-term Lag Effects of Climate-pollution Interactions on Cardiopulmonary Hospitalizations: A Multi-city Predictive Study Using the AE+LSTM Hybrid Model in Japan
doi: 10.3967/bes2025.137
-
Key words:
- Air pollution /
- Climate change /
- Cardiovascular diseases /
- Respiratory diseases /
- Deep learning /
- Hospitalization
Abstract:
Authors have no conflicts of interest to declare.
Not applicable.
| Citation: | Yijia Chen, Fan Zhao, Qingyang Wu, Yukitaka Ohashi, Tomohiko Ihara. Short-term Lag Effects of Climate-pollution Interactions on Cardiopulmonary Hospitalizations: A Multi-city Predictive Study Using the AE+LSTM Hybrid Model in Japan[J]. Biomedical and Environmental Sciences. doi: 10.3967/bes2025.137

|

 Quick Links
 DownLoad: