
-
According to the World Health Organization (WHO), cardiovascular diseases (CVD) are the leading causes of death worldwide, with the former primarily consisting of ischemic heart disease (IHD) and stroke[1]. In 2021, there were 19,906,615 CVD deaths globally, with IHD and strokes accounting for 9,208,289 and 7,439,649 deaths, respectively[2]. IHD and strokes are major contributors to global public health challenges and economic strain. According to data from the Medical Expenditure Panel Survey (2019-2020), the financial burden of CVD in the United States was estimated to be $422.3 billion, with IHD and strokes accounting for $252.2 billion and $56.2 billion in direct and indirect costs, respectively[2]. Similarly, CVD imposes a significant economic burden on the European Union, with annual costs estimated at ?282 billion, of which 27% (?77 billion) is attributed to IHD and 27% (?76 billion) to strokes[3]. Taken together, the burden of IHD and strokes represent a critical public health issue that warrants attention at both international and national levels[4].
Household air pollution (HAP) is a modifiable risk factor for the development of CVD[5]. HAP primarily results from the incomplete combustion of solid fuels such as wood, crop residues, animal dung, and coal, which are commonly used for cooking and heating in poorly ventilated environments[6]. This combustion produces a complex mixture of pollutants, including fine particulate matter (PM2.5), carbon monoxide, black carbon, ultrafine particles (UFPs), and volatile organic compounds (VOCs) such as formaldehyde, benzene, and toluene, which can accumulate in concentrations that far exceed outdoor air quality standards[7]. In the context of CVD, observational data have consistently shown a significant association between HAP and IHD, stroke, diabetes, and hypertension[8]. Research from Honduras suggests that the use of traditional stoves, which emit higher levels of HAP, are associated with metabolic risk factors, such as low-density lipoprotein cholesterol, triglycerides, and waist circumference, which are well-established factors linked to CVD[9]. Data from Indian women indicate that exposure to HAP resulting from biomass fuel use increases oxidized low-density lipoprotein levels in the bloodstream[10]. Over the past few decades, increasing evidence has highlighted the CVD burden associated with HAP. This has attracted the attention of clinicians, public health experts, and policymakers. Because HAP can be avoided through cleaner cooking and heating methods, reducing HAP is now a priority in global health research and policy development.
Using the latest Global Burden of Disease (GBD) 2021 data, this study investigates the global burden of CVD (including IHD and strokes) attributable to HAP and its trends over the past three decades. Subgroup analyses were performed based on age, sex, socioeconomic development, GBD region, and country. Projections of global and regional disease burdens for the period from 2022 to 2040 were also generated. The findings of this study offer valuable insights for health practitioners and policymakers in implementing large-scale initiatives to reduce the burden of CVD and health expenditures.
-
Data on the CVD burden attributable to HAP from solid fuels were obtained from the GBD 2021 database (https://vizhub.healthdata.org/gbd-results/) following the Institute for Health Metrics and Evaluation (IHME) web guidance. These data were used to assess the disease burden in 2021, analyze changes between 1990 and 2021, and project trends from 2022 to 2040. The GBD 2021 protocol is available on the IHME website. GBD 2021 is a large-scale international collaboration that annually updates epidemiological data on 371 diseases and injuries and 88 risk factors across 204 countries and territories and 811 subnational locations worldwide[11]. From the GBD 2021, which provides a wide range of health metrics, we extracted disability-adjusted life years (DALYs) and mortality rates disaggregated by total population, age, sex, CVD subgroup, and geographic location for this analysis. GBD applies a standardized quality-control pipeline (including source vetting and outlier screening, cause-of-death modeling (CODEm) with CoDCorrect reconciliation, nonfatal modeling via DisMod-MR 2.1, exposure/covariate estimation via ST-GPR/MR-BRT with cross-validation, and 95% uncertainty intervals derived from draws) to ensure the internal consistency and robustness of estimates. This study adhered to the Guidelines for Accurate and Transparent Health Estimates Reporting[12]. Since the GBD is publicly available, a summary-level database that contains no identifiable personal information, ethical approval, or informed consent was not required.
-
In the GBD 2021, HAP refers to exposure to particulate matter less than 2.5 micrometers in diameter (PM2.5) resulting from the use of solid fuels for cooking, such as coal, charcoal, wood, agricultural residue, or animal dung. CVD comprises of 18 conditions that contribute to mortality and disability. Mortality and disability due to IHD and stroke are partially attributed to HAP. IHD is defined as a coronary artery disease caused by atherosclerosis that can lead to angina pectoris, myocardial infarction (MI), or ischemic cardiomyopathy. A stroke is defined by the WHO criteria as the rapid onset of focal neurological disturbances lasting more than 24 hours or leading to death. Strokes are categorized as ischemic, intracerebral, or subarachnoid, based on whether they result from a blockage or rupture of blood vessels in the brain.
DALYs are calculated by summing the years of life lost and the years lived with disability. DALYs are a universal metric used to estimate the total number of years lost due to specific causes and risk factors at national, regional, and global levels. The mortality rate is expressed as the number of deaths per 100,000 individuals. Age-standardized DALYs rates (ASDRs) represent the weighted average of age-specific DALYs rates per 100,000 individuals, whereas age-standardized mortality rates (ASMRs) represent the weighted average of age-specific mortality rates per 100,000 individuals. The following formula outlines the comprehensive methodology for calculating age-standardized rates (ASRs):
$$ ASR=\frac{{\sum }_{i=1}^{N}{\alpha }_{i}{\omega }_{i}}{{\sum }_{i=1}^{N}{\omega }_{i}}\times \mathrm{100,000} $$ where $ {\alpha }_{i} $ is the disease burden of the $ i $th age group and $ \omega $i is the number of individuals in the same age group within a standard population. The 95% uncertainty interval (UI) represents the certainty of the estimate, bounded by the 2.5th and 97.5th percentiles of the posterior distribution based on 1000 simulations.
The regional burden of the disease is often influenced by local socioeconomic development. To assess the overall social and economic development of the regions, the GBD collaborators employed the sociodemographic index (SDI), a composite indicator that incorporates lag-distributed income per capita, the average educational attainment of individuals aged 15 years and older, and the fertility rate of women under 25 years of age[13]. Based on the SDI, 204 countries and territories were categorized into five groups: low SDI (< 0.47), low-middle SDI (0.47 to 0.62), middle SDI (0.62 to 0.71), high-middle SDI (0.71 to 0.81), and high SDI (> 0.81). In addition, 21 GBD regions were defined based on geographic proximity.
-
The disease burden was described by the number of cases and ASRs. Key variables were summarized using descriptive statistics and the results were expressed as the mean and 95% UI. Patterns of change in disease burden were described using the estimated annual percentage change (eAPC), annual percent change (APC), and average annual percent change (AAPC). Assuming a linear relationship between the natural logarithm of the age-standardized rate (ASR) and time, the following formula was developed: y = α + βx + ε, where y represents ln(ASR), x represents time (in years), and β represents the trend in ASR. The eAPC[95% confidence interval (CI)] was calculated as: eAPC = 100 × (exp(β) − 1). APC and AAPC were estimated with a log-linear Joinpoint regression, with the number and location of joinpoints selected by the software’s permutation test (overall α = 0.05), constrained by the time-series length. APC (95% CI) describes the trend within each segment, whereas AAPC (95% CI) represents the long-term average trend from 1990 to 2021[14]. Regardless of the metric used, a value greater than zero indicates an increase in ASR over time, and vice versa.
The impacts of age, period, and birth cohort on mortality and DALYs due to CVD attributable to HAP were assessed using an age-period-cohort (APC) model. The temporal framework was divided into six consecutive 5-year periods from 1992 to 2021, with the reference period set as 1992 to 1996. Age was categorized into successive 5-year intervals ranging from 25 to 29 years to over 95 years. Twenty consecutive birth cohorts were defined, spanning from 1892–1901 (median, 1897) to 1987–1996 (median, 1992), with the 1962–1971 birth cohort (median, 1967) serving as the reference group. This mid-series reference mitigates the edge effects and enhances interpretability. Local drifts quantify age-specific annual changes in disease burden, whereas period rate ratios compare changes in disease burden across calendar periods. Cohort rate ratios assess the variations in disease rates across birth cohorts. APC parameters are estimated under standard identifiability constraints using a Poisson log-linear specification with a population offset, and the results are reported with 95% confidence intervals; routine residual checks indicate adequate model fit. The estimated parameters are derived using the APC Web Tool[15].
A decomposition analysis was conducted to visually illustrate the contributions of three key factors—population aging, population growth, and epidemiological changes—to the trends in mortality and DALYs from 1990 to 2021[16].
Spearman’s correlation analysis was conducted to examine the relationship between disease burden and SDI. To measure the inequality in disease burden across countries with different levels of socioeconomic development, we employed the Slope Index of Inequality (SII) and Concentration Index of Inequality (CII). A regression analysis was used to quantitatively estimate the extent of health inequality along the socioeconomic gradient, and the SII captured the absolute difference in health outcomes between the highest and lowest socioeconomic groups. The concentration curve aligned with the line of equality when health outcomes were equally distributed across socioeconomic groups. It lies below the line if adverse outcomes were more common in higher socioeconomic groups and above it if concentrated in lower socioeconomic groups. CII, defined as twice the area between the curve and the line of equality, was positive when the curve lies below and negative when it lies above[17,18].
Disease burden projections were conducted using the Nordpred method, which is based on a generalized linear model framework that incorporates APC effects. The model assumes a Poisson distribution for the death count and DALYs and employs a power-5 link function to stabilize variance. Forecasts for 2022 to 2040 were generated by extrapolating the drift component, a linear combination of period and cohort effects, with progressive attenuation across successive future periods (i.e., multipliers of 0.8, 0.6, and 0.4, respectively) to avoid unrealistic exponential trends, as recommended in the Nordpred guidance[19]. Projections are presented for both counts and age-standardized rates (per 100,000), with uncertainty intervals derived from the model variance; population denominators follow the GBD series. The core assumptions included the continuation of recent trends in the absence of major shocks and stable age effects carried forward into the projection horizon.
P < 0.05 was considered statistically significant. All statistical analyses and data visualizations were performed using R software (version 4.2.3).
-
As shown in Table 1 and Supplementary Tables S1–S2, the number of CVD deaths attributable to HAP decreased from 1.881 million (1.473–2.358) in 1990 to 1.521 million (0.851–2.670) in 2021. Over the same period, ASMR declined from 50.942 (39.864–64.222) to 17.971 (10.014–31.945) per 100,000, with an eAPC of –3.692 (–4.098 to –3.284). Similarly, the number of DALYs decreased from 47.455 million (37.623–58.625) to 36.326 million (20.978–61.348), while ASDR fell from 1180.131 (930.978–1464.778) to 420.918 (242.750–713.207) per 100,000, with an eAPC of –3.652 (–4.013 to –3.290). These findings indicate a substantial global decline in the CVD burden attributable to HAP. Notably, both IHD- and stroke-related disease burdens also demonstrated consistent downward trends.
Region Number and ASR of Deaths Number and ASR of DALYs 1990 2021 EAPC (95% CI) 1990 2021 EAPC (95% CI) number (95% UI) ASR (per 100,000, 95% UI) number (95% UI) ASR (per 100,000, 95% UI) number (95% UI) ASR (per 100,000, 95% UI) number (95% UI) ASR (per 100,000, 95% UI) Global 1,880,657.879 (1,472,837.259, 2,357,817.396) 50.942 (39.864, 64.222) 1521,318.095 (850,724.660, 2,685,934.992) 17.971 (10.014, 31.945) –3.692 (–4.098, –3.284) 47,455,419.974 (37,623,080.461, 58,625,279.363) 1,180.131 (930.978, 1,464.778) 36,325,996.234 (20,978,352.518, 61,347,661.865) 420.918 (242.750,
713.207)–3.652 (–4.013, –3.290) sex female 928,642.095 (729,761.067, 1,188,703.477) 45.258 (35.551, 58.241) 736,300.986 (414,908.955, 1,290,682.932) 15.887 (8.983, 27.771) –3.691 (–4.065, –3.316) 22,174,007.790 (17,679,796.076, 27,673,576.123) 1,035.279 (824.592, 1,296.772) 16,556,619.587 (9,739,222.672, 27,624,848.227) 362.694 (214.118,
603.265)–3.692 (–4.017, –3.366) male 952,015.784 (736,035.279, 1,203,637.805) 58.280 (44.371, 73.665) 785,017.109 (433,066.894, 1,443,906.876) 20.417 (11.077, 38.038) –3.729 (–4.170, –3.285) 25,281,412.184 (19,758,026.744, 31,486,023.940) 1,347.550 (1,047.802, 1,688.625) 19,769,376.647 (11,322,770.632, 35,146,778.706) 483.885 (274.774, 866.564) –3.646 (–4.039, –3.251) SDI Level High SDI 35,564.942 (11,269.060, 86,207.772) 3.178 (1.004, 7.709) 1,236.557 (1.983, 12,066.121) 0.051 (0.000, 0.500) –14.165 (–14.762, –13.564) 744,892.126 (240,365.453, 1,808,553.421) 67.961 (21.943, 164.993) 20,683.960 (31.189, 202,634.212) 0.962 (0.001, 9.445) –14.569 (–15.178, –13.955) High-middle SDI 372,064.398 (251,168.512, 575,023.712) 41.698 (27.830, 65.481) 68,060.900 (4,640.614, 347,808.224) 3.503 (0.238, 17.951) –8.875 (–10.068, –7.666) 8,669,046.057 (5,945,305.947, 12,886,900.493) 889.718 (606.841, 1,338.506) 1,303,578.344 (88,766.139, 6,628,736.675) 66.587 (4.518, 339.268) –9.179 (–10.353, –7.989) Middle SDI 748,469.553 (595,495.371, 912,670.376) 89.217 (70.722, 109.457) 386,057.024 (94,363.826, 960,870.397) 16.256 (3.943, 40.676) –5.645 (–6.375, –4.910) 18,620,836.347 (14,823,029.545, 22,807,824.146) 1,852.916 (1,477.056, 2,262.732) 8,348,151.870 (2,106,573.998, 20,745,508.416) 320.714 (80.319, 800.632) –5.816 (–6.513, –5.113) Low-middle SDI 514,621.956 (425,127.016, 602,635.778) 97.179 (80.032, 113.661) 709,060.684 (447,123.041, 982,432.742) 55.457 (35.158, 76.695) –1.869 (–2.063, –1.674) 13,821,642.672 (11,455,323.024, 16,146,487.768) 2,212.839 (1,835.208, 2,590.715) 17,474,322.761 (10,969,400.356, 24,321,363.294) 1,210.197 (762.988, 1,679.106) –2.007 (–2.211, –1.804) Low SDI 208,165.687 (171,497.686, 243,494.357) 110.290 (90.717, 128.224) 355,717.279 (286,762.546, 424,458.309) 84.750 (68.256, 100.605) –0.917 (–0.978, –0.855) 5,557,253.007 (4,541,156.872, 6,560,088.337) 2,454.875 (2,014.294, 2,864.410) 9,149,051.644 (7,385,881.659, 10,924,545.636) 1,807.352 (1,461.503, 2,152.844) –1.123 (–1.189, –1.058) GBD region South-East Asia, East Asia & Oceania South-East Asia 233,418.213 (183,807.366, 280,617.558) 108.478 (85.652, 131.085) 197,390.015 (86,880.473, 346,967.514) 34.842 (15.376, 60.951) –3.584 (–4.067, –3.099) 6,099,822.268 (4,844,573.210, 7,339,192.069) 2,375.202 (1,875.664,
2,852.173)4,796,996.672 (2,114,973.847, 8,493,886.405) 739.893 (326.097,
1,312.822)–3.695 (–4.157, –3.230) Oceania 3,551.284 (2,641.891, 4,578.652) 146.394 (110.961, 183.783) 6,964.036 (5,036.632, 9,058.021) 109.470 (80.243, 141.952) –0.914 (–0.978, –0.851) 104,503.360 (76,877.678, 136,576.004) 3,377.614 (2,524.625, 4,337.315) 201,753.639 (143,816.987, 265,452.379) 2,517.751 (1,831.938,
3,264.332)–0.923 (–0.975, –0.870) East Asia 786,113.325 (619,582.977, 968,707.469) 121.915 (96.760, 150.072) 294,814.482 (74,398.607, 874,733.173) 15.190 (3.742, 45.105) –7.038 (–7.926, –6.141) 19,033,294.425 (14,977,925.165, 23,397,555.255) 2,371.938 (1,880.558, 2,924.879) 5,938,106.676 (1,590,360.313, 17,425,367.226) 284.913 (75.462, 837.639) –7.173 (–8.011, –6.327) Sub-saharan Africa Western 71,963.856 (54,365.413, 88,997.461) 99.434 (75.718, 123.034) 112,030.003 (78,175.310, 147,815.091) 72.025 (50.183, 94.460) –1.329 (–1.533, –1.124) 1,747,433.915 (1,332,102.551, 2,155,468.190) 2,057.678 (1,550.201, 2,533.402) 2,769,022.673 (1,921,493.914, 3,661,286.014) 1,456.644 (1,015.751, 1,918.359) –1.413 (–1.617, –1.208) Southern 7,370.143 (4,492.750, 10,964.393) 31.498 (19.130, 46.955) 9,718.305 (6,025.833, 16,010.065) 19.385 (11.672, 32.636) –1.694 (–2.414, –0.969) 184,786.533 (110,912.495, 277,001.006) 684.293 (417.826, 1,019.125) 242,561.708 (152,616.580, 394,725.944) 420.394 (264.357, 691.675) –1.693 (–2.362, –1.020) Central 21,362.788 (16,636.942, 26,797.055) 123.817 (97.604, 151.192) 37,225.545 (26,945.837, 48,205.463) 91.059 (66.802, 116.602) –1.231 (–1.341, –1.122) 570,072.375 (441,917.612, 725,019.673) 2,647.140 (2,070.160, 3,291.545) 969,439.698 (704,605.140, 1,259,244.660) 1,868.428 (1,368.704, 2,404.736) –1.370 (–1.478, –1.262) Eastern 68,615.616 (56,651.581, 80,852.319) 110.017 (91.709, 128.888) 112,649.766 (92,518.045, 133,860.603) 81.831 (67.224, 97.772) –1.163 (–1.227, –1.099) 1,847,678.033 (1,524,449.351, 2,194,674.646) 2,463.454 (2,032.990, 2,897.116) 2,956,501.093 (2,416,762.207, 3,518,603.467) 1,753.371 (1,437.518, 2,081.249) –1.332 (–1.403, –1.261) South Asia South Asia 459,412.207 (371,609.168, 536,833.971) 91.979 (74.678, 107.610) 653,920.667 (412,075.170, 956,841.078) 49.464 (31.243, 72.346) –2.023 (–2.235, –1.811) 12,695,781.583 (10,365,496.056, 14,902,842.164) 2,126.983 (1,734.906, 2,483.903) 16,218,501.325 (10,196,200.516, 23,667,357.245) 1,089.413 (684.800, 1,588.967) –2.203 (–2.416, –1.990) Latin America & Caribbean Tropical 25,322.437 (12,842.413, 42,605.695) 33.194 (17.109, 55.169) 6,395.271 (1,465.269, 17,244.853) 2.562 (0.588, 6.920) –8.196 (–8.471, –7.920) 611,330.583 (305,323.712, 1,045,662.624) 677.562 (340.894, 1,146.487) 143,427.688 (32,758.871, 385,273.111) 55.772 (12.750, 149.784) –8.124 (–8.412, –7.835) Caribbean 10,159.666 (7,232.524, 13,372.471) 41.248 (29.050, 54.816) 10,837.969 (7,623.329, 14,799.693) 20.208 (14.242, 27.505) –2.221 (–2.396, –2.046) 249,454.533 (180,939.652, 322,788.119) 951.350 (687.734, 1,233.865) 275,829.359 (195,500.803, 376,286.840) 518.166 (367.718, 705.928) –1.912 (–2.113, –1.710) Andean 5,798.175 (2,733.844, 9,170.988) 31.168 (14.659, 49.286) 2,189.567 (385.619, 7,064.788) 3.846 (0.676, 12.445) –6.844 (–7.185, –6.501) 137,205.009 (64,933.964, 217,957.130) 656.171 (310.446, 1,042.271) 47,288.518 (8,223.531, 149,400.499) 79.713 (13.909, 252.381) –6.904 (–7.242, –6.565) Central 13,559.456 (5,706.938, 25,477.492) 19.131 (7.964, 35.961) 12,552.179 (4,302.968, 29,962.186) 5.283 (1.798, 12.627) –4.265 (–4.352, –4.179) 313,896.094 (135,477.190, 582,986.732) 380.440 (161.378, 711.093) 260,730.021 (93,971.315, 621,454.883) 105.069 (37.629, 250.361) –4.315 (–4.396, –4.234) North Africa & Middle East North Africa & Middle East 68,885.325 (44,083.337, 107,711.088) 48.702 (30.578, 77.744) 37,791.021 (25,346.199, 54,074.286) 9.333 (6.236, 13.472) –5.779 (–5.953, –5.605) 1,725,882.492 (1,123,615.661, 2,653,045.857) 1,030.023 (661.949, 1,602.550) 984,282.727 (668,729.750, 1,402,366.493) 205.918 (138.807, 294.255) –5.686 (–5.863, –5.508) Central Europe, Eastern Europe & Central Asia Central Asia 26,534.488 (11,869.005, 48,317.498) 64.266 (28.778, 116.655) 12,431.845 (5,184.309, 28,313.425) 18.622 (7.676, 42.614) –5.377 (–6.487, –4.254) 576,540.933 (255,665.713, 1,052,556.653) 1,274.040 (567.312, 2,324.225) 274,065.937 (116,653.034, 612,448.758) 356.639 (149.752, 805.973) –5.577 (–6.706, –4.435) Central Europe 48,319.666 (11,585.318, 126,383.330) 36.614 (8.825, 95.370) 6,610.113 (227.149, 42,818.968) 2.766 (0.095, 17.931) –9.705 (–10.447, –8.958) 967,158.892 (236,801.044, 2,521,940.399) 680.015 (166.848, 1,769.610) 109,864.572 (3,721.683, 706,950.060) 48.471 (1.626, 312.218) –9.928 (–10.694, –9.155) Eastern Europe 22,735.071 (4,889.770, 88,577.231) 9.406 (2.009, 36.495) 7,433.954 (1,061.412, 30,395.651) 2.083 (0.299, 8.499) –7.232 (–8.895, –5.539) 438,128.423 (97,720.148, 1,706,631.825) 166.906 (36.945, 648.029) 130,877.448 (19,389.909, 535,333.687) 37.389 (5.555, 152.743) –7.234 (–8.925, –5.512) High Income Western Europe 1,251.961 (13.690, 10,018.977) 0.210 (0.002, 1.682) 49.197 (0.017, 434.194) 0.004 (0.000, 0.037) –12.429 (–13.051, –11.803) 21,675.409 (240.287, 172,827.384) 3.731 (0.041, 29.789) 733.120 (0.253, 6,388.990) 0.073 (0.000, 0.635) –12.469 (–13.110, –11.823) Southern Latin America 5,497.128 (1,405.938, 13,844.739) 13.019 (3.324, 32.709) 282.148 (1.086, 2,548.440) 0.311 (0.001, 2.815) –11.853 (–12.123, –11.583) 113,554.304 (29,223.510, 289,480.877) 252.766 (65.030, 643.973) 5,476.371 (21.041, 49,336.058) 6.280 (0.024, 56.602) –11.803 (–12.077, –11.529) North America 70.486 (0.007, 591.341) 0.019 (0.000, 0.162) 9.856 (0.000, 57.712) 0.001 (0.000, 0.008) –9.156 (–9.532, –8.778) 1,296.852 (0.127, 10,721.498) 0.369 (0.000, 3.048) 181.506 (0.000, 1,053.398) 0.028 (0.000, 0.164) –8.926 (–9.276, –8.574) Asia Pacific 671.798 (49.639, 3,700.981) 0.364 (0.026, 2.020) 19.936 (0.001, 159.841) 0.003 (0.000, 0.025) –14.025 (–15.193, –12.842) 15,106.467 (1,171.716, 81,824.422) 7.670 (0.589, 41.694) 319.783 (0.017, 2,426.457) 0.065 (0.000, 0.486) –14.099 (–15.300, –12.882) Australasia 44.791 (0.015, 496.406) 0.200 (0.000, 2.223) 2.220 (0.000, 13.918) 0.004 (0.000, 0.022) –13.201 (–13.905, –12.491) 817.491 (0.303, 8,923.057) 3.539 (0.001, 38.688) 35.698 (0.000, 218.484) 0.065 (0.000, 0.394) –13.151 (–13.909, –12.387) Note. household air pollution, HAP; age-standardized rates, ASR; uncertainty interval, UI; estimated annual percentage change, eAPC. Table 1. Burden of cardiovascular disease attributable to HAP in 1990 and 2021 and its trends
-
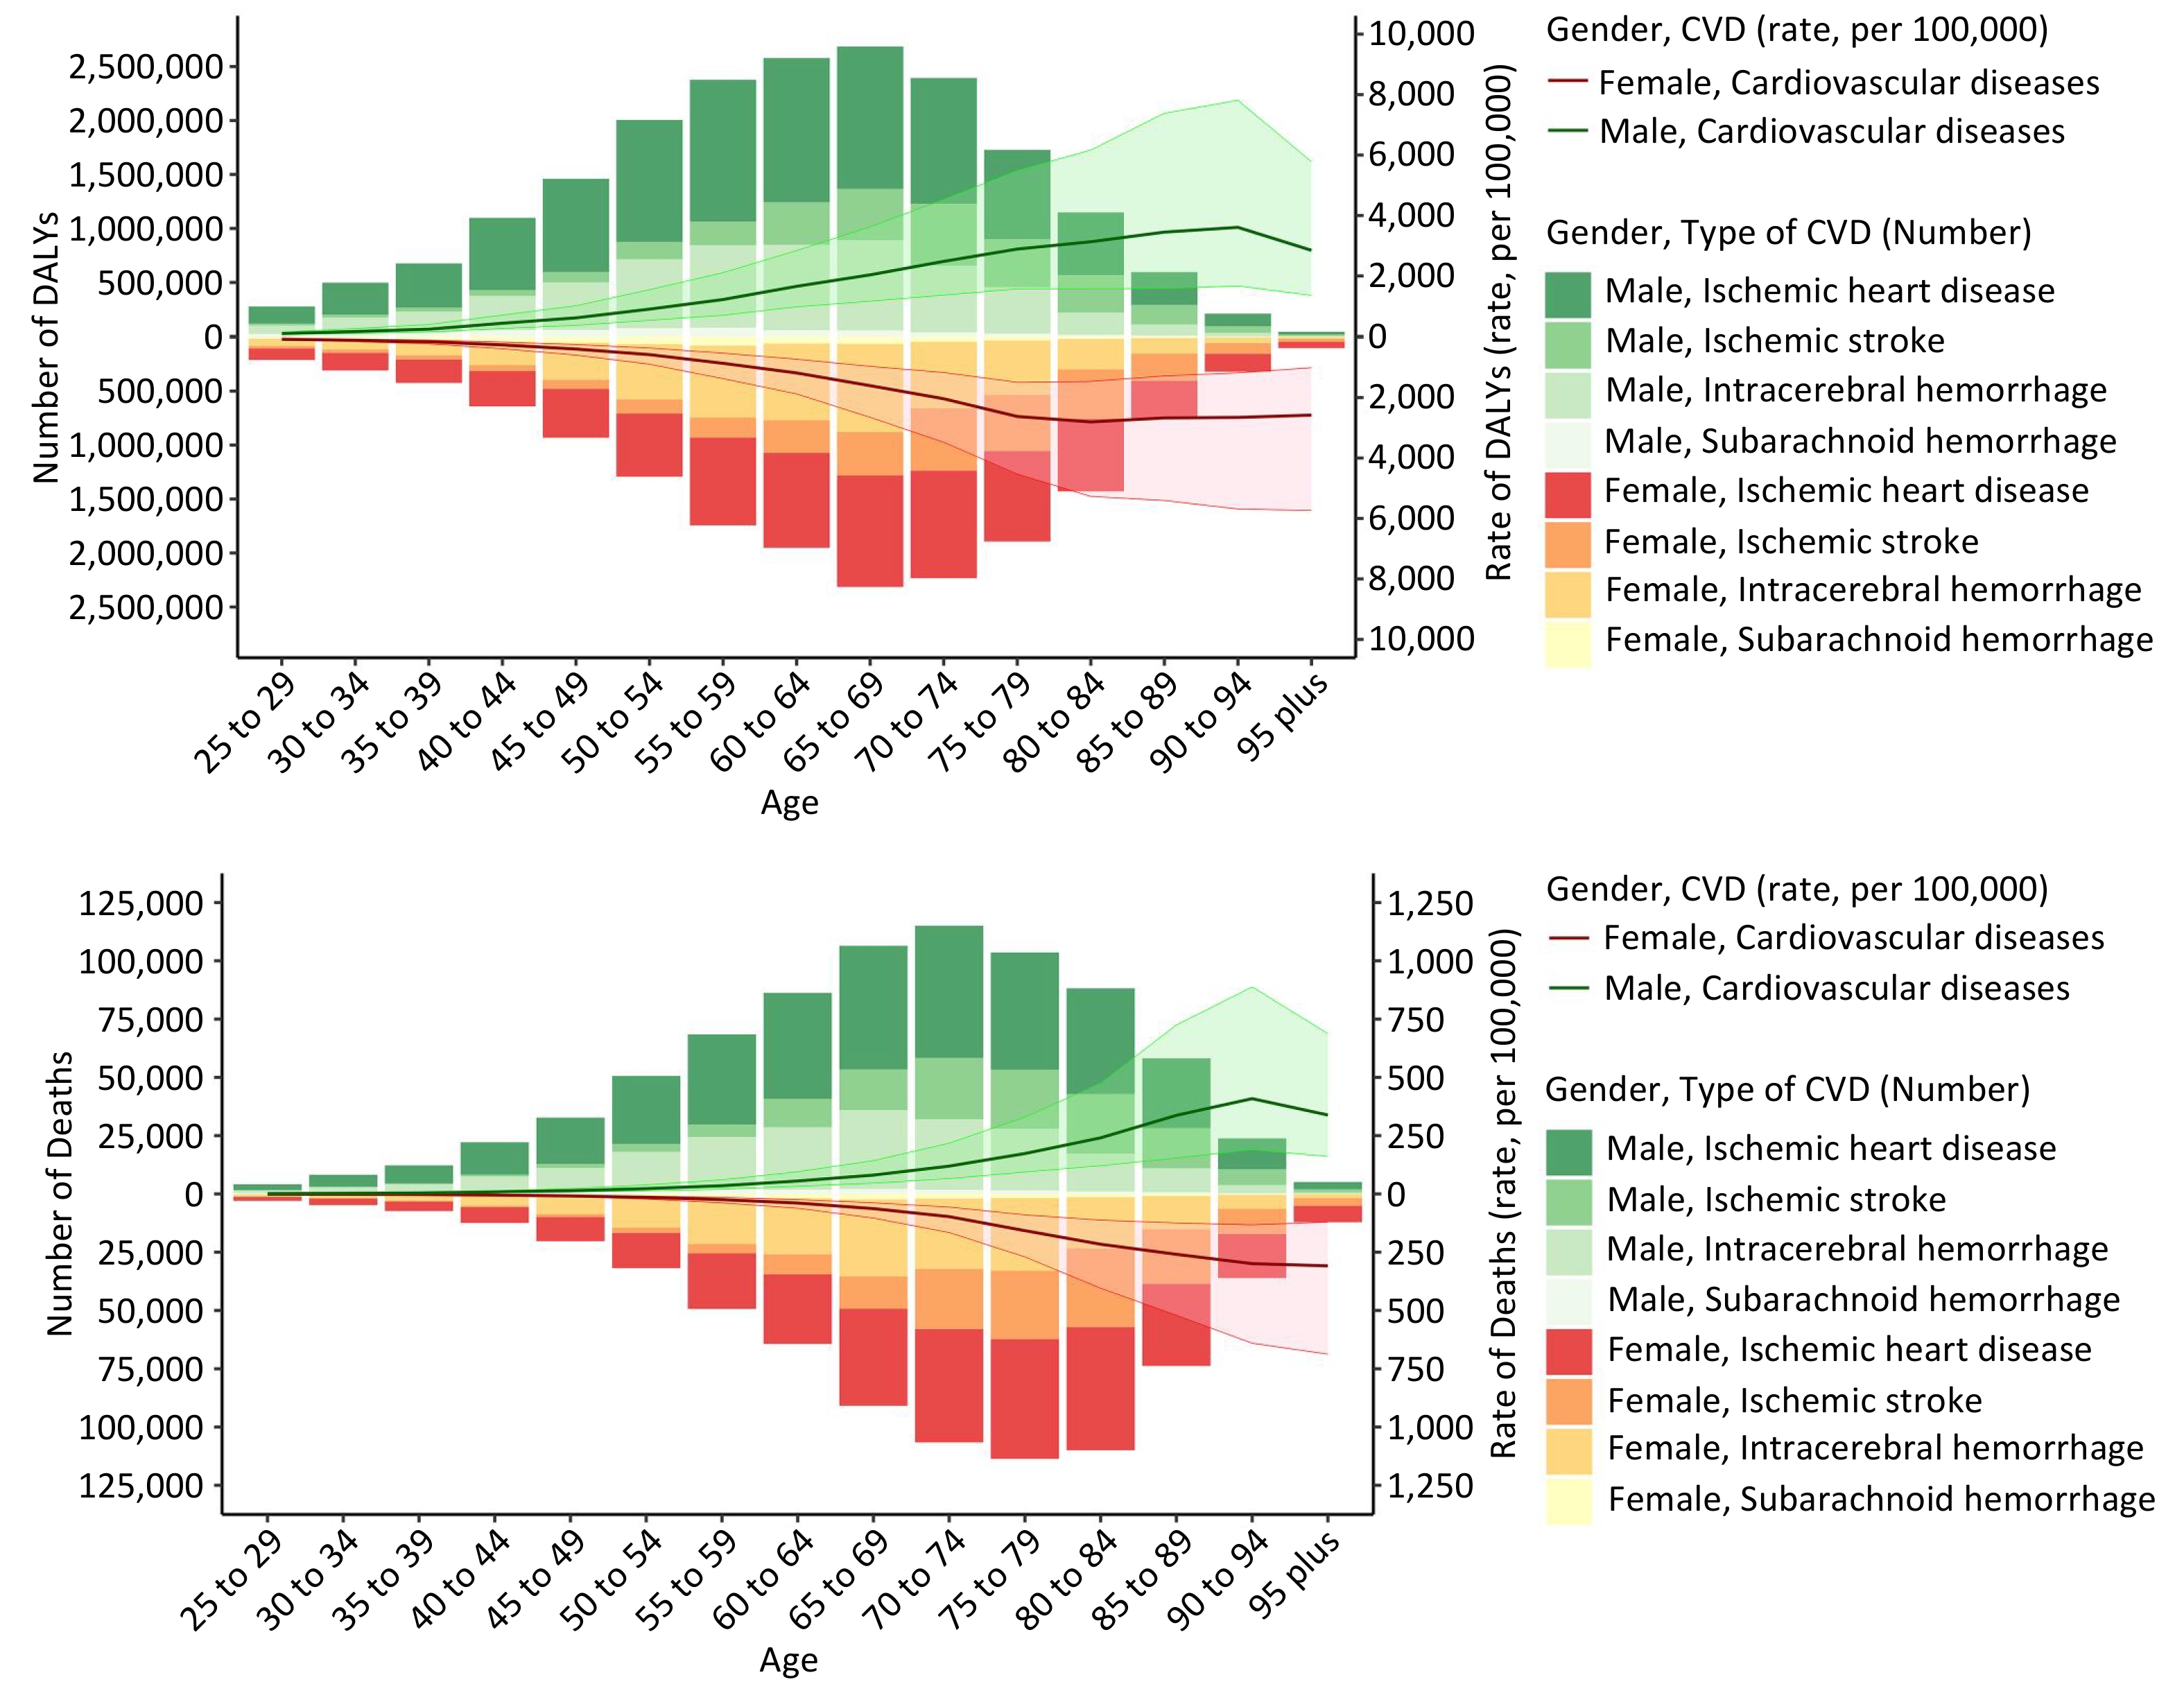
As shown in Table 1, females exhibited a lower CVD burden attributable to HAP than males, as reflected by both age-standardized rates and absolute counts. As illustrated in Figure 1, the DALYs and mortality rates of CVD attributable to HAP steadily increased with age in both sexes. In contrast, the absolute numbers of DALYs and deaths declined in the oldest age groups, likely because of the smaller elderly population. In addition, the disease burden across all age groups was consistently lower in females than in males. eAPC were employed to quantify long-term trends in disease burden from 1990 to 2021.
Figure 1. Age-Specific Number and Rate of DALYs and Deaths from Cardiovascular Diseases Attributable to HAP, Stratified by Sex and Cardiovascular Diseases Subtype, in 2021. (A) Number and rate of DALYs per 100,000 population across age groups, (B) Number and rate of deaths per 100,000 individuals across age groups.
As illustrated in Figure 2 and Supplementary Figure S1, the age-standardized rates of CVD and its subtypes exhibited consistent downward trajectories across all age and sex groups. A comparable pattern was also observed in Figure 3 and Supplementary Figures S2-6. The period and cohort rate ratios for DALYs and deaths attributable to HAP demonstrated a consistently declining trajectory from 1992 to 2021 and across successive birth cohorts, with broadly similar trends observed across the sexes. Local drift analysis revealed predominantly negative age-specific trends, particularly among the middle-aged groups, reflecting a sustained decline in disease burden over time.
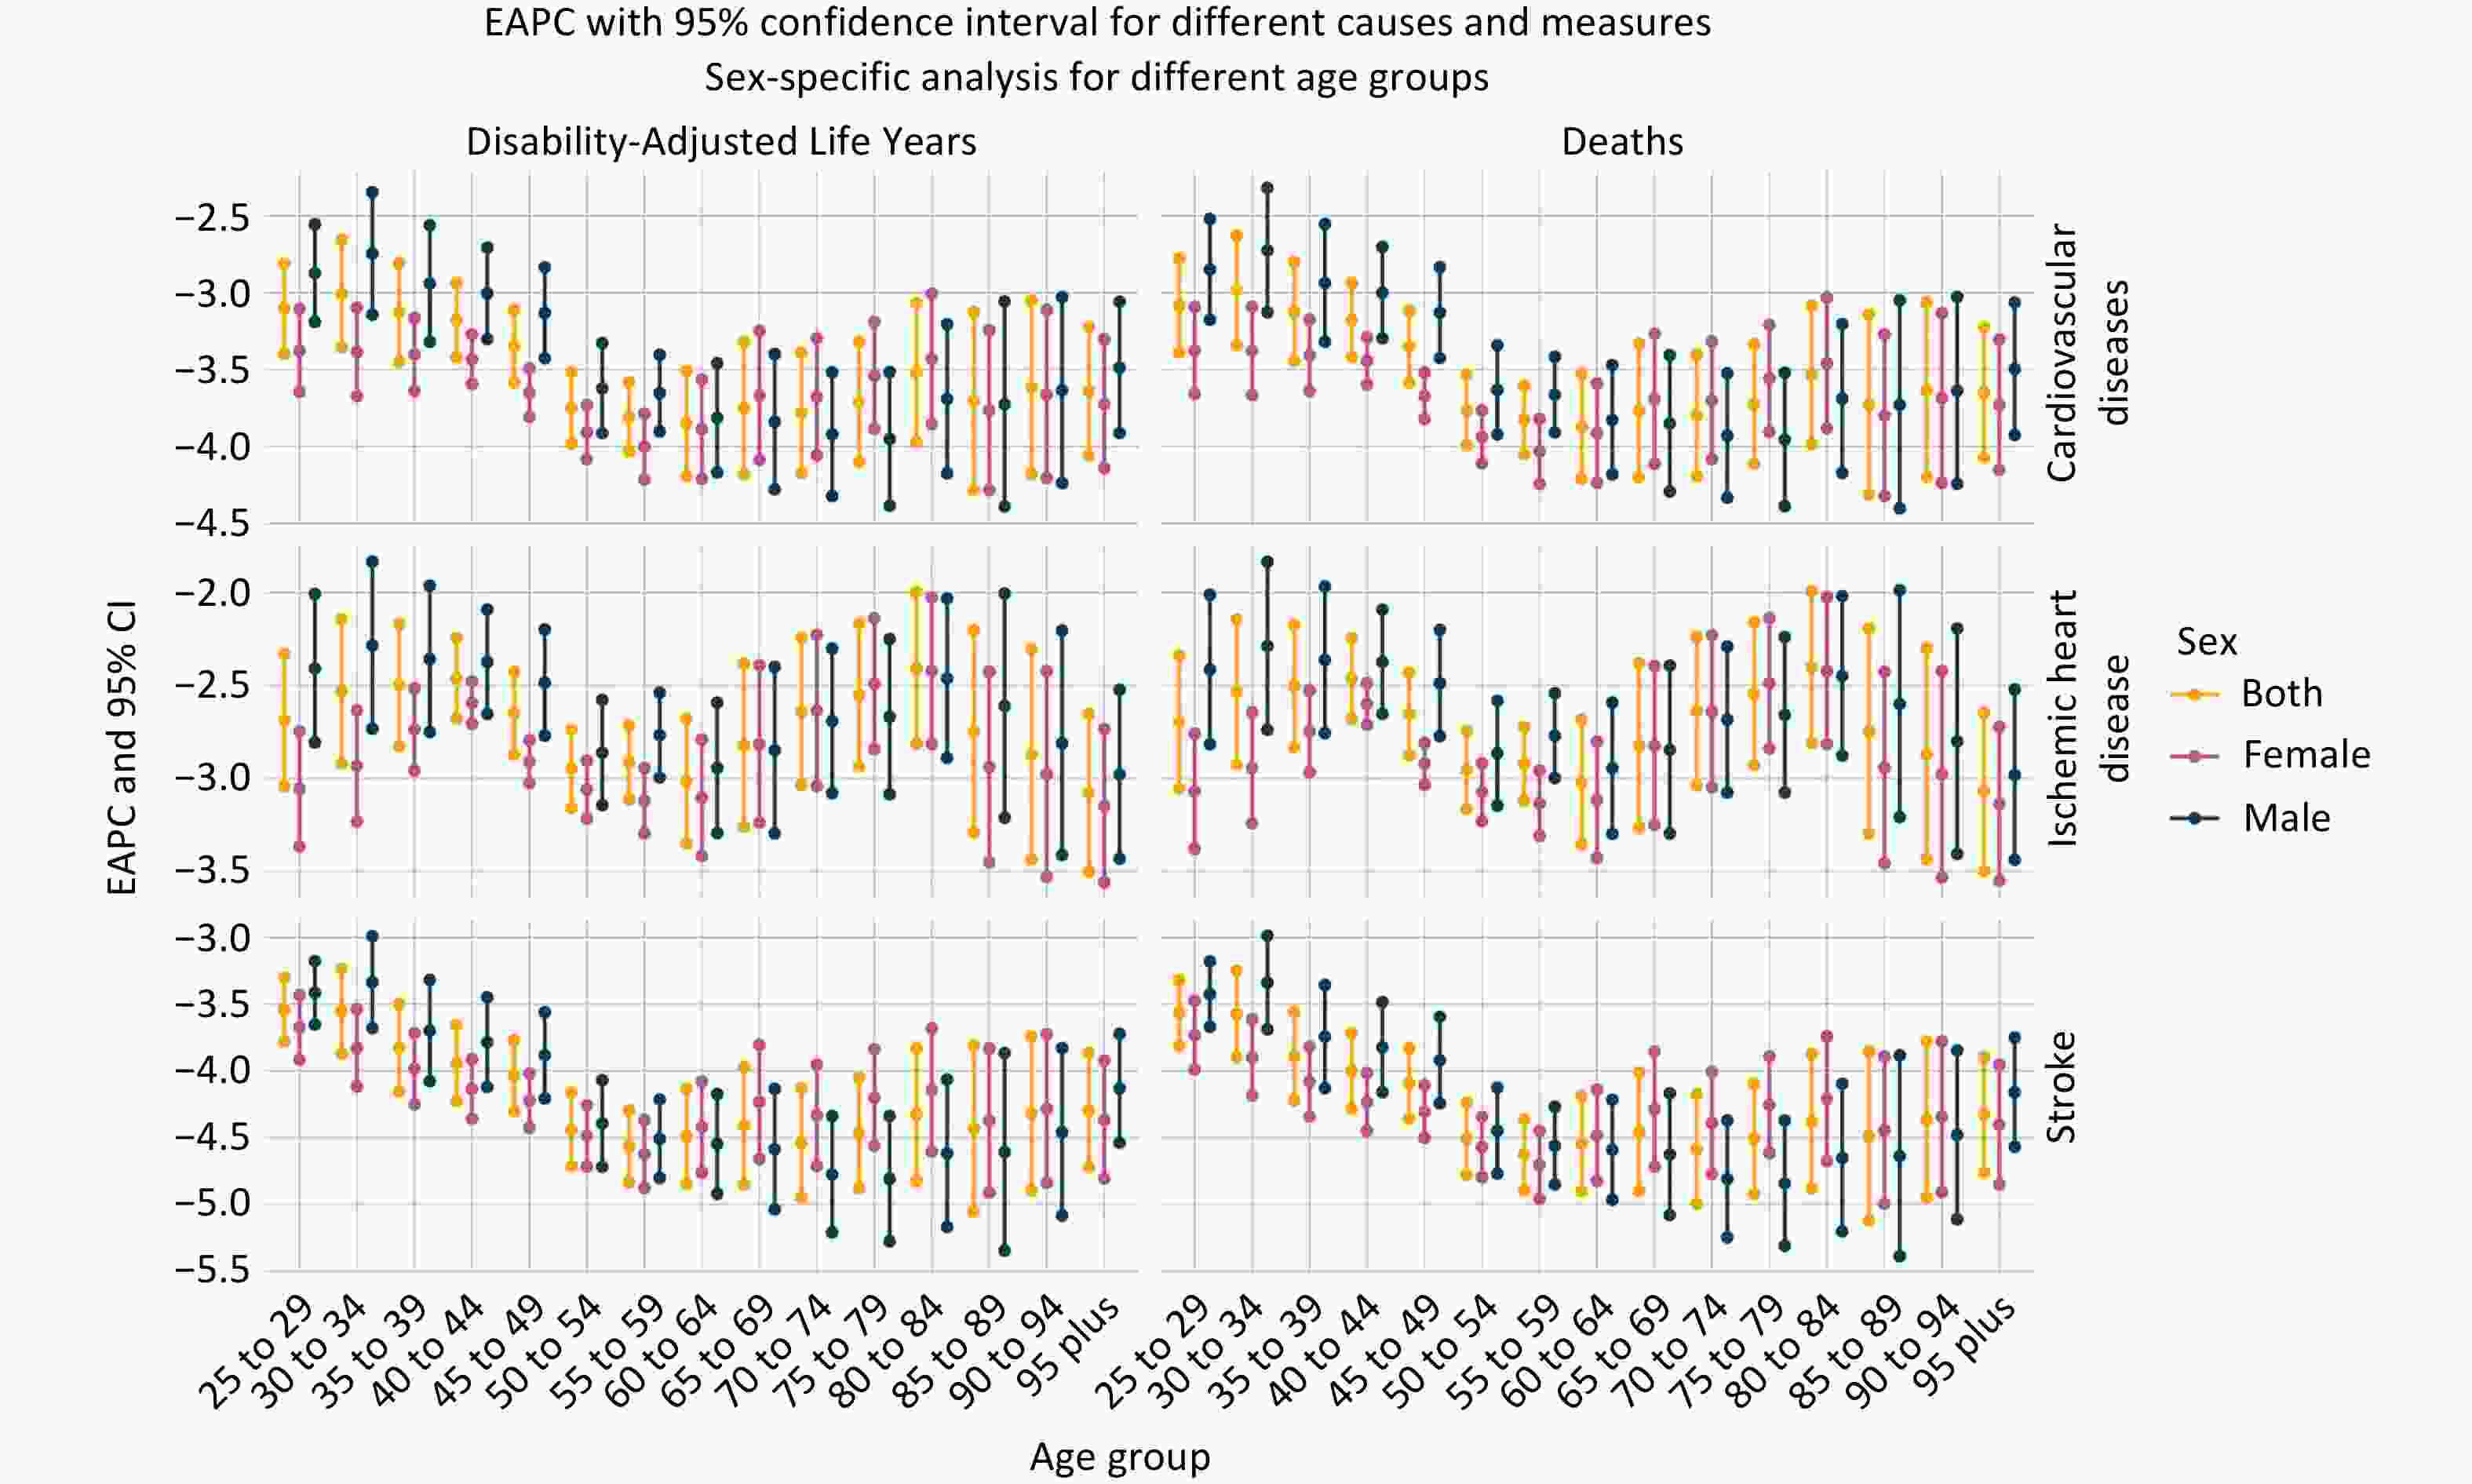
Figure 2. EAPC in DALYs and Deaths from Cardiovascular Diseases Attributable to HAP by Age Group and Sex, 1990–2021.
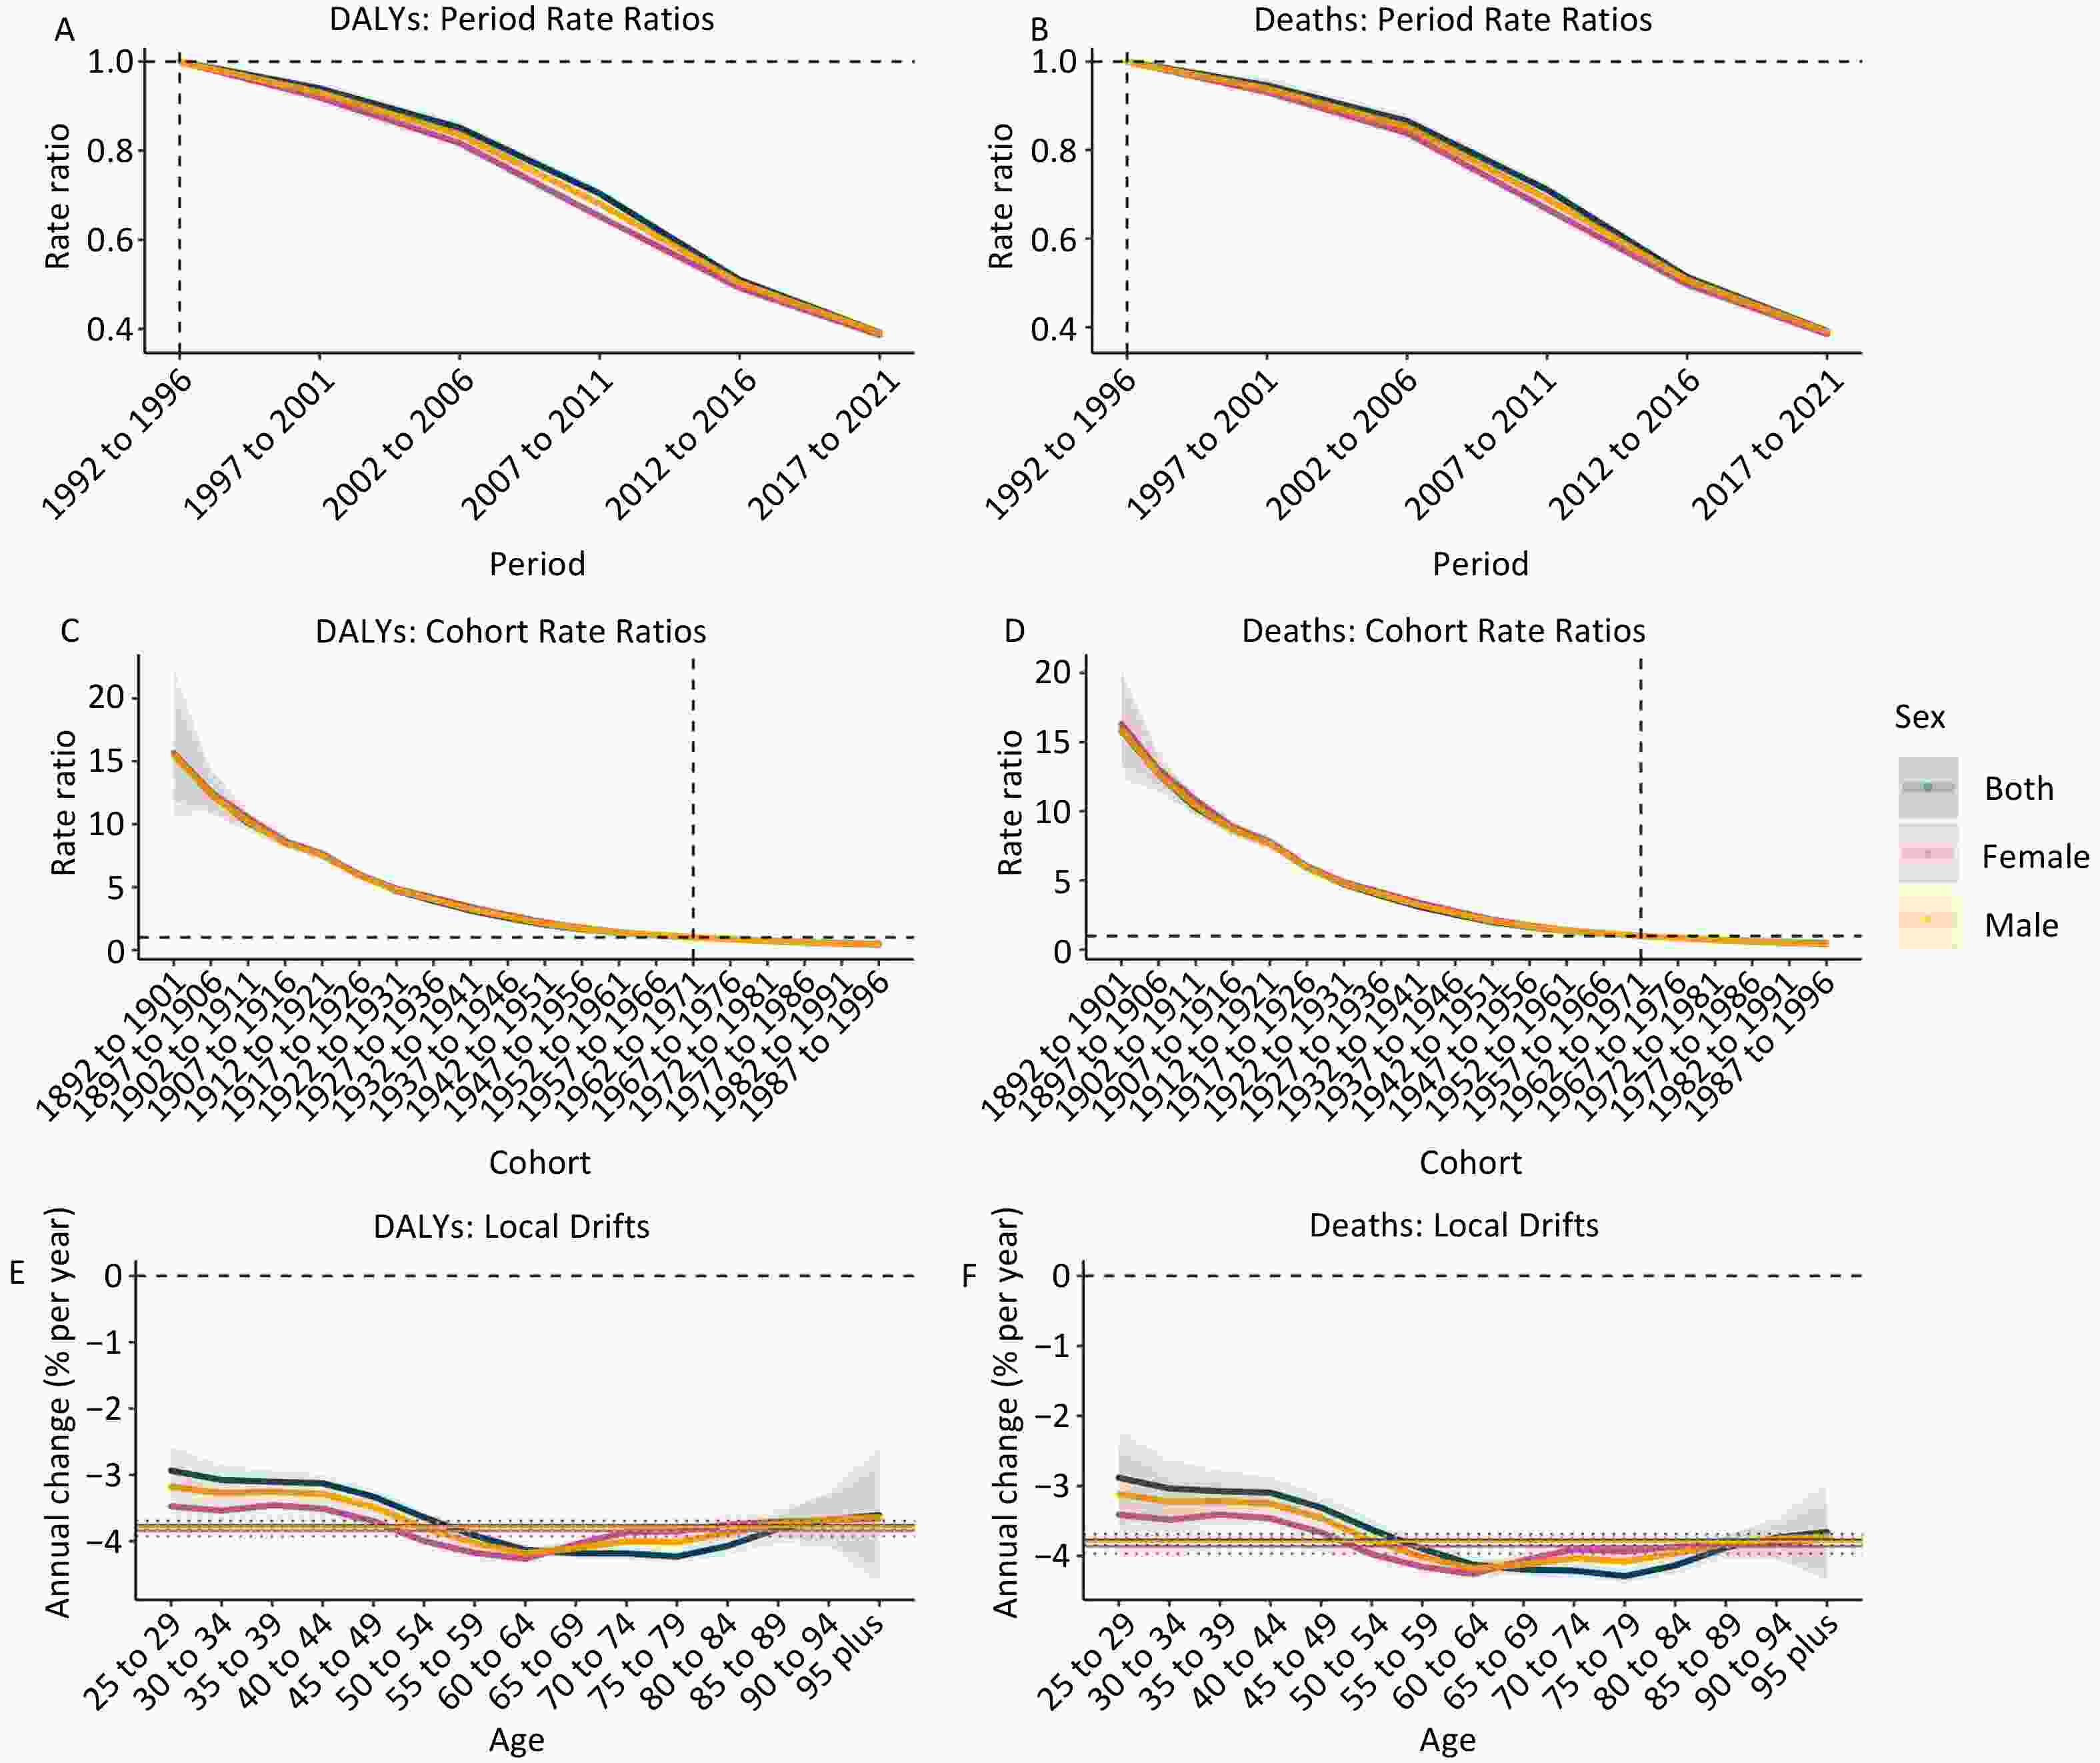
Figure 3. Period and Cohort Rate Ratios and Local Drifts for DALYs and Deaths from Cardiovascular Diseases Attributable to HAP, Stratified by Sex. (A, B) Period rate ratios for DALYs and deaths, (C, D) Cohort rate ratios for DALYs and deaths, (E, F) Local drifts (annual percentage change in age-specific rates) for DALYs and deaths.
-
Based on the spatial patterns presented in Figure 4 and Supplementary Figure S7, ASRs of disease burden were higher in Sub-Saharan Africa, Southeast Asia, Central Asia, and several Pacific Island nations.
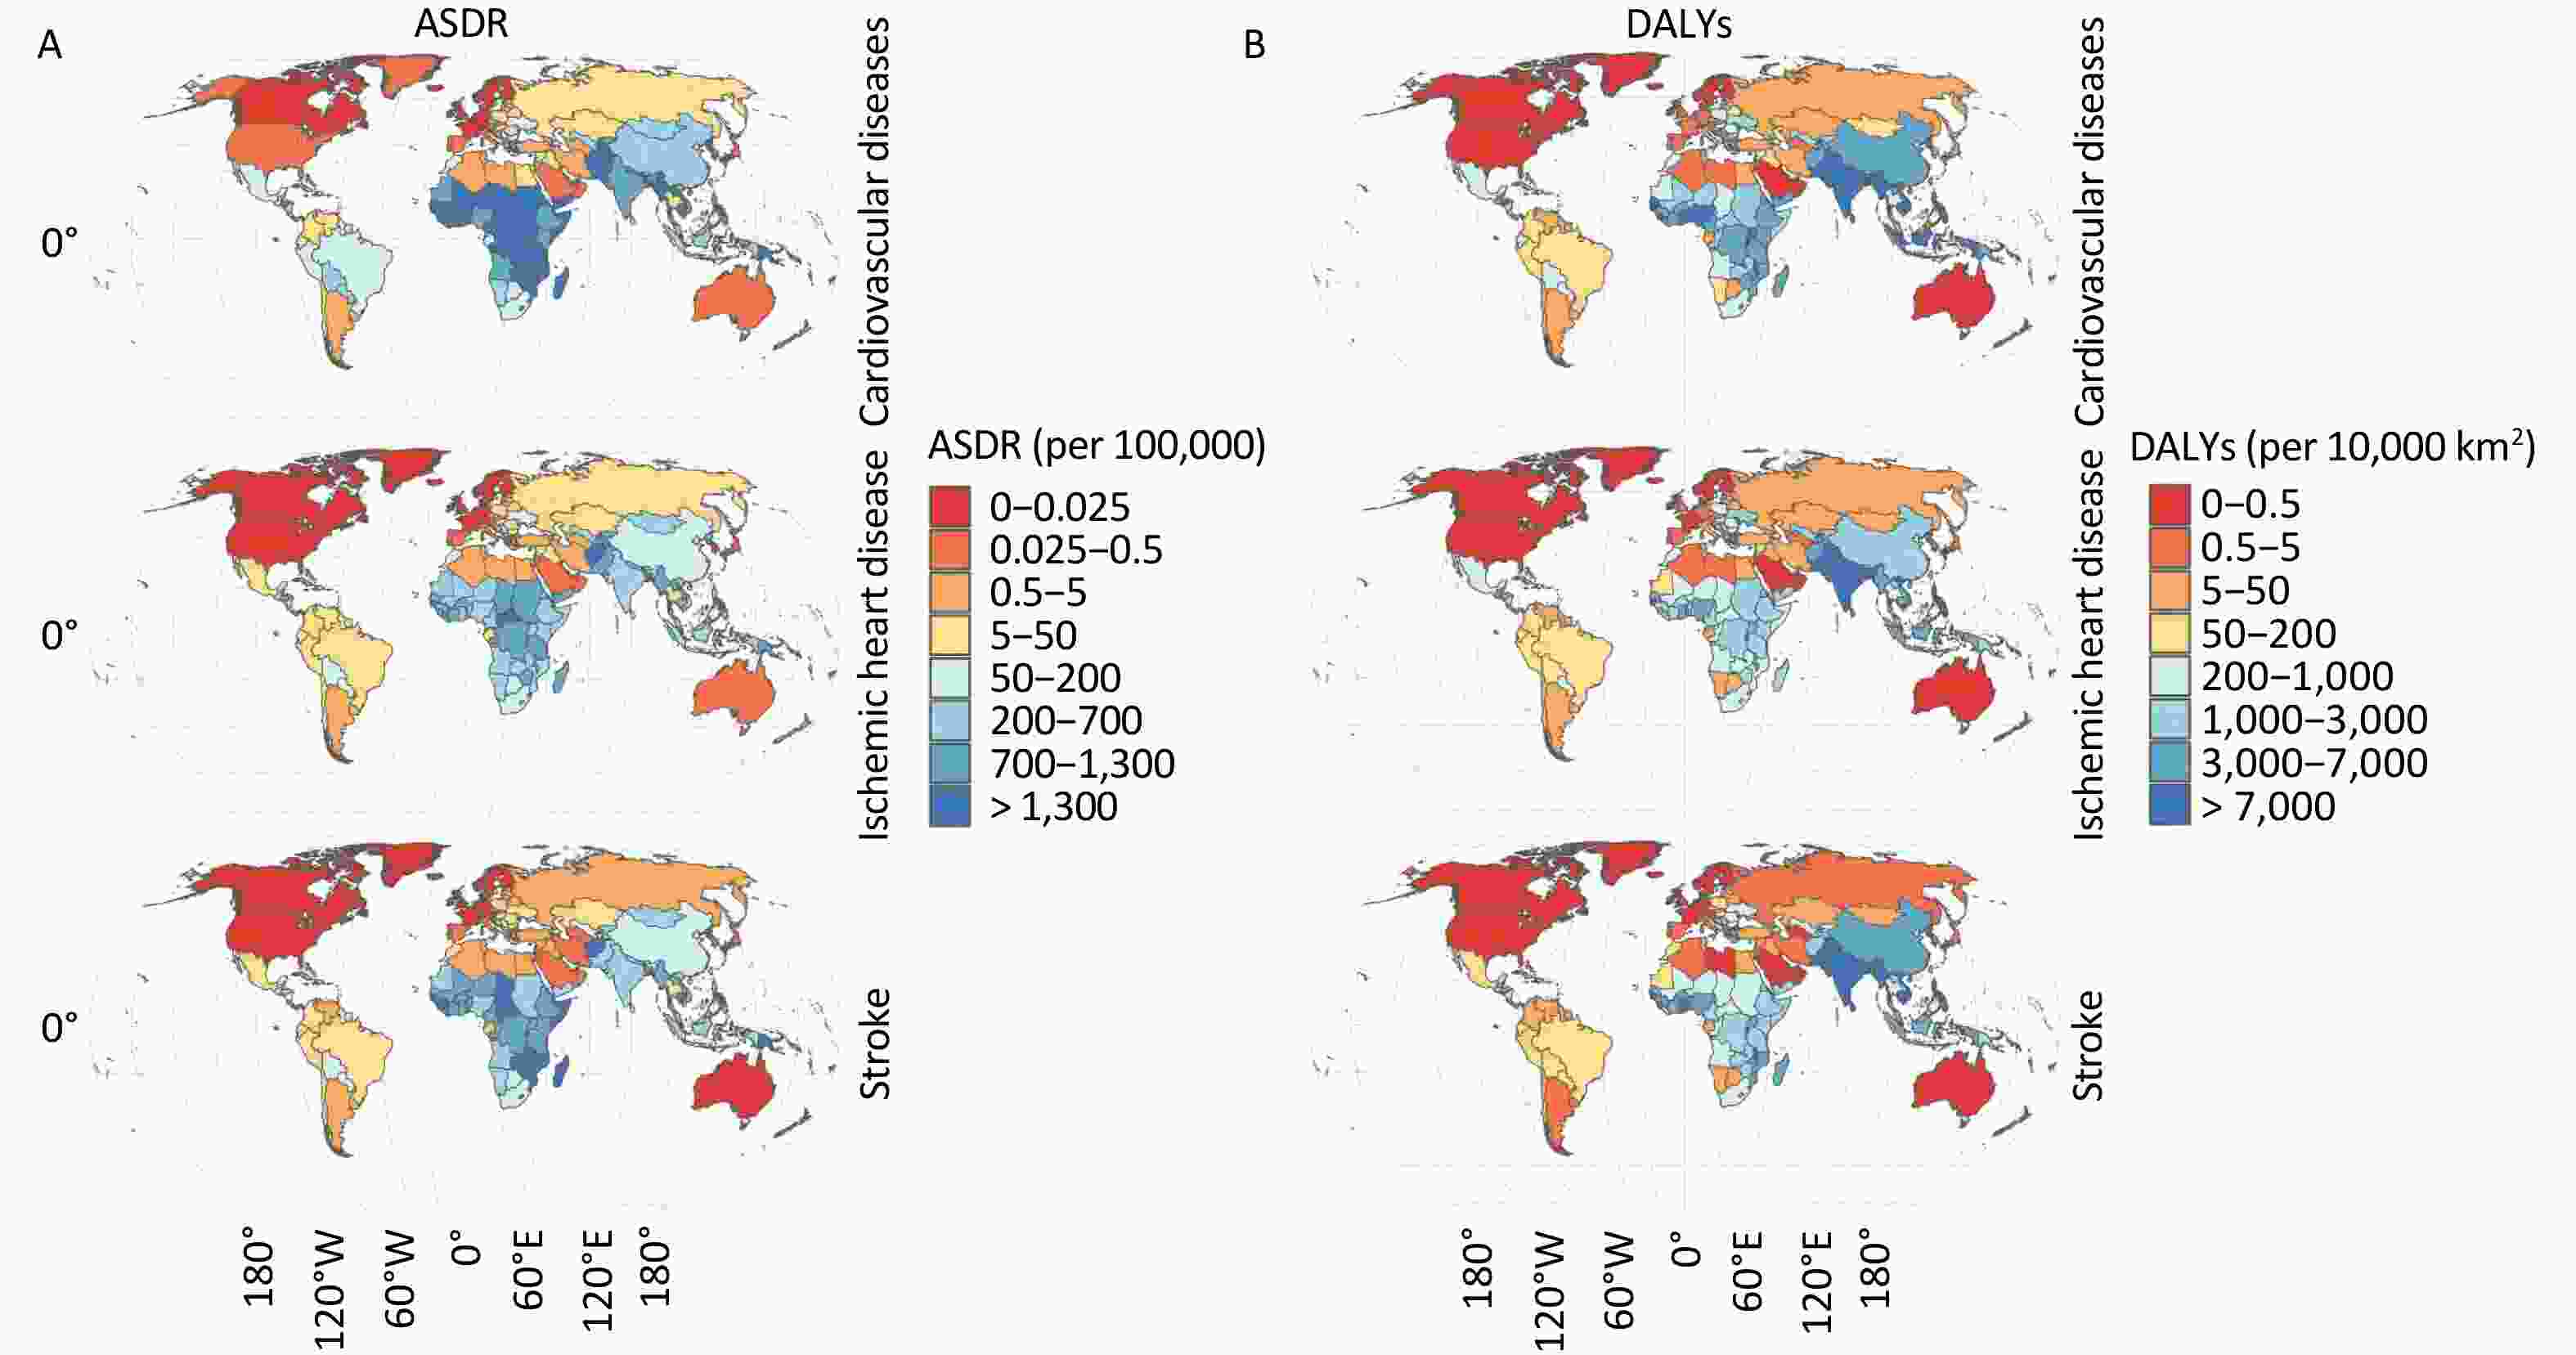
Figure 4. Global Distribution of Cardiovascular Diseases DALYs Attributable to HAP in 2021. (A) Age-standardized DALYs rates for cardiovascular diseases, IHD, and strokes, (B) DALYs density (per 10,000 km2) for the same three conditions.
To ensure valid cross-country comparisons of crude DALYs and death counts from CVD attributable to HAP, the values were normalized by land area. Following this adjustment, South and Southeast Asia emerged as regions with the greatest spatial burden. As shown in Table 1, among the 21 GBD regions, Oceania (excluding Australia) exhibited the highest CVD burden attributable to HAP, whereas North America demonstrated the lowest, as reflected in both age-standardized DALYs and mortality rates. At the national level, the Solomon Islands, Vanuatu, and Afghanistan ranked the highest in disease burden based on age-standardized rates, whereas Norway, Switzerland, and Andorra ranked the lowest. In contrast, when assessed in absolute numbers, Bangladesh, Haiti, and the Democratic People’s Republic of Korea ranked the highest in disease burden, whereas Greenland, Iceland, and Canada ranked the lowest. These geographic patterns suggest a potential inverse relationship between socioeconomic development and the burden of CVD attributable to HAP. Countries and regions with the highest observed burden are characterized by relatively low levels of sociodemographic development. In contrast, high-income regions, particularly North America and Western Europe, tend to exhibit substantially lower burden levels. This pattern warrants further quantitative analysis.
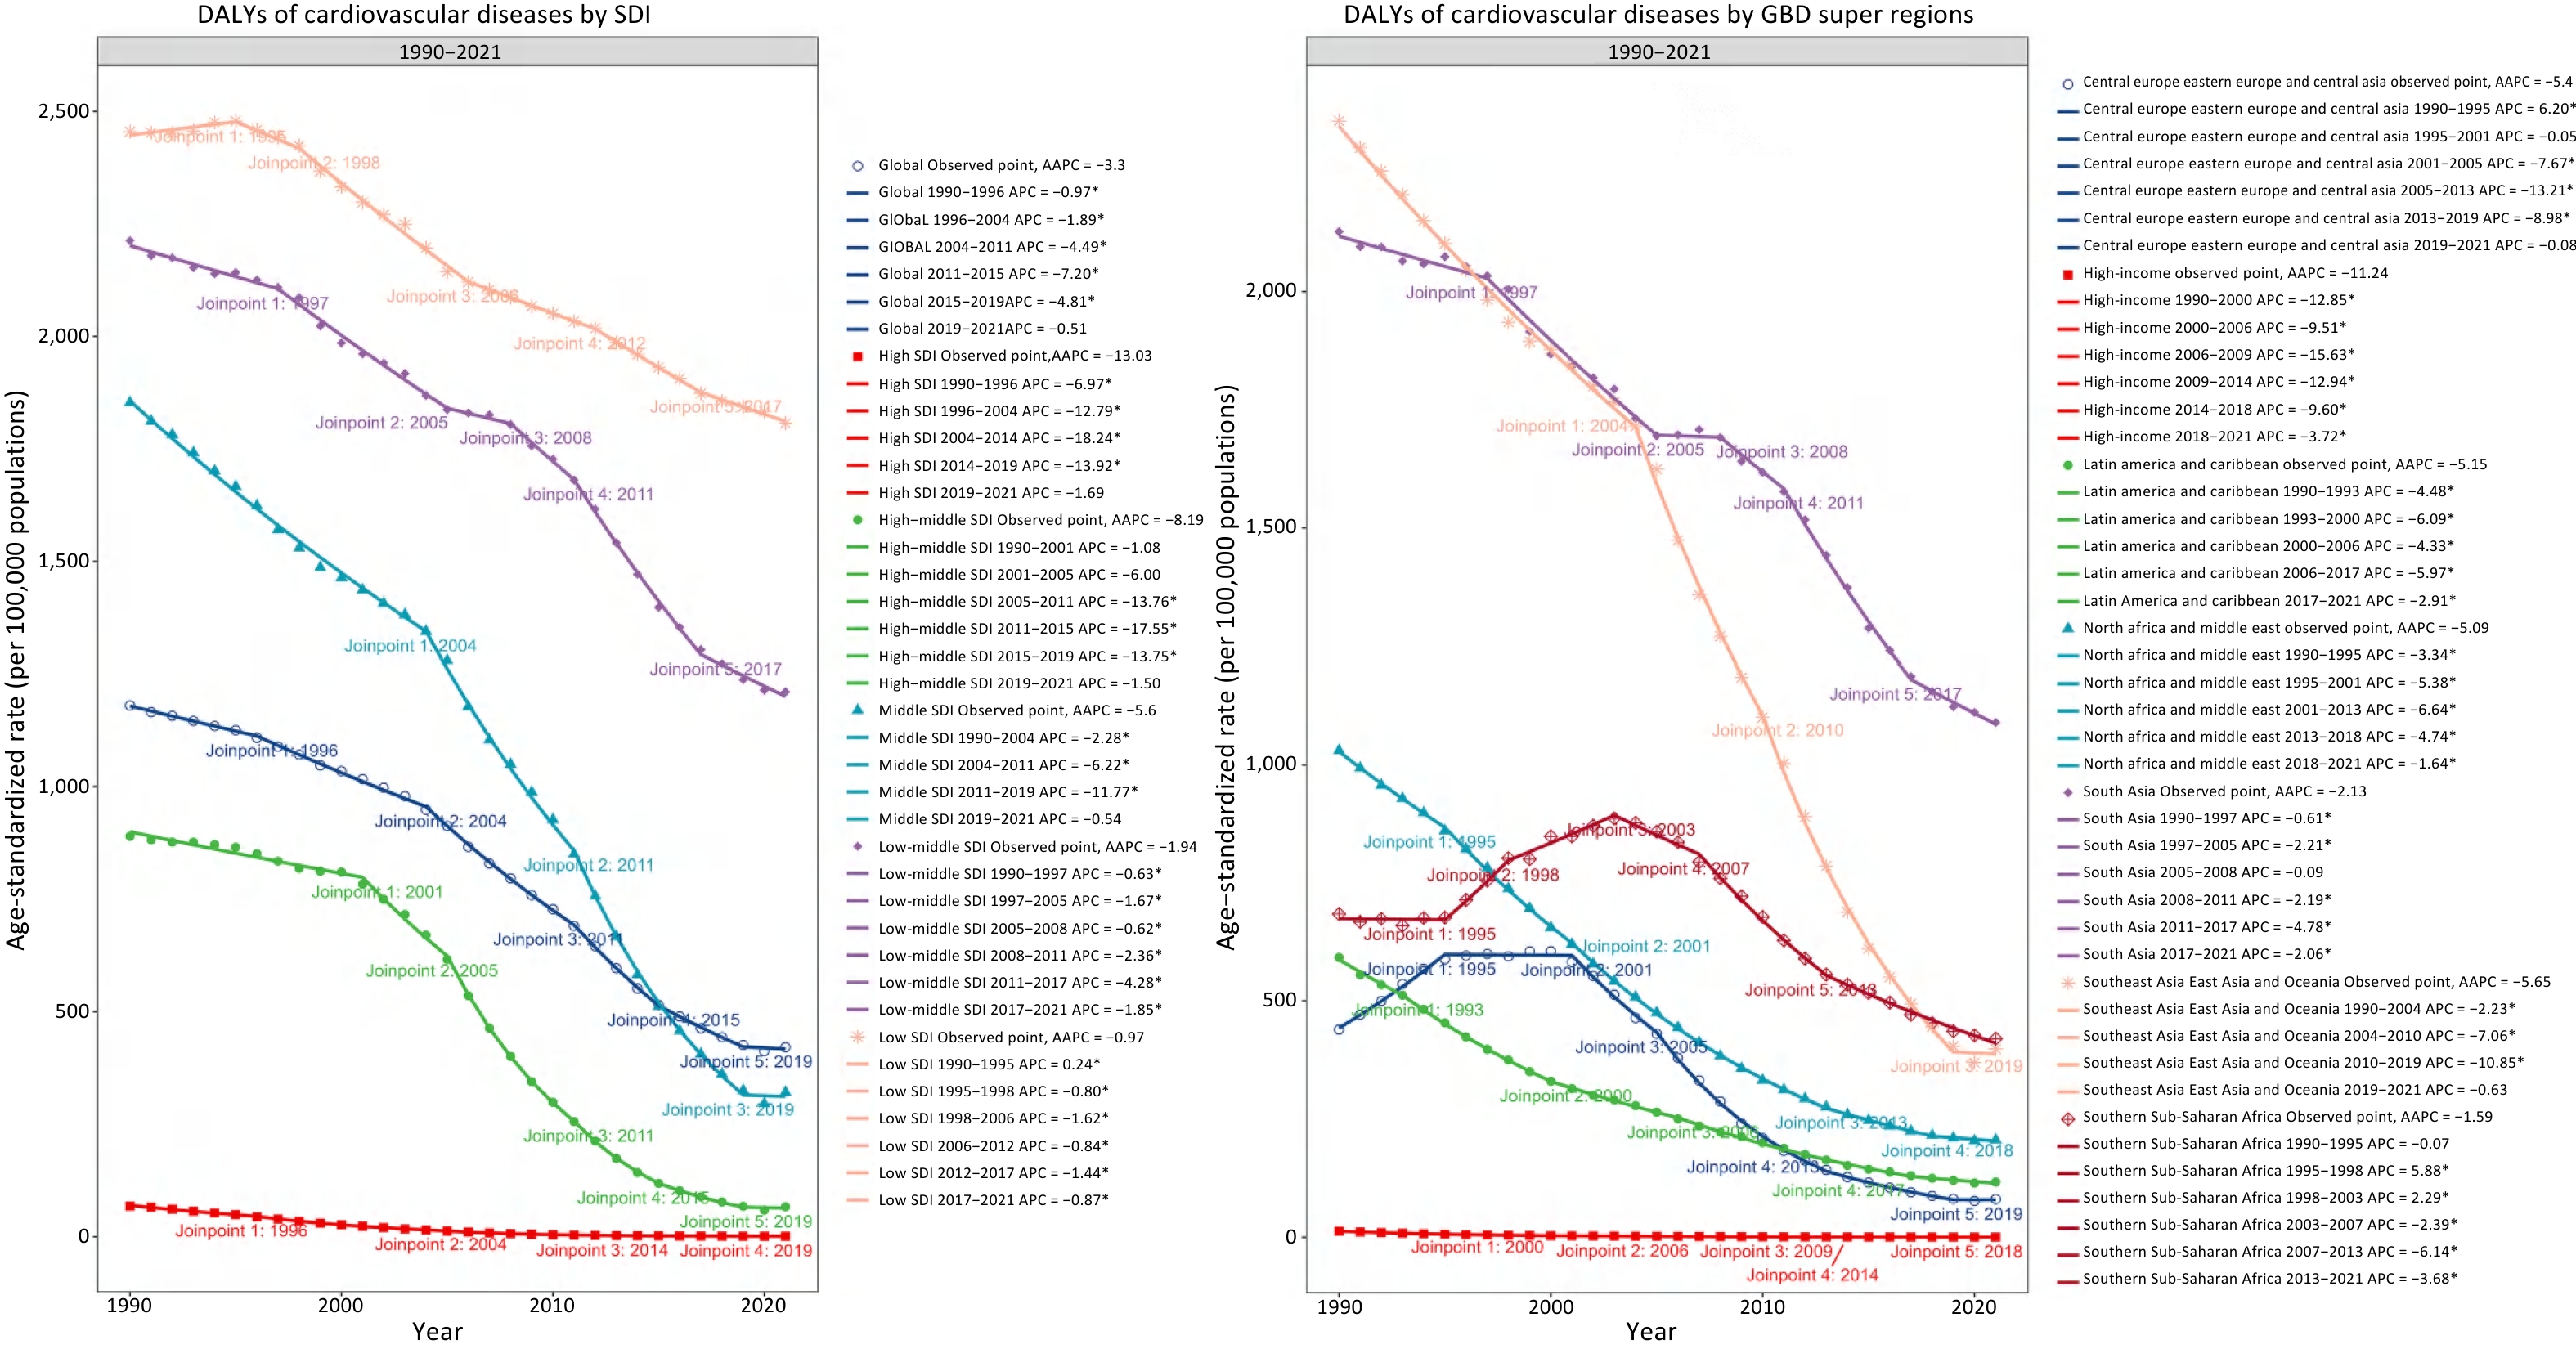
Furthermore, the regional trajectories of disease burden were systematically evaluated. As illustrated in Figures 5B and Supplementary Figures S8–S12, joinpoint regression was applied to delineate both the overall and segment-specific temporal dynamics across regions. Most regions exhibited significant downward trends, although the magnitudes and timing of these changes varied. High-income regions showed consistently low and marginally declining rates. In contrast, regions such as South Asia, Southeast Asia, and Sub-Saharan Africa demonstrated pronounced reductions over multiple joinpoint intervals, particularly after the early 2000s. Notably, the steepest declines were observed in Southeast and South Asia between 2005 and 2019. These patterns underscore the substantial regional heterogeneity in the temporal dynamics of disease burden.
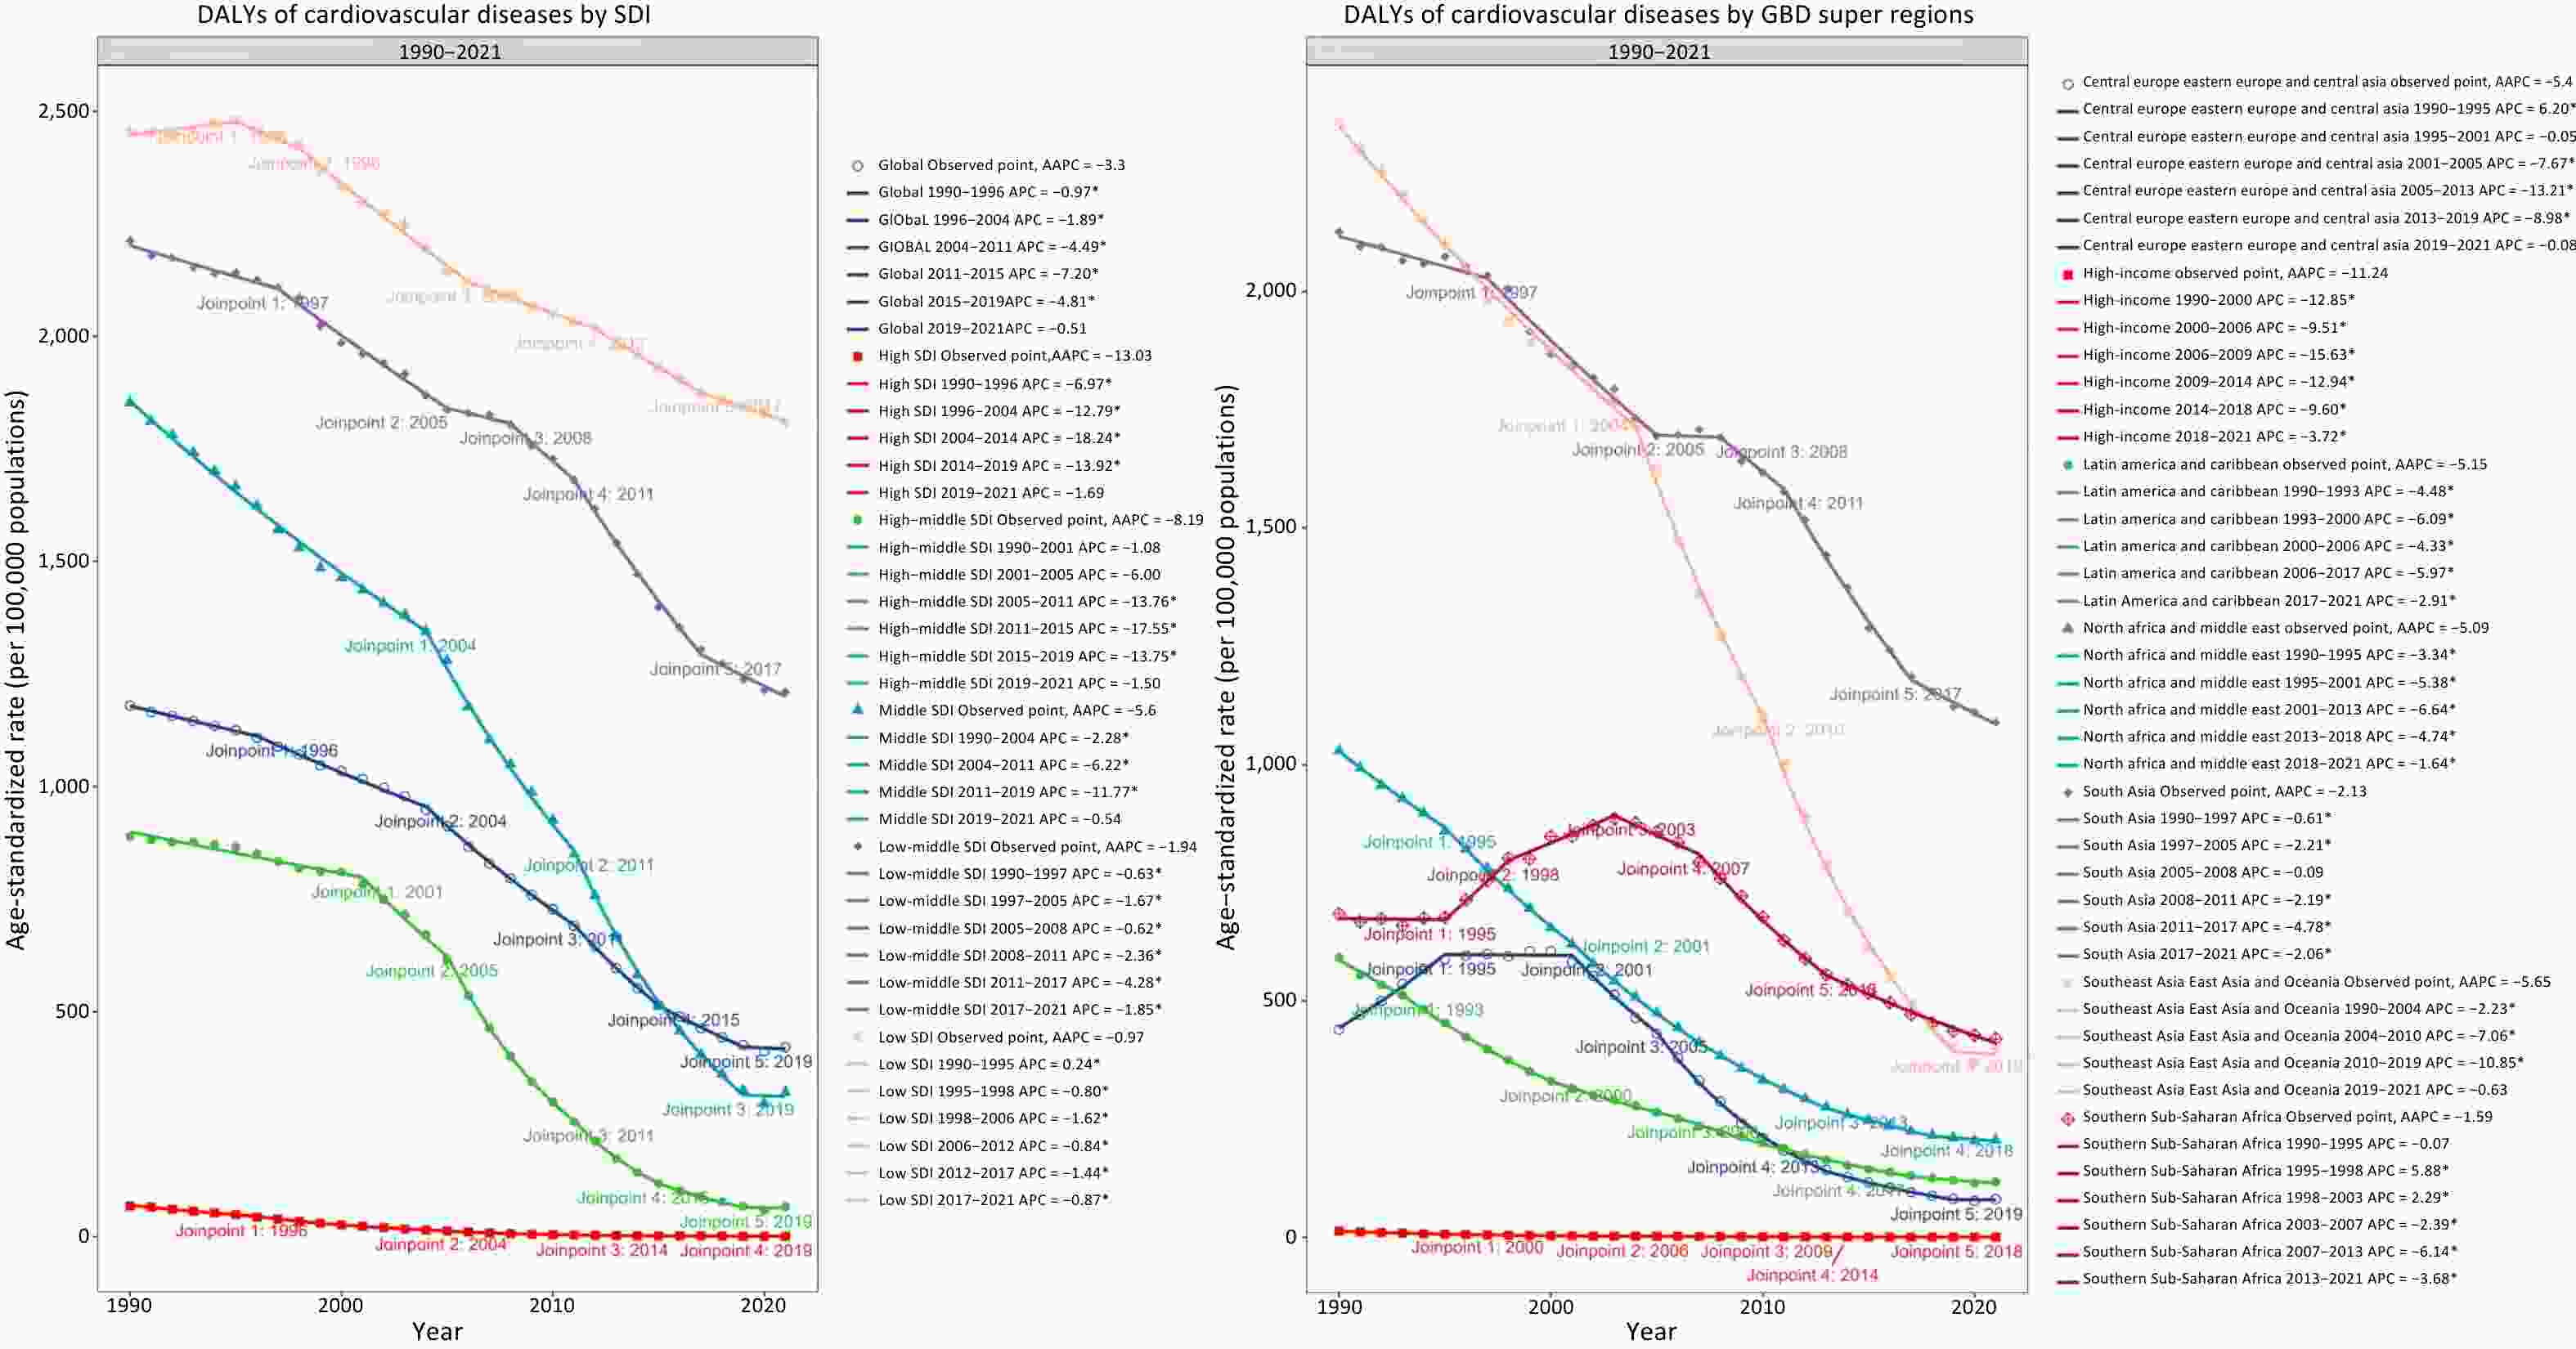
Figure 5. Temporal Trends in Age-Standardized DALYs Rates for Cardiovascular Diseases Attributable to HAP, 1990–2021. (A) Joinpoint analysis by SDI quintiles, (B) Joinpoint analysis by GBD super regions.
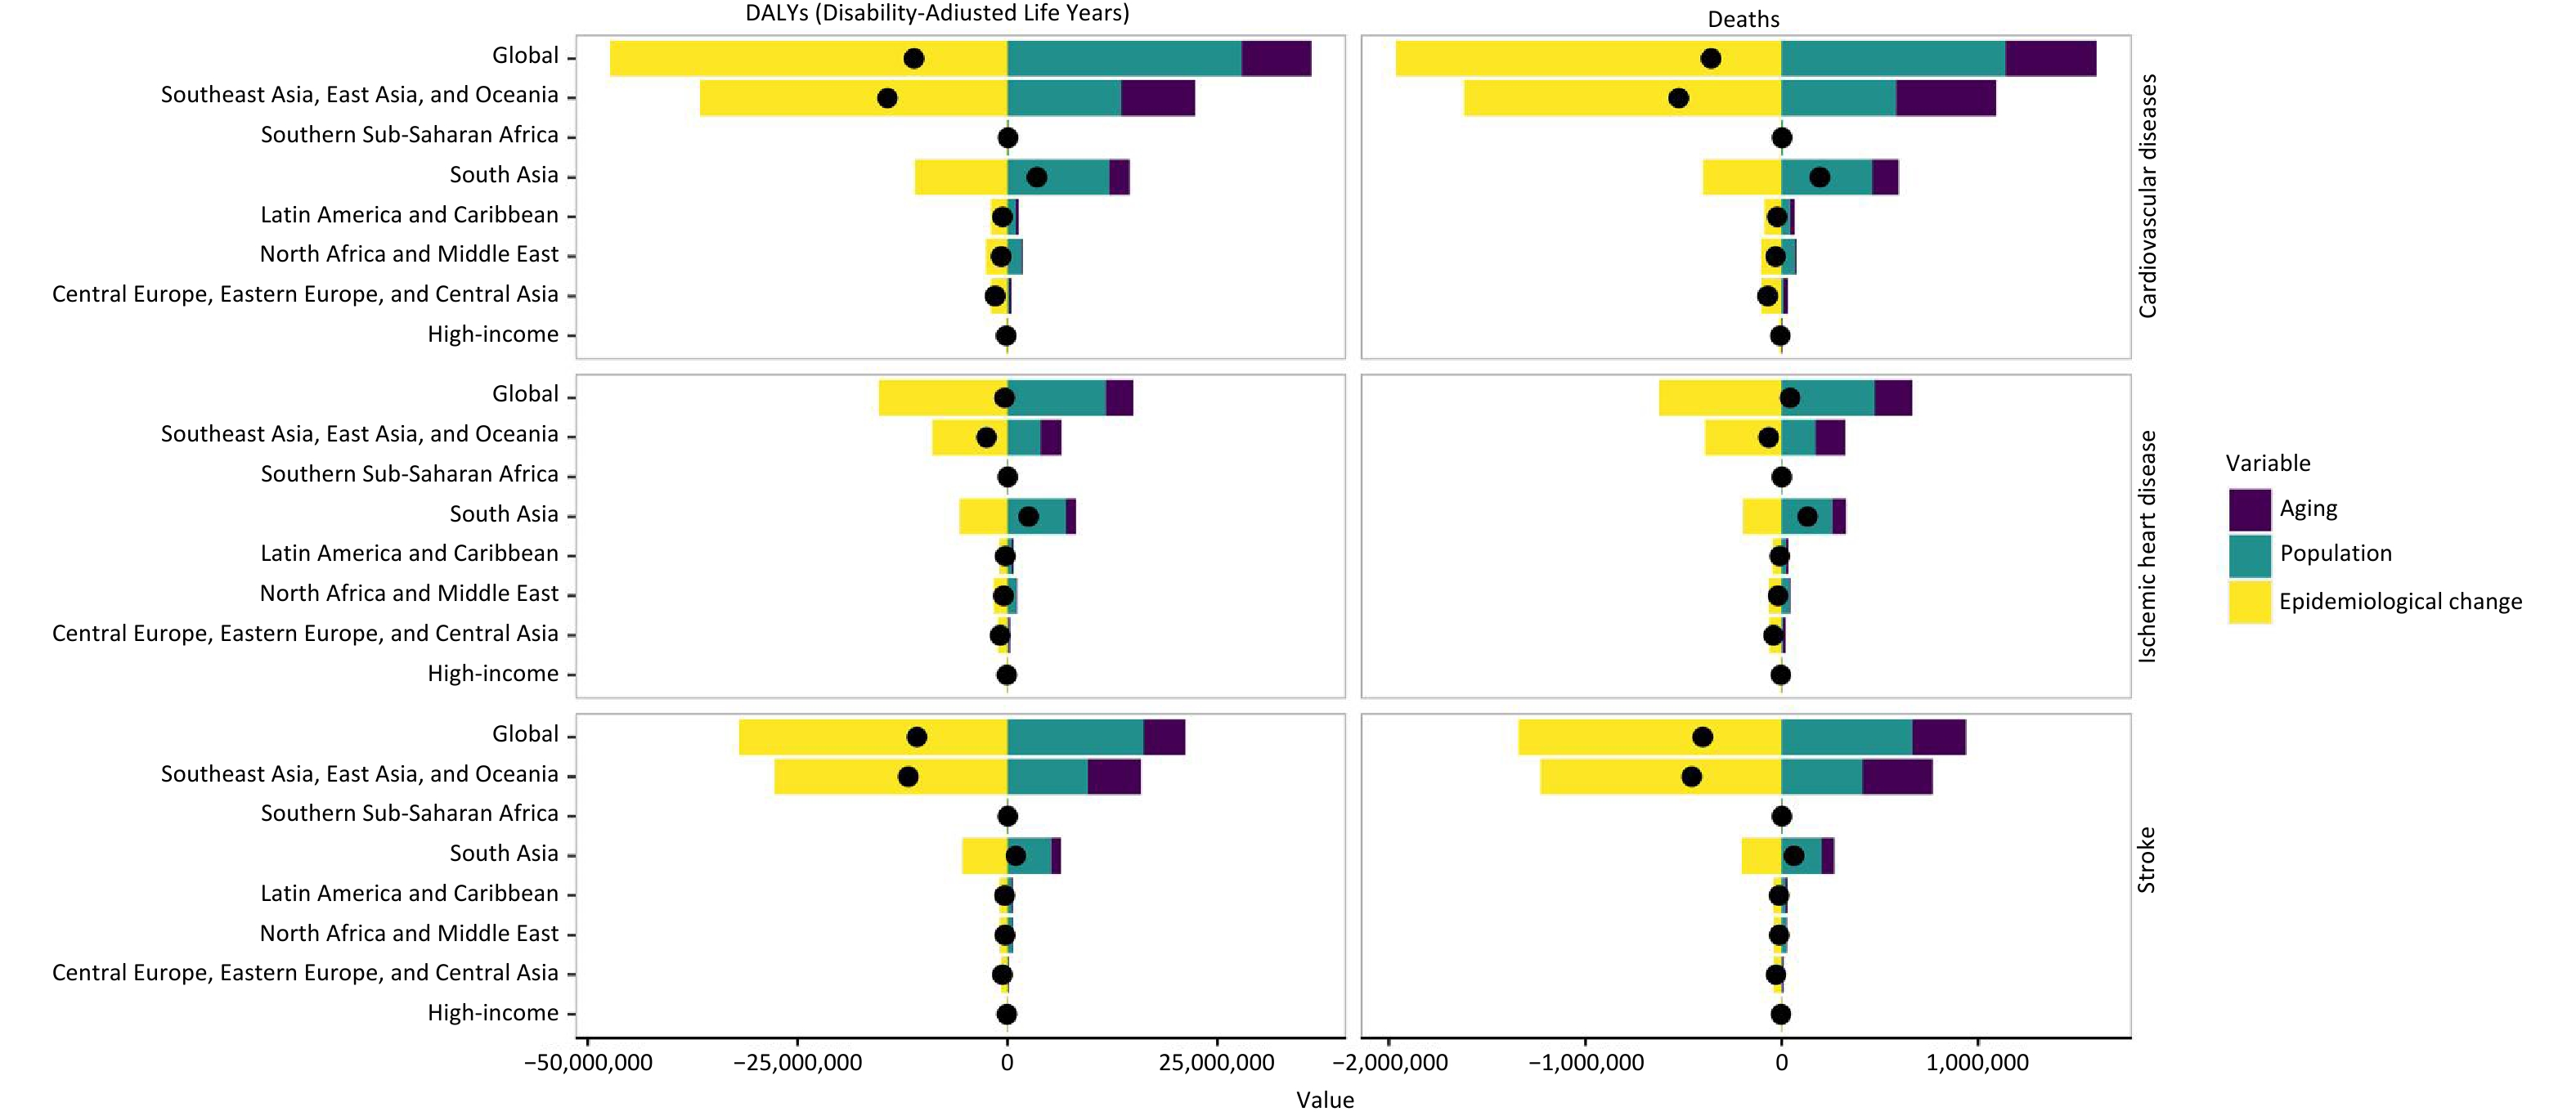
Figure 6 shows the contributions of population aging, demographic expansion, and epidemiological transitions to changes in the burden of CVD attributable to HAP at both global and regional levels across the GBD super-regions. In most regions, epidemiological improvements emerged as the principal driver of burden reduction, with their negative contributions reflecting a considerable decline in age-specific risks. Nevertheless, this favorable trajectory was partially undermined by the countervailing effects of population growth and ageing. This offsetting impact was particularly pronounced in regions such as Oceania and East, South, and Southeast Asia, where demographic pressures substantially amplified the overall burden of disease.
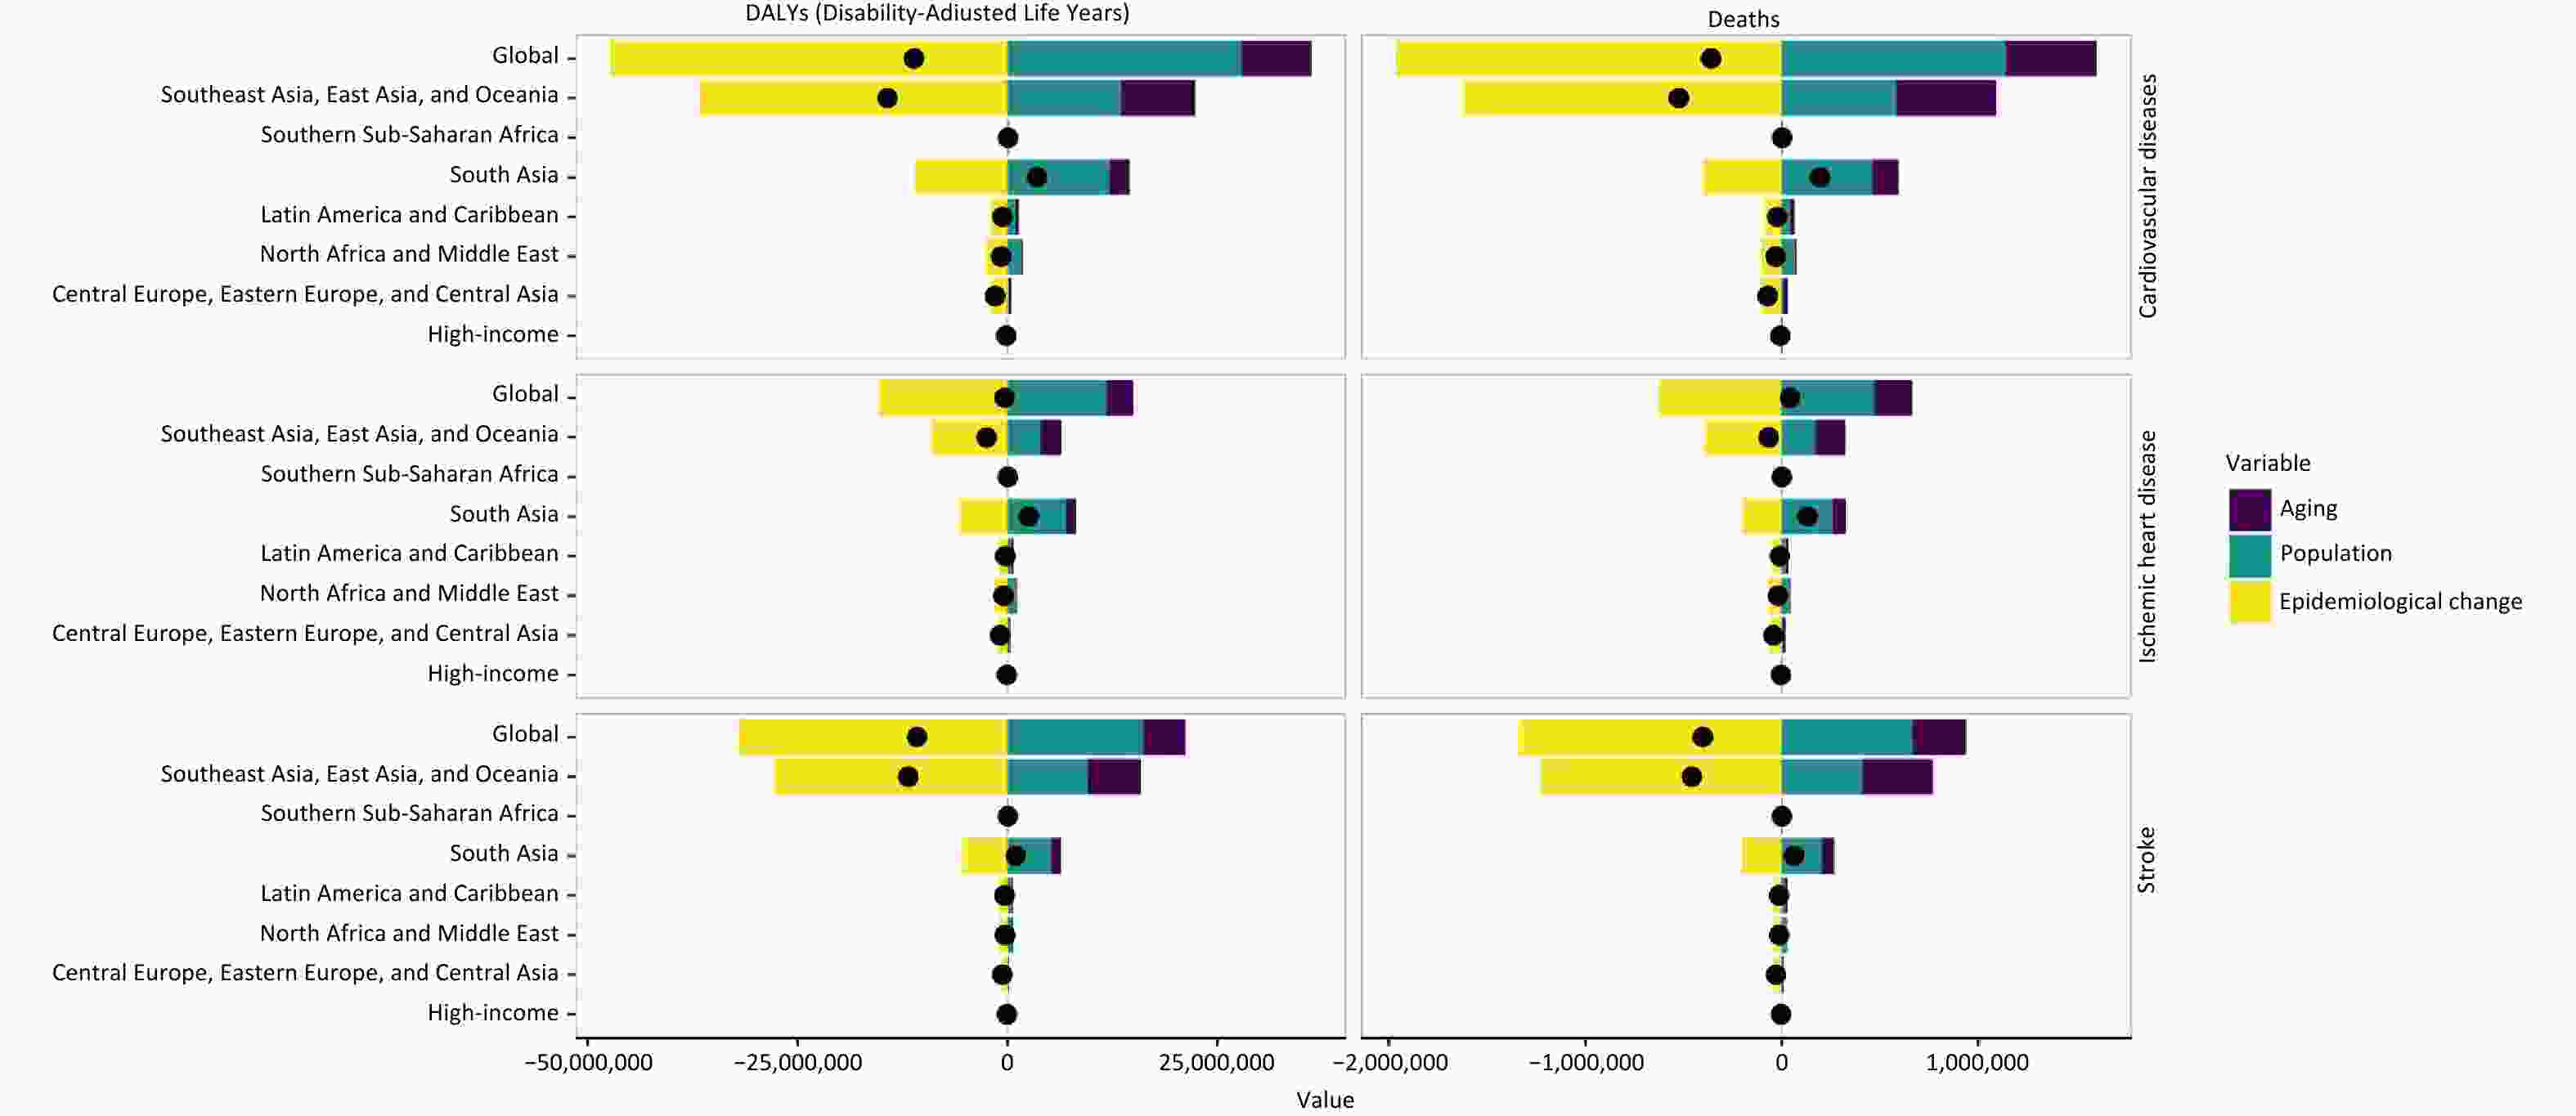
Figure 6. Regional and Global Cardiovascular Diseases Burden Attributable to HAP: Contributions of Aging, Population Growth, and Epidemiological Changes.
-
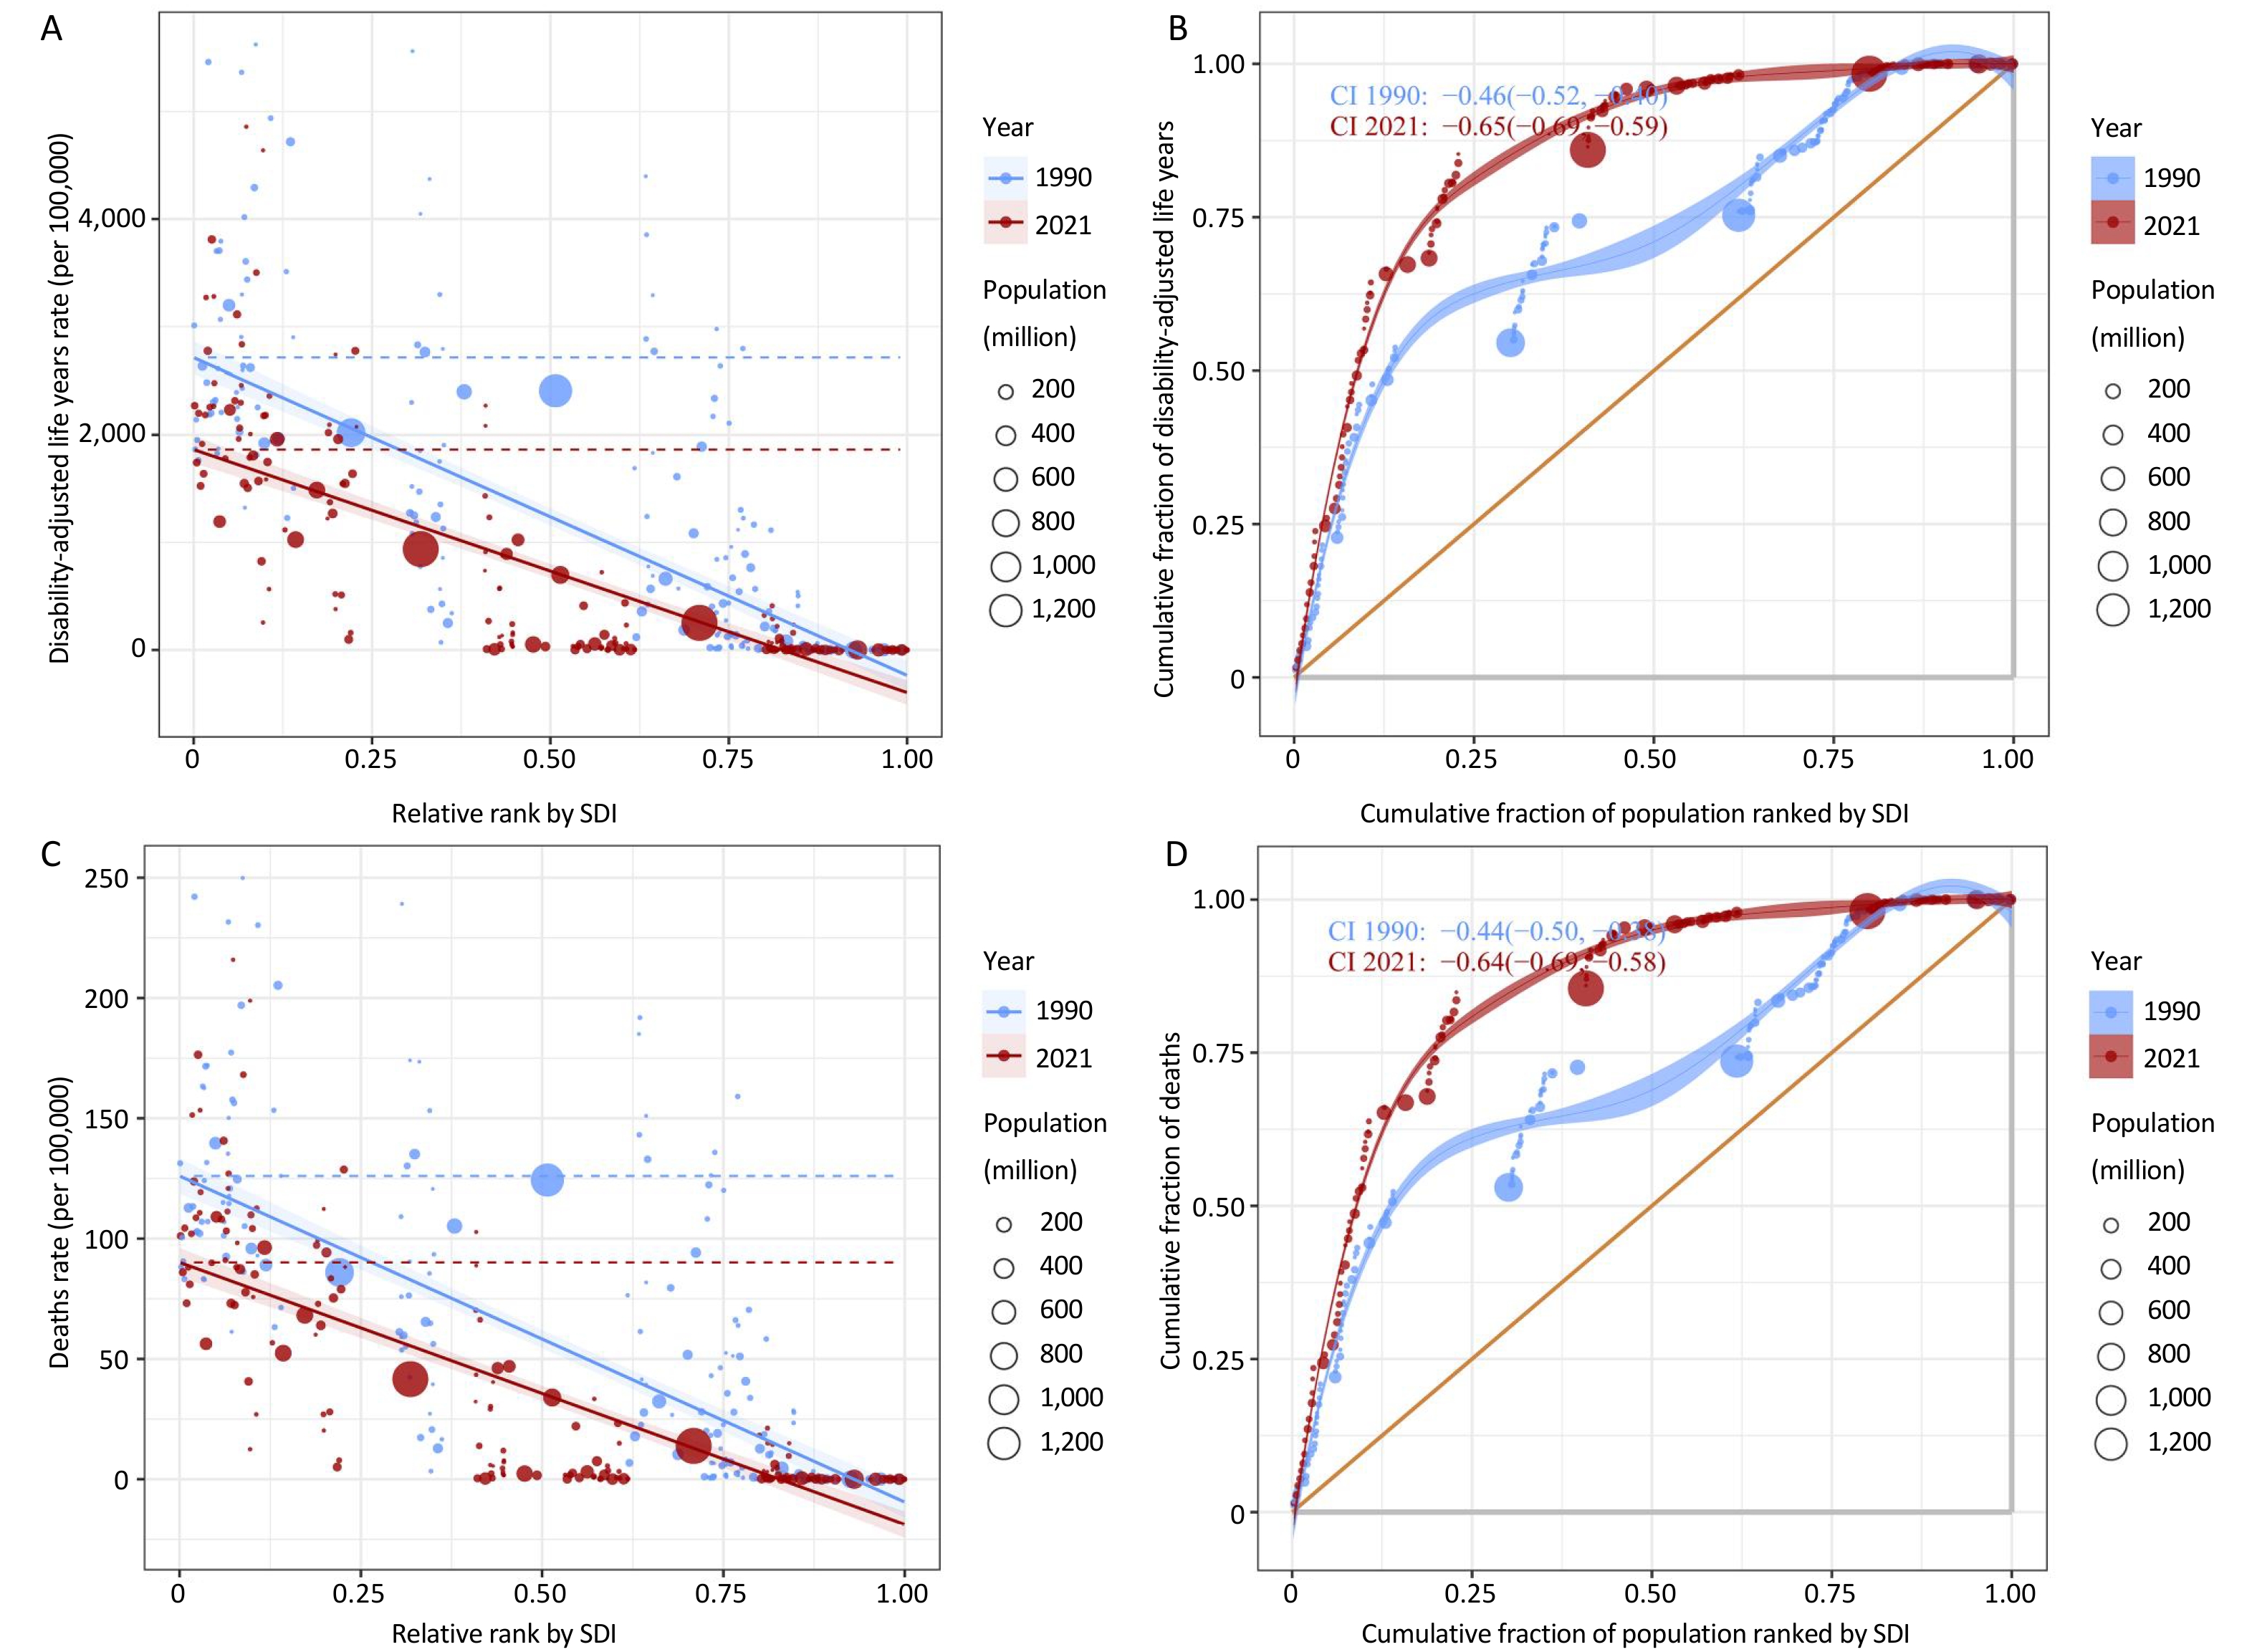
Findings from Tables 1 and Supplementary Tables S1–S2 indicate a potential negative correlation between the burden of CVD attributable to HAP and sociodemographic development, as measured by the SDI. A nonlinear inverse association was observed between sociodemographic development and CVD burden attributable to HAP (Figure 7 and Supplementary Figures S13-S14). As shown in the scatterplots, both age-standardized DALY and mortality rates exhibited a declining trend with increasing SDI levels, with the burden peaking at mid-to-low SDI values before declining sharply. These findings suggest that lower socioeconomic development is associated with disproportionately higher cardiovascular burdens related to HAP. As illustrated in Figures 5A and Supplementary Figures S8–S12, the CVD burden attributable to HAP consistently declined across all SDI levels, with the most pronounced reductions observed in the low and low-middle SDI groups. Consistent with earlier findings, the high-SDI regions showed only modest decreases.
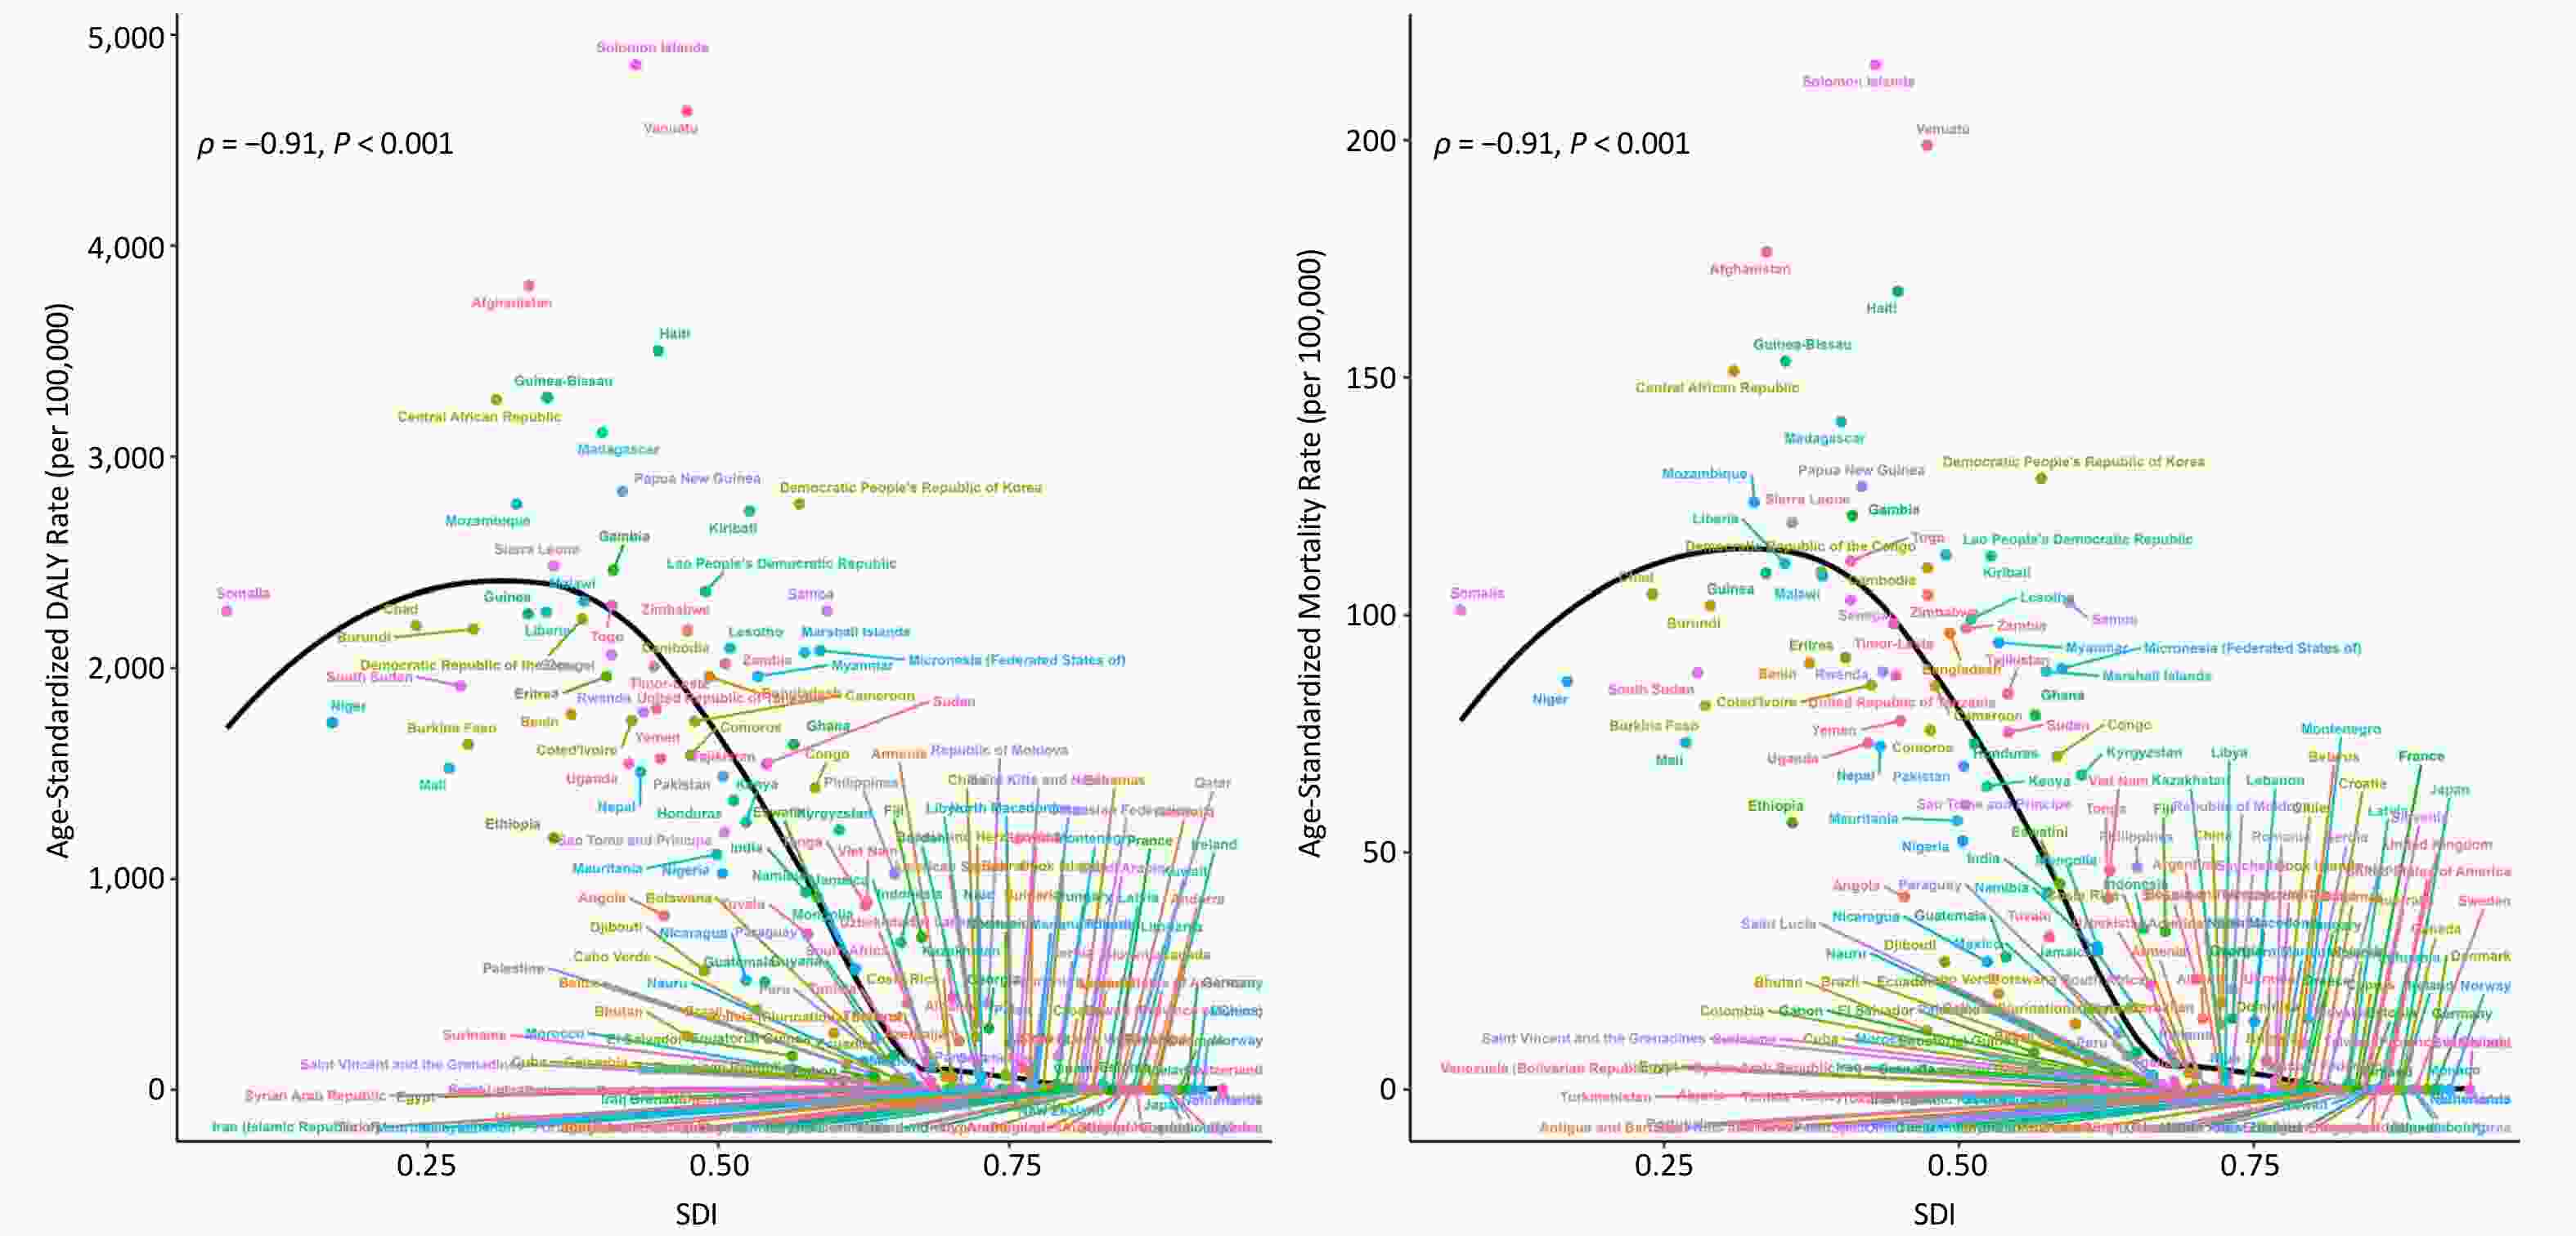
Figure 7. Relationship Between SDI and Age-Standardized DALYs and Mortality Rates of Cardiovascular Diseases Attributable to HAP. (A) DALY rate per 100,000 individuals; (B) Mortality rate per 100,000 individuals.
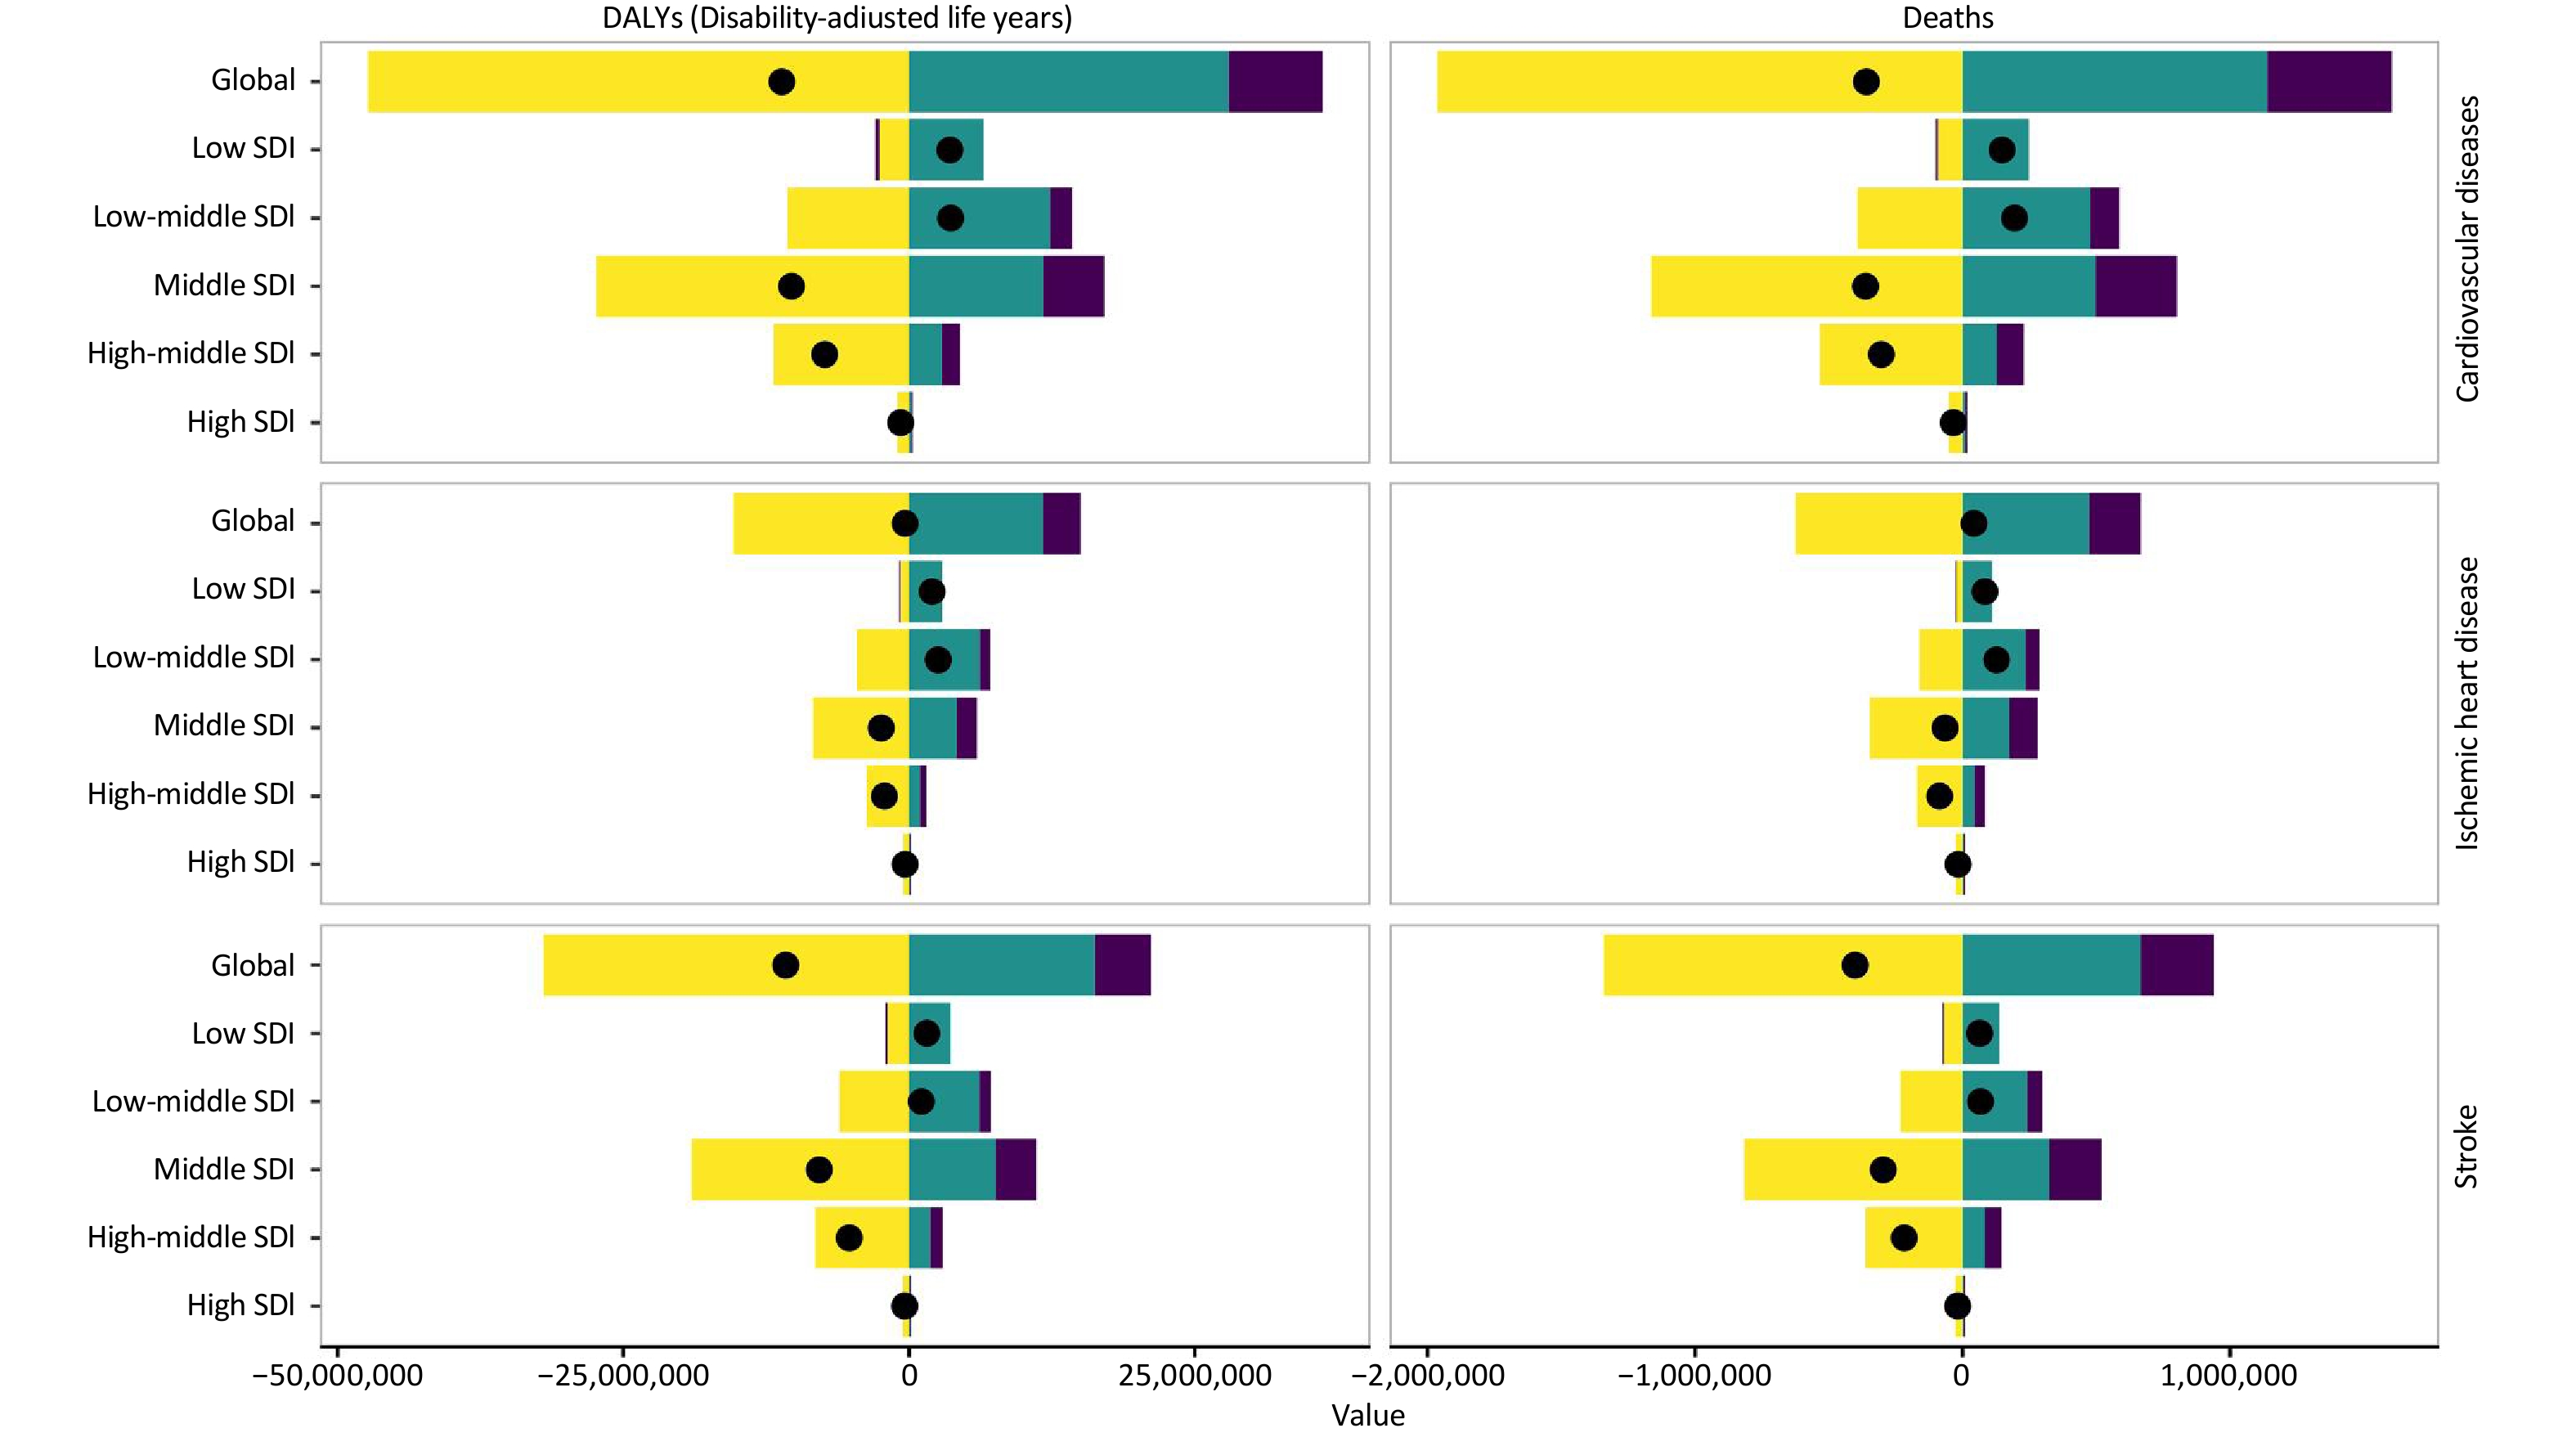
Building upon these observations, Figure 8 further decomposes the drivers behind the changes in CVD burden attributable to HAP across the SDI strata. The analysis revealed that epidemiological shifts were the primary contributors to burden reduction across all the SDI levels. However, in low and low-middle SDI countries, these gains were substantially offset by the counteracting forces of population growth and aging, which led to a net increase or only a modest decline in the total burden. Conversely, in regions with high SDI, the combined effects of demographic and epidemiological changes resulted in marginal overall reductions, underscoring a plateauing benefit in more developed settings.
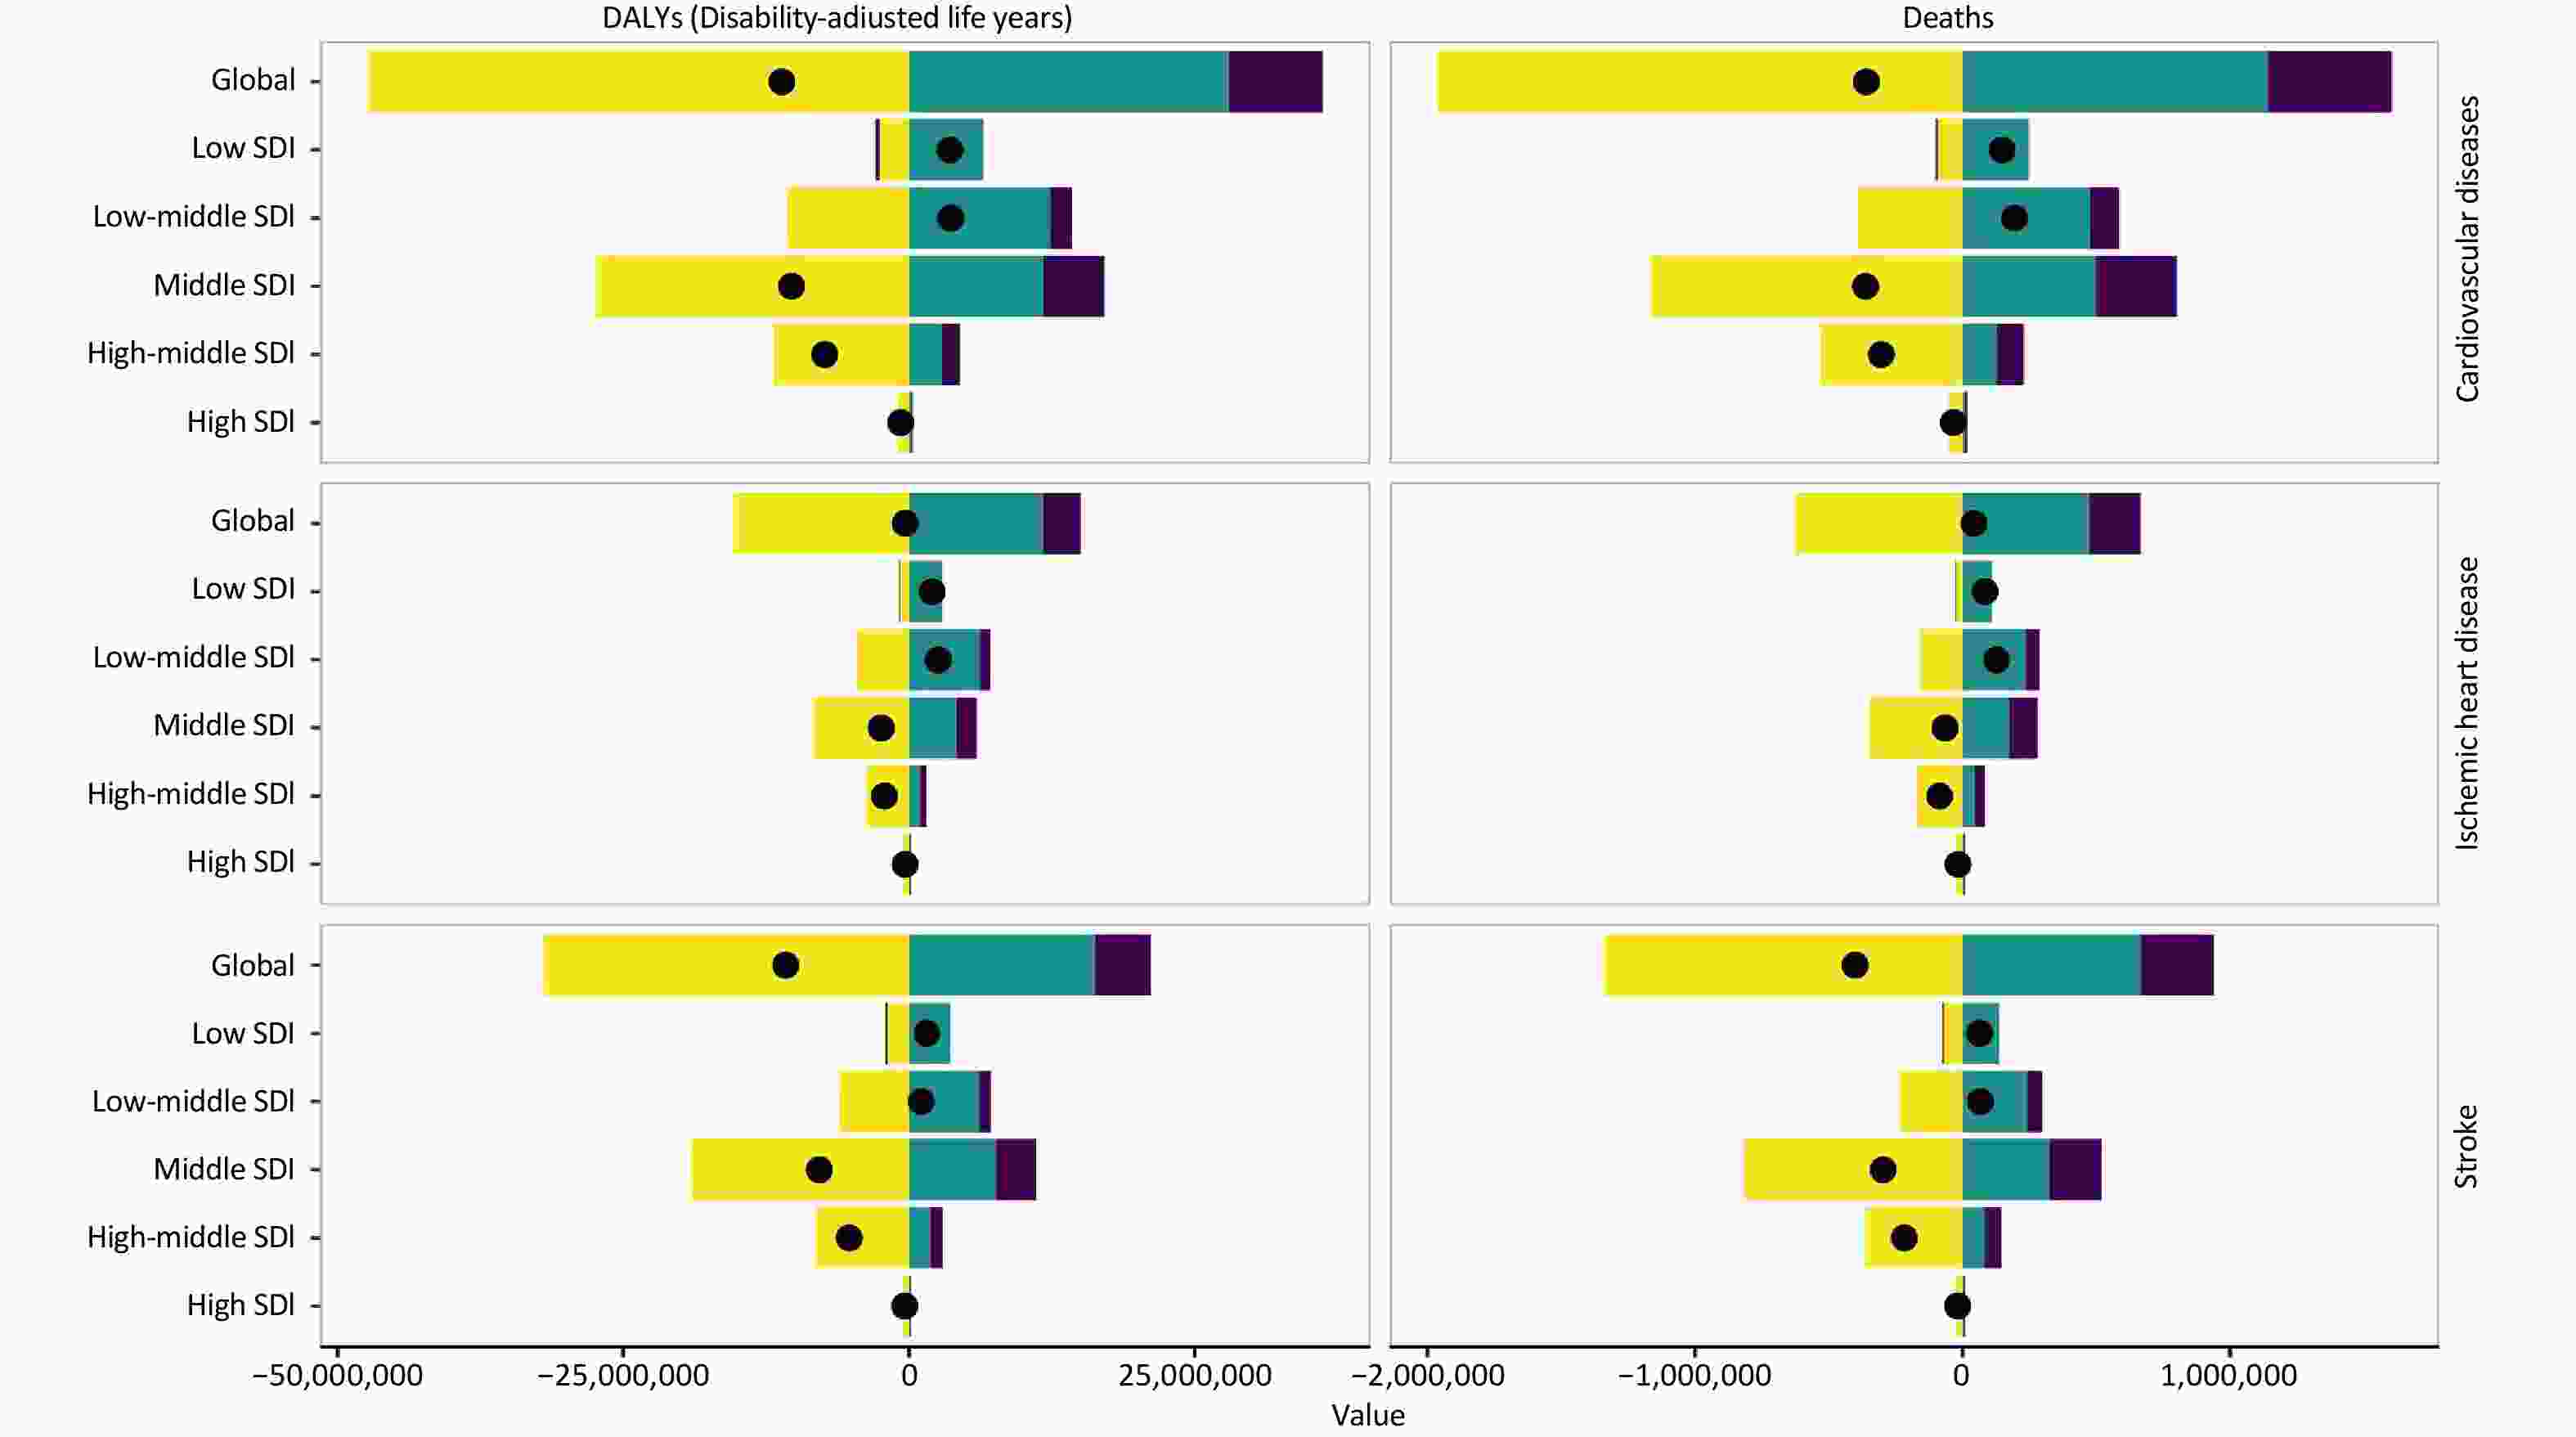
Figure 8. Cardiovascular diseases burden attributable to HAP across sociodemographic index levels: contributions of aging, population growth, and epidemiological changes.
Figure 9 and Supplementary Figures S15-16 depict both the absolute and relative disparities in disease burden across countries stratified by SDI levels and highlight how the extent of these inequalities have evolved from 1990 to 2021. These figures reveal pronounced disparities in the CVD burden attributable to HAP across countries stratified by SDI level. Nations with lower SDI values bear a disproportionately greater burden, which is reflected in significantly higher rates of both DALYs and mortality. Nevertheless, between 1990 and 2021, these inequalities diminished markedly, both in absolute magnitude (indicated by the reduced vertical differences) and in relative distribution (indicated by the steeper concentration curves). This pattern implies a progressive convergence in health outcomes, potentially driven by global public health initiatives aimed at mitigating environmental and socioeconomic disparities.
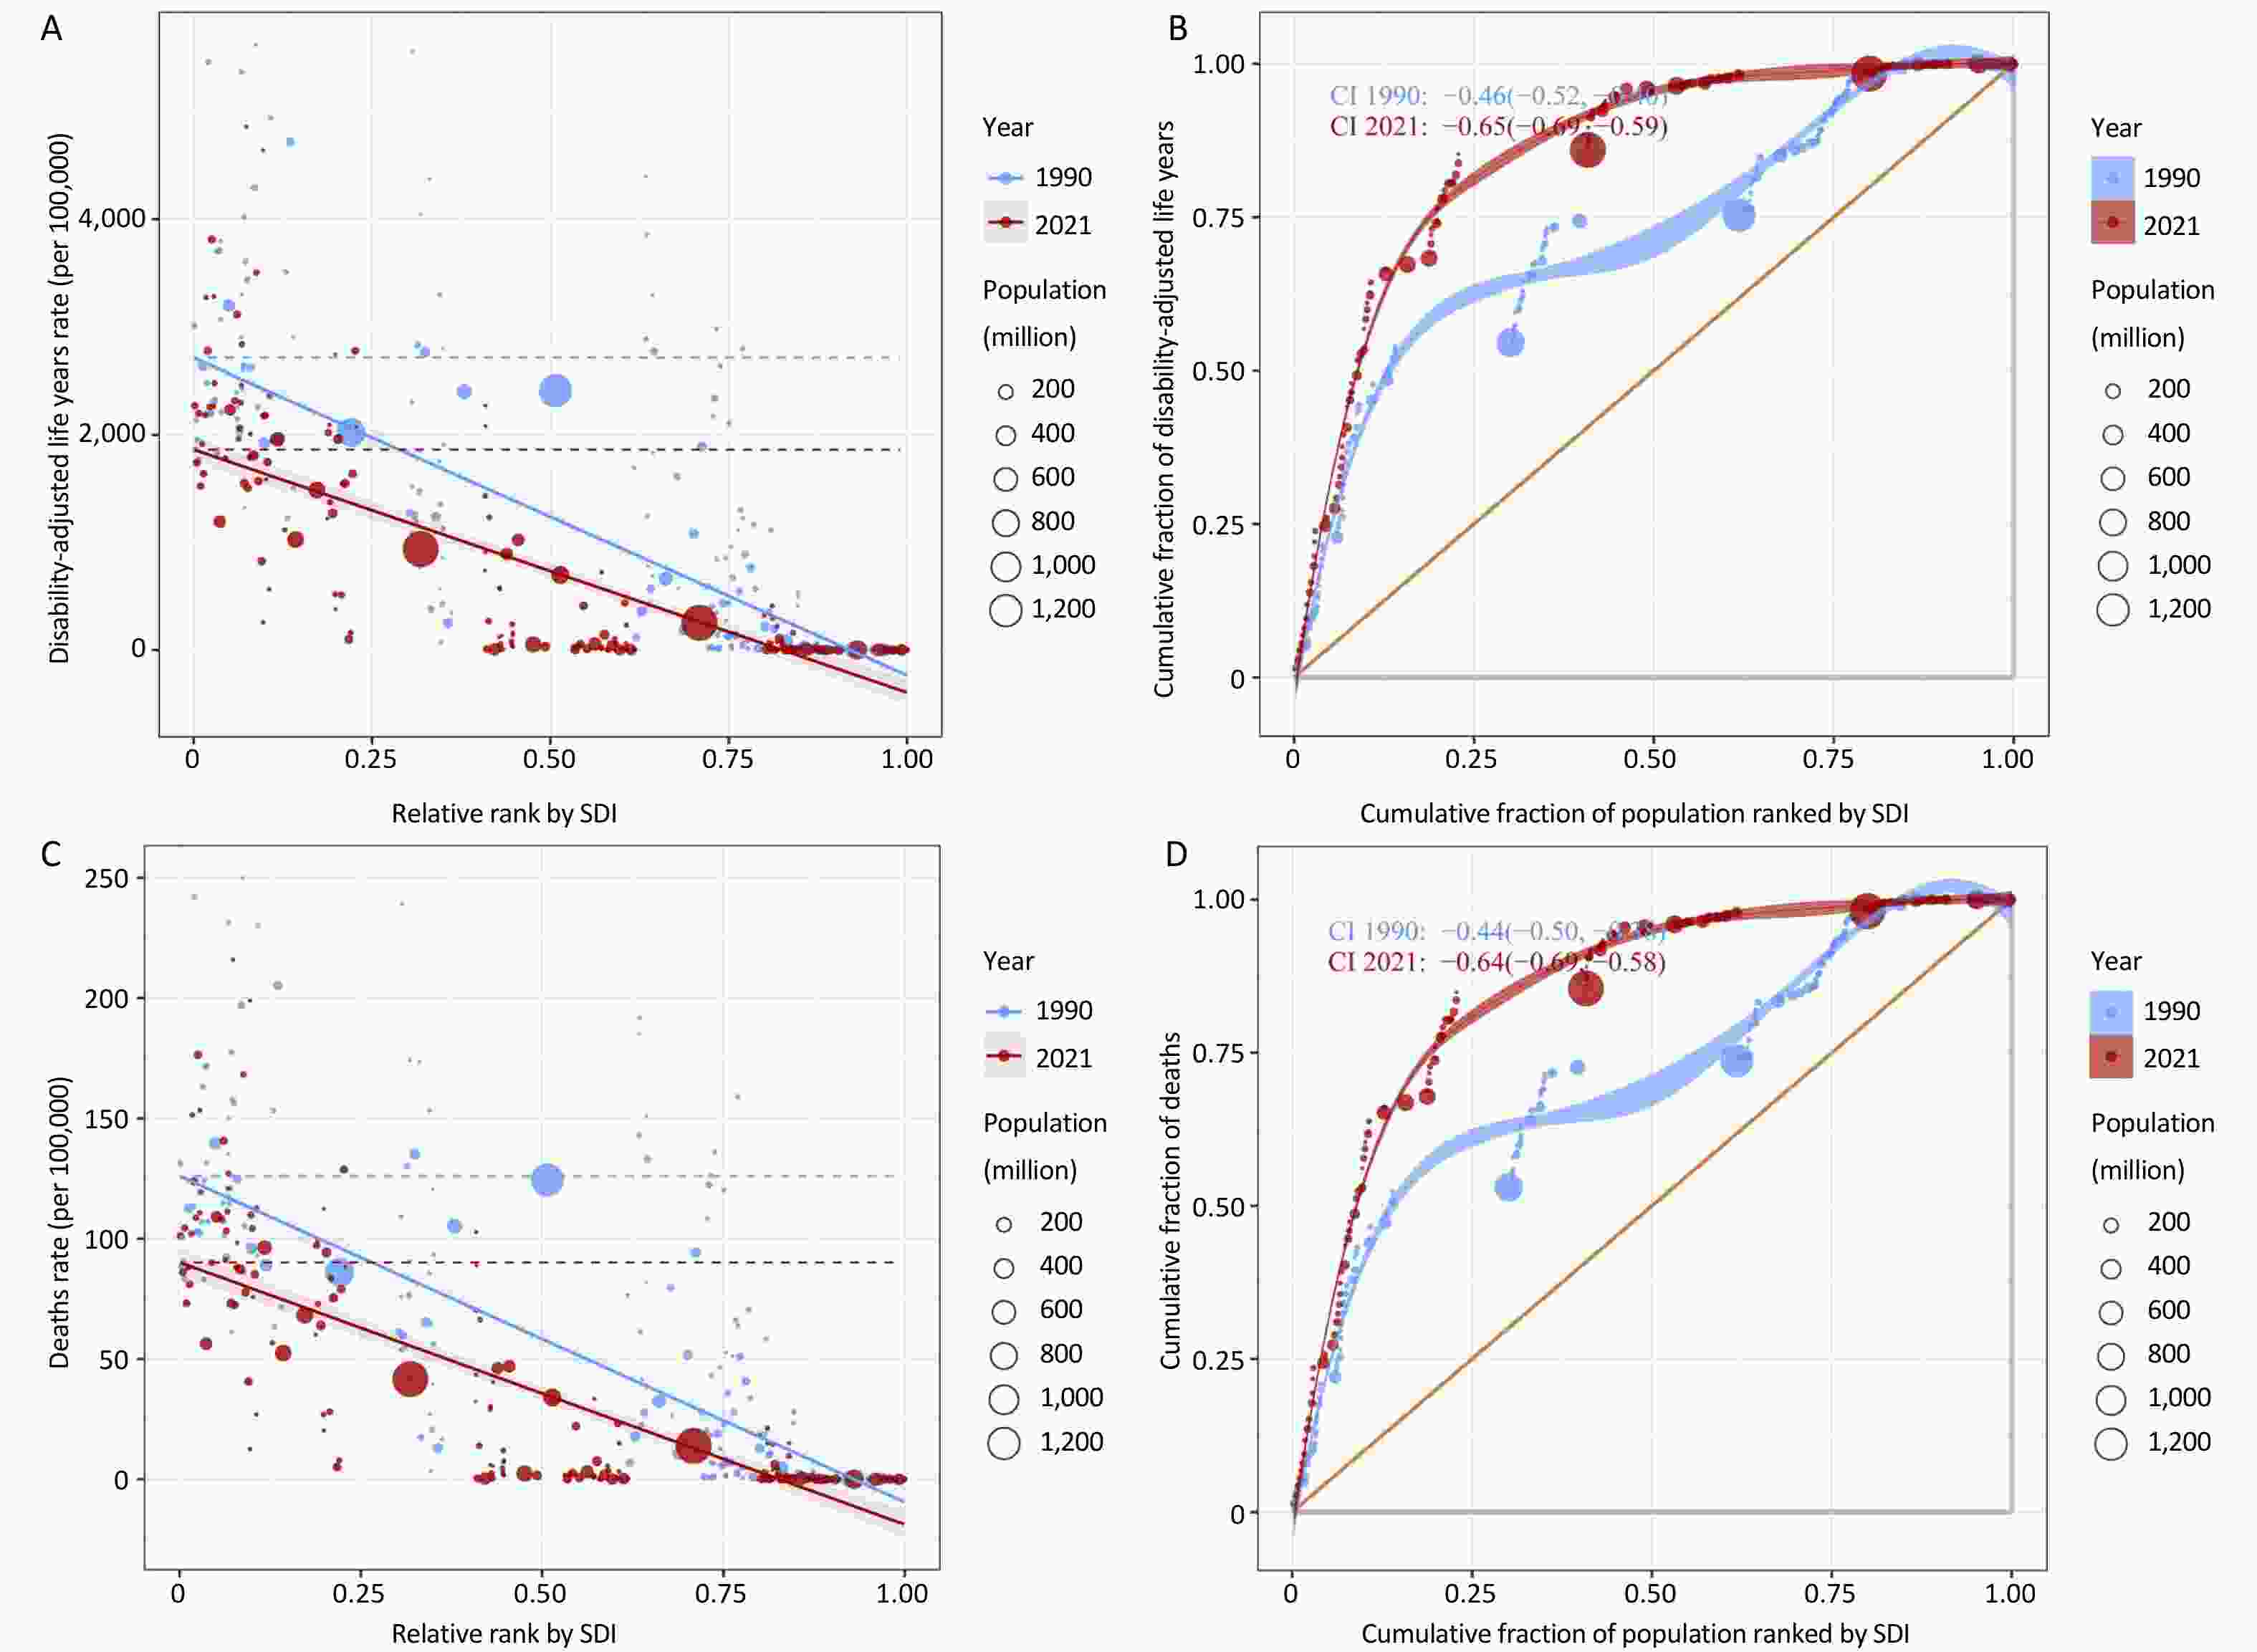
Figure 9. Inequality slope and concentration indices of disability-adjusted life years and death rates by SDI rank: a comparative analysis between 1990 and 2021. (A) Slope index of DALYs per 100,000 by SDI, (B) Concentration index of cumulative DALYs by SDI, (C) Slope index of death rate per 100,000 by SDI, (D) Concentration index of cumulative deaths by SDI.
-
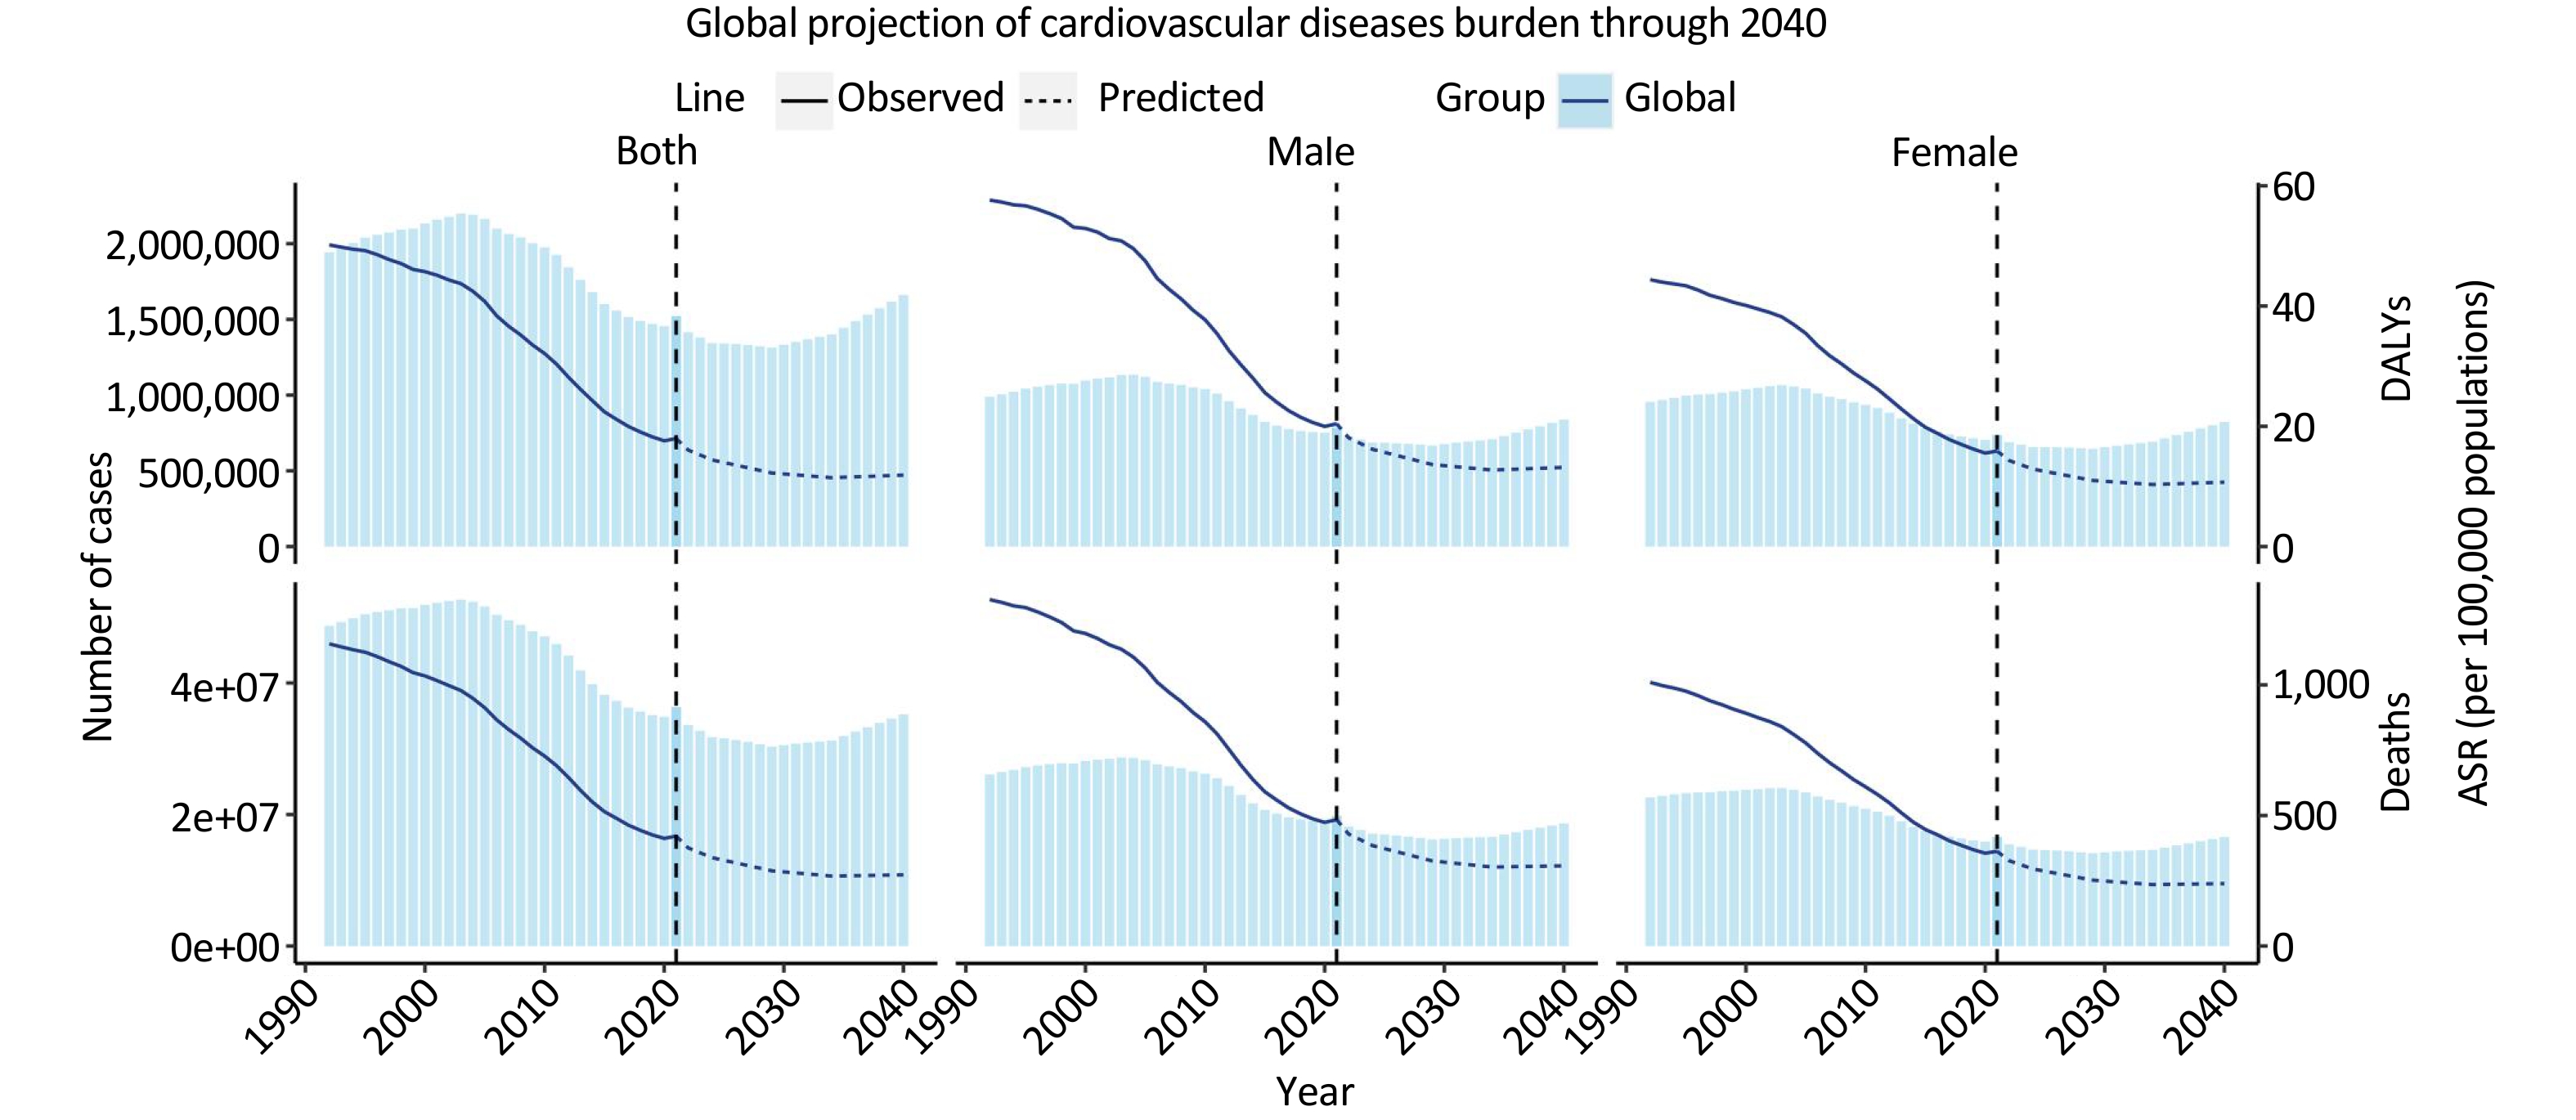
Figure 10 and Supplementary Figures S17-23 show a slight increase in the number of CVD cases by 2040, while ASR of deaths and DALYs decline, indicating that the per capita impact is projected to decrease despite a modest rise in total cases. A deeper analysis of the projections across the GBD super-regions reveals that only high-income regions demonstrate a decline in both ASR and total cases, underscoring that in the foreseeable future, CVD linked to HAP will continue to represent a major public health challenge in most global regions.
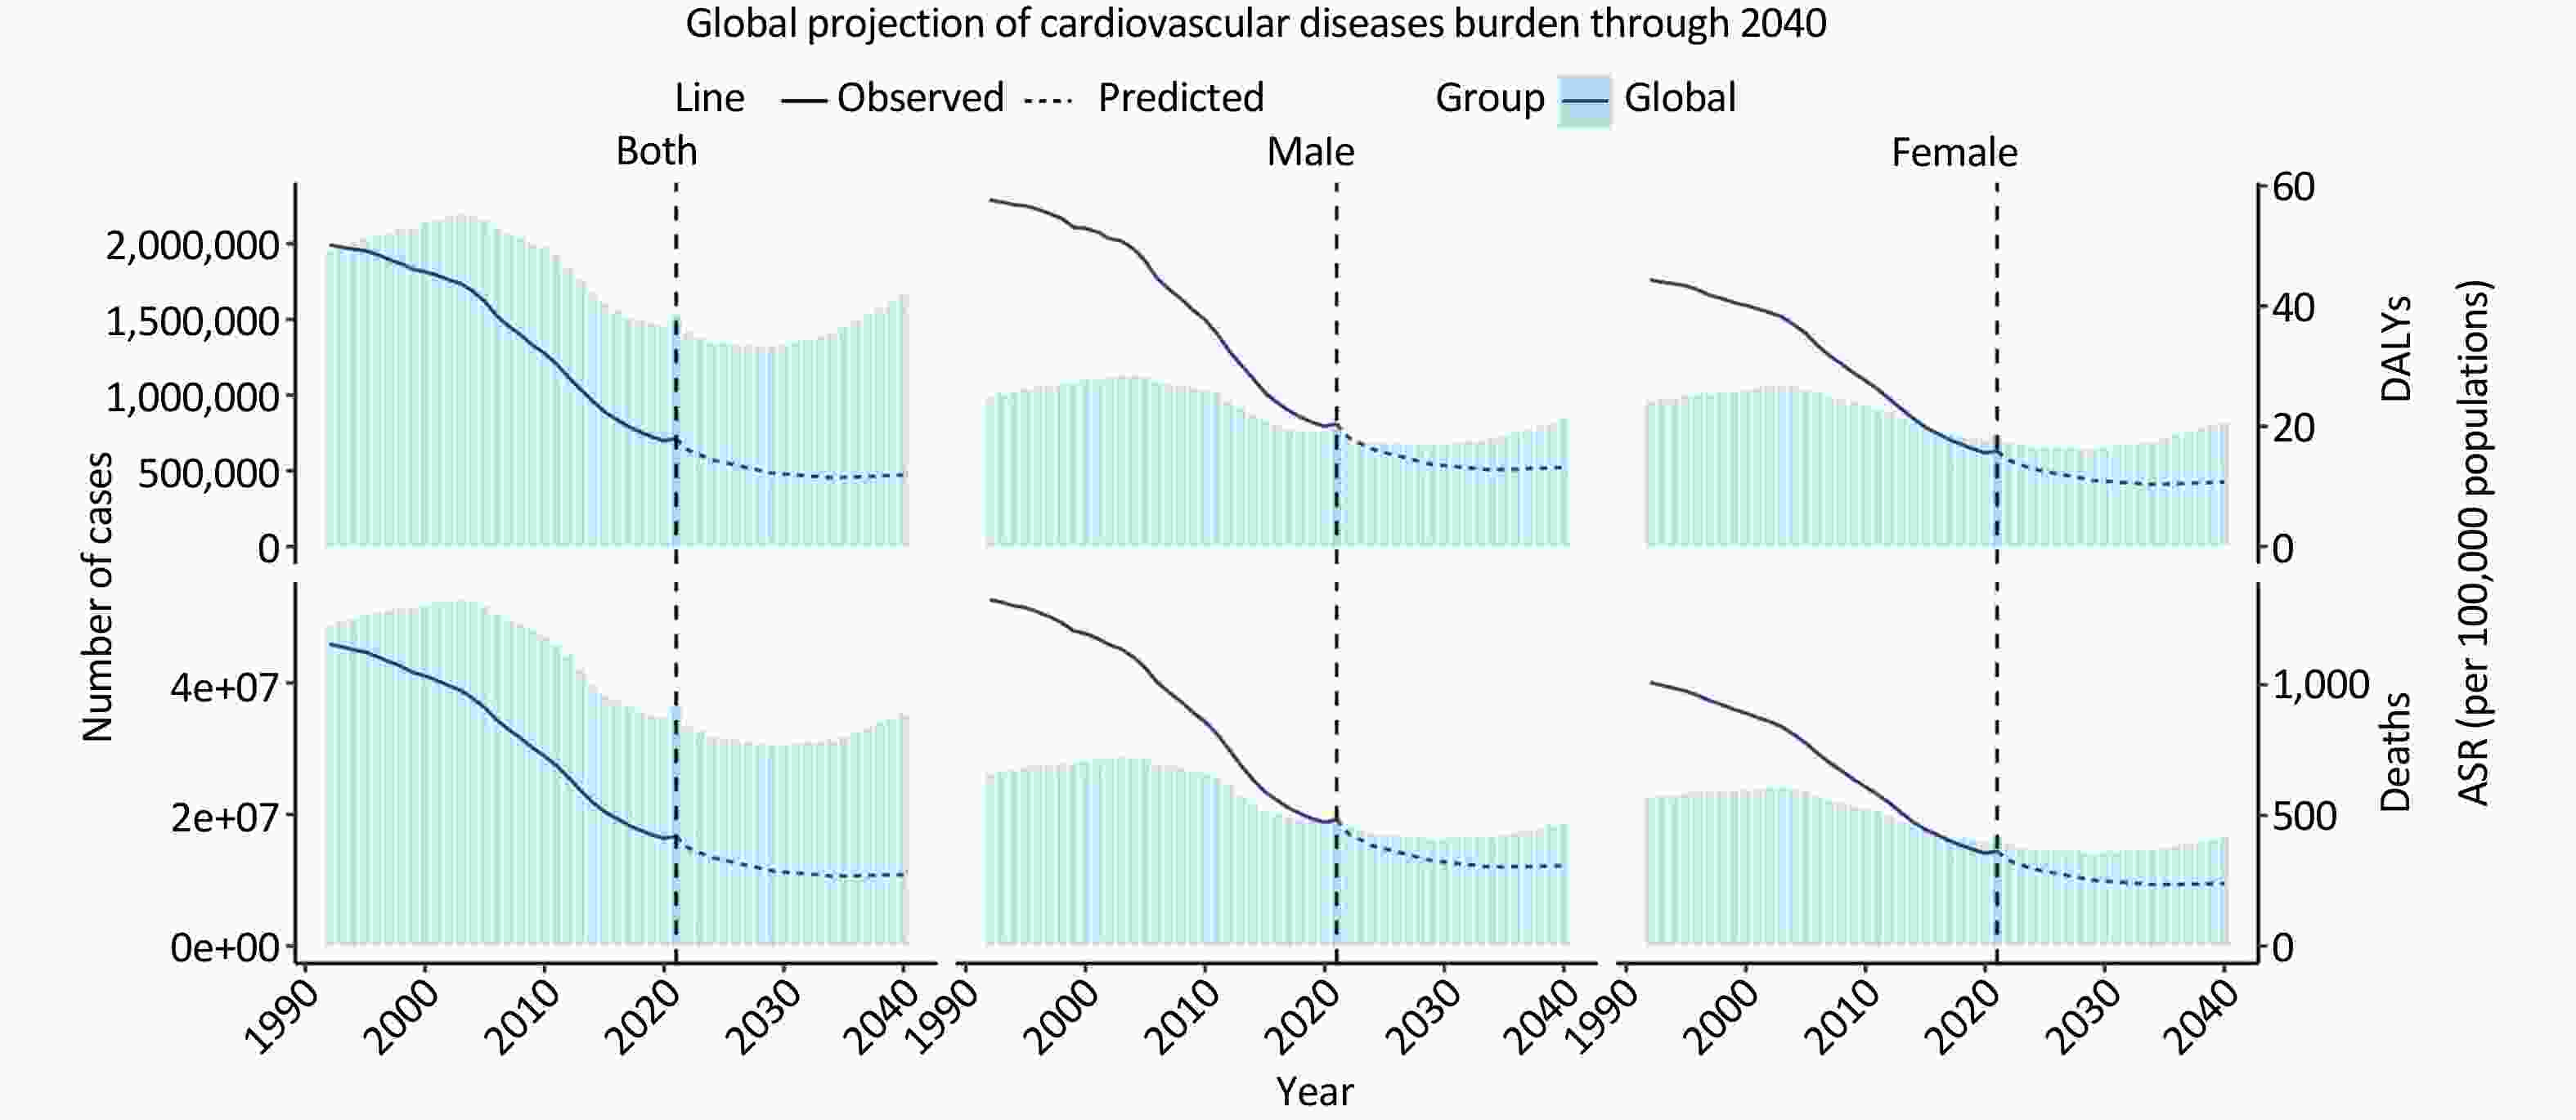
Figure 10. Global Projections of Cardiovascular Disease Burden Through 2040: Trends in Mortality and DALYs by Sex.
-
This study provides a comprehensive global assessment of the current status and temporal trends of CVD attributable to HAP from 1990 to 2021 and reveals persistent disparities across age, sex, geography, and sociodemographic strata. Overall, both ASDR and ASMR declined markedly, indicating global progress in alleviating the CVD burden associated with HAP. IHD and strokes, the predominant subtypes, also exhibited sustained downward trends across all subgroups. Males consistently bore a heavier disease burden than females, and the disease burden increased notably with advancing age. Despite these positive trends, substantial heterogeneity was observed. Sub-Saharan Africa, South Asia, Southeast Asia, and parts of Oceania continued to experience disproportionately high burden levels, particularly in countries with low SDI. While both the absolute and relative inequalities narrowed over time, pronounced gaps persisted. These findings underscore the dual reality of meaningful progress and enduring inequity, reinforcing the need for tailored strategies to reduce HAP exposure and its cardiovascular consequences, particularly in older adults, men, and socioeconomically disadvantaged populations.
Mechanistically, HAP-related gaseous and solid constituents had been shown to induce oxidative stress, systemic inflammation, endothelial dysfunction, and autonomic imbalance, all of which contribute to the development and progression of CVD. Recent human imaging data provide direct mechanistic support for the link between air pollution and cardiovascular risk. In a cohort without baseline CVD (N ≈ 500), higher residential PM2.5 was associated with increased leukopoietic tissue activity (bone marrow/spleen) and arterial inflammation on ^18F-FDG PET/CT; these tissue effects serially mediated the association between PM2.5 exposure and major adverse cardiovascular events over follow-up, even after accounting for socioeconomic and other confounders[20]. Complementary experimental evidence indicates that combustion-related particulates trigger oxidative stress (antioxidant depletion; transition-metal/quinone chemistry), activate NADPH oxidases, reduce nitric oxide bioavailability, and produce endothelial dysfunction and vasoconstriction. These effects are mitigated by antioxidants or genetic disruption of NOX2/p47^phox/TLR4 pathways and can be accentuated by ultrafine particles that translocate systemically. Additional pathways include autonomic imbalance and hypothalamic-pituitary-adrenal axis activation, consistent with the observed changes in heart rate variability and blood pressure in exposure studies. Together, these human and experimental findings move beyond generalized statements and support a biologically plausible, tissue-level pathway from HAP-related PM2.5 exposure to vascular inflammation and subsequent cardiovascular events[21,22]. Fortunately, HAP is an avoidable risk factor and its levels can be reduced through changes in cooking practices. A study conducted in Guatemala found that improving stove chimneys to reduce exposure to wood smoke led to lower blood pressure and improvements in ST-segment depression[5,23,24]. Similarly, this study revealed a significant decline in the CVD burden attributable to HAP over the past 30 years across all age groups, sexes, and regions, highlighting global progress in mitigating this burden.
Although women are often assumed to have higher household exposure due to cooking, our GBD-based estimates showed a marginally higher HAP-attributable CVD burden in men, with overlapping uncertainty intervals. This pattern is consistent with the fact that the attributable burden depends both on exposure- and sex-specific baseline CVD rates and co-exposures. In many settings, men have a higher background CVD incidence/mortality and a greater prevalence of smoking, hypertension, and occupational/ambient exposure, which can amplify population-attributable counts and rates, even if household exposure is lower. In addition, regional heterogeneity and fuel-stacking behaviors (the simultaneous use of clean and solid fuels) can blur simple sex contrasts. Therefore, we interpreted the sex differences cautiously and reported sex-disaggregated data while highlighting that the uncertainty intervals overlapped[25]. This study demonstrated that the CVD burden associated with HAP increased with age, which aligns with established knowledge. This pattern is attributable to both the natural progression of the disease and cumulative effects of pollutant toxicity[26].
Regions such as South, East, and Southeast Asia and Sub-Saharan Africa bear disproportionately higher CVD burdens due to HAP than other parts of the world. Despite significant differences in dietary habits, lifestyles, and other factors, these regions share a common trait of being socioeconomically disadvantaged. Regional disparities in disease burden are largely driven by socioeconomic development. Interestingly, the results differed when analyzing ASRs (with Sub-Saharan Africa ranking the highest) and land-area-adjusted disease burden totals (with South Asia ranking the highest), primarily due to population size. The 2010 data confirmed that the proportion of environmental PM2.5 from cooking was highest in Southern Sub-Saharan Africa, while South Asia had the highest absolute concentration of cooking-related PM2.5[27]. Although ASRs may not be the highest in regions such as South and East Asia, the large population base makes HAP a critical public health issue. This study employed correlation analysis and quantitative measures, including the concentration and inequality slope indices, to highlight the health inequalities associated with the CVD burden caused by HAP, further underscoring the urgent need for focused attention on low- and middle-income countries[28]. Brief country snapshots underscore these contexts: in Ethiopia and Nigeria, persistent reliance on biomass, affordability constraints, and last-mile liquefied petroleum gas (LPG)-supply bottlenecks sustain household exposure; in India, large-scale LPG connection programs (e.g., Pradhan Mantri Ujjwala Yojana) have improved access, but refill affordability and fuel stacking limit their exclusive use; in Bangladesh, rapid electrification and LPG market growth coexist with rural biomass reliance[22]. These socioeconomic and policy factors help explain why ASR declines can coexist with rising or stagnant absolute counts and point to policy packages that pair access to sustained-use enablers (targeted refill support, pay-as-you-go models, and reliable power). Simultaneously, an analysis of the changes in disease burden over the past three decades unveils a glimmer of hope: there have been substantial reductions in the CVD burden caused by HAP in low- and middle-income countries, accompanied by a notable reversal of health inequalities. The underlying causes of this phenomenon are complex and multifaceted. The concerted efforts of governments, multinational corporations, and non-profit international organizations (e.g., the Global Alliance for Clean Cookstoves, which transforms traditional cooking and heating practices and promotes clean stoves and fuels) have substantially improved the disease burden[29,30]. Several countries and regions have strengthened their policies and regulations to curb air pollution. These initiatives include stringent air quality standards, enhanced regulation of pollution sources, and subsidies for clean energy. Such measures have fostered the use of low-emission fuels and gradual phasing out of high-pollution facilities, significantly reducing indoor air pollution. For instance, in the Beijing-Tianjin-Hebei region and surrounding areas of China, significant efforts have been made to promote initiatives such as coal-to-gas, coal-to-electricity, and the adoption of renewable energy for heating[31,32]. Global advancements in health education and awareness have markedly increased the public’s recognition of indoor air pollution[33]. Rising economic development and living standards in numerous countries, particularly low-income regions, have allowed citizens to afford cleaner fuels and modern cooking appliances[34]. With the deepening of global cooperation and exchange, several major nations who were responsible have made significant financial investments and provided technological support to foster clean energy and green transformation in developing countries and regions. For example, China’s Belt and Road Initiative has offered substantial assistance to countries along the route, particularly in sectors such as nuclear energy, wind power, photovoltaics, and smart grids[35]. Over the past few decades, significant strides have been made in the diagnosis and treatment of CVDs. Early detection and effective interventions have not only improved survival rates but have also contributed significantly to mitigating the CVD burden associated with HAP. While we celebrate the decline in the disease burden, this study remind us not to become complacent in tackling HAP based on the projections for future burdens, both globally and regionally. Although the per-capita impact is decreasing, the continued expansion of the global population and the ongoing aging process will lead to an increase in the crude number of cases over the next two decades.
This study has several limitations. First, the quality and availability of raw data, as well as the accuracy and validity of the methodological and statistical models, can significantly influence the reliability of the estimated CVD burden attributable to HAP. In the early stages, disease registries were unavailable in some countries, particularly in the low- and middle-income regions. Even today, countries with smaller populations struggle to provide sufficient data on the disease burden. Consequently, the GBD collaboration estimated the burden in these regions using data from neighboring areas and relevant covariates, which may have affected the accuracy of the estimates. Due to data limitations, this study focused exclusively on the CVD burden attributable to HAP and did not examine potential interactions with other environmental factors, such as non-optimal temperatures, humidity, or noise pollution[36]. Finally, although the global population was categorized by country and region, no further subdivisions were made. This limitation hampers the assessment of disease disparities between urban and rural areas or ethnic subgroups within individual countries.
-
This study showed significant global reductions in the CVD burden attributable to HAP over the past three decades, with the decline being particularly pronounced in low- and middle-income countries, although disparities remain, and the situation remains challenging. Although health inequalities have improved notably, they still exist. The burden is consistently higher in males and increases with age. Despite declining per capita impacts, the continued growth and aging of the global population will lead to higher total cases in the coming decades, emphasizing the need for sustained, targeted interventions to address the HAP-related CVD burden and health inequalities.
The Global, Regional, and National Burden of Cardiovascular Diseases Attributable to Household Air Pollution from 1990 to 2021: Findings from the Global Burden of Disease Study 2021
doi: 10.3967/bes2025.141
- Received Date: 2025-06-19
- Accepted Date: 2025-10-14
-
Key words:
- Global Burden of Disease /
- Cardiovascular disease /
- Ischemic heart disease /
- Stroke /
- Household air pollution
Abstract:
The authors declare that they have no competing interests.
Not applicable.
| Citation: | Zehao Zhao, Yong Zeng. The Global, Regional, and National Burden of Cardiovascular Diseases Attributable to Household Air Pollution from 1990 to 2021: Findings from the Global Burden of Disease Study 2021[J]. Biomedical and Environmental Sciences. doi: 10.3967/bes2025.141

|

 Quick Links
 DownLoad: