
-
Primary liver cancer (PLC) is a major global health challenge, ranking as the sixth most common and third most fatal malignancy worldwide, according to GLOBOCAN 2022 estimates.[1] This high mortality rate underscores the aggressive nature of the disease and the significant burden it places on global healthcare systems. Although primary prevention remains the cornerstone of liver cancer control, improving outcomes for patients already diagnosed is equally critical for mitigating the impact of the disease. Currently, the international five-year survival rate for PLC is < 20%,[2] a stark figure that highlights the urgent and pressing need for more precise and reliable prognostic tools. The ability to accurately stratify patients based on their individual risks can directly guide personalized treatment decisions, allowing clinicians to tailor therapies to maximize efficacy while minimizing unnecessary toxicity. Such tools are essential for optimizing therapeutic strategies and preventing both overtreatment in low-risk patients and undertreatment in high-risk individuals, thereby helping control healthcare costs. Furthermore, robust prognostic models can accelerate innovative therapies development by rapidly identifying high-risk populations that are most likely to benefit from inclusion in randomized controlled trials.
Unfortunately, many of the prognostic systems currently in clinical use, such as the Barcelona Clinic Liver Cancer (BCLC), Okuda, and tumor-node-metastasis (TNM) staging systems, are based on methodological frameworks that are now considered outdated. These systems often lack contemporary statistical validation and have significant limitations, such as poor discriminatory capacity for patients with early-stage disease or being validated primarily in specific, often advanced-stage, patient populations. Although new prognostic models have emerged, they face challenges in clinical translation, including the complexity of acquiring the necessary predictive variables, poor applicability across heterogeneous patient populations, and insufficient discriminative power. In recent years, the exponential growth in large-scale medical and health data has created opportunities to overcome these hurdles. Traditional statistical methods are increasingly struggling to meet the demands of complex data analysis. However, machine learning, with its powerful data processing and analytical capabilities, has provided a new paradigm for predicting cancer-related mortality and enabling precise, individualized prevention and control.[3] Therefore, this study aimed to develop and internally validate prognostic models for 60-month PLC-specific mortality using both traditional statistical and machine-learning approaches.
In this context, this study leveraged comprehensive population-based data from the U.S. Surveillance, Epidemiology, and End Results (SEER) database to analyze the prognostic factors influencing survival in patients with PLC. Our The primary objective was to apply sophisticated machine learning algorithms to construct a prognostic stratification model specifically tailored to the diverse patients with liver cancer represented in this extensive database. The ultimate aim was to provide a clinically relevant tool for prognostic stratification that could serve as an evidence-based foundation for prognostic assessment, treatment selection, and follow-up management. By facilitating better-informed clinical decision-making, it is hoped that this will contribute to improved survival outcomes in patients with liver cancer.
To achieve this, data were extracted from 57,526 patients with PLC diagnosed between 2000 and 2017, with a complete follow-up period of at least 60 months. This study first employed both fine-gray competing risk and Cox proportional hazards regression models to identify key prognostic factors. Subsequently, the entire patient cohort was partitioned into training and test sets, upon which multiple machine-learning models were developed and rigorously compared. The best-performing model was then selected to build an individualized, user-friendly prediction tool for 60-month PLC-specific mortality risk. The variables analyzed in the study were: age (numeric); survival months (numeric); race (white and hispanic, black, Asian or Pacific Islander, American Indian/Alaska Native); year of diagnosis (2000-2005, 2006-2011, 2012-2017); median household income (inflation-adjusted to 2022): ≤90,000/year (household), >90,000/year (household); residential status (counties in metropolitan areas, counties not in metropolitan areas); marital status (married categories, single categories, unknown); histologic type [hepatocellular carcinoma (HCC), intrahepatic cholangiocarcinoma (ICC), other]; stage (localized, regional, distant, unknown/unstaged); surgery (no/unknown, yes); radiotherapy (no/unknown, yes); chemotherapy (no/unknown, yes); time from diagnosis to treatment (≤ 2 months, > 2 months, no/unknown); outcome [alive, dead (attributable to PLC), dead (attributable to other causes)]. The Appendix provides the detailed research methodology, including variable definitions, a full description of the statistical analysis, and the TRIPOD Checklist. The specific coding for each group is shown in eTable 1, where the group with the smallest code is considered the reference group.
Characteristics Overall Alive Dead (attributable to PLC) Dead (attributable to other causes) (n =57,526) (n =8,521) (n =39,994) (n =9,011) Survival (months), Median [Q1, Q3] 10.00 [2.00, 41.00] 96.00 [64.00, 148.00] 6.00 [1.00, 19.00] 15.00 [3.00, 49.00] Age (years), Median [Q1, Q3] 64.00 [56.00, 73.00] 59.00 [51.00, 66.00] 65.00 [57.00, 74.00] 65.00 [57.00, 75.00] Diagnosis, n (%) 2000−2005 14,818 (25.76) 1,153 (13.53) 11,168 (27.92) 2,497 (27.71) 2006−2011 20,335 (35.35) 2,543 (29.84) 14,415 (36.04) 3,377 (37.48) 2012−2017 22,373 (38.89) 4,825 (56.62) 14,411 (36.03) 3,137 (34.81) Sex, n (%) Female 15,153 (26.34) 2,595 (30.45) 10,302 (25.76) 2,256 (25.04) Male 42,373 (73.66) 5,926 (69.55) 29,692 (74.24) 6,755 (74.96) Race, n (%) White and Hispanic 40,681 (70.72) 5,646 (66.26) 28,620 (71.56) 6,415 (71.19) Black 6,771 (11.77) 745 (8.74) 4,928 (12.32) 1,098 (12.19) Asian or Pacific Islander 9,524 (16.56) 2,064 (24.22) 6,046 (15.12) 1,414 (15.69) American Indian/Alaska Native 550 (0.96) 66 (0.77) 400 (1.00) 84 (0.93) Income (RMB/year, household), n (%) ≤90,000 41865 (72.78) 5,720 (67.13) 29,599 (74.01) 6,546 (72.64) >90,000/year 15661 (27.22) 2,801 (32.87) 10,395 (25.99) 2,465 (27.36) Residential Status, n (%) Counties in metropolitan areas 51,768 (89.99) 7,956 (93.37) 35,632 (89.09) 8,180 (90.78) Counties not in metropolitan areas 5,758 (10.01) 565 (6.63) 4,362 (10.91) 831 (9.22) Marital status, n (%) Married categories 30,851 (53.63) 4,946 (58.04) 21,179 (52.96) 4,726 (52.45) Single categories 24,015 (41.75) 3,201 (37.57) 17,002 (42.51) 3,812 (42.30) Unknown 2,660 (4.62) 374 (4.39) 1,813 (4.53) 473 (5.25) Histologic Type, n (%) HCC 48,590 (84.47) 7,177 (84.23) 33,561 (83.92) 7,852 (87.14) ICC 1,723 (3.00) 60 (0.70) 1,444 (3.61) 219 (2.43) Other 7,213 (12.54) 1,284 (15.07) 4,989 (12.47) 940 (10.43) Stage, n (%) Localized 27,050 (47.02) 6,367 (74.72) 15,314 (38.29) 5,369 (59.58) Regional 14,487 (25.18) 1,408 (16.52) 11,220 (28.05) 1,859 (20.63) Distant 10,621 (18.46) 376 (4.41) 9,239 (23.10) 1,006 (11.16) Unknown/unstaged 5,368 (9.33) 370 (4.34) 4,221 (10.55) 777 (8.62) Surgery, n (%) No/unknown 38,694 (67.26) 1,950 (22.88) 31,423 (78.57) 5,321 (59.05) Yes 18,832 (32.74) 6,571 (77.12) 8,571 (21.43) 3,690 (40.95) Radiotherapy, n (%) No/Unknown 53,064 (92.24) 8,101 (95.07) 36,467 (91.18) 8,496 (94.28) Yes 4,462 (7.76) 420 (4.93) 3,527 (8.82) 515 (5.72) Chemotherapy, n (%) No/unknown 37,794 (65.70) 5,342 (62.69) 26,045 (65.12) 6,407 (71.10) Yes 19,732 (34.30) 3,179 (37.31) 13,949 (34.88) 2,604 (28.90) Time from diagnosis to treatment, n (%) ≤ 2 months 21,255 (36.95) 4,747 (55.71) 13,236 (33.09) 3,272 (36.31) > 2 months 10,601 (18.43) 2,348 (27.56) 6,320 (15.80) 1,933 (21.45) No/Unknown 25,670 (44.62) 1,426 (16.74) 20,438 (51.10) 3,806 (42.24) Note. PLC, primary liver cancer; HCC, hepatocellular carcinoma; ICC, intrahepatic cholangiocarcinoma. Table 1. The baseline characteristics of SEER patients with PLC included in the study
-
This study cohort of 57,526 participants had a median age of 64 years and a median survival time of only 10 months, with a significant male predominance (73.66%). By the end of the follow-up period, 65.9% of these patients had died specifically from PLC within 60 months of diagnosis, confirming the high lethality of the disease. The baseline characteristics of the study population are presented in Table 1.
In the comprehensive analysis of prognostic factors, both the Fine-Gray competing risks model was utilized, accounting for events that preclude the event of interest (i.e., death from other causes), and the more traditional Cox proportional hazard regression model. The remarkable consistency between the results of the two models confirmed the robustness and reliability of the identified prognostic factors. The Fine-Gray model results (Table 2) revealed several demographic and clinical factors that significantly influenced PLC-specific survival.
Characteristics Univariate analysis P Multivariable analysis P sHR (95%CI) sHR (95%CI) Age (per 1 year) 1.011 (1.011−1.011)a < 0.001 1.008 (1.007−1.009)a < 0.001 Sex Male vs. Female 1.050 (1.030−1.080)a < 0.001 1.053 (1.027−1.079)a < 0.001 Diagnosis year 2006−2011 vs. 2000−2005 1.010 (0.990−1.030) 0.470 0.902 (0.878−0.927)b < 0.001 2012−2017 vs. 2000−2005 0.843 (0.822−0.854)b < 0.001 0.802 (0.781−0.825)b < 0.001 Race Black vs. White and Hispanic 1.124 (1.092−1.166)a < 0.001 1.044 (1.009−1.079)a 0.013 Asian or Pacific Islander vs. White and Hispanic 0.817 (0.795−0.839)b < 0.001 0.916 (0.889−0.943)b < 0.001 American Indian/Alaska Native vs. White and Hispanic 1.082 (0.980−1.184) 0.130 1.041 (0.942−1.150) 0.430 Income (RMB/year, household) >90,000 vs. ≤90,000 0.873 (0.852−0.894)b < 0.001 0.968 (0.945−0.992)b 0.010 Residential Status Counties not in metropolitan areas vs. Counties in metropolitan areas 1.222 (1.182−1.252)a < 0.001 1.126 (1.088−1.166)a < 0.001 Marital status Single categories vs. Married categories 1.102 (1.071−1.123)a < 0.001 1.025 (1.002−1.048)a 0.034 Unknown vs. Married categories 0.993 (0.953−1.043) 0.770 0.875 (0.830−0.922)b < 0.001 Histologic Type ICC vs. HCC 1.742 (1.652−1.842)a < 0.001 1.205 (1.133−1.283)a < 0.001 Other vs. HCC 1.051 (1.021−1.082)a 0.001 0.996 (0.963−1.032) 0.840 Stage Regional vs. Localized 1.342 (1.323−1.371)a < 0.001 1.602 (1.562−1.643)a < 0.001 Distant vs. Localized 2.314 (2.254−2.373)a < 0.001 2.123 (2.057−2.191)a < 0.001 Unknown/unstaged vs. Localized 1.402 (1.361−1.452)a < 0.001 1.294 (1.246−1.345)a < 0.001 Surgery Yes vs. No/Unknown 0.303 (0.293−0.313)b < 0.001 0.408 (0.396−0.420)b < 0.001 Radiotherapy Yes vs. No/Unknown 1.172 (1.142−1.201)a < 0.001 0.946 (0.914−0.978)b 0.001 Chemotherapy Yes vs. No/Unknown 0.896 (0.875−0.906)b < 0.001 0.885 (0.863−0.907)b < 0.001 Time from diagnosis to treatment >2 months vs. < = 2 months 0.593 (0.584−0.612)b < 0.001 0.805 (0.784−0.826)b < 0.001 No/Unknown vs. < = 2 months 2.131 (2.082−2.171)a < 0.001 1.117 (1.083−1.151)a < 0.001 Note. a, the interval estimate exceeds 1;b, the interval estimate is below 1. PLC, primary liver cancer; HCC, hepatocellular carcinoma; ICC, intrahepatic cholangiocarcinoma; sHR, sub-hazard ratio. Table 2. Univariate and multivariate Fine−Gray analysis of factors influencing survival in patients with PLC
In both the univariate and multivariable Cox regression analyses, the hazard ratios (HRs) and adjusted hazard ratios (aHRs) of all factors were statistically significant, except for the “American Indian/Alaska Native” category in the factor of race. Cox regression analysis yielded similar results to the Fine-Gray analysis, and it was observed that other histological types, compared to HCC, were also prognosis factors for PLC survival. Detailed results are shown in Table 3.
Characteristics Univariate analysis P Multivariable analysis P HR (95%CI) aHR (95%CI) Age (per 1 year) 1.019 (1.018−1.019)a < 0.001 1.014 (1.013−1.015)a < 0.001 Sex Male vs. Female 1.075 (1.051−1.099)a < 0.001 1.128 (1.102−1.155)a < 0.001 Diagnosis year 2006−2011 vs. 2000−2005 0.832 (0.812−0.853)b < 0.001 0.892 (0.870−0.915)b < 0.001 2012−2017 vs. 2000−2005 0.741 (0.723−0.760)b < 0.001 0.793 (0.773−0.813)b < 0.001 Race Black vs. White and Hispanic 1.135 (1.101−1.169)a < 0.001 1.108 (1.075−1.143)a < 0.001 Asian or Pacific Islander vs. White and Hispanic 0.784 (0.763−0.806)b < 0.001 0.891 (0.866−0.917)b < 0.001 American Indian/Alaska Native vs. White and Hispanic 1.038 (0.940−1.146) 0.459 1.016 (0.920−1.122) 0.756 Income (RMB/year, household) >90,000/year(Household) vs. ≤90,000/year(Household) 0.834 (0.815−0.853)b < 0.001 0.941 (0.920−0.963)b < 0.001 Residential Status Counties not in metropolitan areas vs. Counties in metropolitan areas 1.247 (1.209−1.287)a < 0.001 1.137 (1.101−1.175)a < 0.001 Marital status Single categories vs. Married categories 1.153 (1.130−1.177)a < 0.001 1.095 (1.072−1.118)a < 0.001 Unknown vs. Married categories 1.103 (1.052−1.157)a < 0.001 0.883 (0.841−0.927)b < 0.001 Histologic Type ICC vs. HCC 2.058 (1.952−2.170)a < 0.001 1.311 (1.243−1.383)a < 0.001 Other vs. HCC 1.077 (1.045−1.109)a < 0.001 1.045 (1.013−1.077)a 0.005 Stage Regional vs. Localized 2.133 (2.081−2.186)a < 0.001 1.807 (1.762−1.853)a < 0.001 Distant vs. Localized 4.053 (3.947−4.163)a < 0.001 2.784 (2.706−2.864)a < 0.001 Unknown/unstaged vs. Localized 2.480 (2.397−2.567)a < 0.001 1.263 (1.218−1.309)a < 0.001 Surgery Yes vs. No/Unknown 0.215 (0.210−0.220)b < 0.001 0.299 (0.289−0.308)b < 0.001 Radiotherapy Yes vs. No/Unknown 1.144 (1.105−1.184)a < 0.001 0.828 (0.797−0.860)b < 0.001 Chemotherapy Yes vs. No/Unknown 0.808 (0.791−0.824)b < 0.001 0.750 (0.730−0.770)b < 0.001 Time from diagnosis to treatment >2 months vs. < = 2 months 0.837 (0.820−0.862)b < 0.001 0.747 (0.724−0.770)b < 0.001 No/Unknown vs. < = 2 months 2.622 (2.564−2.681)a < 0.001 1.235 (1.197−1.274)a < 0.001 Note. a, the interval estimate exceeds 1;b, the interval estimate is below 1. PLC, primary liver cancer; HCC, hepatocellular carcinoma; ICC, intrahepatic cholangiocarcinoma; HR, hazard ratio; aHR, adjusted hazard ratio. Table 3. Univariate and multivariate Cox regression analysis of factors influencing survival in patients with PLC
Consistent with previous research, older age, male sex, and black race were associated with a poorer prognosis. The elevated mortality risk among male patients may be linked to a higher prevalence of risk factors such as alcoholic liver disease and viral hepatitis,[4] including distinct molecular signatures.[5] The disparity faced by black patients, who have a higher mortality risk than White and Hispanic individuals, is a critical finding that likely reflects a complex interplay of socioeconomic differences, insufficient access to healthcare resources, and potentially race-specific tumor biological behaviors. Conversely, Asian or Pacific Islander patients demonstrate significantly better prognoses, a finding that warrants further investigation into potential genetic, lifestyle, and healthcare-related protective factors[6]. Socioeconomic status has emerged as a powerful determinant of outcomes. Household income exceeding $90,000 per year was a significant protective factor, highlighting the crucial role economic stability plays in comprehensive disease management. Patients with higher incomes are more likely to benefit from a timely diagnosis, standardized treatment protocols, and regular follow-up care, all of which contribute to improved survival.[7] Furthermore, residing in a non-metropolitan area is a risk factor, likely reflecting disparities in the availability of specialized diagnostic and treatment facilities for liver cancer in rural regions.
Clinical- and treatment-related variables are strong predictors of survival. As expected, a more advanced tumor stage at diagnosis was strongly associated with increased mortality risk. Patients with ICC have a significantly higher risk of PLC-specific death than those with HCC, which is consistent with the aggressive biology of ICC, including its high invasiveness and poor response to systemic treatments.[8] Surgery, radiotherapy, and chemotherapy were all significantly associated with a reduced risk of death, with surgery demonstrating the most pronounced protective effect (sub-hazard ratio [sHR] = 0.408). These findings underscore the central and lifesaving role of curative-intent therapies in the management of patients with liver cancer. One of the more counterintuitive findings was that patients who began treatment > two months after diagnosis had a lower mortality risk. This is likely not because delaying treatment is beneficial, but rather an instance of "reverse causality." Patients who are in better overall physical condition may be more suitable candidates for a deliberative, multidisciplinary treatment planning process, which can take time. In contrast, patients with more advanced tumors or a poorer health status often require immediate emergency treatment, thus creating a statistical artifact in which a longer diagnosis-to-treatment interval appears protective.[9] Cox regression analysis (Table 3) largely mirrored these results, further strengthening the validity of these factors as independent prognostic indicators for the overall survival of patients with liver cancer.
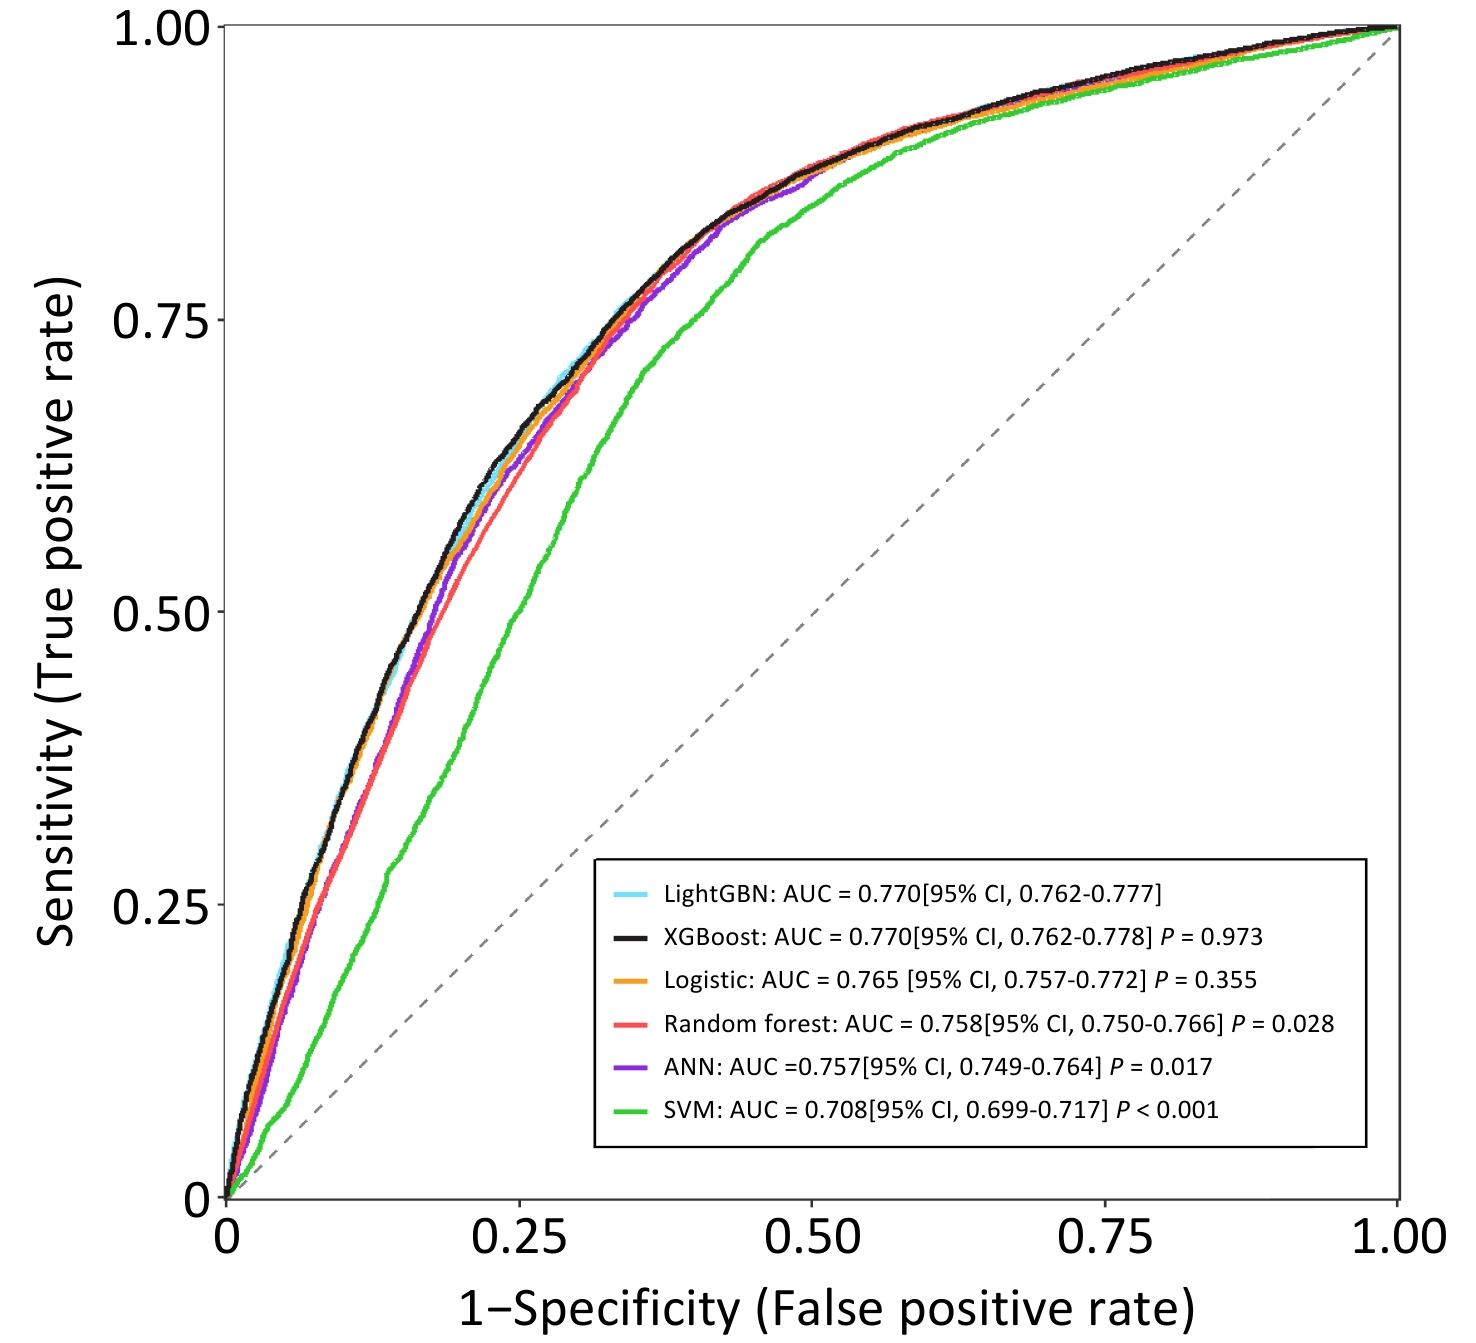
Leveraging these validated prognostic factors (with the exclusion of "year of diagnosis" to ensure the model's contemporary applicability), this study constructed and evaluated several machine learning models to predict the 60-month risk of PLC-specific death. The specific data for the training and test sets are listed in Table 2. The hyperparameter tuning results for each machine learning classifier are presented in Table 3. Among the various classifiers tested, the LightGBM and XGBoost models demonstrated superior predictive performances, achieving an impressive area under the receiver operating characteristic curve (AUC) of 0.770 (95% CI: 0.762-0.777) on the independent test set (Figure 1).
Figure 1. AUC of machine learning classifiers for predicting 60-month PLC-specific mortality on test set (ANN, artificial neural network; SVM, support vector machine; LightGBM, light gradient boosting machine; XGBoost, extreme gradient boosting machine).
The AUC is a measure of the model's ability to correctly distinguish between patients who will experience an event (death from PLC) and those who will not, with a value of 0.770 indicating a good level of discrimination. Given its comparable discrimination, similar calibration (shown in eFigure 2), faster training speed, and lower memory consumption, LightGBM was selected to develop the final prediction tool. Furthermore, the Shapley Additive extension (SHAP) method was applied to assess the impact of each variable on the performance of the LightGBM model, and the detailed results are shown in eFigure 3.
Figure 2. Survival curves for different risk groups in the entire patient cohort.
The optimized LightGBM model was applied to the entire patient cohort for risk stratification. By dividing patients into three distinct groups based on their predicted mortality probability (low, medium, and high risk), the model proved highly effective in separating patient outcomes (Figure 2).
These findings have significant clinical implications. Patients in the high-risk group had a 10.52-fold higher risk of dying from PLC within 60 months than those in the low-risk group. The medium-risk group showed a 3.84-fold increase in the risk. This stratification provides valuable information for clinical practice. For instance, patients identified as low risk might be candidates for more conservative treatment strategies or less intensive surveillance, thereby avoiding the risks and costs of overtreatment. Conversely, patients stratified into the high-risk group should be prioritized for more aggressive therapeutic regimens, closer follow-up, and consideration for enrollment in clinical trials exploring novel treatment options. To illustrate, consider a 60-year-old, married, non-Hispanic White female residing in a metropolitan area with an annual household income of ≤$90,000. She was diagnosed with localized HCC and treated within two months, without surgery, radiotherapy, or chemotherapy. This model calculated her 60-month PLC-specific mortality probability to be 0.5933, placing her in the medium-risk category, which will help guide discussions on the intensity of her future care.
Despite the successful development of the high-performance prediction model, its limitations must be acknowledged. First, the SEER database, while large and comprehensive, lacks granular clinical data such as laboratory test results,[10] performance status, and detailed lifestyle factors. This lack of information may have led to the exclusion of important prognostic variables and introduced a residual confounding bias, potentially affecting the model's predictive accuracy at the individual level. Second, the model was developed and validated using a single, albeit large, population-based registration data set. However, this has not been validated in an external cohort from a different geographical region or healthcare system. Therefore, its generalizability and predictive performance in other patients or populations need to be examined and confirmed. Third, the model was specifically designed to predict the 60-month mortality. Although this is a standard endpoint, clinical scenarios often require prognostication over different time horizons (e.g., 1-year, 3-year, or 10-year survival). Future studies should focus on developing models for different follow-up durations to enhance clinical applicability. Finally, the intentional exclusion of the "year of diagnosis" variable, while aimed at improving the model's relevance to current practice, may have diminished its ability to capture the dynamic impact of recent therapeutic advancements, such as the widespread adoption of targeted therapies and immunotherapy, on PLC prognosis. Future iterations of the model should incorporate time-dependent variables to reflect the real-time impact of medical progress.
In conclusion, this study successfully leveraged the power of a large population-based dataset and advanced machine learning techniques to develop and validate a robust prognostic stratification tool for PLC. By integrating a set of readily accessible demographic and clinical variables, this tool provides an effective method for individualized risk assessment. This offers a novel and practical approach to support a more precise clinical prognosis and facilitate shared decision-making between physicians and patients, with the ultimate goal of improving outcomes for individuals affected by this challenging disease.
A Machine Learning-Based Prognostic Stratification Model for Liver Cancer: Results from Survival Studies Using SEER Database
doi: 10.3967/bes2025.143
- Received Date: 2025-08-01
- Accepted Date: 2025-10-16
None declared.
This study used publicly available de-identified data from the SEER database. According to the policies of the SEER program and relevant ethical guidelines, the use of such data does not require institutional review board (IRB) approval or informed consent.
&These authors contributed equally to this work.
| Citation: | Yuxuan Xiao, Zhuoying Li, Zhuojun Ye, Yu-Xin Zhou, Yixin Zou, Danni Yang, Yuting Tan, Qun Xu, Yongbing Xiang. A Machine Learning-Based Prognostic Stratification Model for Liver Cancer: Results from Survival Studies Using SEER Database[J]. Biomedical and Environmental Sciences. doi: 10.3967/bes2025.143

|

 Quick Links
 DownLoad: