
-
Global population aging has led to an increased prevalence of neurodegenerative dysfunctions/diseases (e.g., cognitive decline and Alzheimer's disease)[1,2], imposing a substantial public health burden worldwide[3,4]. Neurodegenerative diseases are characterized by an extended preclinical stage[5], during which the use of sensitive markers can facilitate the early identification of individuals at a high risk of accelerated brain aging, enabling timely preventive interventions to mitigate disease progression. Brain age derived from neuroimaging data has emerged as a promising approach for assessing brain aging[6]. Brain age gap (BAG), defined as the deviation between the predicted brain age and chronological age (CA), has been shown to be associated with multiple health outcomes (e.g., cognitive decline[7], neurodegenerative diseases,[8] and mortality[9]), as well as their underlying pathological progression[10]. Although magnetic resonance imaging (MRI) remains the predominant approach for evaluating brain aging[11-14], head computed tomography (CT) offers a more accessible and cost-effective alternative, particularly for community health screening. However, few studies have utilized head CT data to evaluate brain aging[15-17].
Accumulating evidence suggests that body composition is associated with brain aging. Previous studies have primarily investigated the associations between several individual body composition indicators, such as body mass index (BMI), fat mass index (FMI), and fat-free mass index (FFMI), and neurological outcomes (e.g., cognitive functions and dementia)[18-20]. For instance, a study in South Korea reported that FMI and the trunk fat mass index (TFMI) showed positive linear correlations with cognitive function in older adults, whereas FFMI did not[20]. However, these conclusions remain controversial and may neglect the combined effects of body composition indicators on brain aging[21,22].
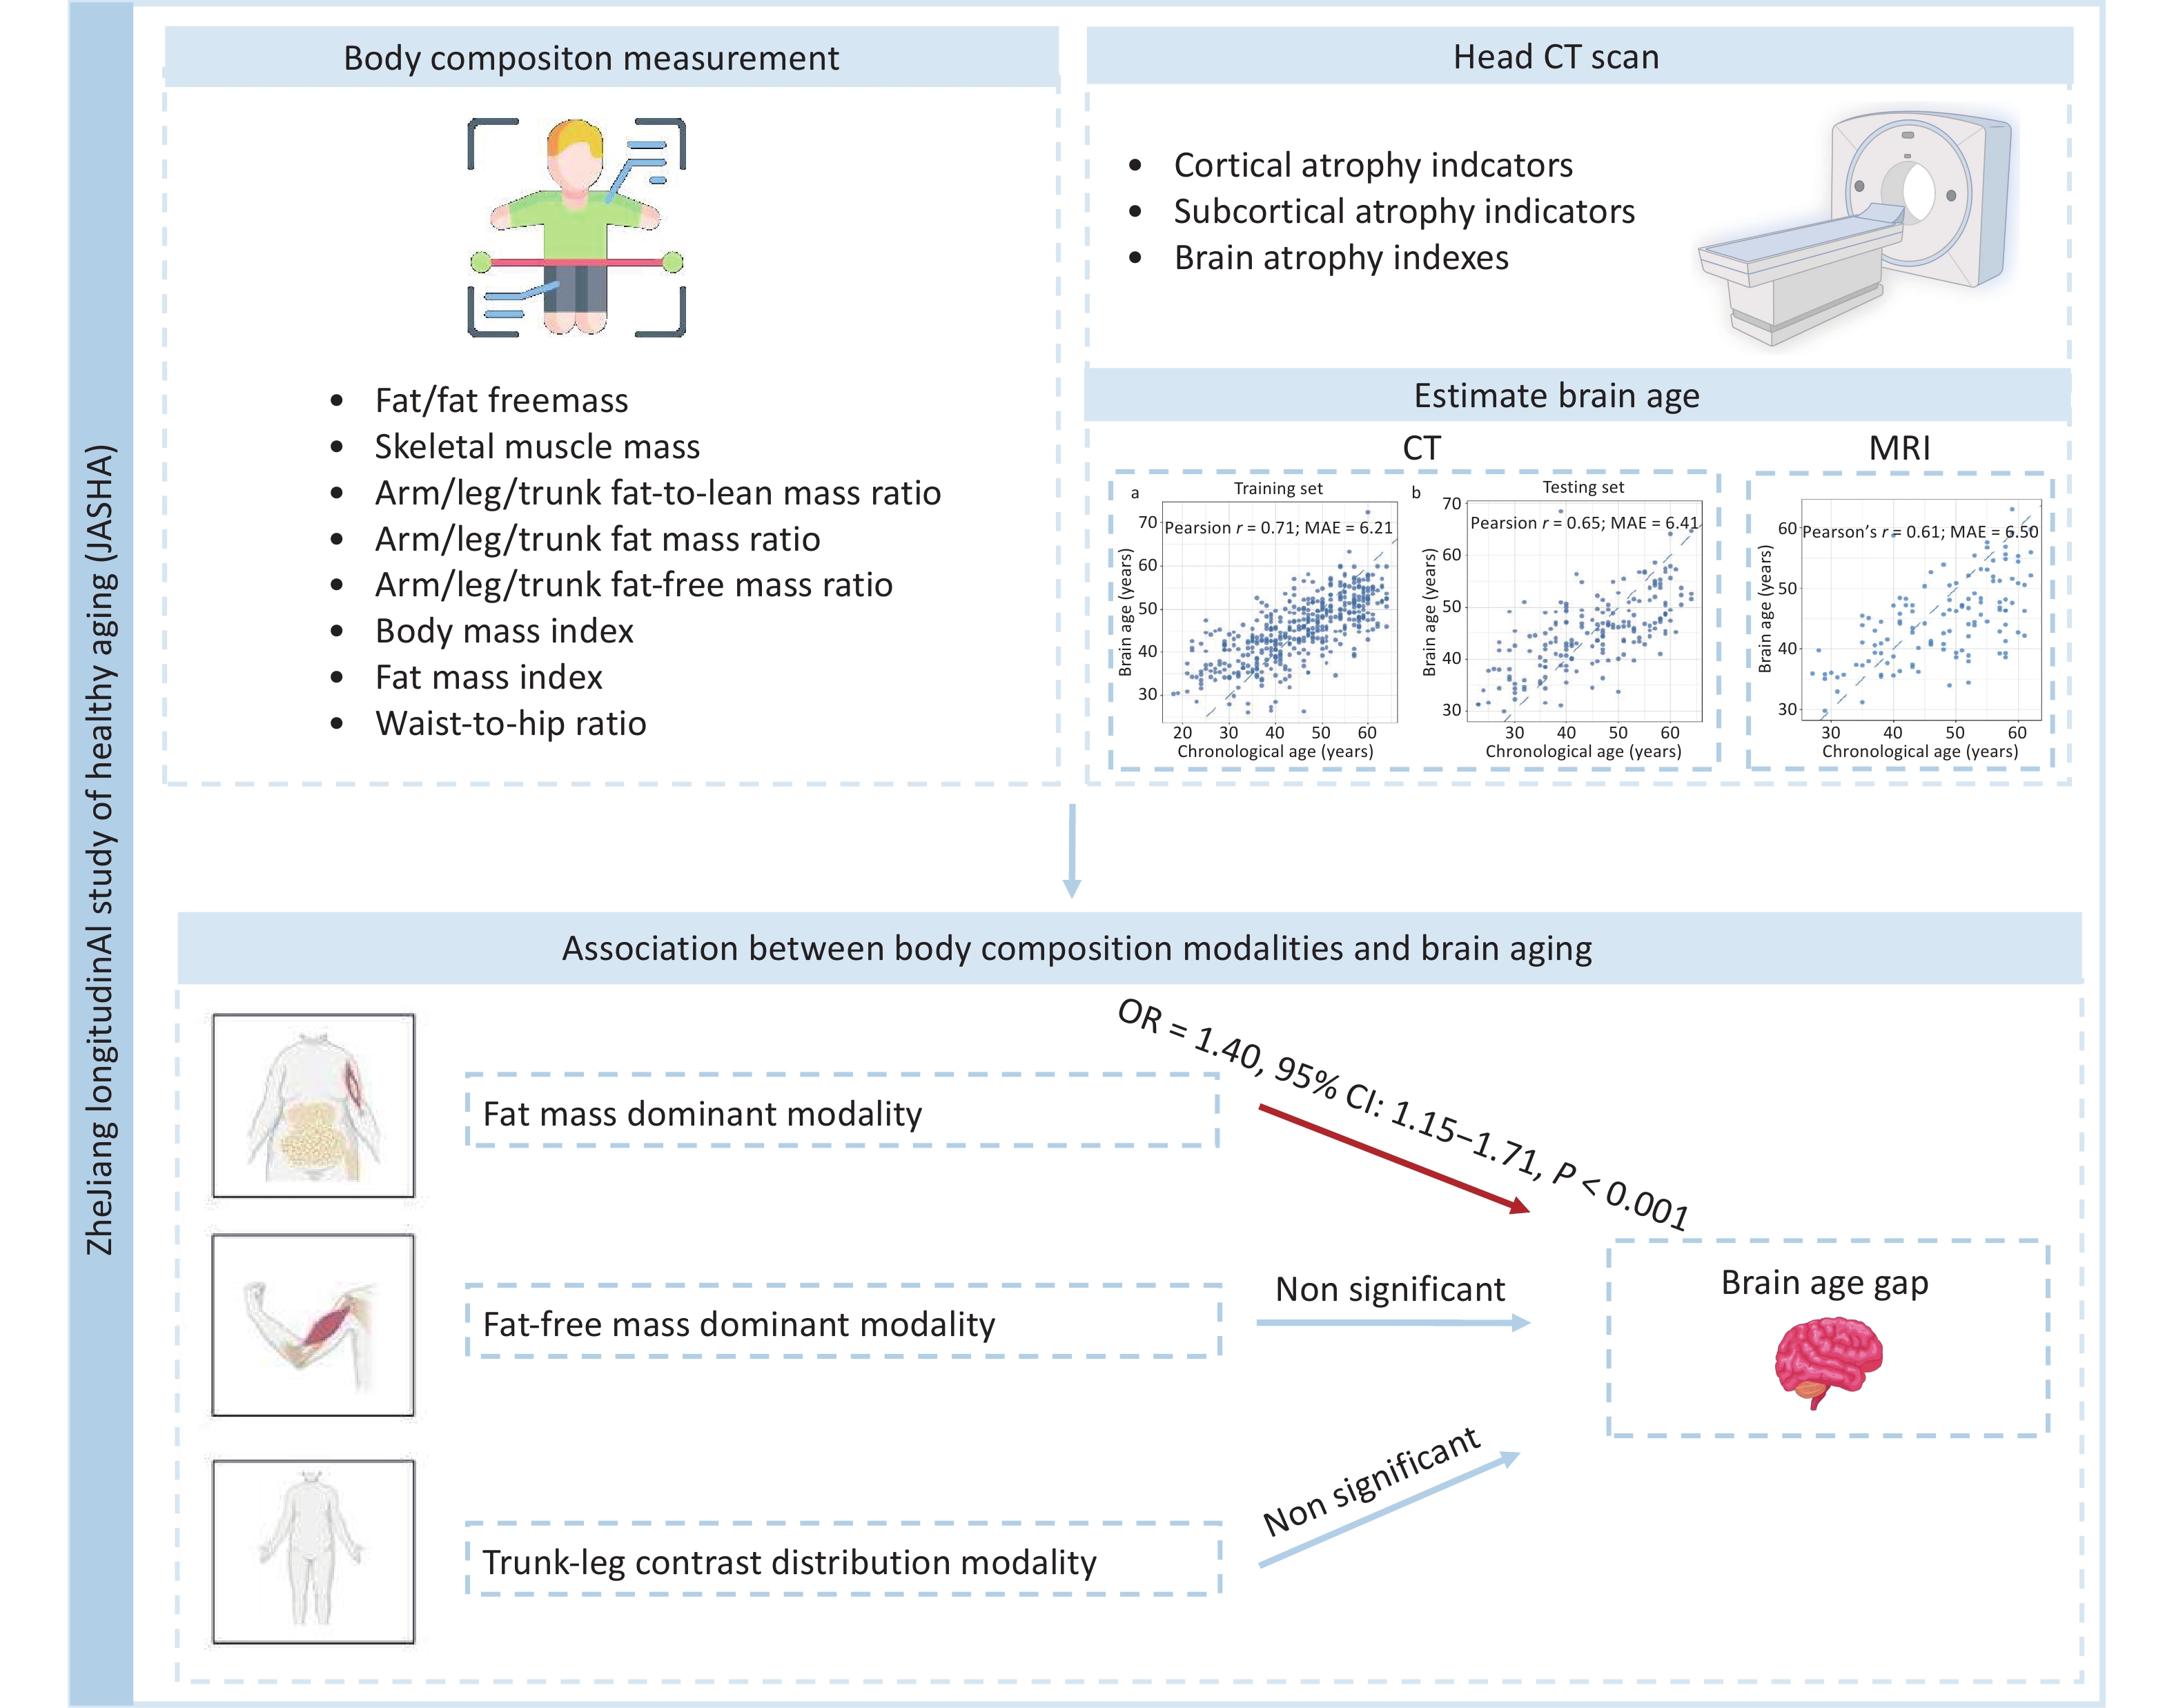
Here, this study utilized unique data from the ZheJiang longitudinAl Study of Healthy Aging (JASHA), an ongoing longitudinal cohort study in Jinhua, Zhejiang Province, China, with the aim to: 1) develop a novel brain age model using head CT data; and 2) examine the associations between body composition modalities and brain aging. Figure 1 illustrates the overview of the study.
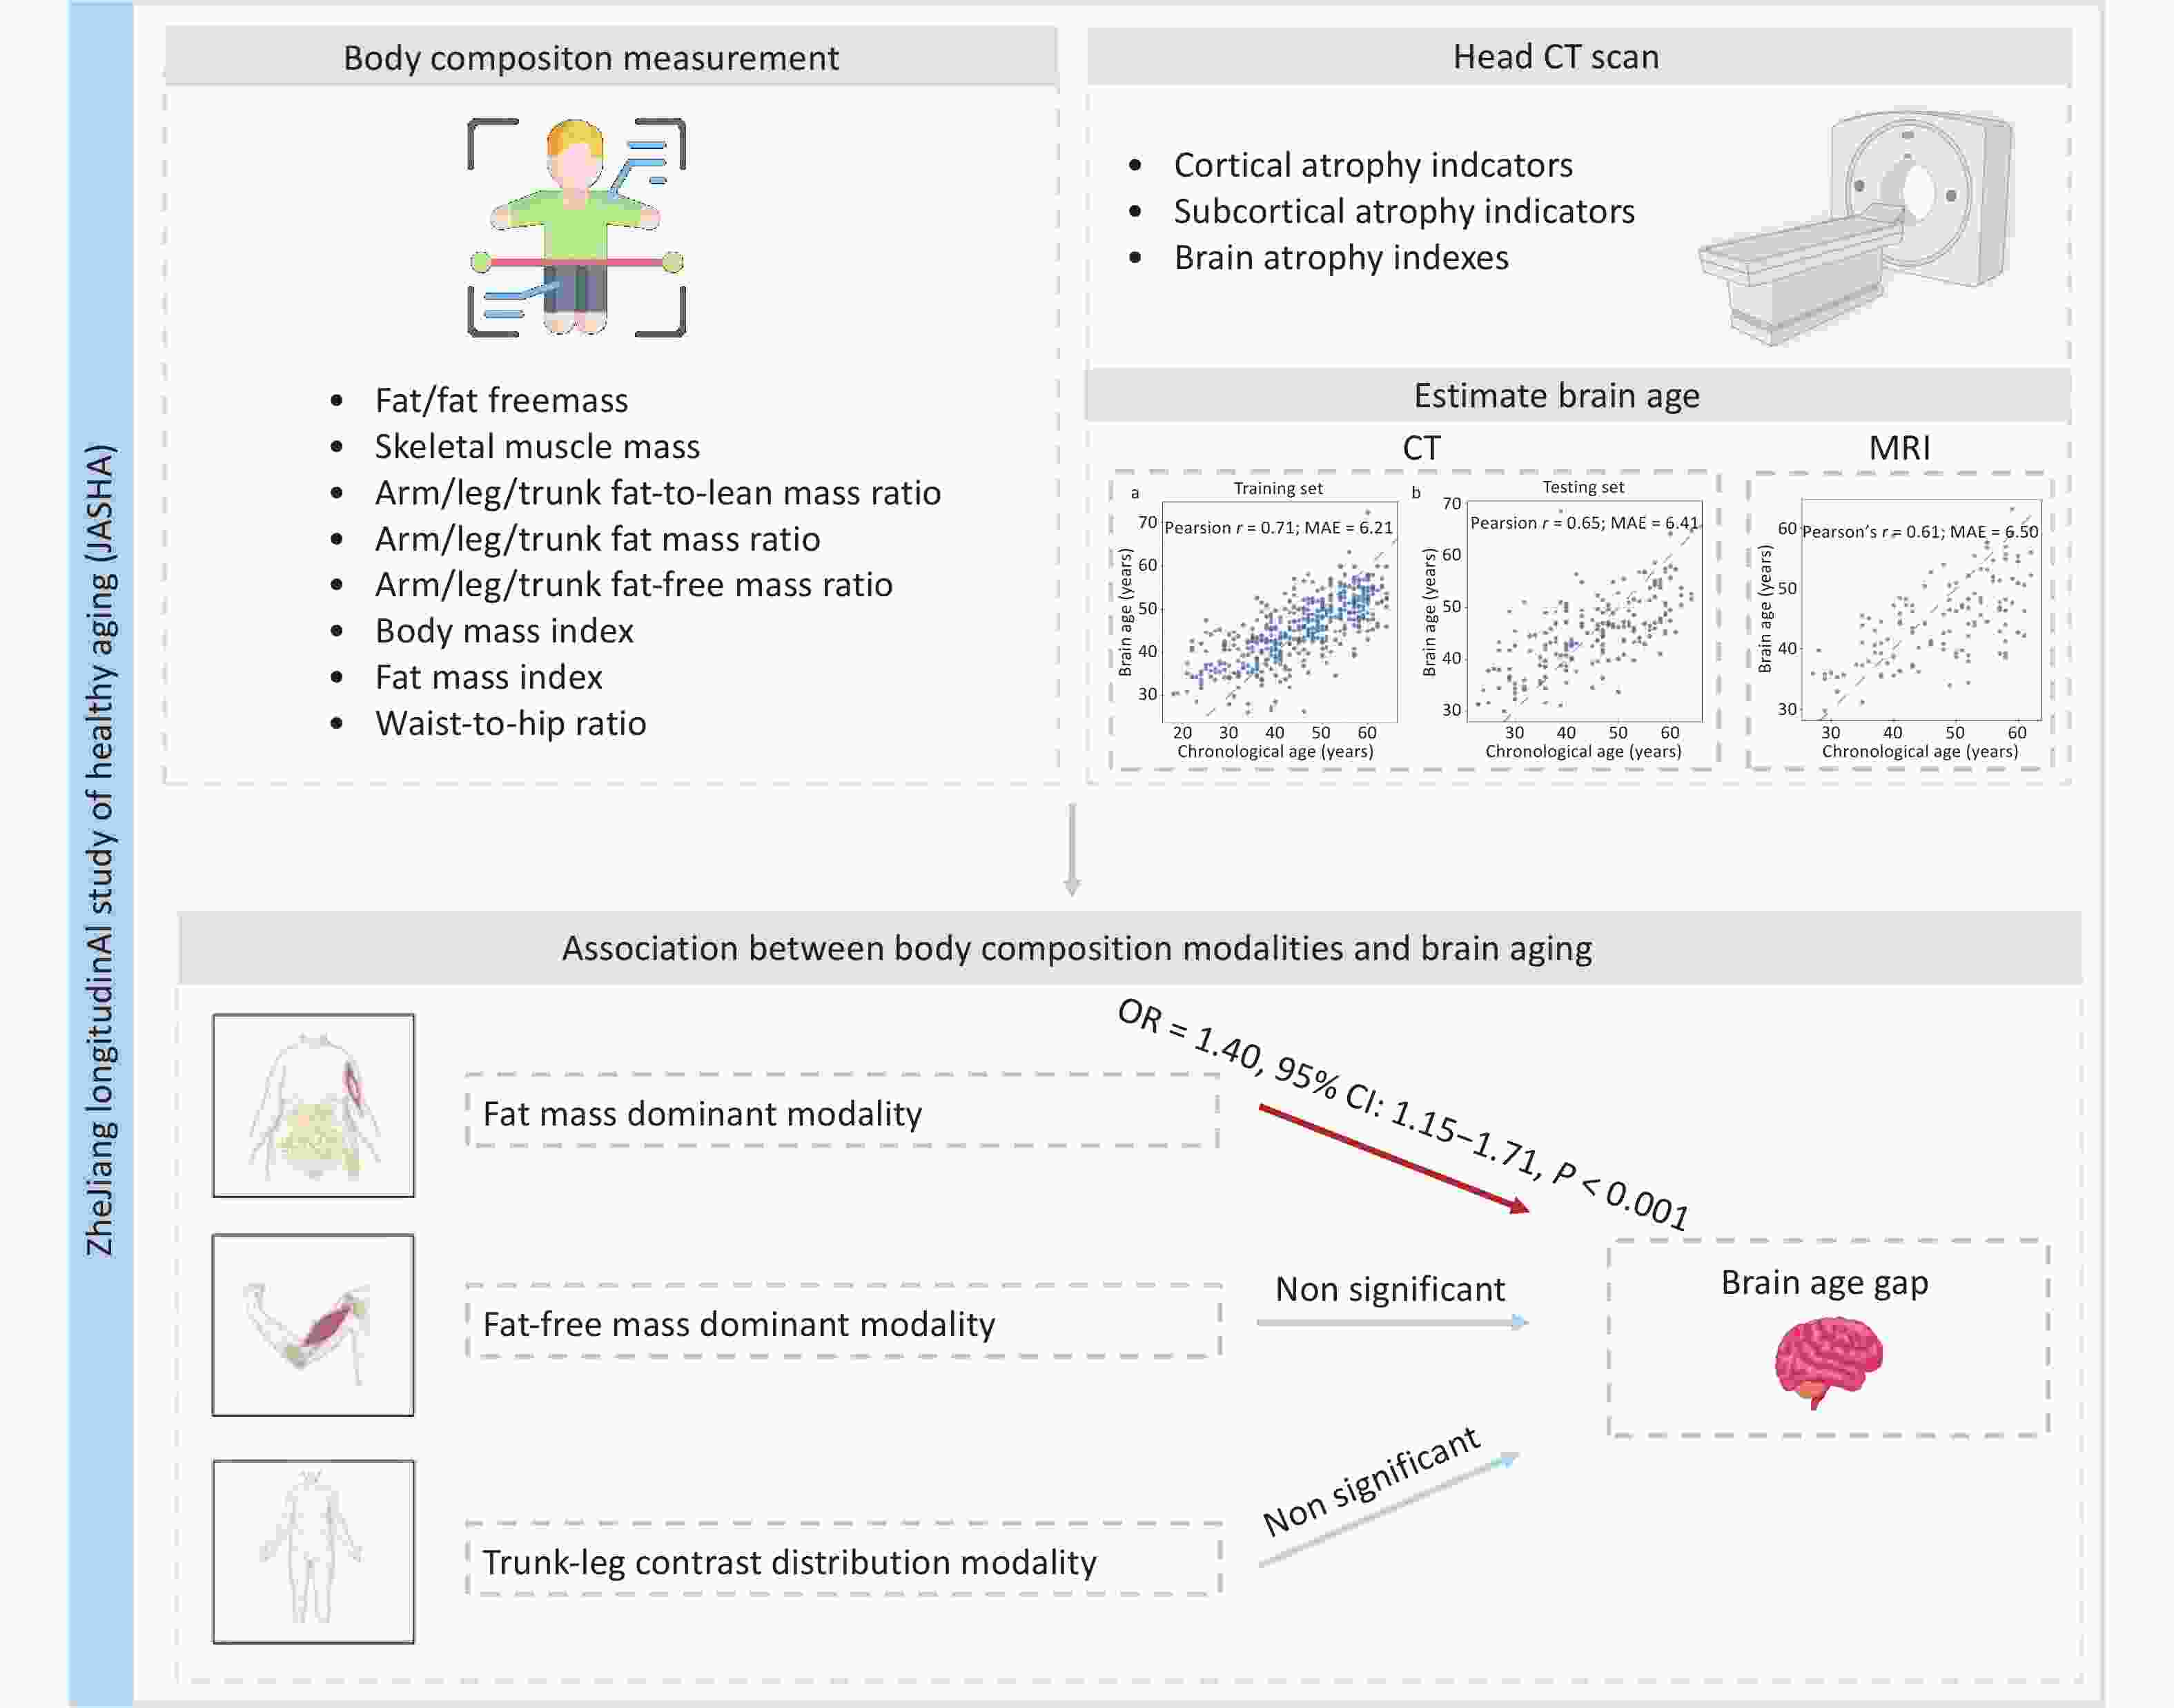
Figure 1. Overview of the study design.
-
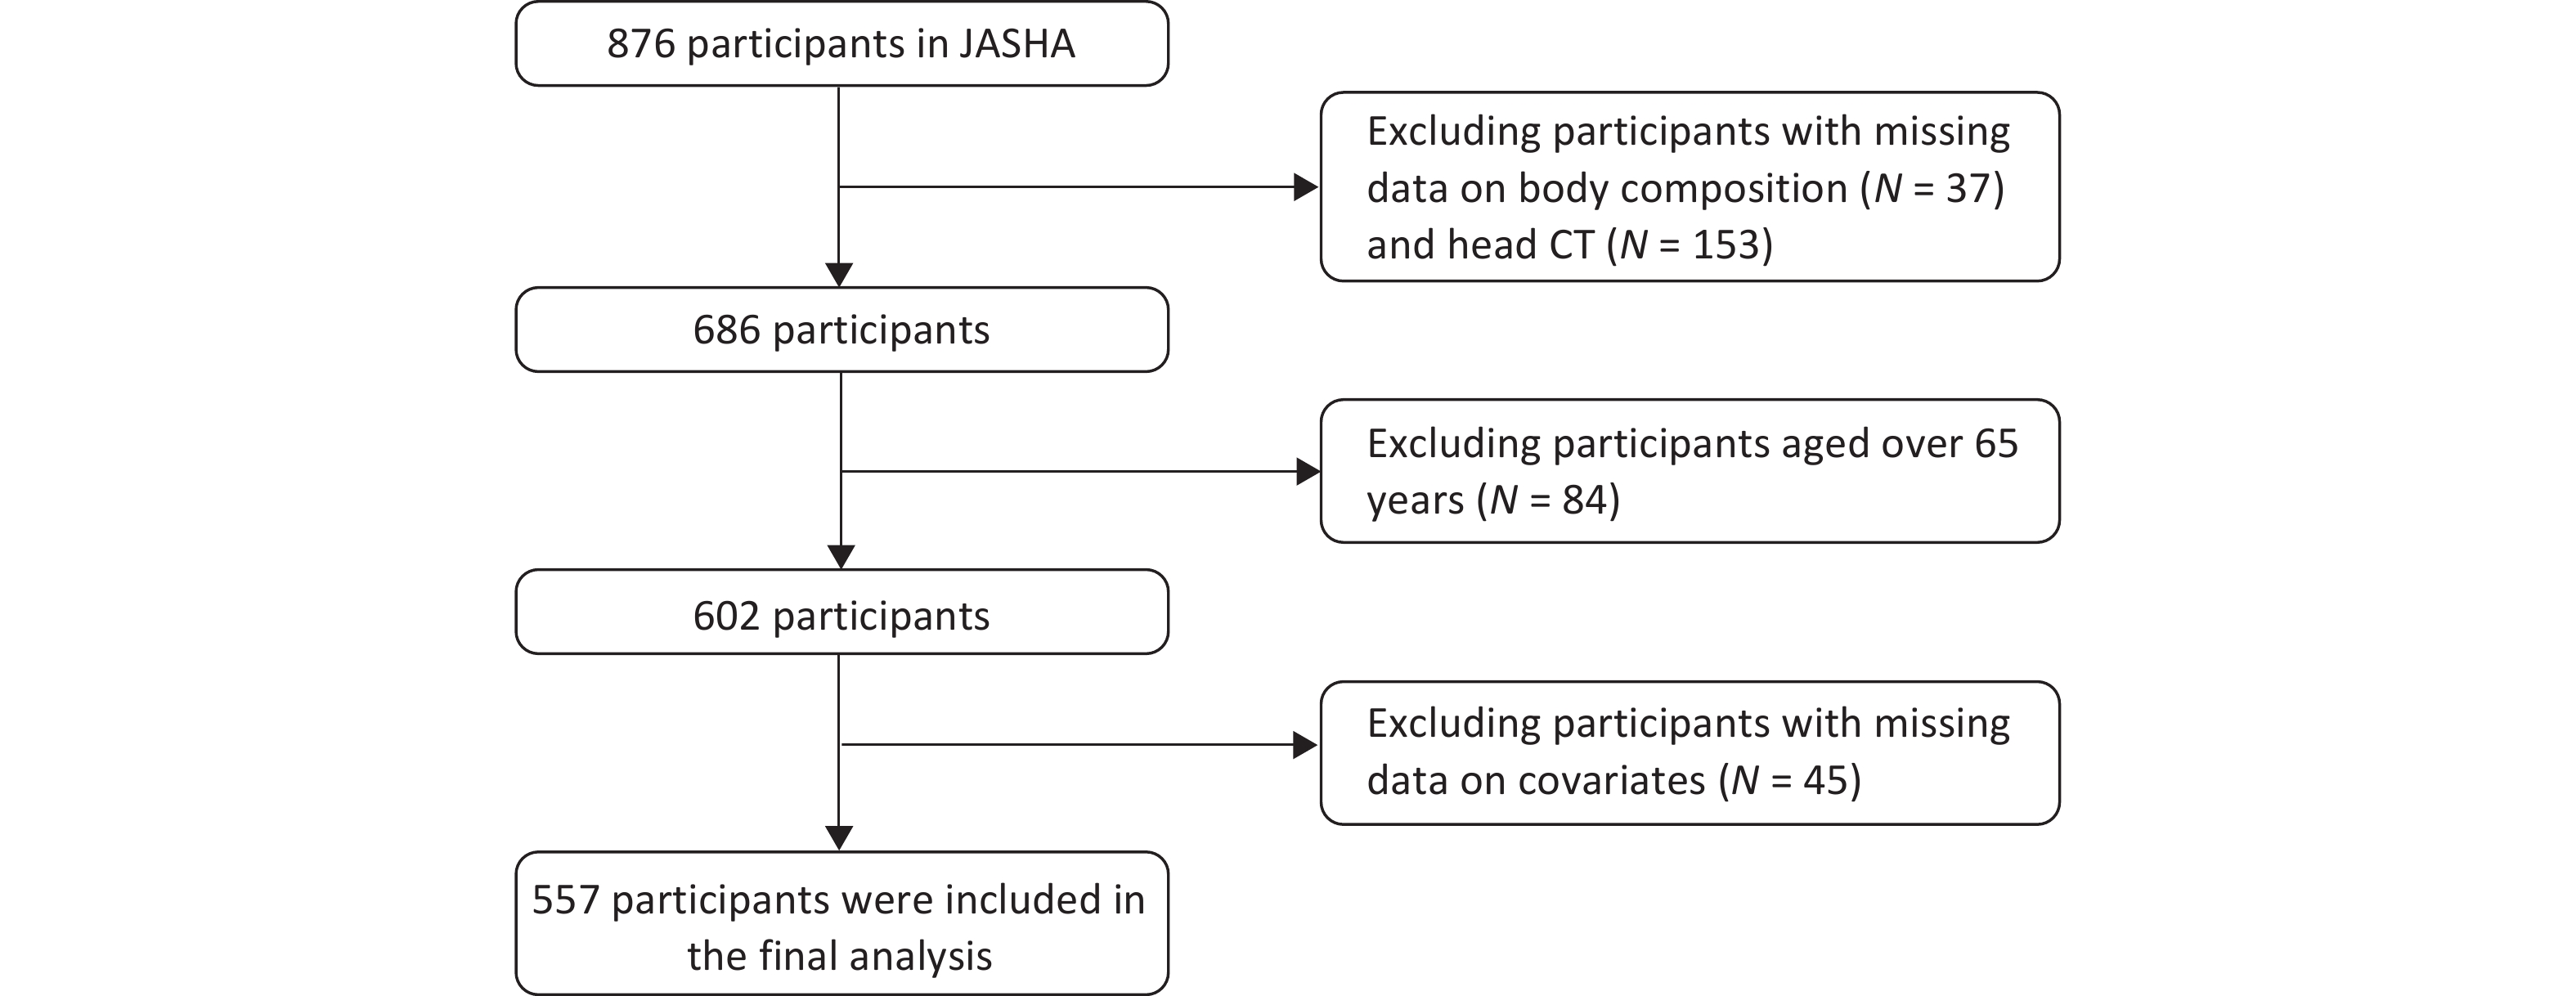
The study population was derived from the JASHA, which recruited 876 adults who completed health screenings between June 2022 and June 2023 at the Medical Examination Center of Dongyang People’s Hospital, Jinhua, Zhejiang Province, China. Comprehensive data on demographic characteristics, medical history, lifestyle factors, and biomedical indicators were collected using standardized questionnaires, physical examinations, and laboratory tests. Participants with missing data on body composition (n = 37), head CT (n = 153), covariates (n = 45), and those aged > 65 years (n = 84) were excluded. Finally, 557 participants were included in the final analysis (Figure 2).

Figure 2. Flow chart of the sample selection in JASHA. JASHA, the ZheJiang longitudinAl Study of Healthy Aging.
-
CT imaging indicators obtained from the Canon Aquilion ONE 320 Slice CT scanner (Canon Medical Systems, Tochigi, Japan) were assessed by experienced neurologists and subsequently classified into three categories: 1) cortical atrophy indicators: maximum width of the frontal horns (A), minimum width of the lateral ventricles (B), width of the third ventricle (C), width of the lateral ventricles (H), the choroid plexuses distance (I), and width of the fourth ventricle (J); 2) subcortical atrophy indicators: width of the longitudinal cerebral fissure in the anterior part (FI), width of the right insular cisterns (ICR), width of the left insular cisterns (ICL), greatest width of the cerebral sulci at the skull vault (SW), and greatest width of the cerebellar fissures (CFW); 3) brain atrophy index: bicaudate index (B/E), bifrontal index (A/D), Evans index (A/F), cella index (C/F), celda media index (G/H), ventricular index (B/A), and Hack number (A+B), following previously described procedures[23,24].
During data preprocessing, outliers—defined as indicator values greater than 1.5 times the interquartile range (IQR) from the first and third quartiles (Q1–1.5 × IQR, Q3 + 1.5 × IQR)—were winsorized to these thresholds. Variables with non-normal distributions were log-transformed and standardized using Z-score normalization. The dataset was split into training (n = 438) and testing (n = 186) sets in a 7:3 ratio to develop a brain age prediction model. The entire model development process was conducted using the training set, which included 10-fold cross-validation to select the optimal regularization parameter (λ = 1.65) for the ridge regression model and to estimate the final feature coefficients. The final model included 24 CT imaging indicators (Supplementary Table S1). The predictive performance of the model was evaluated on the testing set using Pearson’s correlation coefficient (r) and mean absolute error (MAE). To further validate the model, we used MRI data from JASHA (n = 123) to replicate the brain age prediction model following the same formula mentioned above. After confirming the generalizability, the final model was applied to the entire cohort to calculate the brain age of each participant. BAG was defined as the residual obtained from a least-squares linear regression of the predicted brain age on CA, subsequently categorized into two BAG groups: brain age acceleration (BAG > 0) and deceleration (BAG < 0) groups.
-
Body composition indicators were measured using an InBody 770 bioelectrical impedance analyzer (InBody Co., Ltd., Seoul, South Korea). This analysis included 27 body composition indicators across three domains: 1) absolute mass indicators: fat mass (FM), fat-free mass (FFM), skeletal muscle mass, and weight; 2) regional distribution indicators: arm/leg/trunk fat-to-lean mass ratios, arm/leg/trunk fat mass ratios and arm/leg/trunk fat-free mass ratios; and 3) derived indicators: BMI (weight/height2), FMI (body fat mass [BFM]/height2), and waist-to-hip ratio (WHR; waist circumference/hip circumference). Detailed information on these indicators and their distributions in JASHA is provided in Supplementary Table S2, and their covariance structures are shown in Supplementary Figure S1.
-
The following covariates were included in the analysis: 1) sociodemographic factors: age, sex marital status (currently married or unmarried), educational attainment (up to primary school, middle school, and college or above), occupation (technology, management, and others), and monthly household income (< 10,000 RMB or ≥ 10,000 RMB); 2) lifestyle factors: smoking and drinking statuses (never, former, and current), and physical activity levels categorized as low, middle, or high according to exercise intensity and Metabolic Equivalent of Task (MET) derived from the International Physical Activity Questionnaire (IPAQ)[25]; and 3) disease histories: including hypertension, diabetes, hyperlipidemia, stroke, and psychological disorders.
-
Basic characteristics of the participants in total and by BAG groups are described as median with IQR for continuous variables and as number with percentage for categorical variables. Differences in variable distributions were examined using the Mann-Whitney U test and the chi-squared (χ2) test for continuous and categorical variables, respectively.
-
Body composition modalities, which represent latent combinations of the relative contributions of different body components, were identified using principal component analysis (PCA). In this study, all 27 body composition indicators were standardized using the Z-score transformation. Indicators exhibiting extremely high correlations (r > 0.99) were excluded to reduce multicollinearity (n = 5), and 22 indicators were retained for subsequent analysis. The Kaiser-Meyer-Olkin measure (KMO = 0.71) and Bartlett’s test of sphericity (P < 0.001) confirmed the suitability of the data set for PCA. We applied varimax rotation to enhance component interpretability and retained significant principal components (PCs) based on both the scree plot inflection point and conventional eigenvalue threshold (> 1). The resulting PC scores, calculated as weighted linear combinations of standardized indicators, quantified participants’ exposure to each body composition modality.
-
Logistic regression models were used to examine the associations between body composition modalities and BAG groups. Three models were implemented: Model 1 was adjusted for age and sex; Model 2 was further adjusted for marital status, smoking and drinking status, educational attainment, occupation, monthly household income, and physical activity based on Model 1; and Model 3 was further adjusted for disease history based on Model 2. Odds ratios (ORs) and 95% confidence intervals (CIs) were calculated. In additional analyses, a fully adjusted model was applied to investigate the associations between body composition modalities and BAG as a continuous variable using multiple linear regression, and between the 27 individual body composition indicators and BAG groups using logistic regression.
Several sensitivity analyses were conducted to ensure robustness of the results. First, we further adjusted for cognitive function (i.e., Montreal Cognitive Assessment [MoCA] score) based on Model 3. Second, we excluded participants with a history of disease (n = 258) and repeated the main analyses.
We performed a subgroup analysis by stratifying the participants into younger and older groups based on a median age of 46.0 years. Associations between the body composition modalities and BAG groups were examined separately within each subgroup, and an interaction test was performed by adding a multiplicative term for age group and body composition modality to the main model.
All statistical analyses were performed using R (version 4.4.2), with two-sided P-values < 0.05 considered statistically significant.
-
This study included 557 participants (52.4% male) with a median age of 46.0 years (IQR: 38.0‒54.0). No significant differences in socioeconomic, lifestyle, or disease factors were observed between the different BAG groups (Table 1).
Characteristics Total (n = 557) Brain age gap groups P Brain age deceleration (n = 283) Brain age acceleration (n = 274) Age, years, median (IQR), years 46.0 (38.0–54.0) 46.0 (37.0–55.0) 46.0 (38.0–54.0) 0.894 Sex, n (%) 0.654 Male 292.0 (52.4) 151.0 (53.4) 141.0 (51.5) Female 265.0 (47.6) 132.0 (46.6) 133.0 (48.5) Marital status, n (%) 0.883 Unmarried 58.0 (10.4) 30.0 (10.6) 28.0 (10.2) Currently married 499.0 (89.6) 253.0 (89.4) 246.0 (89.8) Drinking status, n (%) 0.773 Never 217.0 (39.0) 112.0 (39.6) 105.0 (38.3) Former 10.0 (1.8) 4.0 (1.4) 6.0 (2.2) Current 330.0 (59.2) 167.0 (59.0) 163.0 (59.5) Smoking status, n (%) 0.995 Never 405.0 (72.7) 206.0 (72.8) 199.0 (72.6) Former 116.0 (20.8) 59.0 (20.8) 57.0 (20.8) Current 36.0 (6.5) 18.0 (6.4) 18.0 (6.6) Educational attainment, n (%) 0.406 Up to primary school 37.0 (6.6) 16.0 (5.7) 21.0 (7.7) Middle school 233.0 (41.8) 125.0 (44.2) 108.0 (39.4) College or above 287.0 (51.5) 142.0 (50.2) 145.0 (52.9) Occupation, n (%) 0.688 Technology 99.0 (17.8) 50.0 (17.7) 49.0 (17.9) Management 116.0 (20.8) 55.0 (19.4) 61.0 (22.3) Others 342.0 (61.4) 178.0 (62.9) 164.0 (59.9) Monthly household income, n (%) 0.477 < 10,000 RMB 161.0 (28.9) 78.0 (27.6) 83.0 (30.3) ≥ 10,000 RMB 396.0 (71.1) 205.0 (72.4) 191.0 (69.7) Physical activity, n (%) 0.790 Low 72.0 (12.9) 36.0 (12.7) 36.0 (13.1) Middle 284.0 (51.0) 141.0 (49.8) 143.0 (52.2) High 201.0 (36.1) 106.0 (37.5) 95.0 (34.7) Diabetes, n (%) 0.491 No 529.0 (95.0) 267.0 (94.3) 262.0 (95.6) Yes 28.0 (5.0) 16.0 (5.7) 12.0 (4.4) Hypertension, n (%) 0.417 No 283.0 (50.8) 139.0 (49.1) 144.0 (52.6) Yes 274.0 (49.2) 144.0 (50.9) 130.0 (47.4) Hyperlipidemia, n (%) 0.368 No 544.0 (97.7) 278.0 (98.2) 266.0 (97.1) Yes 13.0 (2.3) 5.0 (1.8) 8.0 (2.9) Heart disease, n (%) 0.576 No 534.0 (95.9) 270.0 (95.4) 264.0 (96.4) Yes 23.0 (4.1) 13.0 (4.6) 10.0 (3.6) Stroke, n (%) 0.624 No 553.0 (99.3) 280.0 (98.9) 273.0 (99.6) Yes 4.0 (0.7) 3.0 (1.1) 1.0 (0.4) Psychological disorders, n (%) 0.624 No 553.0 (99.3) 280.0 (98.9) 273.0 (99.6) Yes 4.0 (0.7) 3.0 (1.1) 1.0 (0.4) Note. Continuous and categorical variables were described as median (interquartile range, IQR) and number (percentage). The differences in variable distributions were examined using the Mann-Whitney U test and the Chi-squared (χ²) test for continuous and categorical variables, respectively. Table 1. Basic characteristics of the participants in JASHA
-
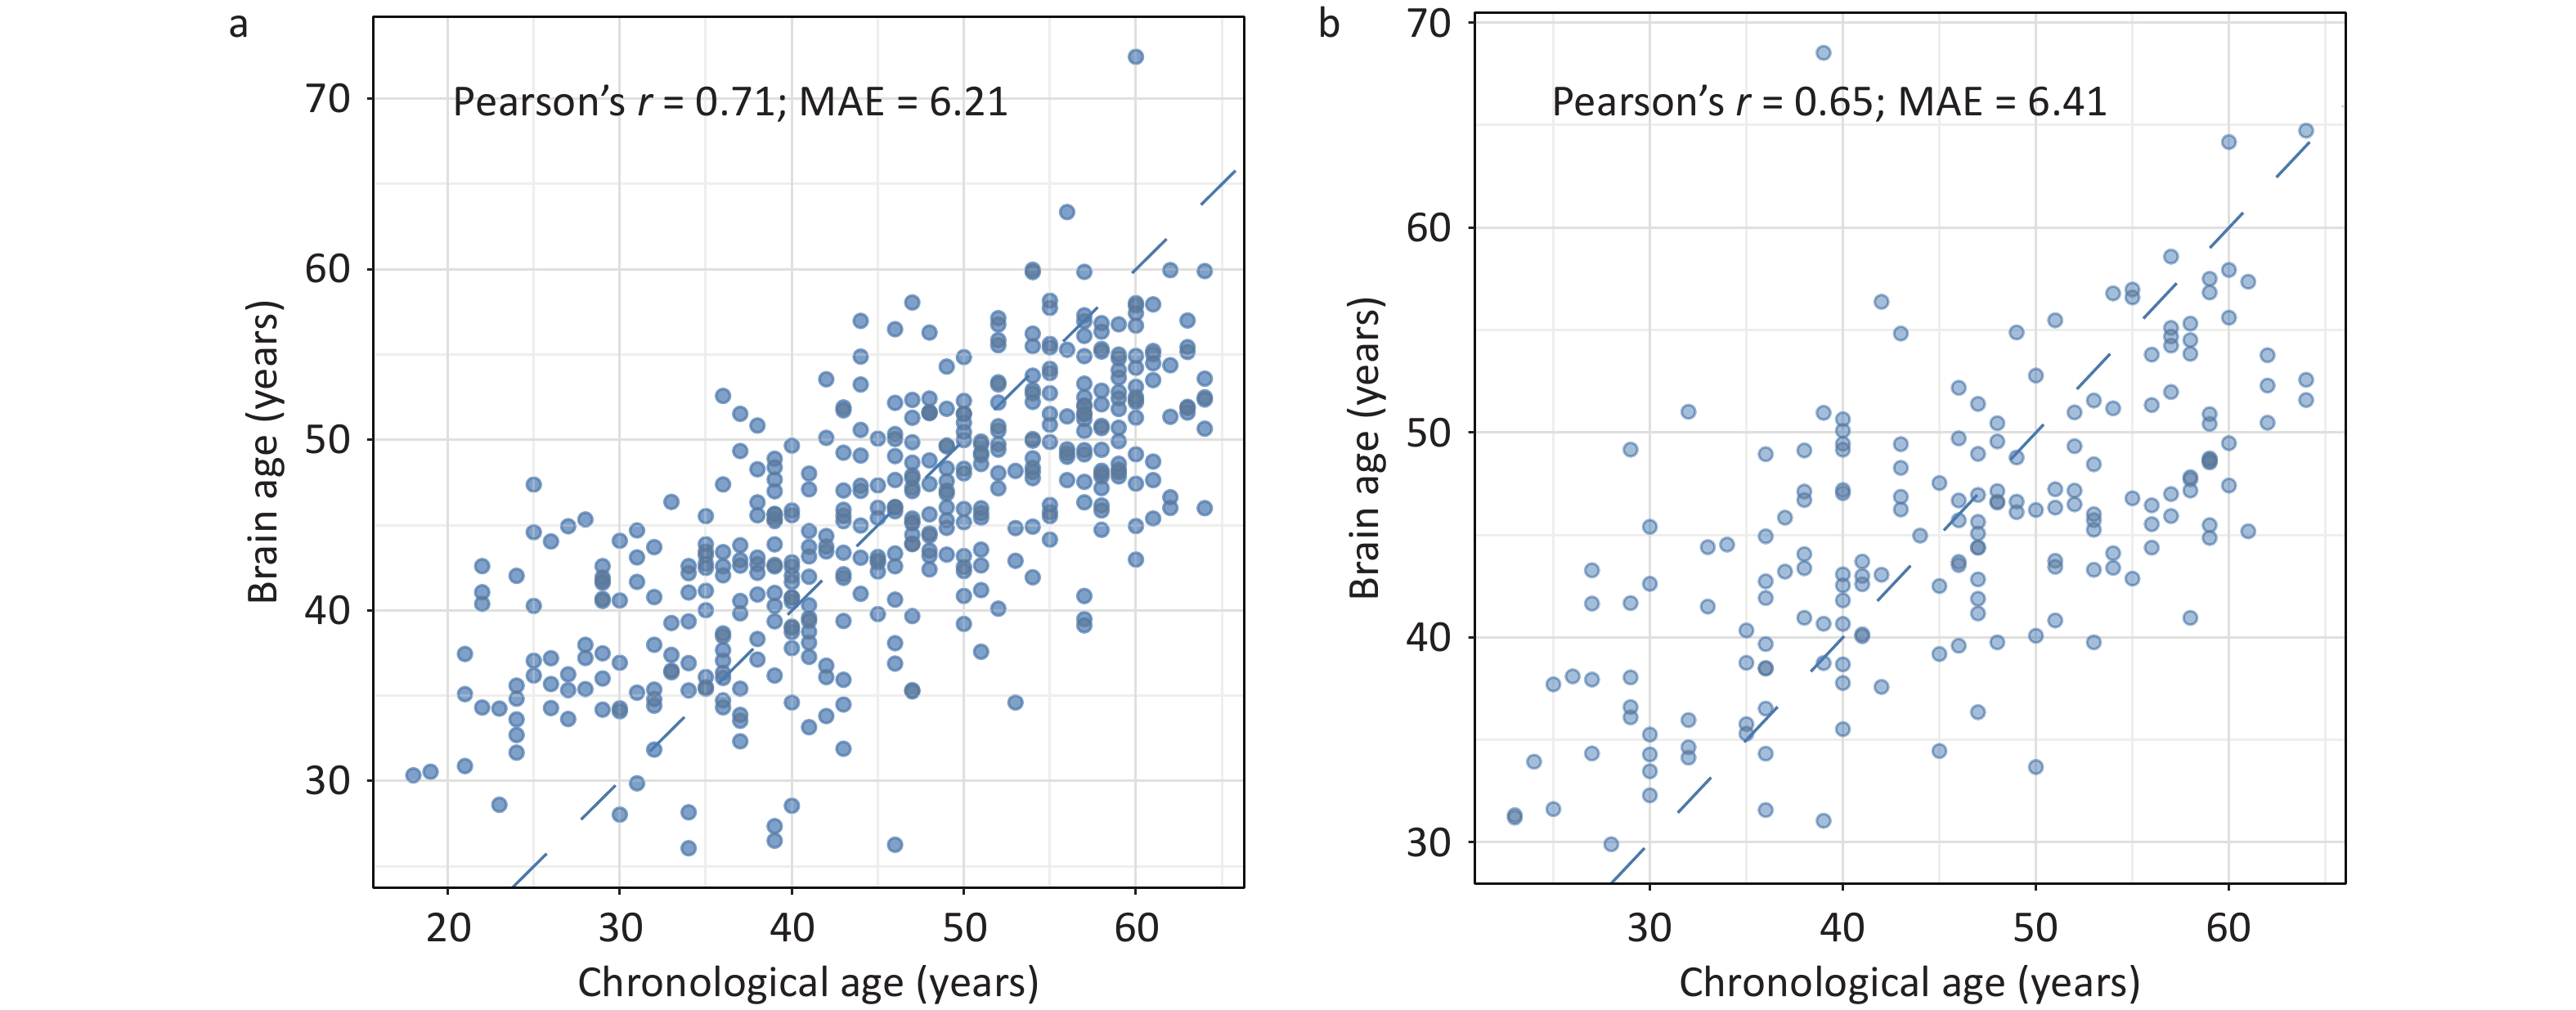
As shown in Figure 3, the predicted brain age showed a significant positive correlation with CA in both the training (r = 0.71) and testing (r = 0.65) sets. In the testing set, the MAE between the predicted brain age and the CA was 6.41 years. Further validation using MRI data from the same cohort corroborated the robustness of the model for predicting CA (r = 0.61, MAE = 6.50 years; Supplementary Figure S2).
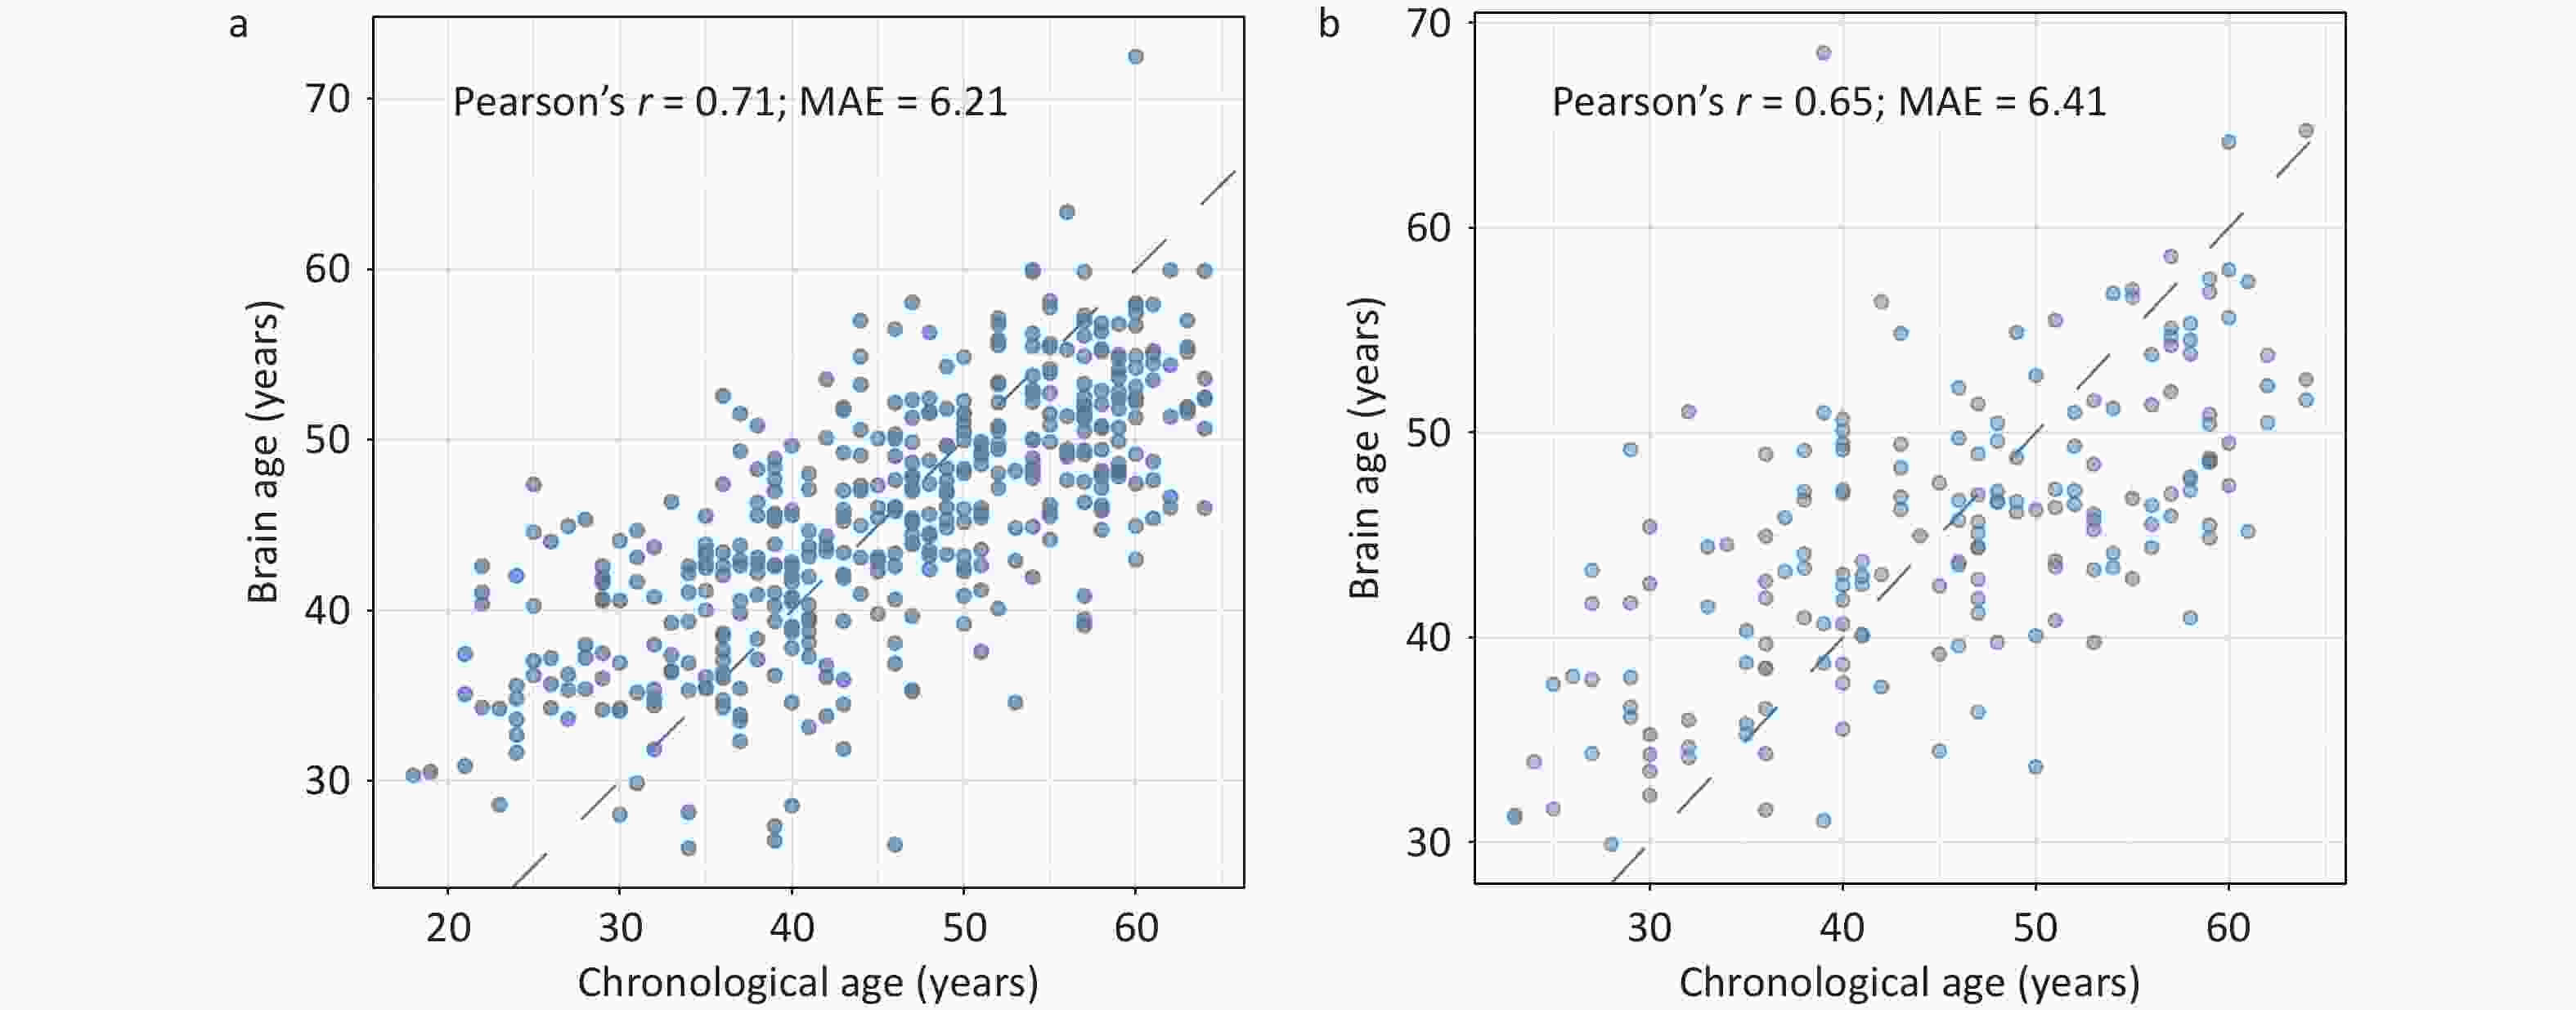
Figure 3. Predictive performance of the brain age model in the training (A) and testing (B) sets in JASHA. MAE, mean absolute error; JASHA, the ZheJiang longitudinAl Study of Healthy Aging.
Three body composition modalities were identified, collectively explaining 91.9% of total variance. Each body composition modality was labeled according to the leading contributing variables, identified by their top loading coefficients: 1) fat mass dominant modality (PC1, explaining 52.1% of the total variance): characterized by high positive loading coefficients from VFL, FMI, BFM, and arm/leg/trunk fat-to-lean mass ratios, reflecting distributions of the whole-body fat and the fat-to-lean mass ratios across various body regions; 2) fat-free mass dominant modality (PC2, explaining 30.9% of the total variance): characterized by high positive loading coefficients from FFM, skeletal muscle index and weight. This modality reflects a greater muscle mass and overall body size, which may indicate better physical fitness or muscularity; and 3) trunk-leg contrast distribution modality (PC3, explaining 8.9% of the total variance) exhibited opposite loading coefficients between the trunk (positive) and leg (negative) for fat mass ratios and fat-free mass ratios. The positive loading coefficient of WHR in this modality also reflects upper-body obesity. This modality exhibited a compensatory body composition distribution (Figure 4).
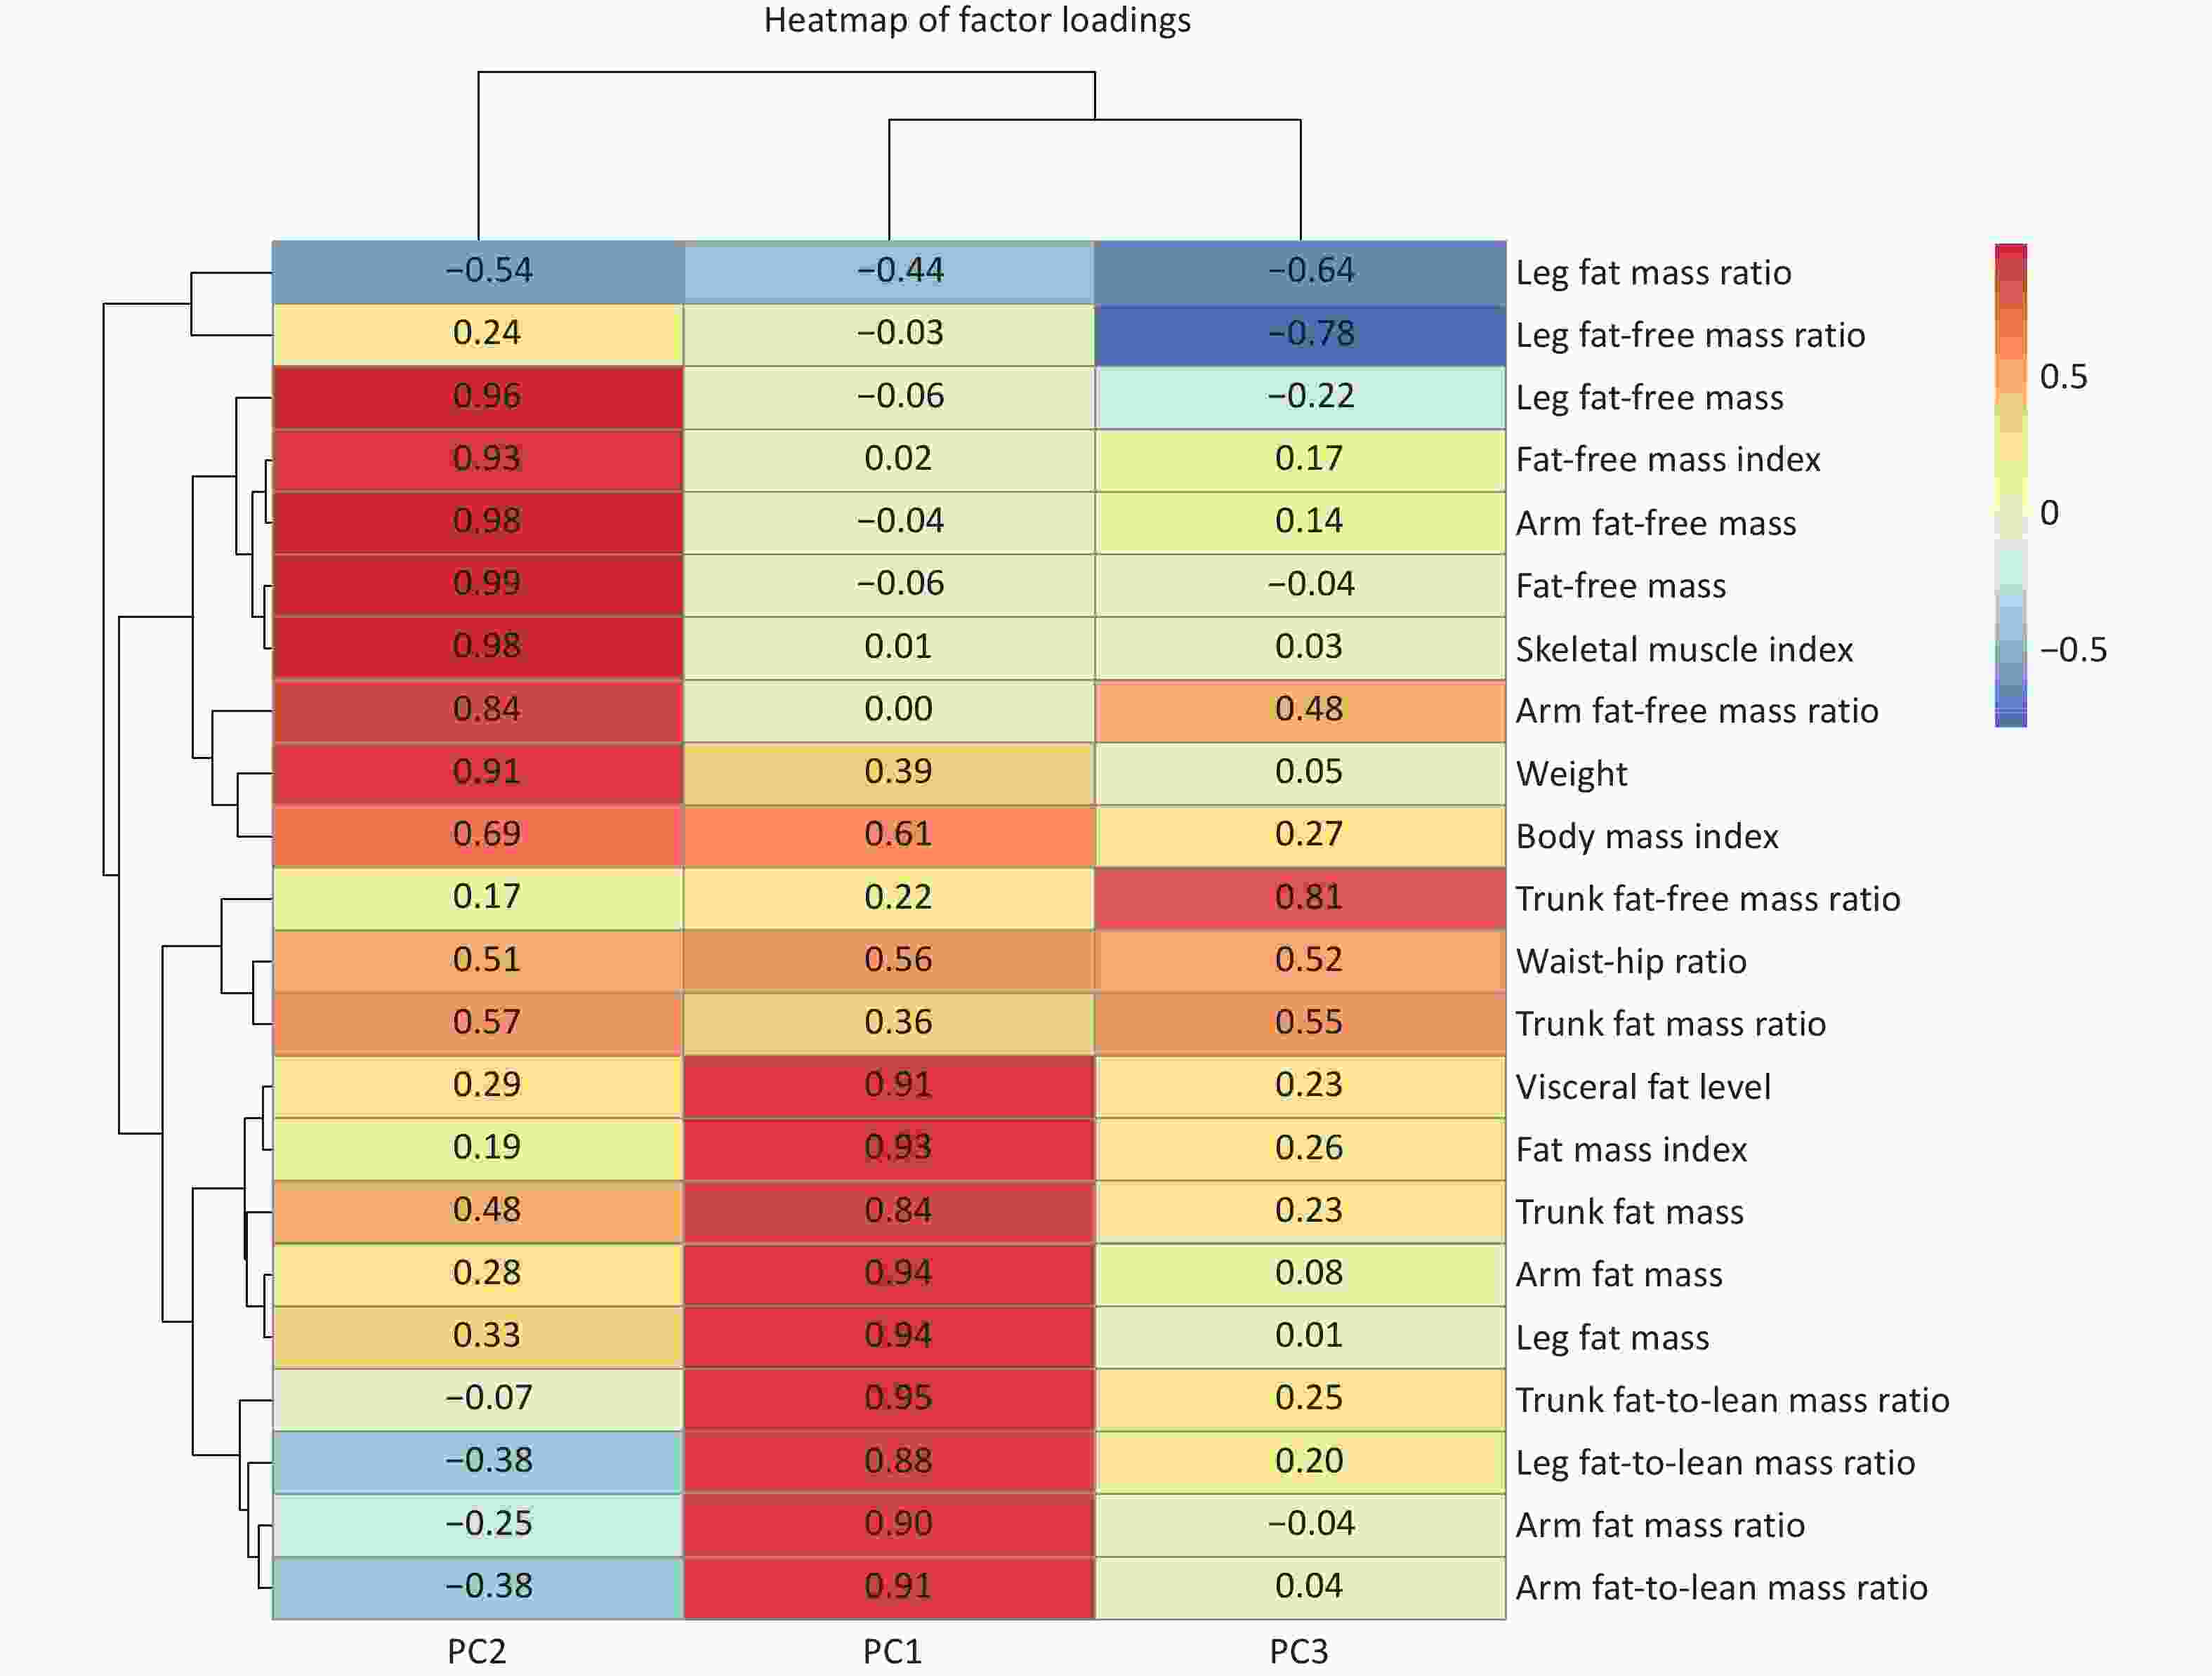
Figure 4. Heatmap of factor loadings from principal component analysis (PCA) with Varimax rotation. The heatmap displays the loading coefficients of body composition indicators on the first three principal components. Red indicates positive loadings and blue indicates negative loadings. The color intensity corresponds to the magnitude of the loadings (darker shades indicating stronger associations). Detailed information and covariance structure of the body composition indicators are shown in Supplementary Table S2 and Supplementary Figure S1.
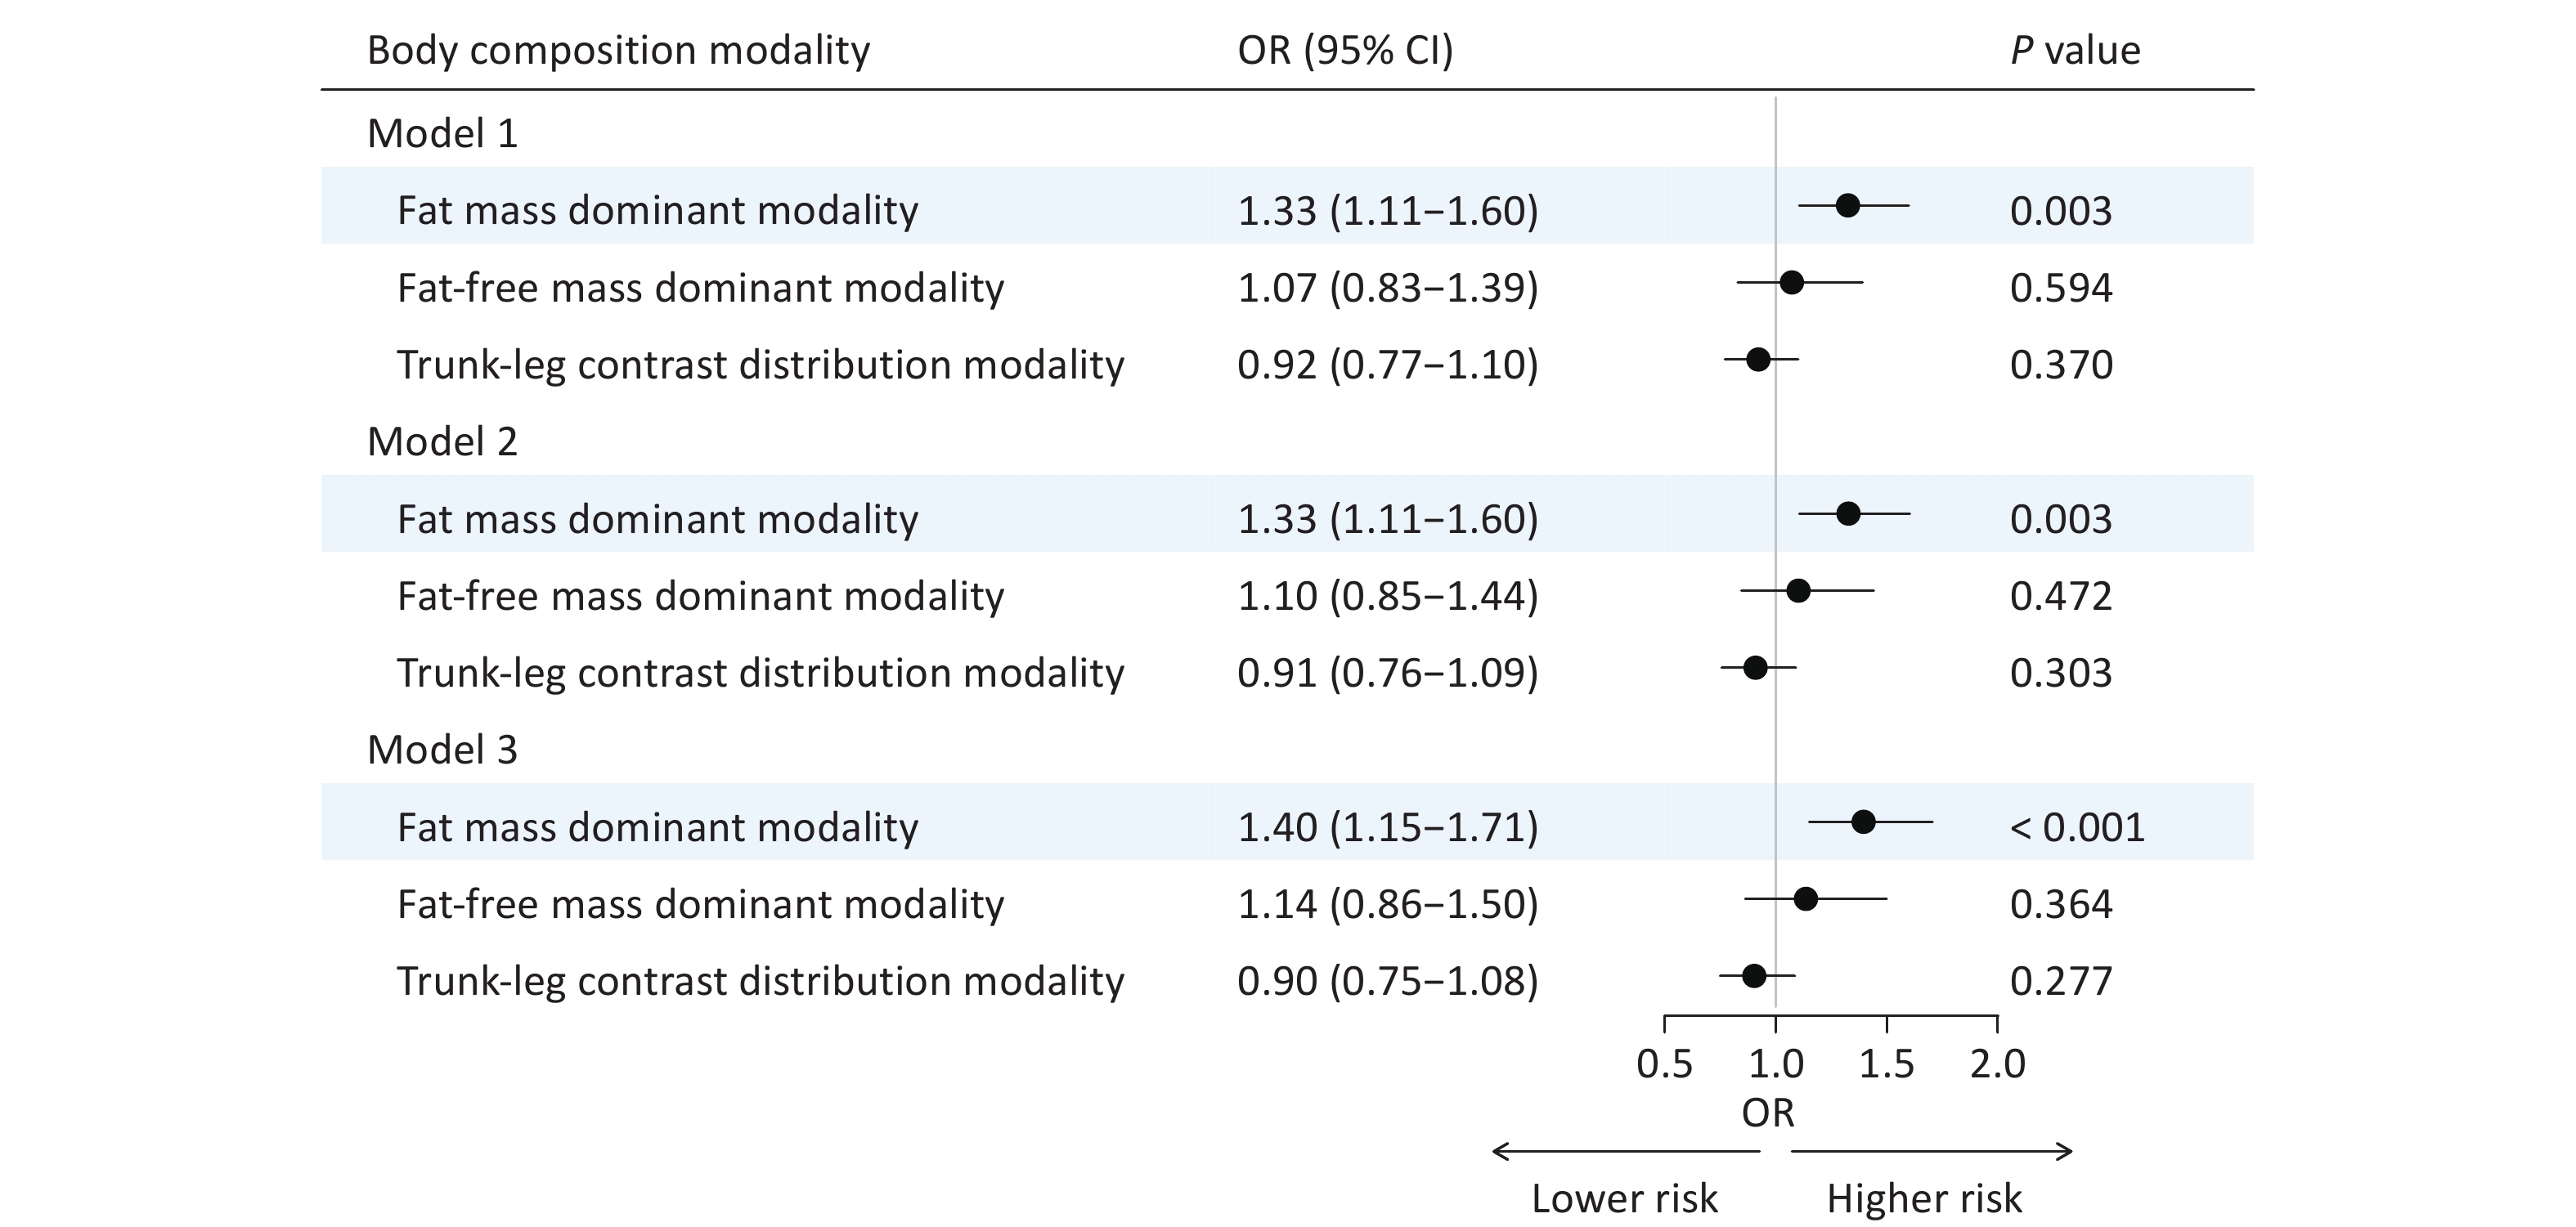
In Model 1, the fat mass dominant modality showed a significant positive association with brain age acceleration (OR = 1.33, 95% CI: 1.11‒1.60, P = 0.003). This positive association remained robust after adjusting for additional covariates in Model 2 (OR = 1.33, 95% CI: 1.11‒1.60, P = 0.003) and Model 3 (OR = 1.40, 95% CI: 1.15‒1.71, P < 0.001). In contrast, the fat-free mass dominant modality and trunk-leg contrast distribution modality demonstrated no significant associations (Figure 5).
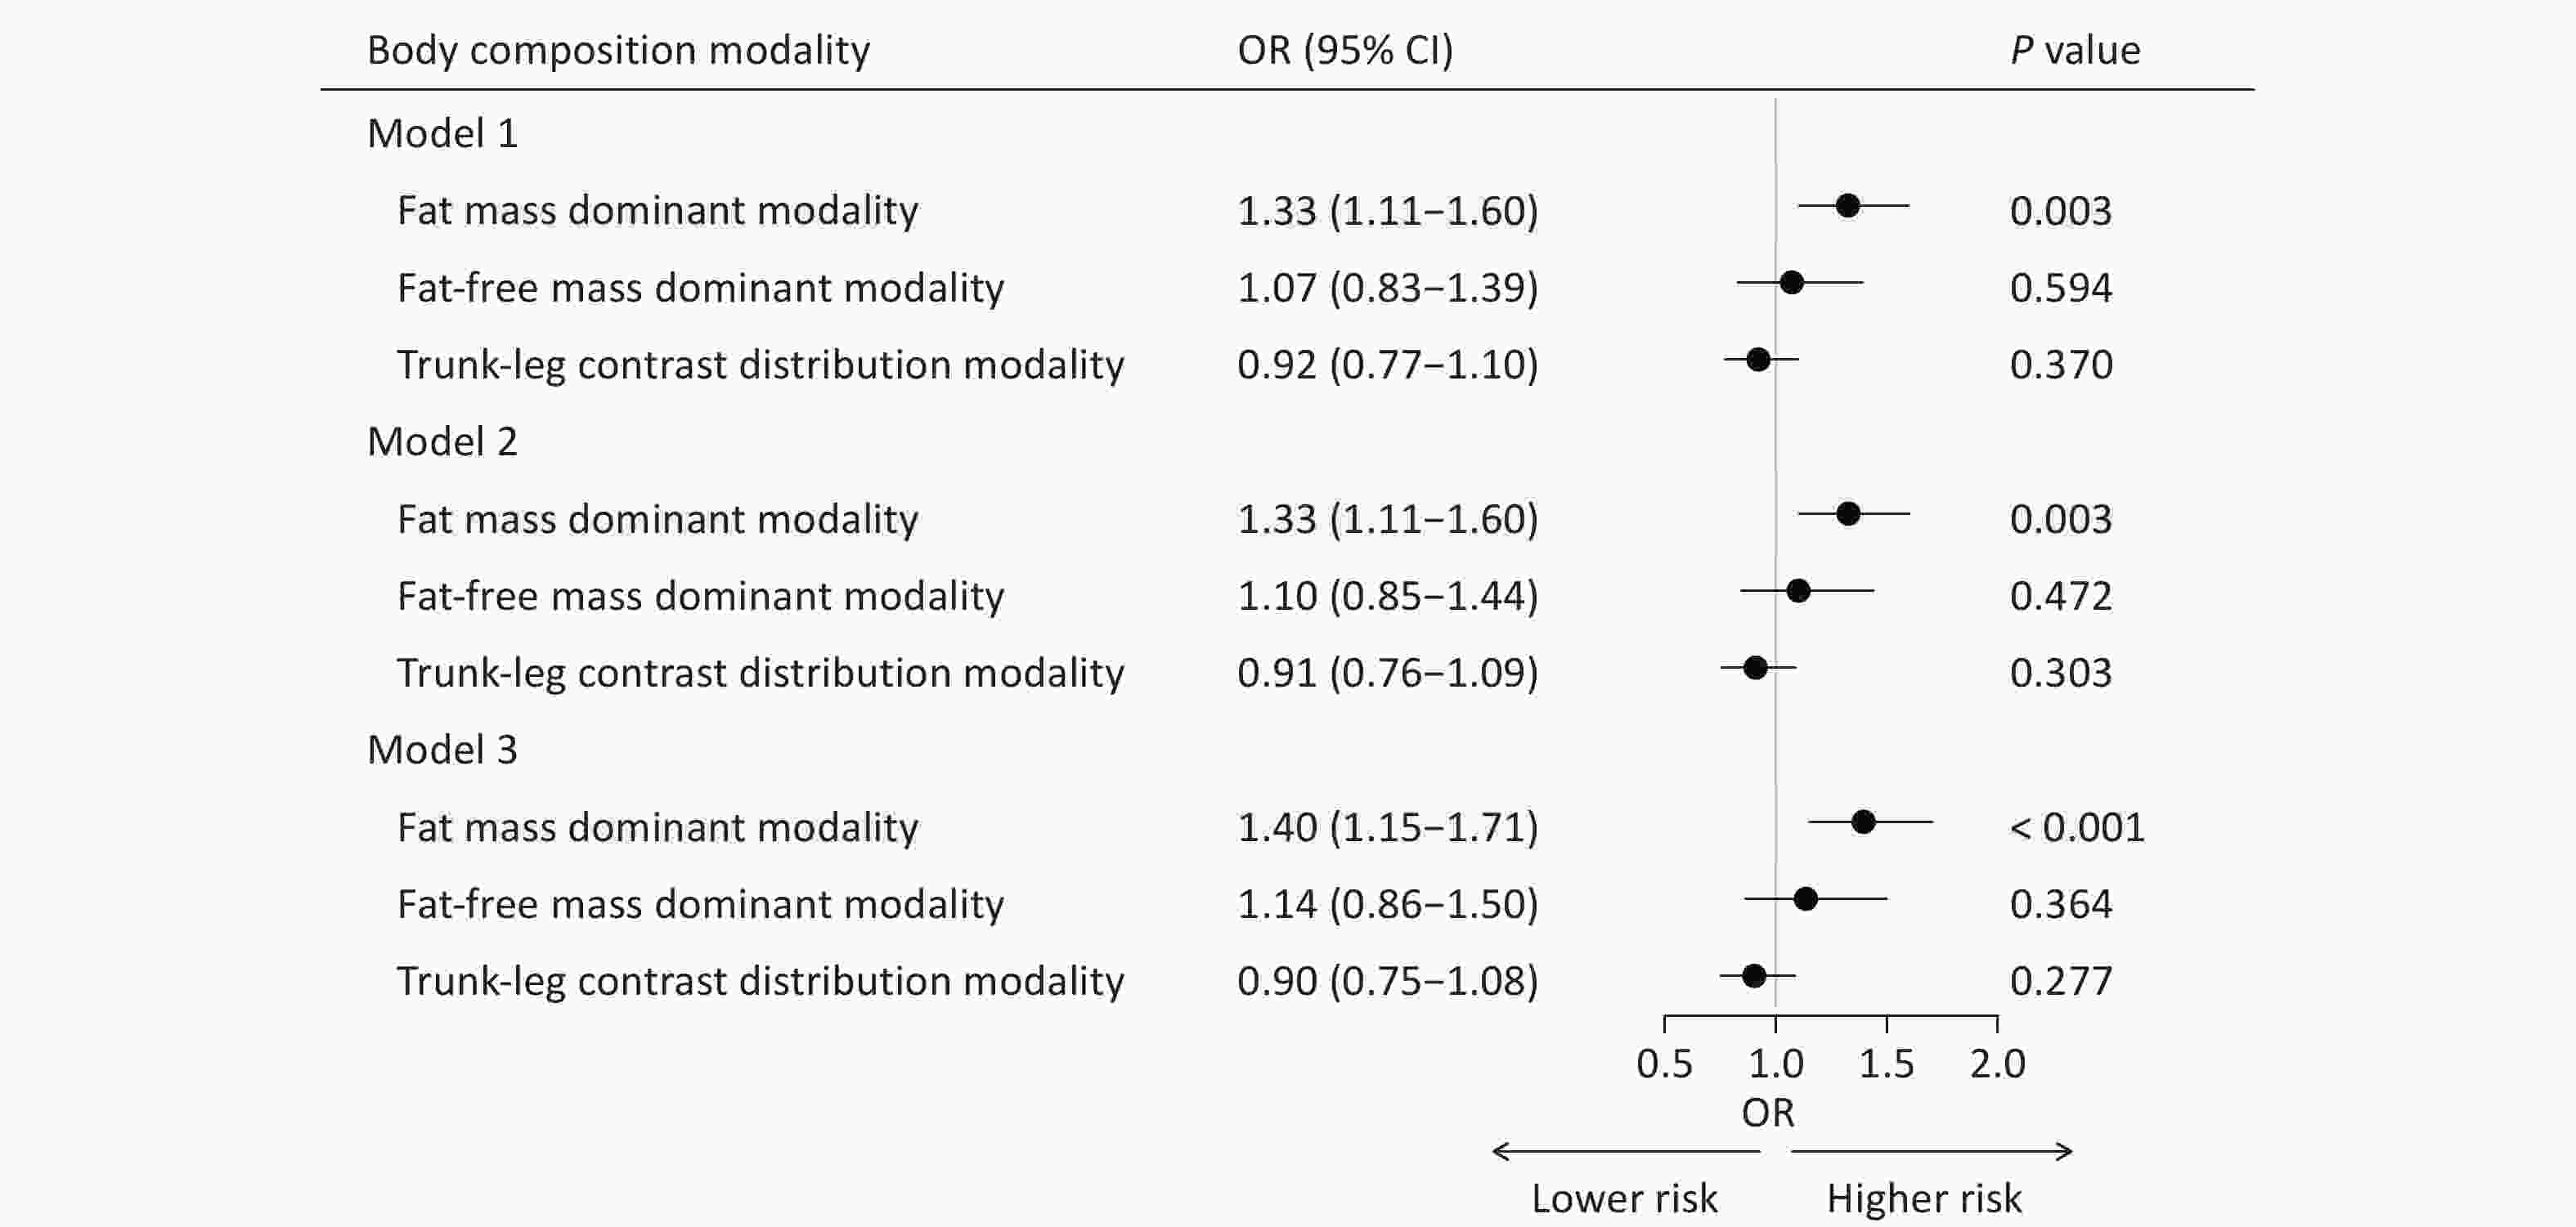
Figure 5. Associations between body composition modalities and brain age gap groups. Model 1, adjusted for sex and age; Model 2, further adjusted for marital status, smoking and alcohol statuses, occupation, educational attainment, monthly household income, and physical activity based on Model 1; Model 3, further adjusted for disease histories of diabetes, hypertension, hyperlipidemia, stroke, and psychological disorders based on Model 2. OR, odds ratio; CI, confidence interval.
This finding was corroborated when BAG was treated as a continuous variable, with the fat mass dominant modality showing a significant positive association with a larger BAG (β = 0.53, P = 0.032) in the fully adjusted model (Supplementary Figure S3). Furthermore, individual body composition indicators related to FM were significantly associated with brain age acceleration, whereas indicators related to FFM showed no significant association (Supplementary Figure S4). In the sensitivity analyses, the associations between the fat mass dominant modality and brain age acceleration remained robust after further adjusting for cognitive function (i.e., MoCA score) and excluding those with a history of diabetes, hypertension, hyperlipidemia, stroke, and psychological disorders (Supplementary Figure S5). Finally, in the subgroup analysis stratified by the median age, the positive association between the fat mass dominant modality and brain age acceleration was observed in both younger (OR = 1.46, 95% CI: 1.12‒1.94) and older (OR = 1.41, 95% CI: 1.03‒1.95) groups. The interaction test indicated no significant effect of age group (P for interaction = 0.557) (Supplementary Figure S6).
-
By leveraging deep body composition and neuroimaging data from JASHA, this study revealed that the fat mass dominant modality was significantly associated with brain age acceleration, mapping the linkage of multidimensional body composition modalities and brain aging. These findings offer a promising avenue for integrating deep body composition indicators into clinical settings and community health screenings to enable the precise assessment of brain aging and targeted prevention of neurological diseases by implementing lifestyle interventions.
To our knowledge, this is the first study to examine the associations between body composition modalities—which capture the combined effects of multiple body composition indicators—and brain aging. Although no previous studies have directly examined these specific associations, the association between individual body composition indicators and brain dysfunctions/diseases has been explored. For example, a higher BMI has been associated with accelerated cognitive decline and increased dementia risk[18,26]; a higher FMI has been individually associated with cognitive impairment[27]. Moreover, our additional analysis demonstrated that only fat mass-related indicators (e.g., FMI, BFM) were significantly associated with brain age acceleration. These findings provide indirect support for the observed positive association between the fat mass-dominant modality and brain aging in our study. However, some studies have reported contradictory results. A study from the United Kingdom Clinical Practice Research Datalink reported that individuals with severe obesity (BMI > 40 kg/m2) have a 29% lower risk of dementia (95% CI: 22%‒36%) compared with those with a healthy weight[22]. Another study found that while midlife BMI is associated with an increased risk of dementia, later-life BMI may exert a protective effect[22,28]—a phenomenon known as the "obesity paradox"[28]. This paradox may result from unintentional weight loss during the preclinical stages of neurodegenerative disease, leading to reverse causal effects[29]. This may also arise from the inability of BMI to distinguish fat from lean mass or reflect fat distribution, particularly in Asian populations, which tend to have higher adiposity at comparable BMI values[30]. Therefore, future studies should integrate multiple body composition indicators to better account for their combined effects on brain aging.
Although the mechanisms through which excess adipose tissue influences brain aging remain elusive, several pathways have been proposed, including insulin resistance, inflammation, and vascular dysfunction. Specifically, chronic insulin resistance associated with obesity impairs insulin signaling in the brain, resulting in a cerebral insulin deficit. This disruption affects crucial neurophysiological processes, including glutamate regulation, leading to elevated free glutamate levels and potential excitotoxic damage[31]. Additionally, insulin resistance impairs insulin-mediated vasodilation, reduces microvascular perfusion, contributes to cognitive deficits in rats[32], and increases the risk of vascular dementia in humans[33]. Furthermore, chronic low-grade inflammation, a hallmark of obesity and metabolic syndrome, is associated with reduced brain integrity and cognitive decline[34].
The fat-free mass dominant modality and the trunk-leg contrast distribution modality showed no significant associations with BAG. However, previous studies have demonstrated a negative association between lean mass and dementia risk[35,36]. Although our study investigated a different outcome, this discrepancy may be attributable to differences in population heterogeneity, sample size, and measurement approaches. Therefore, further longitudinal studies are required to explore and clarify these associations.
The limitations of this study must be acknowledged. First, its cross-sectional design precludes causal inferences. Longitudinal studies are warranted to assess how dynamic changes in body composition modalities influence brain aging and to uncover the potential effects of more region-specific distribution modalities. Second, the limited sample size may have constrained the statistical power to detect subtle associations. Further large-scale studies are required to validate these findings. Finally, although the analyses adjusted for key covariates, the presence of unmeasured confounders that may impact the observed associations cannot be overlooked.
-
In conclusion, this study revealed that the fat mass dominant body composition modality is associated with accelerated brain aging in Chinese adults. These findings underscore the potential for integrating deep body composition indicators into clinical and community health settings, offering a promising approach for precise brain aging assessments and targeted prevention of neurological diseases through lifestyle interventions.
-
JASHA was approved by the Ethics Committee of Zhejiang University School of Public Health (No. ZGL202112-6) and Dongyang People’s Hospital. All participants provided informed consent, and the study adhered to the principles of the Declaration of Helsinki.
-
The data described in the manuscript are available upon reasonable request and pending approval from the corresponding authors. The supplementary materials will be available in www.besjournal.com.
Multidimensional Body Composition Modalities and Their Associations with Brain Aging in Chinese Adults
doi: 10.3967/bes2025.166
- Received Date: 2025-05-28
- Accepted Date: 2025-09-10
-
Key words:
- Body composition modality /
- Brain age /
- Multidimensional /
- Chinese cohort.
Abstract:
The authors declare that no competing interests exist.
&These authors contributed equally to this work.
| Citation: | Qiaoqiao Zhao, Yanjie Zhao, Jing Ju, Liming Zhang, Xueqing Jia, Duoduo Fu, Jiening Yu, Kaili Sun, Liying Chen, Xiaoting Liu, Zuyun Liu, Yan Zhang, Yangzhen Lu, Xuan Ge. Multidimensional Body Composition Modalities and Their Associations with Brain Aging in Chinese Adults[J]. Biomedical and Environmental Sciences. doi: 10.3967/bes2025.166

|

 Quick Links
 DownLoad: