
-
Air pollution poses a significant threat to human health, and is a pressing global public health concern. Fine particulate matter (PM2.5) and ozone (O3) are among the air pollutants contributing to the most severe disease burdens[1]. As the world's largest developing country, China has experienced severe ozone pollution globally. Relevant studies indicate that from 2013 to 2019, the population-weighted median concentration of the maximum 8-h average ozone concentration (O3-MDA8) in mainland China rose from 89.34 μg/m3 to 100.96 μg/m3, with relatively significant increases in the central and eastern regions[2]. According to a previous report, from 2015 to 2019, the 90th percentile of O3-DMA8 concentration across the country increased from 134 μg/m3 to 148 μg/m[3]. Numerous epidemiological studies have confirmed that both short- and long-term exposure to elevated ozone concentrations significantly increases the risk of death and morbidity from circulatory system diseases[4-7]. In 2019, the exposure to ozone pollution resulted in 365,222 deaths worldwide, accounting for 0.65% of all deaths globally[8]. Model predictions indicate that even under a sustainable development strategy, China will have approximately 359,200 cardiovascular disease deaths attributed to ozone exposure by 2050[9]. The growing burden of circulatory system diseases has become a major public health challenge in China and worldwide. Therefore, an accurate assessment of the health risks associated with ozone is critical for strengthening ozone pollution control strategies and protecting public health.
An accurate assessment of the health effects of pollutant exposure requires knowledge of the exposure concentrations. Currently, atmospheric ozone concentrations in China can be obtained through various methods, including national air quality monitoring networks, satellite remote sensing, and simulation predictions based on multisource data fusion. Since 2013, the China National Environmental Monitoring Center (CNEMC) has released pollutant monitoring results that have been used to evaluate the health impacts of pollutants[10-12]. Although ground monitoring stations provide precise local exposure information, they are primarily located in urban areas. This limits their spatial and population coverage and restricts the assessment of large-scale exposure, which can lead to deviations in health effect assessments[13,14]. In recent years, as exposure assessment technologies have advanced, numerous studies have combined surface monitoring data with machine learning, chemical transport models, air quality models, or satellite remote sensing data to predict ozone concentration distributions, analyze emission characteristics[15-18], and apply these predictions to health effect assessments[19,20]. For instance, Liu et al.[21] analyzed ground-level ozone pollution in China in 2015 using monitoring data and simulated national ozone concentrations and exposure levels using the Weather Research and Forecasting – Community Multiscale Air Quality (WRF-CMAQ) model. They estimated the burden of chronic obstructive pulmonary disease (COPD) deaths caused by ozone exposure. Liang et al.[22] estimated high-resolution daily ozone exposure levels in 10 km × 10 km grids using satellite inversion data and corrected them using ground monitoring station data. They then evaluated the number of premature deaths related to ozone exposure and the economic burden. Wang et al.[23] combined air quality model predictions with ground monitoring data to estimate ozone exposure. They estimated that approximately 186,000 deaths related to ozone exposure occurred annually in China between 2013 and 2017. The Tracking Air Pollution in China (TAP) dataset has also been widely applied in areas such as air pollution health impacts and assessment of clean air policies. TAP integrates satellite remote sensing and model simulations of China's atmospheric composition, providing near-real-time tracking data with more complete spatial and temporal coverage[24-26]. Although satellite remote sensing and model simulation data address the spatial coverage limitations of ground-based monitoring, there are differences among the various models and data sources in terms of spatial coverage, temporal resolution, and predictive accuracy. Additionally, owing to uncertainties in emission inventories and the complexity of photochemical processes, these models may underestimate or overestimate the actual ozone exposure concentrations, leading to biases in health effects and disease burden assessments[27]. Several epidemiological studies have examined the differences in health impact assessments caused by different exposure models. For example, Sun et al.[28] integrated multiple high-resolution ozone databases and confirmed that the health burden related to ozone was severely underestimated in previous studies. Wang et al.[29] observed a 30% difference in the changes in ozone-related premature deaths when evaluating different datasets between 2014 and 2018. Using ground exposure data to estimate the relative risks yielded results that were 0.10% higher than those obtained using remote sensing. These results demonstrate the importance of choosing appropriate exposure datasets to accurately assess the health impacts of air pollution . Therefore, the differences in the ozone concentration data provided by various exposure assessment models in terms of source and quality cannot be disregarded. These discrepancies can lead to uncertainty in estimating health effects and may obscure the true exposure-response relationship. This, in turn, adversely affects the development of environmental policies and the evaluation of health intervention measures.
In this context, this study systematically evaluated differences in health effects and disease burden owing to ozone exposure on circulatory system diseases across various data sources, while also investigating how data selection influences the assessment results. The results of this research clarify the robustness of the health effects of ozone and provide significant reference for selecting exposure assessment methods in future environmental epidemiologic studies.
-
Three ozone exposure data products were used in this study. The first product comprised observational data from the National Environmental Monitoring Center (CNEMC, https://www.cnemc.cn). This dataset provides daily maximum 8-h average ozone concentration (O3-MDA8) monitoring data from 1,436 national control monitoring stations across China and 338 prefecture-level cities.
The second product was the China Atmospheric Component Real-Time Tracking Dataset (TAP, https://doi.org/10.5281/zenodo.4400043). This dataset was developed by Tsinghua University in collaboration with Peking University, Nanjing University, Fudan University, and the China Meteorological Research Institute. It employs a machine learning model that integrates ozone observation data, satellite remote sensing ozone vertical profiles, CMAQ and WRF simulations, vegetation indices, nighttime lights, and population data to simulate and obtain spatially resolved, 10-km grid-based maximum 8-h ozone concentration data from 2013 to date.
Finally, the High-Resolution Reconstruction Data from the University of Science and Technology of China (USTC) utilizes deep learning to integrate satellite ozone stratification profiles and precursor column concentrations (e.g., formaldehyde [HCHO], nitrogen dioxide [NO2]) with auxiliary data, such as geographic information (e.g., terrain and vegetation coverage), meteorological data and emissions inventories (including anthropogenic and natural sources), to obtain ground-level, 1-km, hourly ozone concentration results.
Meteorological data, including daily average temperature and relative humidity, were sourced from the ERA5-Land reanalysis dataset released by the European Center for Medium-Range Weather Forecasts (ECMWF) (https://cds.climate.copernicus. eu/cdsapp/dataset). This dataset provides various meteorological variables with a spatial resolution of 0.1° × 0.1° worldwide.
To calculate the exposure level at the county scale, we calculated the arithmetic mean of all grids within each county for grid-based ozone concentration and meteorological variables. For ozone, we used the daily maximum 8-h average concentration. For ozone data from the environmental monitoring stations, matching was based on the coordinates of the monitoring stations and their corresponding counties.
-
Data on the daily cumulative number of deaths from circulatory system diseases in 199 districts and counties nationwide, covering the period from January 1, 2014, to December 31, 2018, were obtained from the disease monitoring point system of the Chinese Center for Disease Control and Prevention. The dataset included information on sex, age, date of death, underlying cause (ICD code), and residential address code. Deaths were classified according to the International Classification of Diseases, Tenth Edition (ICD-10), thus allowing for the identification and distinction of cases related to circulatory system diseases (ICD codes I00–I99). Subgroup data were further categorized according to gender (male or female) and age group (0–64, 65–74, or 75 years and older).
Population data for each district and county were sourced from the Sixth National Population Census Report. The annual basic mortality rate for circulatory system diseases was obtained from the China Public Health and Family Planning Statistical Yearbook (2015–2019).
-
This study employed a two-stage time series analysis to examine the relationship between ozone exposure and daily circulatory disease deaths. Initially, a generalized linear model (GLM) based on Poisson regression was used at the county level to analyze the association between ozone exposure and circulatory disease death. This model is expressed as follows:
$$ \begin{split} \text{log(}E(Y_t))=& AP_{\text{t}}+ns\text{(temp,}df)+ns\text{(rh,}df)+ \\ & ns\text{(time,}df)+dow+PM_{2.5} \end{split} $$ (1) where Yt represents the number of resident deaths, and APt represents O3-MDA8 on the current day. Natural spline functions (ns) were employed to control for long-term trends in temperature, humidity, and time, as well as for confounding effects of the day of the week. The degrees of freedom for the time trend, daily average temperature, and relative humidity were set to 7, 3, and 3, respectively. To address the effects of multicollinearity, PM2.5 was included as a control in the main model.
In the second stage, we summarized the association between ozone and deaths from specific causes through a meta-analysis using random-effects functions for each county. In time-series studies on air pollution and health, a given day's health outcome may be associated with pollutant levels from the same day or previous days. This phenomenon is known as the “lag effect.” Evaluation of these lag structures is crucial because physiological responses to ozone, such as blood pressure, heart rate variability, and inflammatory factors, can result in mortality after a delay of hours or days[30-32]. Previous evidence suggested that ozone effects can persist for several days after exposure[33-35]. The acute effects primarily occur within the first week of exposure, with the critical window of influence lagging by 0–3 days[35-38]. Based on this evidence, to observe the lagging pattern of the association between ozone and mortality, we examined two effects: the single-day lag effect (from lag 0 to lag 3 days, where lag 0 represents exposure on the same day) and the moving average lag effect (lag03, representing the moving average from days 1 to 3). This association represents the percentage increase in population mortality from circulatory system diseases for every 10 µg/m3 increase in ozone concentration. Moreover, to explore population vulnerability, this study investigated the impact of short-term ozone exposure on deaths from circulatory diseases across different age and sex groups: 0–64 years, 65–74 years, and 75 years and older.
The sensitivity analysis consisted of two parts: (1) adjusting the flexibility of the time trends and meteorological conditions to evaluate the stability of the model. Specifically, the flexibility of the time trend in the main model was set to 6, 8, and 9. The flexibility of the temperature and relative humidity was adjusted to 4 and 5, respectively. (2) Using the sensitivity analysis approach employed in previous studies[5,36], we constructed a dual-pollutant model to examine the confounding effects of other pollutants. In this model, carbon monoxide (CO), nitrogen dioxide (NO2), and sulfur dioxide (SO2) replace PM2.5. Each co-pollutant was included in the model as a linear term, and the lag structure was the same as that of ozone.
All statistical analyses were conducted using R statistical software, version 4.3.3. Two-tailed tests were employed, and statistical significance was considered when the p-value was less than 0.05.
Disease Burden Assessment This study calculated the attributable disease burden of circulatory system diseases based on the daily atmospheric ozone concentrations in each district. The hazard ratio (HR) corresponding to each 1 µg/m3 increase in ozone concentration is derived from the results of this study. The number of deaths attributable to atmospheric ozone concentration was then calculated based on each district's population and the baseline mortality rate for circulatory system diseases. The formula is as follows:
$$ \text{MOR =}POP×{Y}_{0}×C×\frac{(HR- 1)}{HR} $$ (2) where MOR represents the number of deaths, POP represents the population of each district, Y0 indicates the daily baseline mortality rate ( annual baseline mortality rate divided by 365), C represents the annual average ozone concentration (O3-MDA8) in the county, and HR is the risk ratio of atmospheric ozone concentration to circulatory system disease mortality in the population. The attributable number of deaths related to annual atmospheric ozone exposure in each district was then summarized.
-
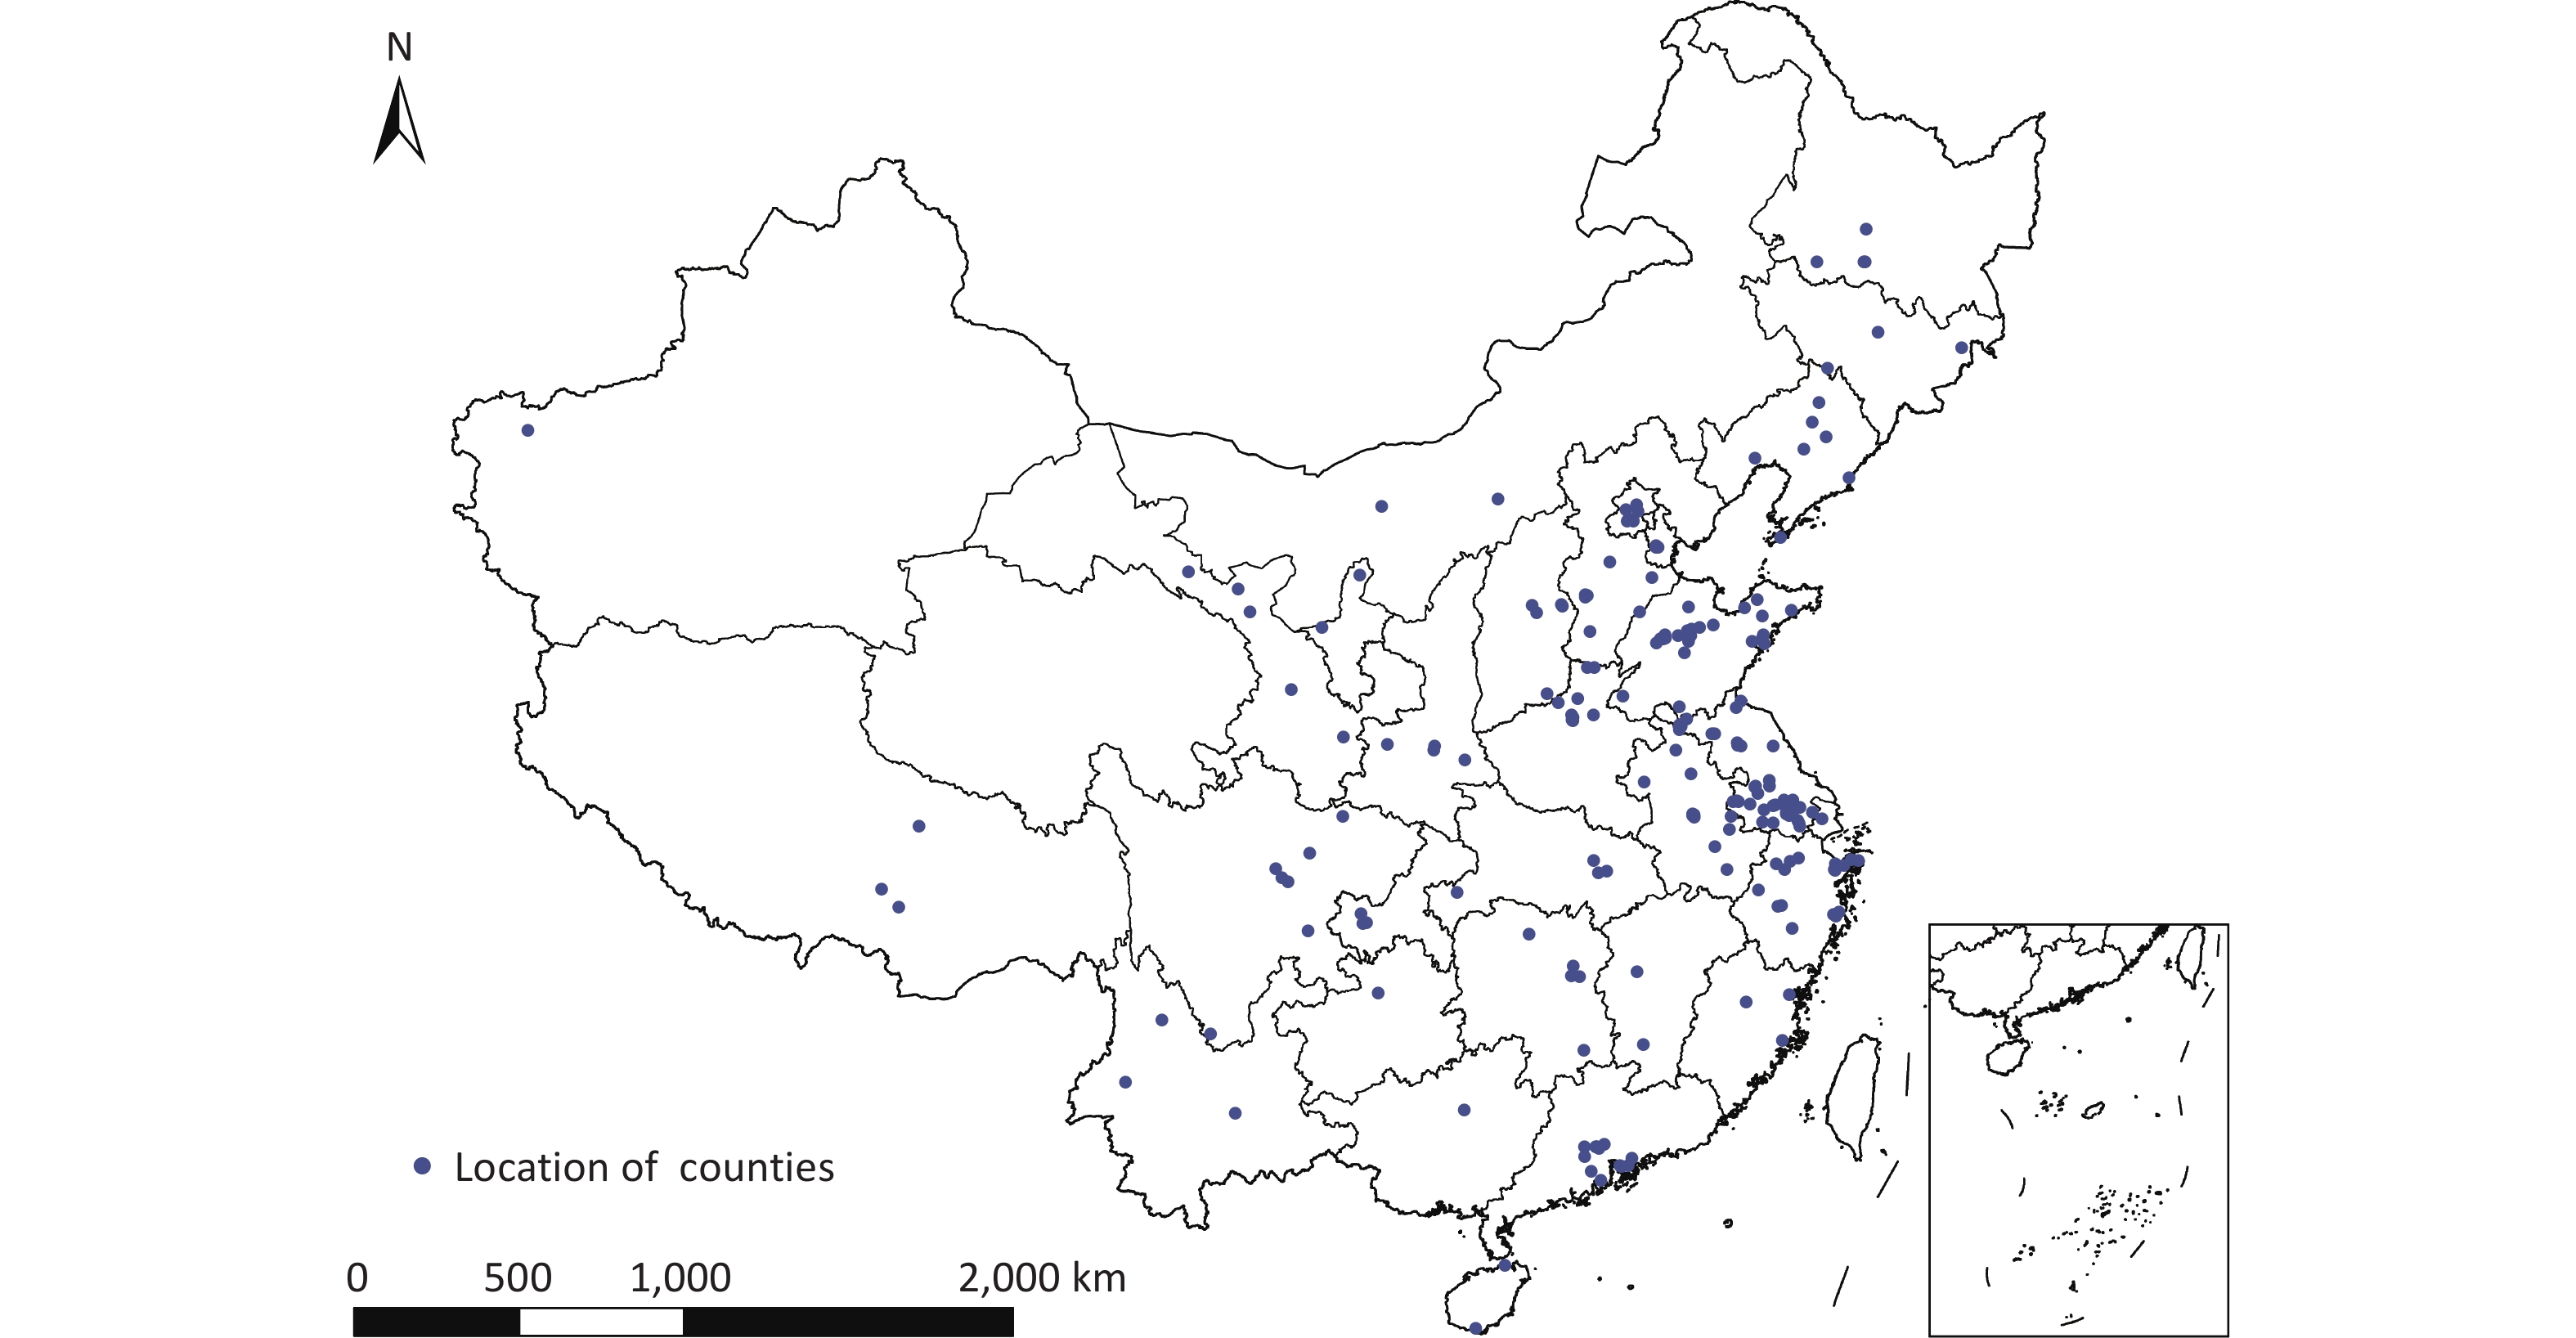
As the research sites, this study selected 199 counties in China, distributed across 30 provincial-level administrative regions, including 122 prefecture-level cities or districts, with a total population of approximately 150 million. The 199 counties and districts were selected based on the availability of data on ozone levels, mortality rates, average daily deaths from circulatory system diseases, and meteorological parameters. The distribution of the study counties and districts is shown in Figure 1.
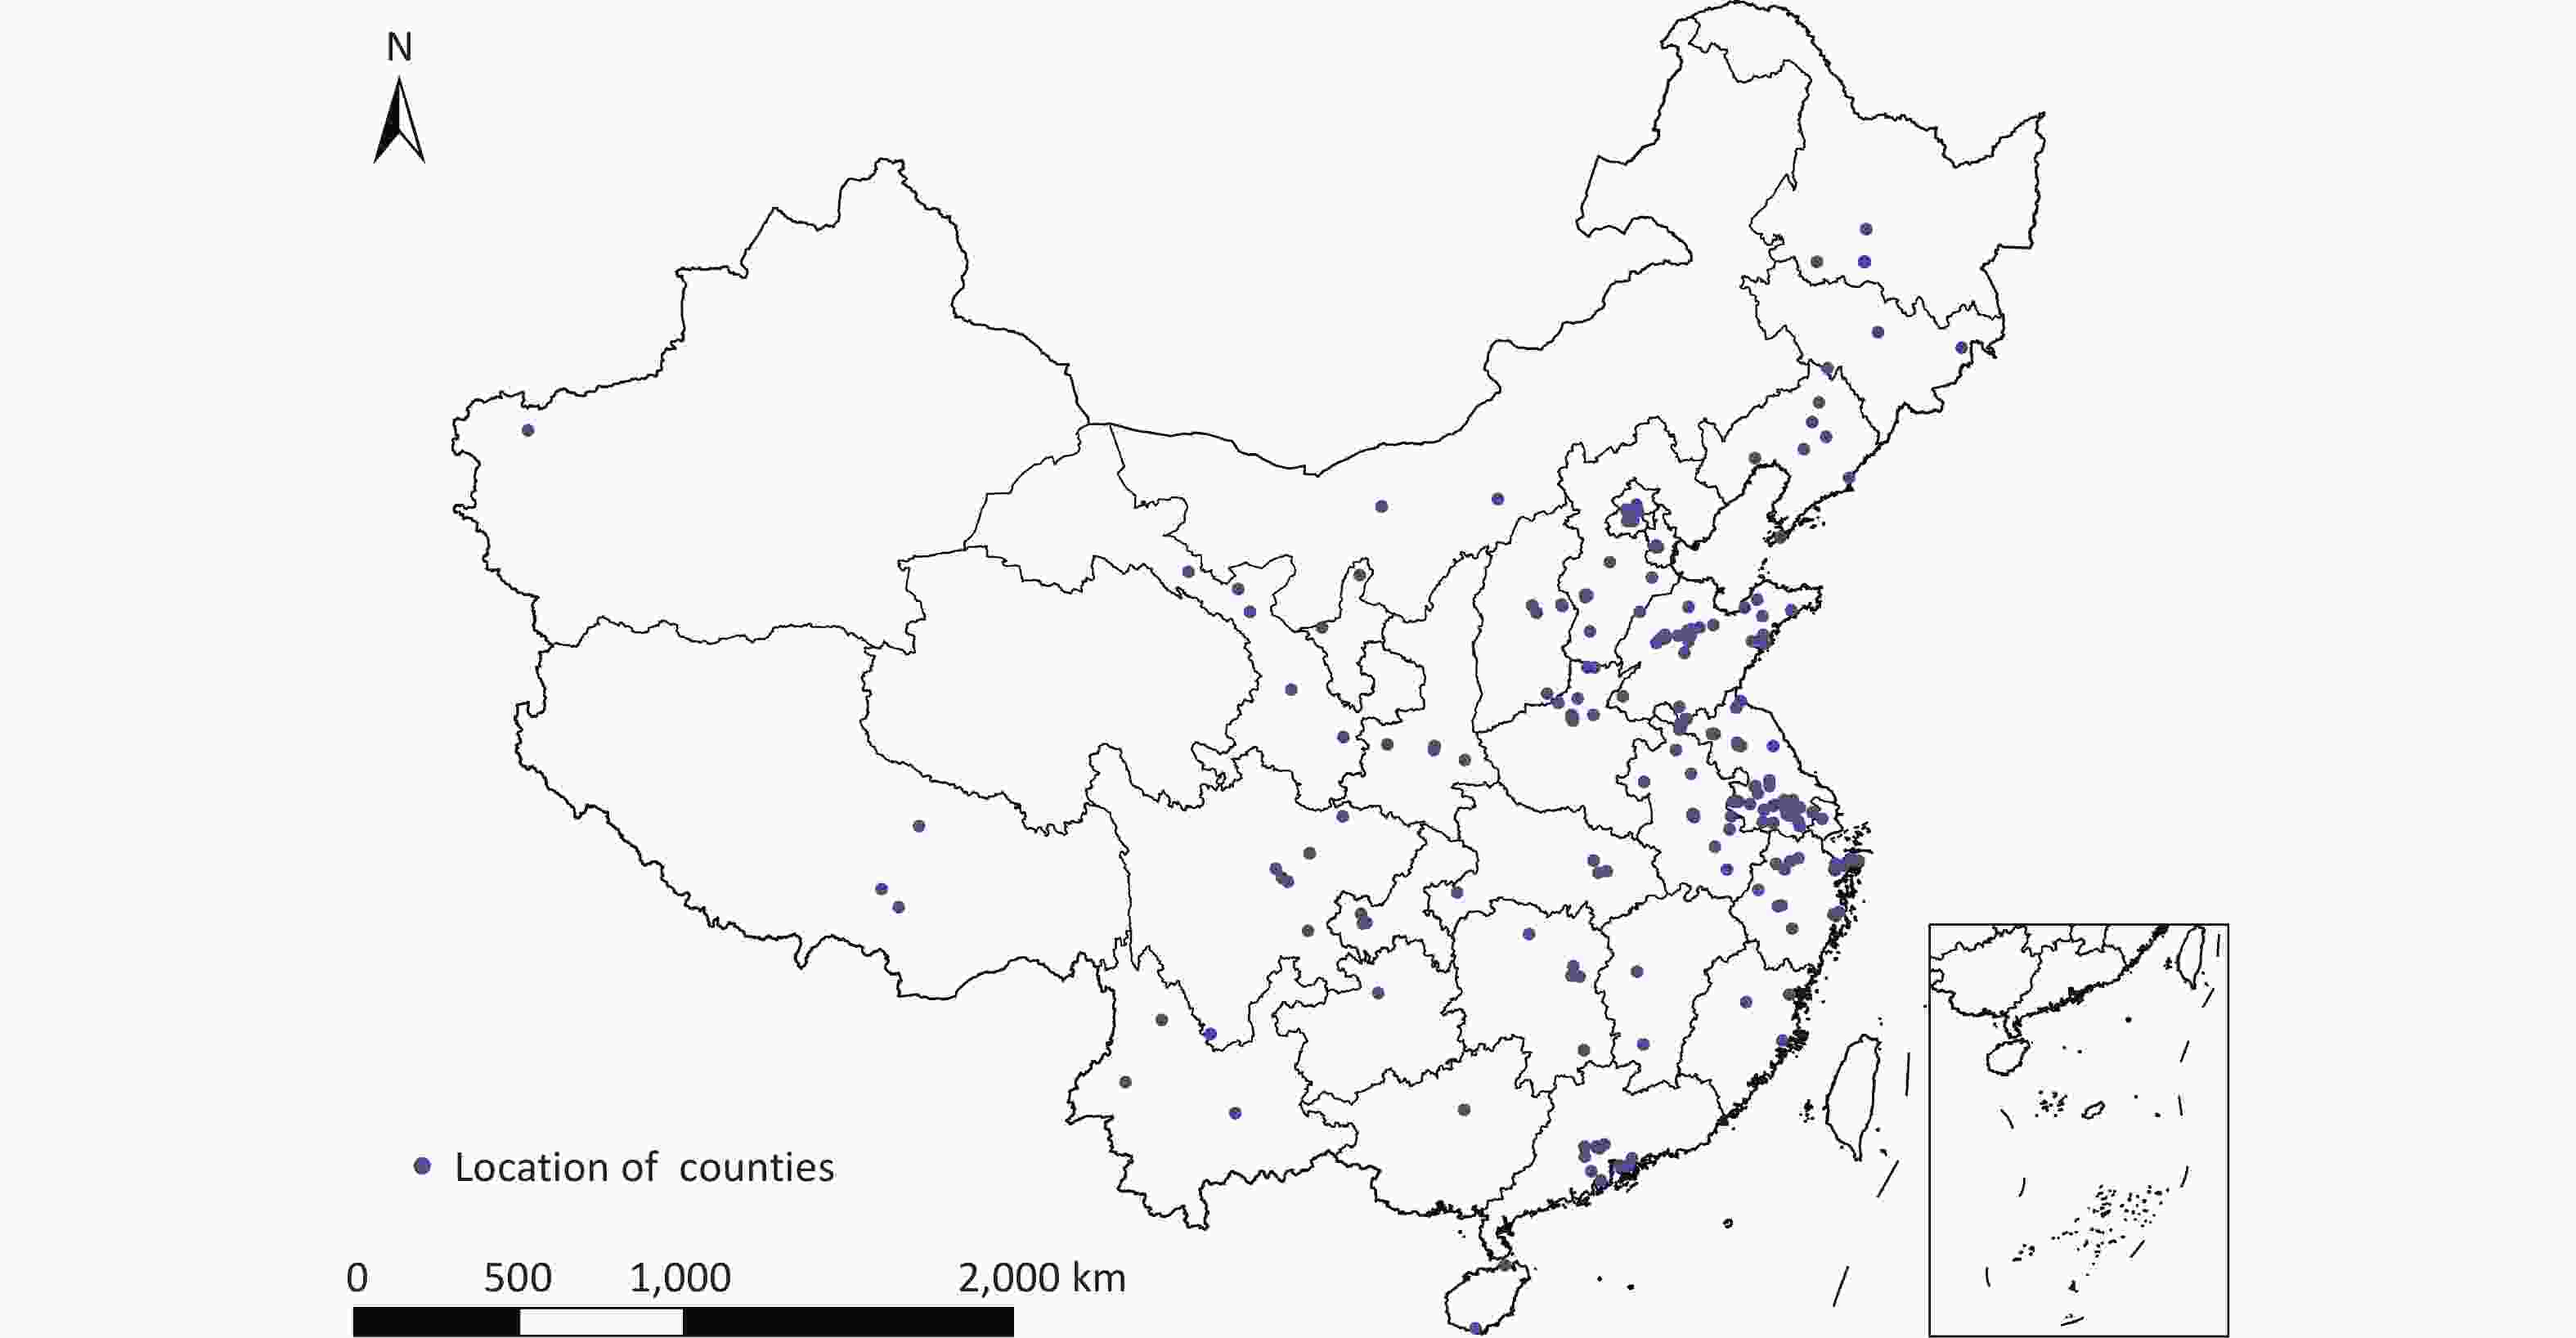
Figure 1. The locations of counties in this study (n = 199)
-
Table 1 presents a summary of the descriptive statistics for circulatory system disease mortality, ozone levels, meteorological parameters, and other pollutants from 2014 to 2018. During the study period, the total number of deaths due to circulatory system diseases was 1,496,499, comprising 786,418 males (52.56%) and 710,081 females (47.44%). Among them, 249,178 individuals were aged 64 years or younger, accounting for 16.65%; 352,738 were aged 65–74 years, representing 23.57%; and 894,583 were aged 75 years or older, accounting for 59.78% of the total number of deaths. The average daily number of circulatory system disease deaths was 4.6 ± 3.8.
Variable Mean ± SD Min P25 P50 P75 Max Daily deaths Total 4.6 ± 3.8 0 2.0 4.0 6.0 166 Sex Male 2.5 ± 2.3 0 1.0 2.0 3.0 91 Female 2.2 ± 2.1 0 1.0 2.0 3.0 75.0 Age ≤ 64 0.9 ± 1.1 0 0 1.0 1.0 42.0 65–74 0.9 ± 1.1 0 0 1.0 1.0 37.0 > 75 2.8 ± 2.8 0 1.0 2.0 4.0 108.0 O3 (μg/m3) CNEMC 96.8 ± 50.6 1.0 60.0 89.0 127.0 300.0 TAP 87.4 ± 38.5 1.0 58.7 82.0 111.5 268.9 USTC 93.5 ± 41.4 5.7 63.2 86.4 118.1 290.8 Meteorological factors Temperature (°C) 14.8 ± 10.5 –32.4 6.95 16.3 23.4 35.4 Relative humidity (%) 68.8 ± 17.2 5.6 58.3 72.2 82.0 99.8 Pollutants (μg/m3) NO2 35.1 ± 17.4 0 21.8 32.1 45.6 179.0 PM2.5 52.5 ± 43.8 3.0 24.6 40.6 65.9 1983.8 CO 1.0 ± 0.6 0 0.6 0.9 1.2 37.2 SO2 22.7 ± 27.5 2.9 8.2 14.4 26.6 1468.8 Note. O3-MDA8 indicates daily maximum 8-h average ozone concentration; SD :standard deviation; Min: minimum; P25: 25th percentile; P50:median; P75: 75th percentile; Max: maximum. CNEMC refers to ozone data from the National Environmental Monitoring Centre. TAP refers to ozone data from the China Atmospheric Component Real-time Tracking Dataset. USTC refers to ozone data from the University of Science and Technology of China. Table 1. Descriptive Analysis of Mortality Data, Ozone Concentrations, Meteorological Parameters, and Concentrations of Other Pollutants in 199 Counties Nationwide (2014–2018)
The ozone levels recorded in the CNEMC, TAP, and USTC datasets were 96.8, 87.4, and 93.5 µg/m3, respectively. The spatial distribution of ozone concentrations for each dataset is detailed in the supplementary materials (Supplementary Figures S1–S3).
-
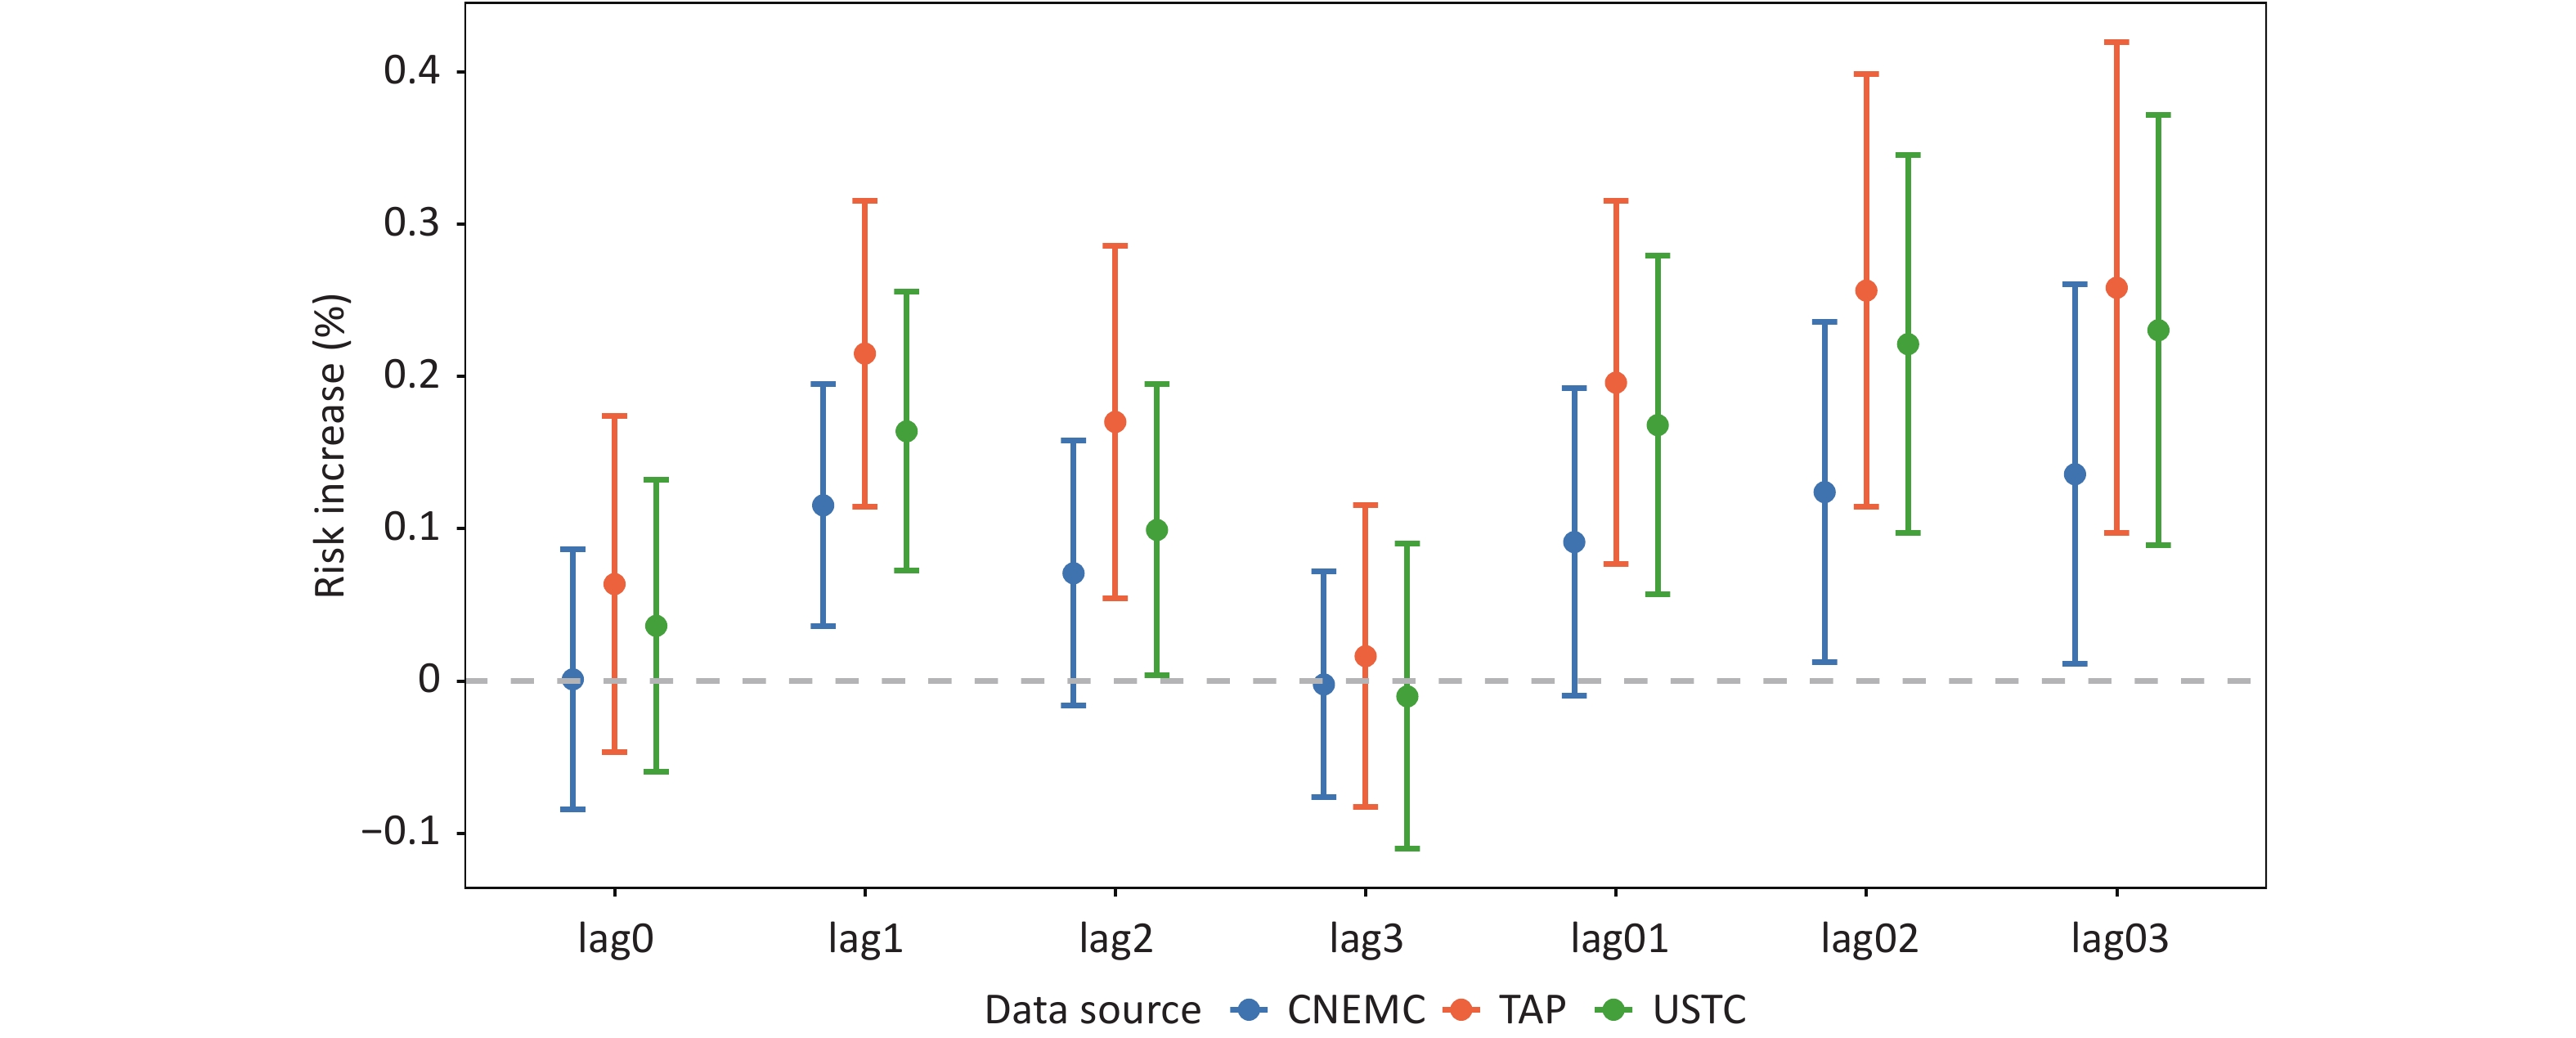
Figure 2 indicates the percentage increase in the risk of mortality from circulatory system diseases for each 10 µg/m3 increase in ozone concentration across different datasets. The results indicate that the exposure-response relationship estimates for ozone exposure and mortality from circulatory system diseases were the highest when based on the TAP dataset, followed by the USTC dataset. In contrast, the CNEMC dataset yielded the lowest effect estimates and narrowest confidence intervals.
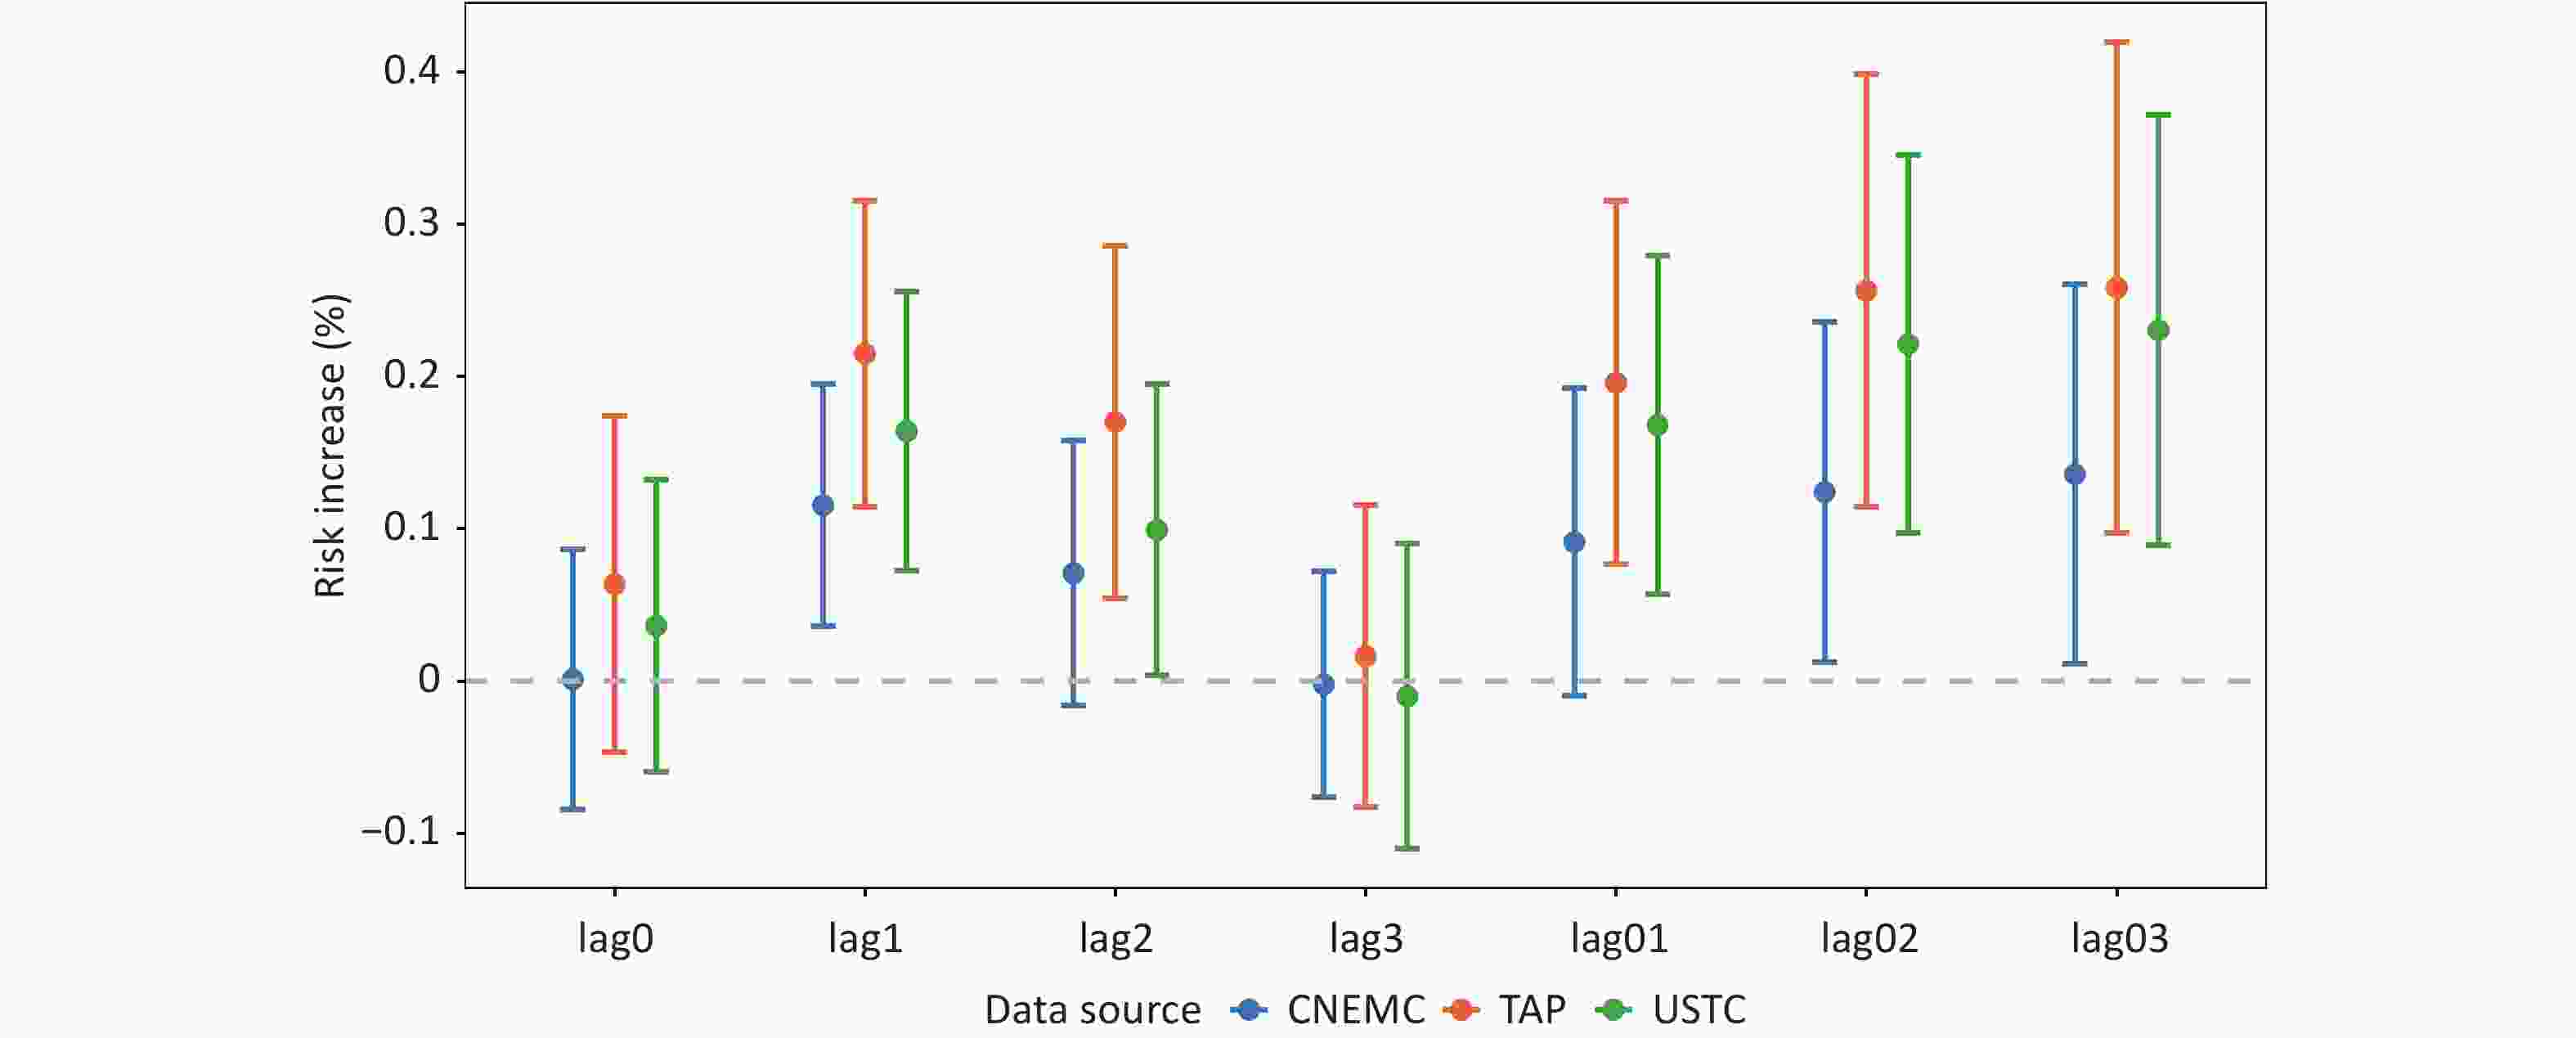
Figure 2. Percentage Increase in the Risk of Circulatory System Disease Mortality Associated with a 10 µg/m3 Increase in Ozone Exposure. Points represent the pooled percent increase in mortality risk per 10 μg/m3 ozone increase. Error bars indicate 95% confidence intervals. Single-day lags (lag0, lag1, lag2, and lag3) represent ozone exposure on the day of death and 1–3 days prior, respectively. The cumulative lags (lag01, lag02, and lag03) represent the moving average ozone concentrations from lag0 to lag1, lag0 to lag2, and lag0 to lag3, respectively. The colors distinguish the three exposure datasets: CNEMC (blue), TAP (orange), and USTC (green).
Furthermore, the effects of ozone exposure on circulatory system disease mortality across the datasets demonstrated consistent lagged effects. For single-day lags, the strongest association was observed the following day (lag1). However, for multi-day lags, the association between ozone and circulatory system disease mortality strengthened, reaching its peak at the cumulative effect of a three-day lag (Lag03). The corresponding effect estimates are 0.14% (95% CI: 0.01%, 0.26%) for the CNEMC dataset, 0.26% (95% CI: 0.10%, 0.42%) for the TAP dataset, and 0.23% (95% CI: 0.09%, 0.37%) for the USTC dataset.
-
In the sensitivity analyses, the effects of ozone exposure with a 3-day lag (lag03) from different datasets on circulatory system disease mortality were compared, yielding results consistent with those of the main model. Specifically, the estimated exposure-response relationship between ozone exposure and circulatory system disease mortality risk was highest in the TAP dataset, followed by the USTC dataset, and lowest in the CNEMC dataset. After adjusting for humidity, the model demonstrated increased stability. However, when the annual degrees of freedom were set to 8, the association between ozone and daily circulatory system disease mortality weakened. Additionally, adjusting for co-pollutants to NO2, CO, SO2 enhanced the association between ozone and mortality (Table 2).
Model Settings CNEMC TAP USTC Degrees of freedom dftemp = 4 0.21 (0.09,0.33) 0.38 (0.22,0.53) 0.32 (0.18,0.45) dftemp = 5 0.25 (0.13,0.37) 0.44 (0.28,0.60) 0.38 (0.21,0.51) dfrh = 4 0.13 (0.01,0.26) 0.26 (0.10,0.42) 0.23 (0.09,0.37) dfrh = 5 0.14 (0.01,0.26) 0.26 (0.11,0.42) 0.23 (0.09,0.37) dftime = 6 0.21 (0.09,0.33) 0.36 (0.22,0.50) 0.34 (0.21,0.48) dftime = 8 0.12 (0.00,0.25) 0.22 (0.06,0.38) 0.20 (0.06,0.34) dftime = 9 0.23 (0.10,0.36) 0.41 (0.25,0.58) 0.35 (0.21,0.49) Co-pollutants +NO2 0.18 (0.05,0.30) 0.31 (0.15,0.47) 0.27 (0.13,0.42) +CO 0.18 (0.05,0.30) 0.31 (0.14,0.47) 0.27 (0.13,0.41) +SO2 0.20 (0.08,0.33) 0.33 (0.17,0.50) 0.30 (0.16,0.44) Table 2. Percentage Increase in the Risk of Circulatory System Disease Mortality Associated with a 10 µg/m3 Increase in Ozone Exposure Across Different Models (95% CI)
-
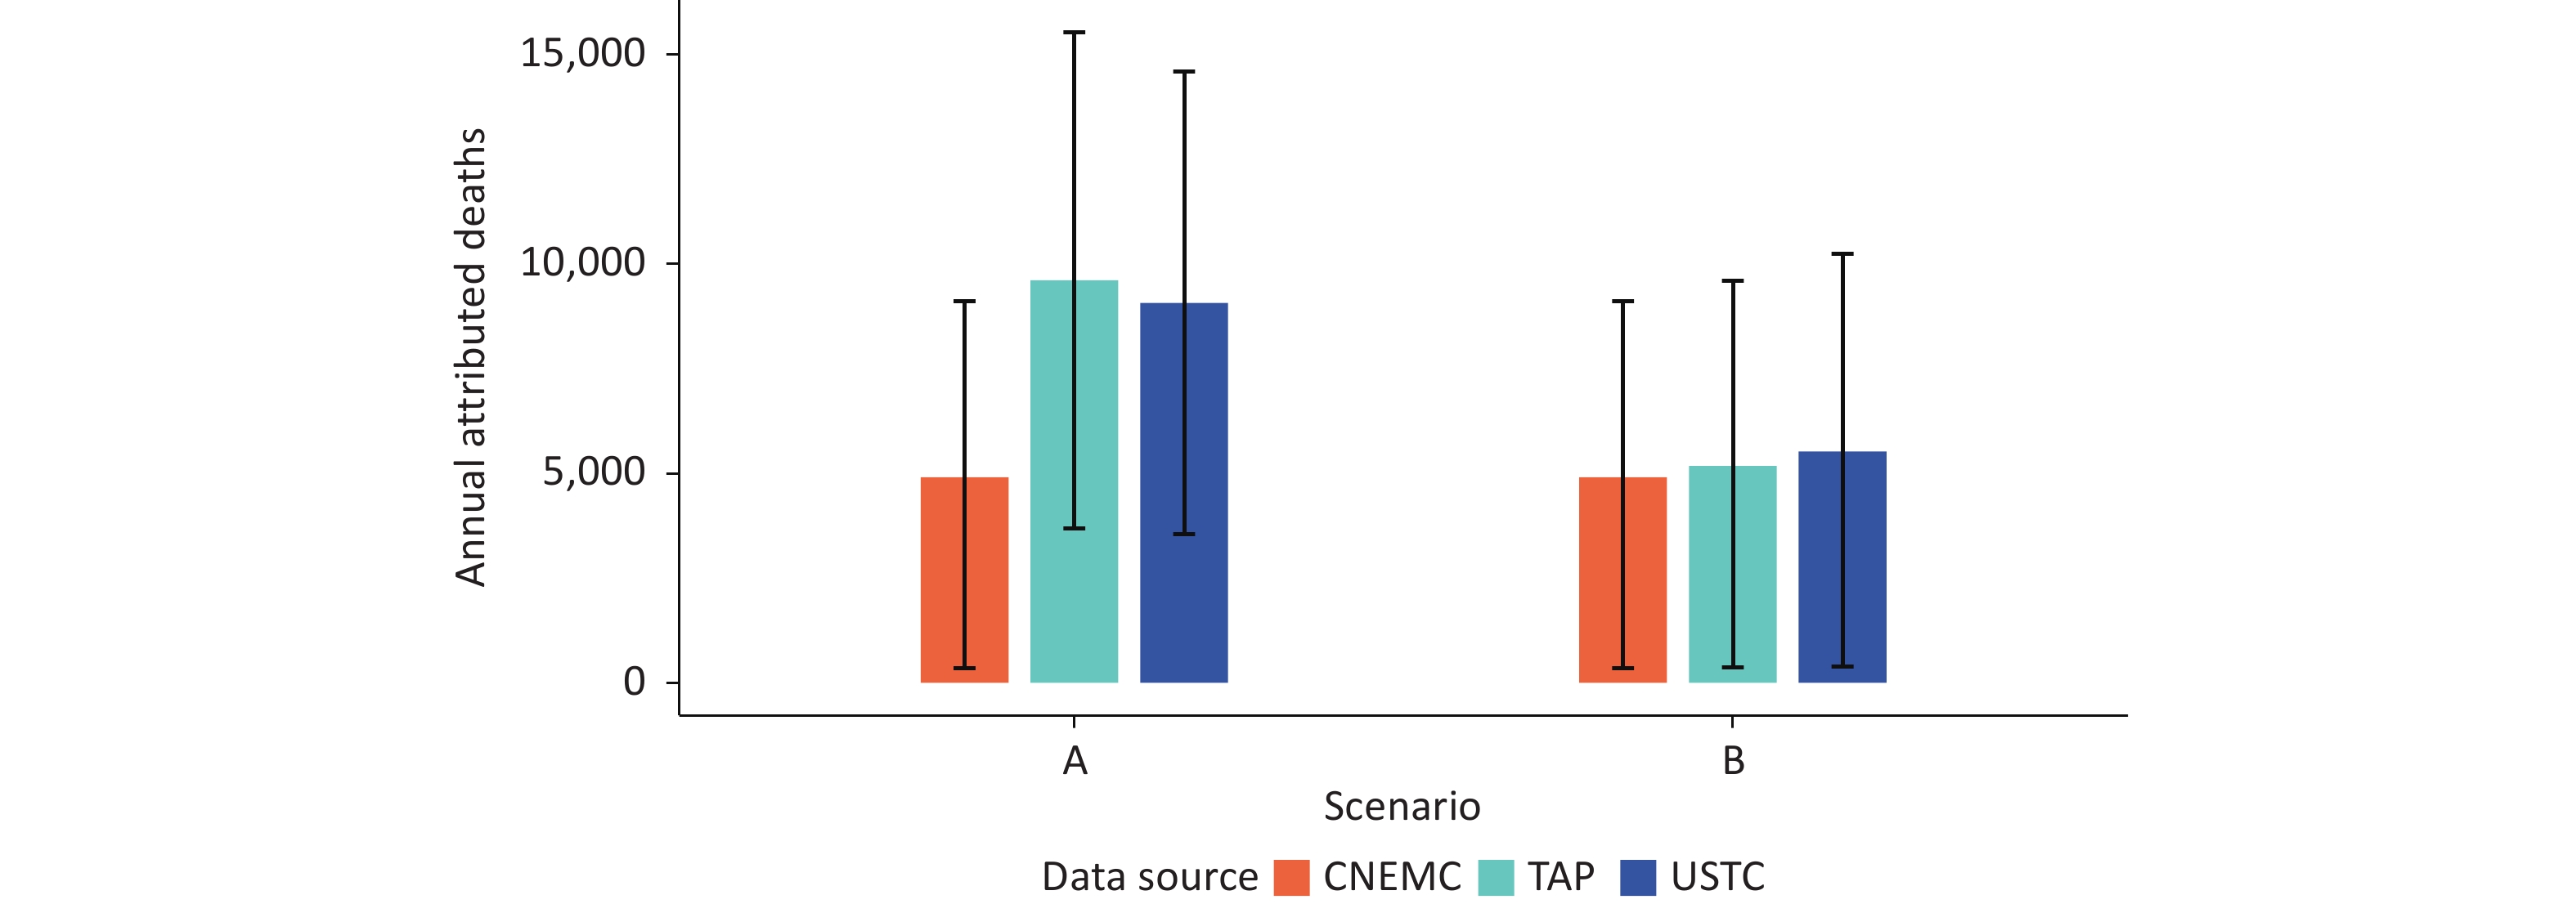
Figure 3 shows a comparison of the annual average number of deaths attributable to ozone exposure-related circulatory system diseases based on different datasets. The study indicated marked differences in disease burden assessments derived from exposure-response coefficients specific to each dataset (Figure 3A). The annual average number of attributable deaths based on the CNEMC dataset was 4,907 (95% CI: 350–9,113), whereas the estimated results for the TAP and USTC datasets were 9,607 (95% CI: 3,694–15,520) and 9,067 (95% CI: 3,547–14,588), respectively. These values were approximately 1.96 and 1.85 times higher than the CNEMC results.
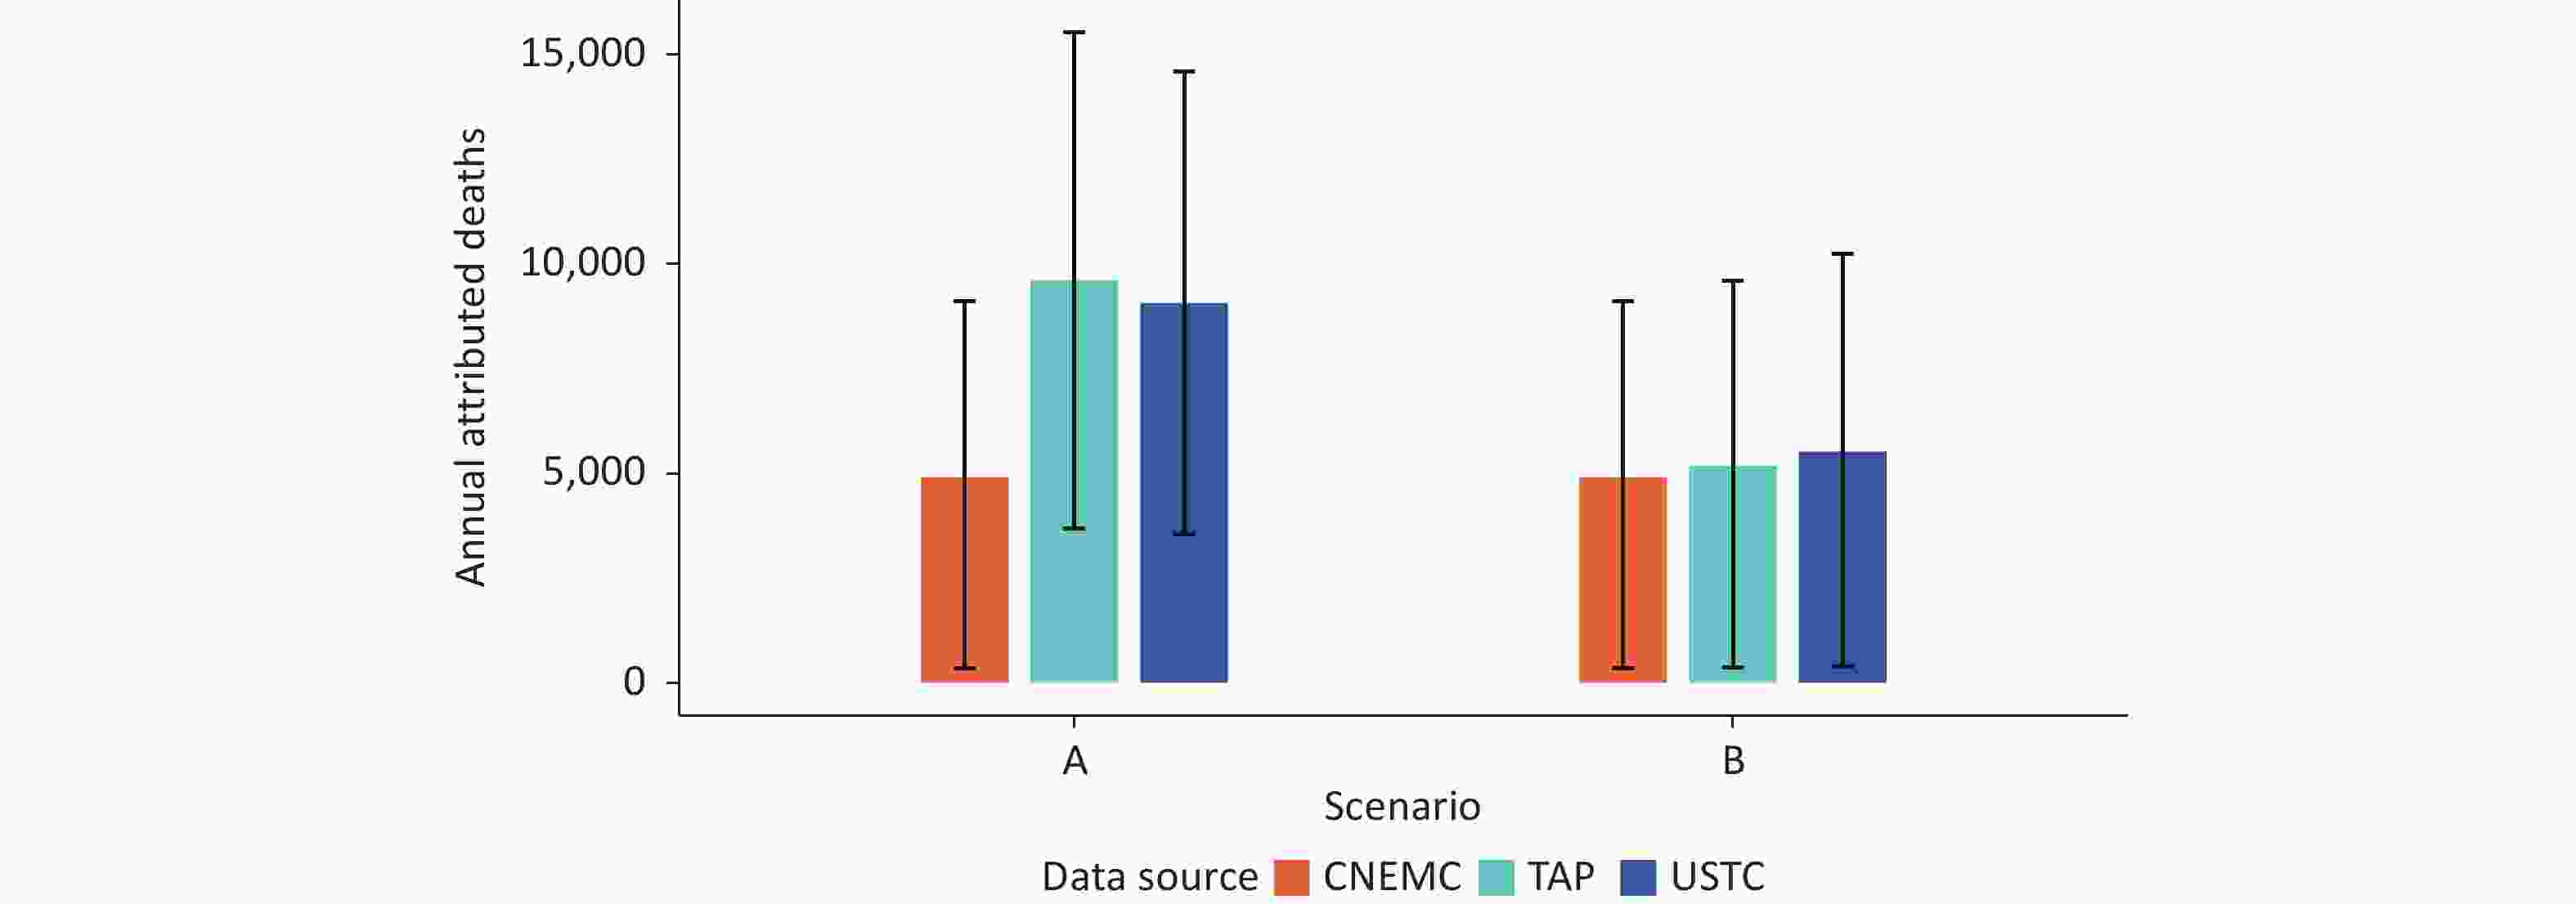
Figure 3. Annual Attributable Deaths Related to Ozone for Different Datasets
However, when calculations were conducted using exposure-response coefficients from the CNEMC dataset; although the absolute values of attributable deaths differed across datasets, the differences between them were significantly narrowed. The annual average number of attributable deaths from the TAP and USTC datasets decreased to 5,172 (95% CI: 369–9,606) and 5,518 (95% CI: 394–10,250), respectively (Figure 3B).
-
This study evaluated the association between ozone exposure and the risk of circulatory system disease-related mortality using time series data from 199 counties in China from 2014 to 2018. It compares the health risk effects and disease burden assessments across different ozone datasets. The results provide new evidence for the health effects of ozone exposure and serve as an important reference for selecting exposure assessment methods.
Our findings confirm the impact of ozone exposure on circulatory system health, with the most significant effects observed at a lag of three days (lag03). The relative risk estimates for the CNEMC, TAP, and USTC datasets were 0.14% (95% CI: 0.01%, 0.26%), 0.26% (95% CI: 0.10%, 0.42%), and 0.23% (95% CI: 0.09%, 0.37%), respectively. These findings were consistent with previous studies[6,39]. For instance, a study by Sun et al.[7] in 34 counties in 10 cities across China found that the association between ozone exposure at Lag02 and circulatory system disease mortality risk was strongest, with a 0.39% (95% CI: 0.16%, 0.62%) increase for every 10 µg/m3 increase in ozone concentration. Another national study reported a 0.11% (95% CI: 0.04%, 0.17%) increase in the risk of circulatory system disease mortality at a cumulative lag of 1 d (Lag01) for each 10 µg/m3 increase in ozone concentration[5].
However, despite all datasets indicating a significant association between ozone exposure and circulatory system disease mortality, there were substantial differences in the exposure-response coefficients across datasets, with a maximum relative difference of 46%. Specifically, the effect estimate based on the TAP dataset was the highest (0.26%, 95% CI: 0.10%, 0.42%), whereas the CNEMC dataset yielded the lowest effect estimate (0.14%, 95% CI: 0.01%, 0.26%) with the narrowest confidence interval. Although monitoring data from fixed sites offers high accuracy, their limited spatial coverage may lead to exposure misclassification, potentially explaining smaller effect estimates[40,41]. Previous studies have also indicated that the effect estimates based on high-resolution exposure models are generally stronger. For example, one study reported a nationwide increase in ozone-attributable mortality rates of 55 per 1,000 from 2013 to 2018[10], whereas another study using simulated datasets reported an increase of 61 per 1,000 from 2013 to 2017[23]. A national comparative study revealed similar annual ozone-attributable mortality rates, but highlighted greater variability in provincial-level rates estimated from site-based data[26]. Similarly, a study in the United States showed that the association between ozone and cardiovascular disease was stronger in high-resolution exposure models[42]. These results indicate that grid-based ozone datasets derived from satellite remote sensing and machine learning simulations can provide higher spatial resolution and better reflect actual population exposure levels, which may explain the higher effect estimates from the simulation datasets[26].
The consistently low risk estimates derived from the CNEMC dataset, compared to the TAP and USTC datasets, are primarily attributed to exposure misclassification arising from the limitations of ground-based monitoring networks. The spatial representativeness of CNEMC stations, which are predominantly located in urban centers, is inherently limited[43]. As these monitors measure ambient concentrations at fixed points, they may fail to capture the spatially heterogeneous ozone levels experienced by populations in suburban and rural areas. Such monitoring networks are, by design, unable to resolve the fine-scale spatial gradients that gridded datasets, such as TAP and USTC, which integrate satellite remote sensing and land-use data, can depict more precisely. However, high-resolution gridded datasets can systematically smooth spatial variability and reduce exposure measurement error, potentially yielding higher and less biased effect estimates, as observed in previous studies[44,45].
This study also revealed marked differences in the disease burden assessments associated with ozone-related circulatory system diseases across different data sources. When using exposure-response coefficients specific to each dataset, the estimated annual excess mortality rates based on the CNEMC dataset differed by up to 1.96 and 1.85 times compared to those from the TAP and USTC datasets. Notably, despite having the highest average ozone concentration, the CNEMC dataset yielded the lowest effect estimates, resulting in the smallest disease burden assessment outcomes and the widest confidence interval range for excess deaths (up to a 26-fold span). Conversely, the TAP and USTC datasets, with lower average ozone concentrations, produced larger disease burden estimates owing to higher effect estimates and relatively narrower uncertainty ranges (approximately 4-fold span). This phenomenon suggests that the impact of the effect estimates on disease burden assessments may exceed the differences in exposure concentrations.
Further analysis shows that adopting the exposure-response coefficient from the CNEMC dataset uniformly and significantly decreases the differences between data sources, although absolute values still exhibit some discrepancies. For instance, the annual average excess mortality from the CNEMC dataset was 266 and 612 fewer than those from the TAP and USTC datasets, respectively. This underscores the fact that even with the same exposure-response coefficients, population data, and baseline mortality rates, the choice of exposure concentration data sources can significantly influence disease burden estimates. These findings highlight the importance of selecting exposure data sources for environmental health research[46,47]. Differences in spatial coverage, temporal resolution, and monitoring methods among data sources may contribute to biases in exposure assessments and consequently affect the accuracy of disease burden estimates. Future studies should integrate multisource exposure data and employ sensitivity analyses to quantify uncertainties, thereby enhancing the robustness of disease burden assessments. Policymakers should also consider the selection of data sources and their potential impact when utilizing research findings to ensure the scientific rigor and reliability of public health decisions.
This study compared the impact of different ozone exposure datasets on mortality risk estimates from circulatory system diseases using uniform health outcome data, quantified differences in effect estimates and disease burden assessments between various exposure models, and provided guidance for selecting exposure assessment methods for future air pollution health studies. However, this study had several limitations. First, the analysis was conducted at the county level, which may not fully exploit the fine spatial resolution provided by the modeled exposure data. Second, although time-series methods are commonly used to assess the health risks of pollutants, the health and exposure data employed in this study were aggregated, potentially overlooking individual-level exposure differences (such as indoor and outdoor activity patterns) and leading to biases in the exposure assessment. Finally, this study compared only three exposure datasets and did not include other developed exposure assessment models, which might have limited the comparability and representativeness of the results. Future research should consider adopting individual-level exposure assessment methods and incorporating a wider array of exposure models for comprehensive comparisons.
-
In conclusion, this study demonstrated a significant positive correlation between short-term ozone exposure and increased risk of death from circulatory diseases. This study also revealed the adverse effects of environmental ozone pollution on human health. Notably, the risk estimates and attributable mortality burdens obtained from the different exposure datasets varied significantly. This result suggests that caution should be exercised when relying on a single data source for a disease burden assessment. Uncertainty related to exposure should also be considered in health impact assessments.
These findings are important for formulating ozone control policies and conducting related public health research. First, the current air quality standards based on ground monitoring stations may underestimate population exposure levels and the corresponding health burdens. The integration of satellite remote sensing and model simulation data can provide a more comprehensive scientific basis for revising standards, formulating ozone control policies, and optimizing monitoring networks. Second, significant differences in risk estimates among the datasets support the use of sensitivity analysis and multi-dataset comparison strategies in health impact assessments to better depict and quantify uncertainty. Future studies on disease burden should focus on optimizing exposure assessment methods, integrating multiple data sources, and systematically quantifying exposure-related uncertainties to improve the accuracy and reliability of ozone health impact assessments.”
HTML
Exposure Data
Health Data
Statistical Analysis
Assessment of the Exposure-response Relationship
Study Area
Description of Health and Exposure Data
Effect Estimates
Sensitivity Analysis
Disease Burden Assessment
Authors’ Contributions Data curation, formal analysis, Investigation, Methodology, Software, Validation, Visualization, Writing – original draft, writing – review, and editing: Chaodong Long. Data curation, Methodology, Resources, Software, Writing, review, and editing: Shunshun Zhang. Data Curation and Resources: Wenjing Su. Conceptualization, writing – review, and editing: Mike Z. He. Conceptualization, Data curation, Investigation, Methodology, Writing, review, and editing: Qinghua Sun. Project administration, Resources, Supervision, Writing-review, and editing: Cheng Liu. Conceptualization, Formal analysis, funding acquisition, Methodology, Project administration, Resources, Software, Supervision, Validation, Visualization, Writing – original draft, writing – review, and editing: Tiantian Li.
&These authors contributed equally to this work.

 Quick Links
 DownLoad: