
-
Cardiovascular disease (CVD) is the leading cause of mortality worldwide[1]. The number of CVD-related deaths was approximately 19.4 million in 2021, accounting for 29% of all deaths globally[2]. In China, the incidence of CVD increases significantly with age, and its mortality rate ranks first among the causes of death for both urban and rural residents[3]. CVD development is a chronic and complex process. Arterial stiffness, as a subclinical manifestation of cardiovascular structural and functional alterations, is recognized as an independent predictor of CVD[4]. Identifying the primary risk factors for arterial stiffness is critical for early screening and prevention of CVD.
Previous studies have reported associations between major CVD risk factors and arterial stiffness, including diet[5], physical activity[6], smoking[7], and blood pressure (BP)[8]. However, findings on the association between lipids and arterial stiffness are inconsistent[9,10]. Many of these studies were cross-sectional and had small sample sizes[11,12]. Some studies have reported positive associations between total cholesterol (TC) and low-density lipoprotein cholesterol (LDL-C), and arterial stiffness[13,14], whereas others have found no association[15,16]. In addition, most studies have considered lipids at a single time point, which may fail to capture the longitudinal fluctuations in lipid exposure over time[17]. Recently, cumulative lipid exposure has emerged as a novel indicator that accurately quantifies the long-term effects of lipid burden on arterial stiffness[18].
Pulse wave velocity (PWV), the wave speed along the arterial tree, has been widely used as a marker of arterial stiffness[19]. Recently, a wearable oscillometric device was developed to measure the arterial pressure-volume index (API) and the arterial velocity-pulse index (AVI), which represent the stiffness of peripheral and central arteries, respectively[20,21]. Previous studies have confirmed that AVI and API are significantly correlated with PWV[20,22,23]. Compared with PWV, API and AVI are more convenient, easier to measure, and well suited for large-scale population studies[24].
Therefore, we used data from the Prediction for Atherosclerotic Cardiovascular Disease Risk in China (China-PAR) project, with repeated blood lipid measurements, to investigate the association between cumulative lipid exposure and arterial stiffness, as measured by API and AVI, in the general population.
-
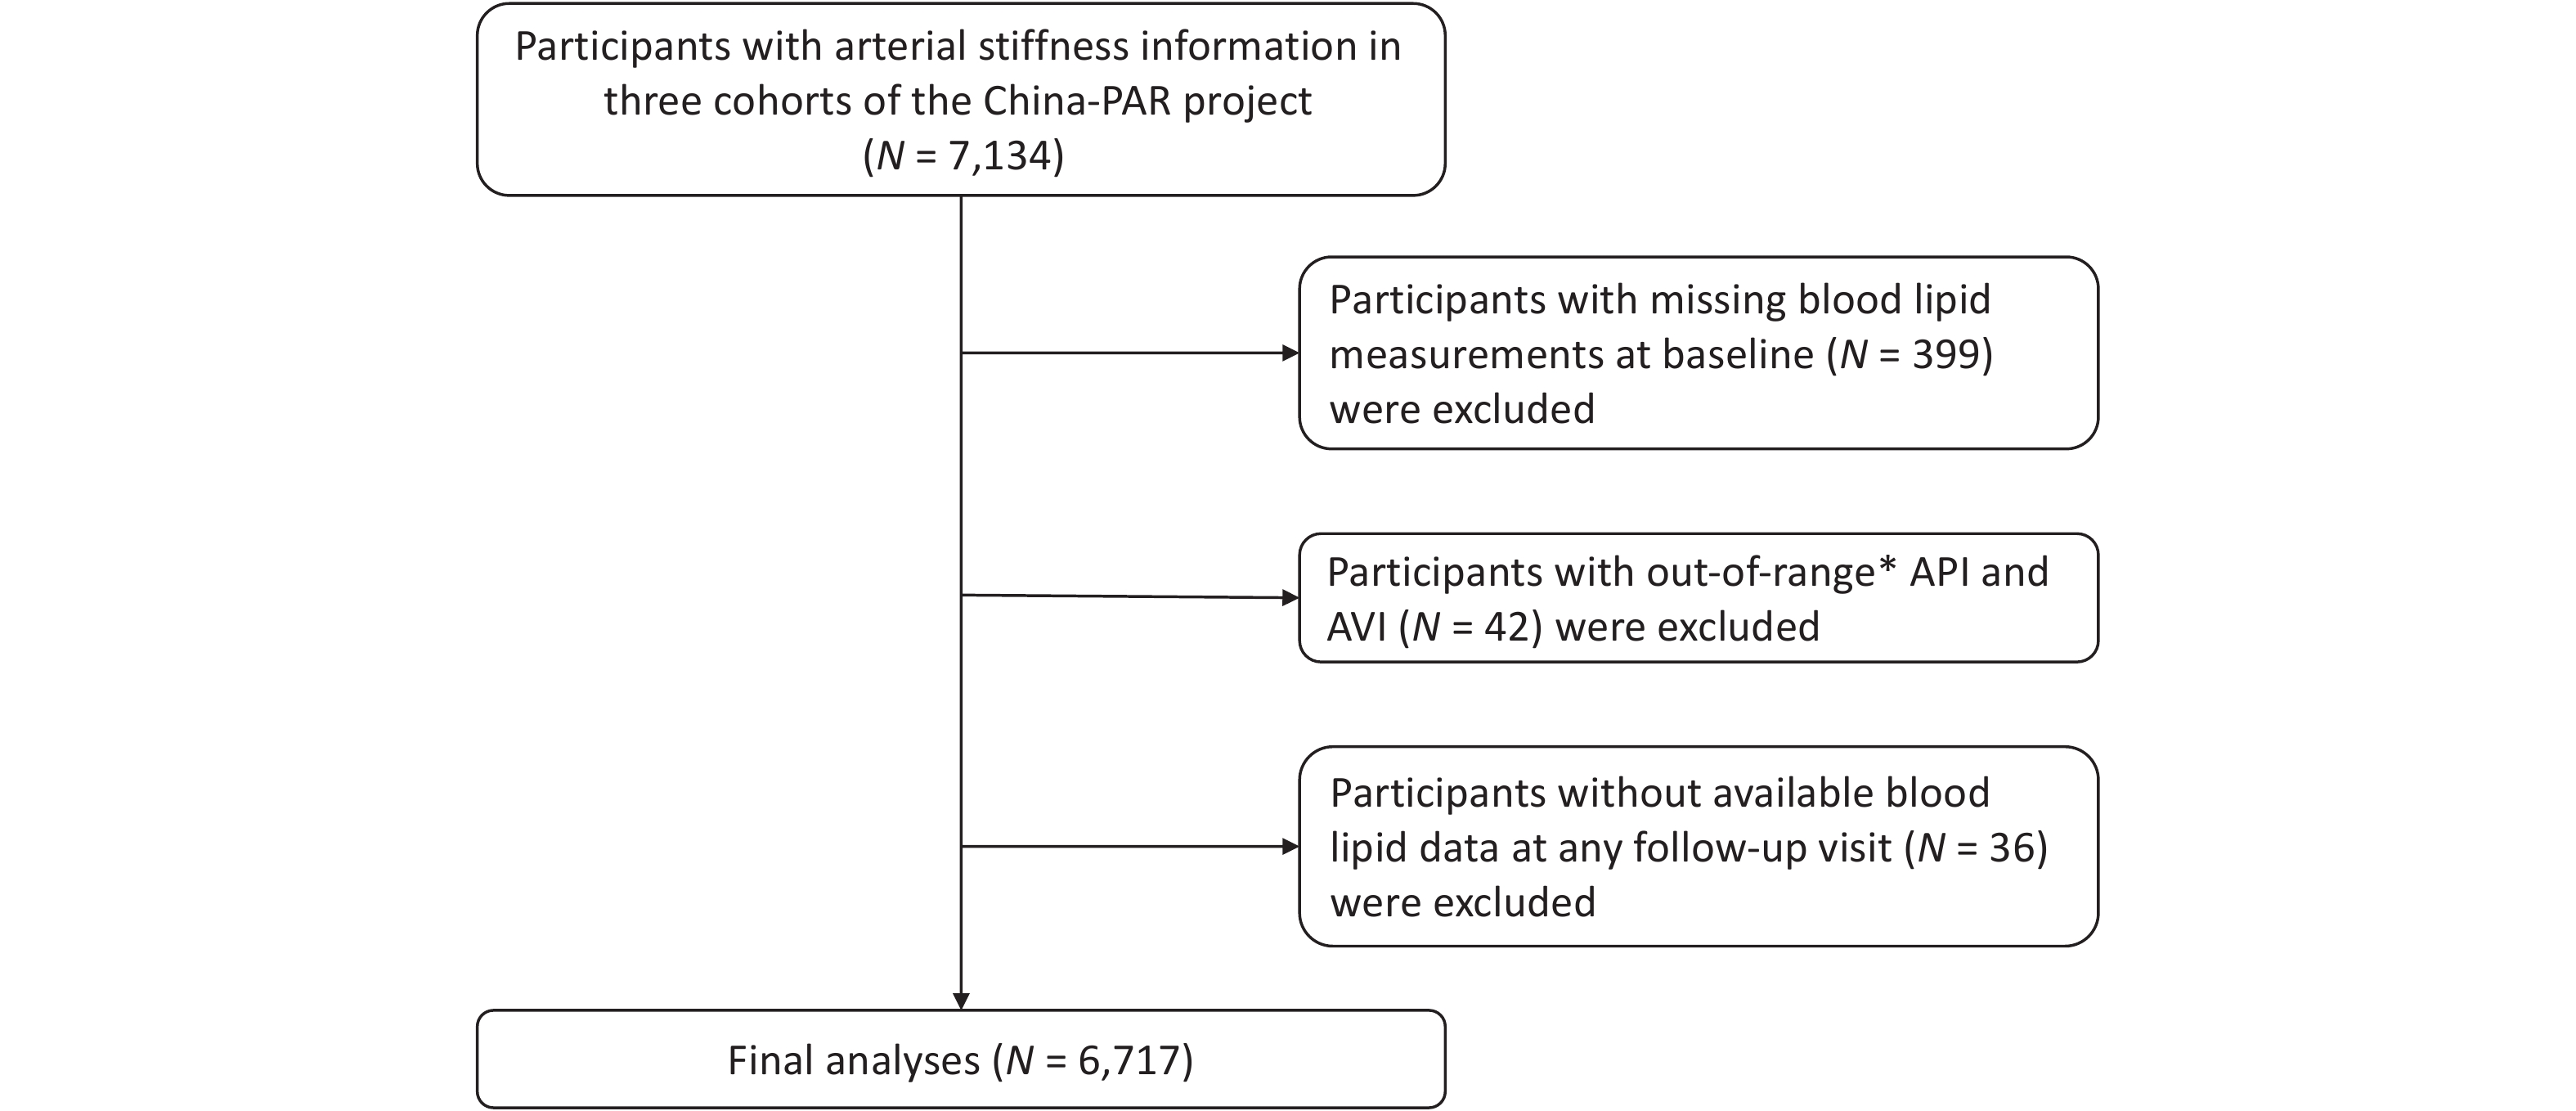
Participants were from three cohorts of the China-PAR project, including the China Multi-Center Collaborative Study of Cardiovascular Epidemiology 1998 (ChinaMUCA 1998), the International Collaborative Study of Cardiovascular Disease in Asia (InterASIA), and the Community Intervention of Metabolic Syndrome in China and Chinese Family Health Study (CIMIC). Detailed information on these cohorts has been described previously[25]. Briefly, ChinaMUCA 1998, InterASIA, and CIMIC were established in 1998, 2000–2001, and 2007–2008, respectively. According to a uniform protocol, the ChinaMUCA 1998 and InterASIA cohorts were first followed up during 2007–2008, and all three cohorts were further followed up in 2012–2015 and 2018–2020. During the 2018–2020 follow-up visit, 7,134 Chinese adults underwent API and AVI measurements. We excluded 339 participants with missing blood lipid measurements at baseline and 42 participants with out-of-range API and AVI measurements. Out-of-range values were defined as those exceeding three standard deviations after logarithmic transformation. Furthermore, to calculate cumulative lipid exposure, we excluded 36 participants without blood lipid data at any follow-up visit. Ultimately, 6,717 participants were included in the final analyses (Figure 1).
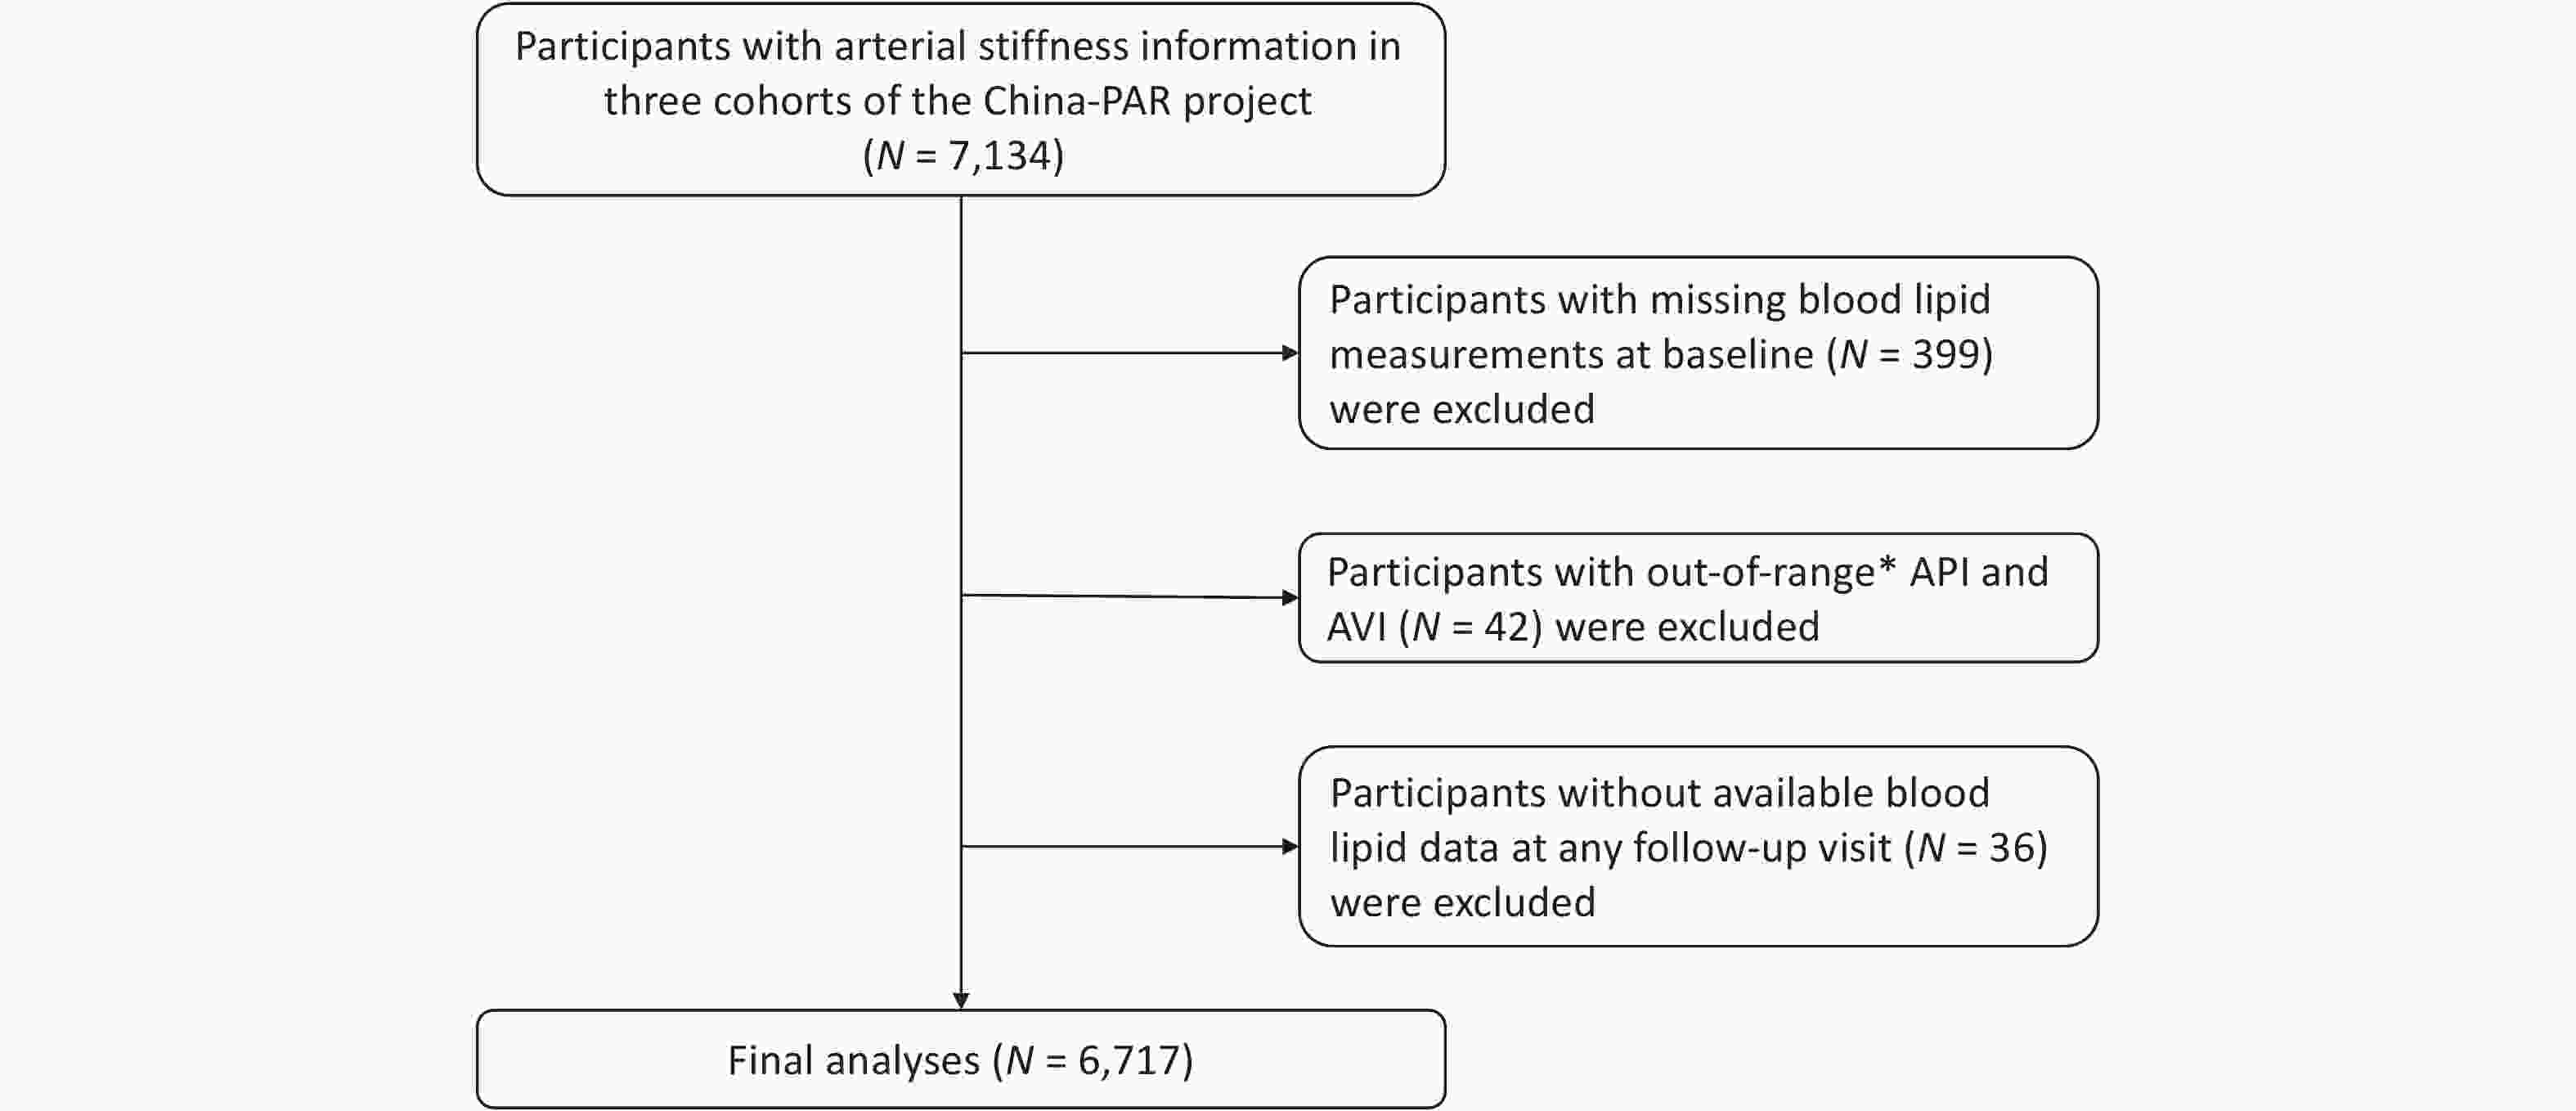
Figure 1. Flow chart of study participant selection. *Out-of-range: APIs or AVIs above three standard deviations after logarithmic transformation. China-PAR, Prediction for Atherosclerotic Cardiovascular Disease Risk in China; API, arterial pressure-volume index; AVI, arterial velocity-pulse index.
This study was approved by the Institutional Review Board of Fuwai Hospital in Beijing, and all participants provided written informed consent prior to data collection.
-
Four examinations were conducted: a baseline survey and three follow-up surveys. All participants underwent standardized questionnaires, physical examinations, and laboratory tests conducted by trained healthcare staff. The questionnaire included the following: sociodemographic characteristics (age, sex, geographic region, urban or rural residence, and educational attainment), lifestyle factors (smoking, alcohol consumption, and physical activity), and medical history (use of medication for hypertension, diabetes mellitus, and dyslipidemia). Geographic region was categorized based on participants’ residence at baseline and broadly divided along the Yangtze River into northern and southern China. Smokers were those who consumed at least 400 cigarettes or 500 g of tobacco leaves, or smoked at least one cigarette per day for 1 year. Participants who smoked at the time of the survey were defined as current smokers. Alcohol consumption was defined as having consumed alcohol at least once per week in the previous year. Ideal physical activity was defined as ≥ 150 min/week of moderate aerobic activity or ≥ 75 min/week of vigorous aerobic activity or an equivalent combination of both[26]. Body height and weight were measured for each participant while wearing light indoor clothing without shoes. Body mass index (BMI) was calculated as weight (kg) divided by height squared (m2). BP was measured as the average of three measurements after a 5-min rest. Hypertension was defined as systolic blood pressure (SBP) ≥ 140 mmHg, diastolic blood pressure ≥ 90 mmHg, or use of antihypertensive medication within the previous 2 weeks of the survey.
-
Blood samples were collected after fasting for at least 10 h. Serum glucose concentrations were measured using a modified hexokinase enzymatic method (automatic clinical analyzer, Model 7060; Hitachi, Tokyo, Japan). Diabetes mellitus was defined as fasting blood glucose ≥ 126 mg/dL or current antidiabetic treatment (insulin or oral hypoglycemic agents). Serum lipid levels, including TC, triglycerides (TG), and high-density lipoprotein cholesterol (HDL-C), were assessed enzymatically using commercially available reagents. These measurements were performed in a central laboratory that participates in the Lipid Standardization Program of the United States Centers for Disease Control and Prevention. We estimated LDL-C levels using the Martin–Hopkins method and its extended equation[27,28]. Non-HDL-C was calculated as TC minus HDL-C. Remnant cholesterol (RC) was calculated as non-HDL-C minus LDL-C, as in previous studies[29,30].
-
We used the area under the curve to estimate cumulative lipid exposure, following previous studies[31,32]. The equation for this calculation is as follows:
Cumulative lipid exposure = (value1 + value2)/2 × time1–2 + (value2 + value3)/2 × time2–3 + (value3 + value4)/2 × time3–4
Where value1, value2, value3, and value4 represent lipid values at baseline and the three follow-up visits, and time1–2, time2–3, and time3–4 represent the time intervals between consecutive visits. If data from a visit were missing, the nearest adjacent measurement was used as a substitute.
-
Trained staff measured API and AVI using a BP monitoring device (PASESA AVE-2000; Shisei Datum, Tokyo, Japan) after participants rested for 5 min. Participants were asked to avoid eating, drinking, smoking, exercising, and bathing for 30 min before the measurement. During the measurement, participants sat upright with their backs straight, and the cuff was wrapped around the left upper arm.
-
Baseline characteristics of the study participants are presented as means ± standard deviations (SDs) or medians (interquartile ranges) for continuous variables and as numbers (percentages) for categorical variables. We compared differences between men and women using Student’s t-test or the Wilcoxon rank-sum test for continuous variables and the chi-square test for categorical variables.
General linear regression models were used to assess the associations between lipid profiles and API and AVI. The residuals of this model were assessed for normality. Cumulative lipid exposure was analyzed as a continuous variable (per 1-SD increase) and as a categorical variable by quartiles, using the lowest quartile as the reference group. Three models were fitted to adjust for potential confounders. In Model 1, we adjusted for age, sex, geographical region, urban or rural residence, educational attainment, and cohort. In Model 2, we additionally adjusted for smoking status, alcohol consumption, physical activity, and follow-up duration. In Model 3, we further adjusted for BMI, hypertension, diabetes mellitus, and lipid-lowering drug use. Restricted cubic spline analyses with four knots at the 5th, 35th, 65th, and 95th percentiles were used to explore potential nonlinear dose–response relationships.
Subgroup analyses were conducted to explore potential effect modification by sex, age, hypertension, diabetes mellitus, and BMI. Differences between subgroups were assessed using the Z test[33]. Several sensitivity analyses were performed, including adjusting for covariates at the 2018–2020 visit to account for time-varying confounding factors, excluding participants using lipid-lowering drugs and those with cardiovascular disease, cancer, or chronic kidney failure at baseline. Additionally, associations were analyzed separately by cohort, and a random-effects meta-analysis was conducted to combine effect sizes across cohorts.
All analyses were performed using SAS version 9.4 (SAS Institute Inc., Cary, NC, USA) or R software (version 4.2.1; R Foundation for Statistical Computing). A two-tailed P < 0.05 was considered statistically significant.
-
Among 6,717 participants with a mean (SD) age of 51.36 (10.26) years, 2,598 (38.68%) were men (Table 1). The mean AVI and API were 22.79 ± 8.46 and 35.77 ± 10.63, respectively. Women had higher AVI and API than men (23.56 vs 21.58 and 37.13 vs 33.63, respectively; both P < 0.001). Women also had higher BMI and TC, LDL-C, HDL-C, non-HDL-C, and RC (all P < 0.05) than men. In addition, men had higher educational attainment and were more likely to be current smokers and alcohol consumers (all P < 0.001).
Characteristics Total Men Women P value No. of participants 6,717 2,598 4,119 Age, y 51.36 ± 10.26 51.29 ± 10.24 51.41 ± 10.28 0.635 Northern, n (%) 1562 (23.25) 644 (24.79) 918 (22.29) 0.018 High school or above, n (%) 827 (12.34) 494 (19.06) 333 (8.10) < 0.001 Current smokers, n (%) 1482 (22.21) 1390 (53.61) 92 (2.25) < 0.001 Alcohol consumers, n (%) 1507 (22.45) 1276 (49.11) 231 (5.61) < 0.001 Body mass index, kg/m2 23.60 ± 3.48 23.36 ± 3.32 23.75 ± 3.57 < 0.001 Hypertension, n (%) 2485 (37.00) 990 (38.11) 1495 (36.30) 0.136 Diabetes mellitus, n (%) 296 (4.77) 120 (5.04) 176 (4.61) 0.440 TC, mg/dL 178.89 ± 34.41 177.09 ± 34.39 180.03 ± 34.37 0.001 TG, mg/dL 119.00 (85.00, 173.00) 116.85 (82.15, 175.85) 120.60 (86.90, 171.10) 0.082 LDL-C, mg/dL 100.18 ± 28.74 98.81 ± 29.36 101.04 ± 28.32 0.002 HDL-C, mg/dL 53.90 ± 14.10 53.20 ± 15.03 54.34 ± 13.47 0.002 Non-HDL-C, mg/dL 125.00 ± 33.50 123.91 ± 34.84 125.69 ± 32.61 0.037 RC, mg/dL 21.97 (17.55, 28.25) 21.62 (17.05, 28.58) 22.16 (17.93, 28.14) 0.042 AVI 22.79 ± 8.46 21.58 ± 8.11 23.56 ± 8.59 < 0.001 API 35.77 ± 10.63 33.63 ± 10.13 37.13 ± 10.72 < 0.001 Note. Data are presented as means ± standard deviations or frequencies (percentages). TC, total cholesterol; TG, triglyceride; LDL-C, low-density lipoprotein cholesterol; HDL-C, high-density lipoprotein cholesterol; RC, remnant cholesterol; API, arterial pressure-volume index; AVI, arterial velocity-pulse index. Table 1. Baseline characteristics of study participants stratified by sex
-
Regarding baseline lipid levels, TG, HDL-C, and RC were significantly associated with API, whereas TC, LDL-C, and non-HDL-C were not. The multivariable-adjusted βs (95% confidence intervals [CIs]) per SD increase in TC, TG, LDL-C, HDL-C, non-HDL-C, and RC for API were −0.06 (−0.32, 0.19), 0.55 (0.29, 0.80), −0.09 (−0.35, 0.17), −0.53 (−0.81, −0.25), 0.12 (−0.14, 0.38), and 0.58 (0.32, 0.84), respectively (Supplementary Table S1). In addition, only baseline HDL-C was negatively associated with AVI (β = −0.38; 95% CI: −0.62, −0.14).
-
We investigated the effects of cumulative lipid exposure on arterial stiffness. The mean cumulative lipid exposure duration was 14.02 years. In Models 1 and 2, cumulative TC, TG, LDL-C, non-HDL-C, and RC were positively associated with API, whereas cumulative HDL-C was negatively associated (Table 2). After further adjustment for metabolic factors in model 3 (BMI, hypertension, diabetes mellitus, and lipid-lowering drug use), cumulative TG, HDL-C, and RC remained significantly associated with API, with adjusted βs (95% CIs) of 2.31 (1.53, 3.08), −1.14 (−2.24, −0.04), and 2.39 (1.52, 3.25) for the highest quartile compared with the lowest quartile, respectively. The corresponding βs (95% CIs) per SD increase were 0.69 (0.41, 0.97), −0.52 (−0.96, −0.08), and 0.75 (0.45, 1.06), respectively.
Characteristics Model 1 Model 2 Model 3 β (95% CI) P value β (95% CI) P value β (95% CI) P value Cumulative TC, mg/dL × y Quartile 1 Reference Reference Reference Quartile 2 1.13 (0.47, 1.79) 0.001 0.91 (0.24, 1.57) 0.008 0.73 (0.07, 1.38) 0.030 Quartile 3 1.16 (0.43, 1.90) 0.002 0.81 (0.05, 1.56) 0.036 0.28 (−0.47, 1.02) 0.463 Quartile 4 0.87 (−0.27, 2.02) 0.135 0.44 (−0.72, 1.60) 0.458 −1.12 (−2.35, 0.11) 0.075 Per SD increase 0.81 (0.34, 1.27) 0.001 0.57 (0.10, 1.05) 0.017 −0.15 (−0.66, 0.35) 0.546 Cumulative TG, mg/dL × y Quartile 1 Reference Reference Reference Quartile 2 1.37 (0.71, 2.02) < 0.001 1.25 (0.59, 1.90) < 0.001 0.58 (−0.08, 1.24) 0.086 Quartile 3 2.28 (1.60, 2.96) < 0.001 2.13 (1.45, 2.81) < 0.001 0.97 (0.26, 1.67) 0.007 Quartile 4 3.84 (3.11, 4.57) < 0.001 3.78 (3.05, 4.51) < 0.001 2.31 (1.53, 3.08) < 0.001 Per SD increase 1.13 (0.88, 1.38) < 0.001 1.13 (0.88, 1.38) < 0.001 0.69 (0.41, 0.97) < 0.001 Cumulative LDL-C, mg/dL × y Quartile 1 Reference Reference Reference Quartile 2 0.90 (0.24, 1.55) 0.007 0.70 (0.04, 1.36) 0.037 0.33 (−0.32, 0.98) 0.324 Quartile 3 0.71 (0.01, 1.42) 0.048 0.45 (−0.26, 1.16) 0.219 −0.09 (−0.80, 0.63) 0.813 Quartile 4 1.05 (0.06, 2.04) 0.038 0.73 (−0.26, 1.73) 0.148 −0.98 (−2.05, 0.09) 0.073 Per SD increase 0.58 (0.22, 0.94) 0.001 0.45 (0.09, 0.81) 0.013 −0.27 (−0.66, 0.12) 0.171 Cumulative HDL-C, mg/dL × y Quartile 1 Reference Reference Reference Quartile 2 −0.43 (−1.08, 0.23) 0.201 −0.65 (−1.30, 0.01) 0.054 −0.06 (−0.71, 0.60) 0.864 Quartile 3 −1.24 (−1.97, −0.52) 0.001 −1.60 (−2.33, −0.87) < 0.001 −0.54 (−1.28, 0.19) 0.147 Quartile 4 −2.25 (−3.29, −1.20) < 0.001 −2.77 (−3.82, −1.71) < 0.001 −1.14 (−2.24, −0.04) 0.042 Per SD increase −1.08 (−1.47, −0.70) < 0.001 −1.32 (−1.71, −0.93) < 0.001 −0.52 (−0.96, −0.08) 0.021 Cumulative non-HDL-C, mg/dL × y Quartile 1 Reference Reference Reference Quartile 2 1.26 (0.61, 1.91) < 0.001 1.13 (0.47, 1.78) 0.001 0.63 (−0.03, 1.28) 0.060 Quartile 3 1.54 (0.83, 2.25) < 0.001 1.33 (0.61, 2.05) < 0.001 0.26 (−0.47, 0.98) 0.484 Quartile 4 2.40 (1.39, 3.42) < 0.001 2.13 (1.10, 3.15) < 0.001 −0.16 (−1.27, 0.95) 0.776 Per SD increase 1.09 (0.72, 1.46) < 0.001 0.97 (0.60, 1.34) < 0.001 0.05 (−0.35, 0.45) 0.804 Cumulative RC, mg/dL × y Quartile 1 Reference Reference Reference Quartile 2 1.49 (0.84, 2.14) < 0.001 1.29 (0.63, 1.94) < 0.001 0.49 (−0.17, 1.15) 0.144 Quartile 3 2.38 (1.68, 3.08) < 0.001 2.20 (1.49, 2.90) < 0.001 0.97 (0.24, 1.70) 0.009 Quartile 4 4.35 (3.54, 5.16) < 0.001 4.23 (3.42, 5.05) < 0.001 2.39 (1.52, 3.25) < 0.001 Per SD increase 1.30 (1.03, 1.58) < 0.001 1.28 (1.01, 1.56) < 0.001 0.75 (0.45, 1.06) < 0.001 Note. Model 1: adjusted for age, sex, region, urban or rural residence, educational attainment, and cohort; Model 2: model 1 + smoking status, alcohol consumption, physical activity, and follow-up duration; and Model 3: model 2 + body mass index, hypertension, diabetes mellitus, and lipid-lowering drug use. API, arterial pressure-volume index; CI, confidence interval; TC, total cholesterol; TG, triglyceride; LDL-C, low-density lipoprotein cholesterol; HDL-C, high-density lipoprotein cholesterol; RC, remnant cholesterol. Table 2. Associations between cumulative lipid exposure and API
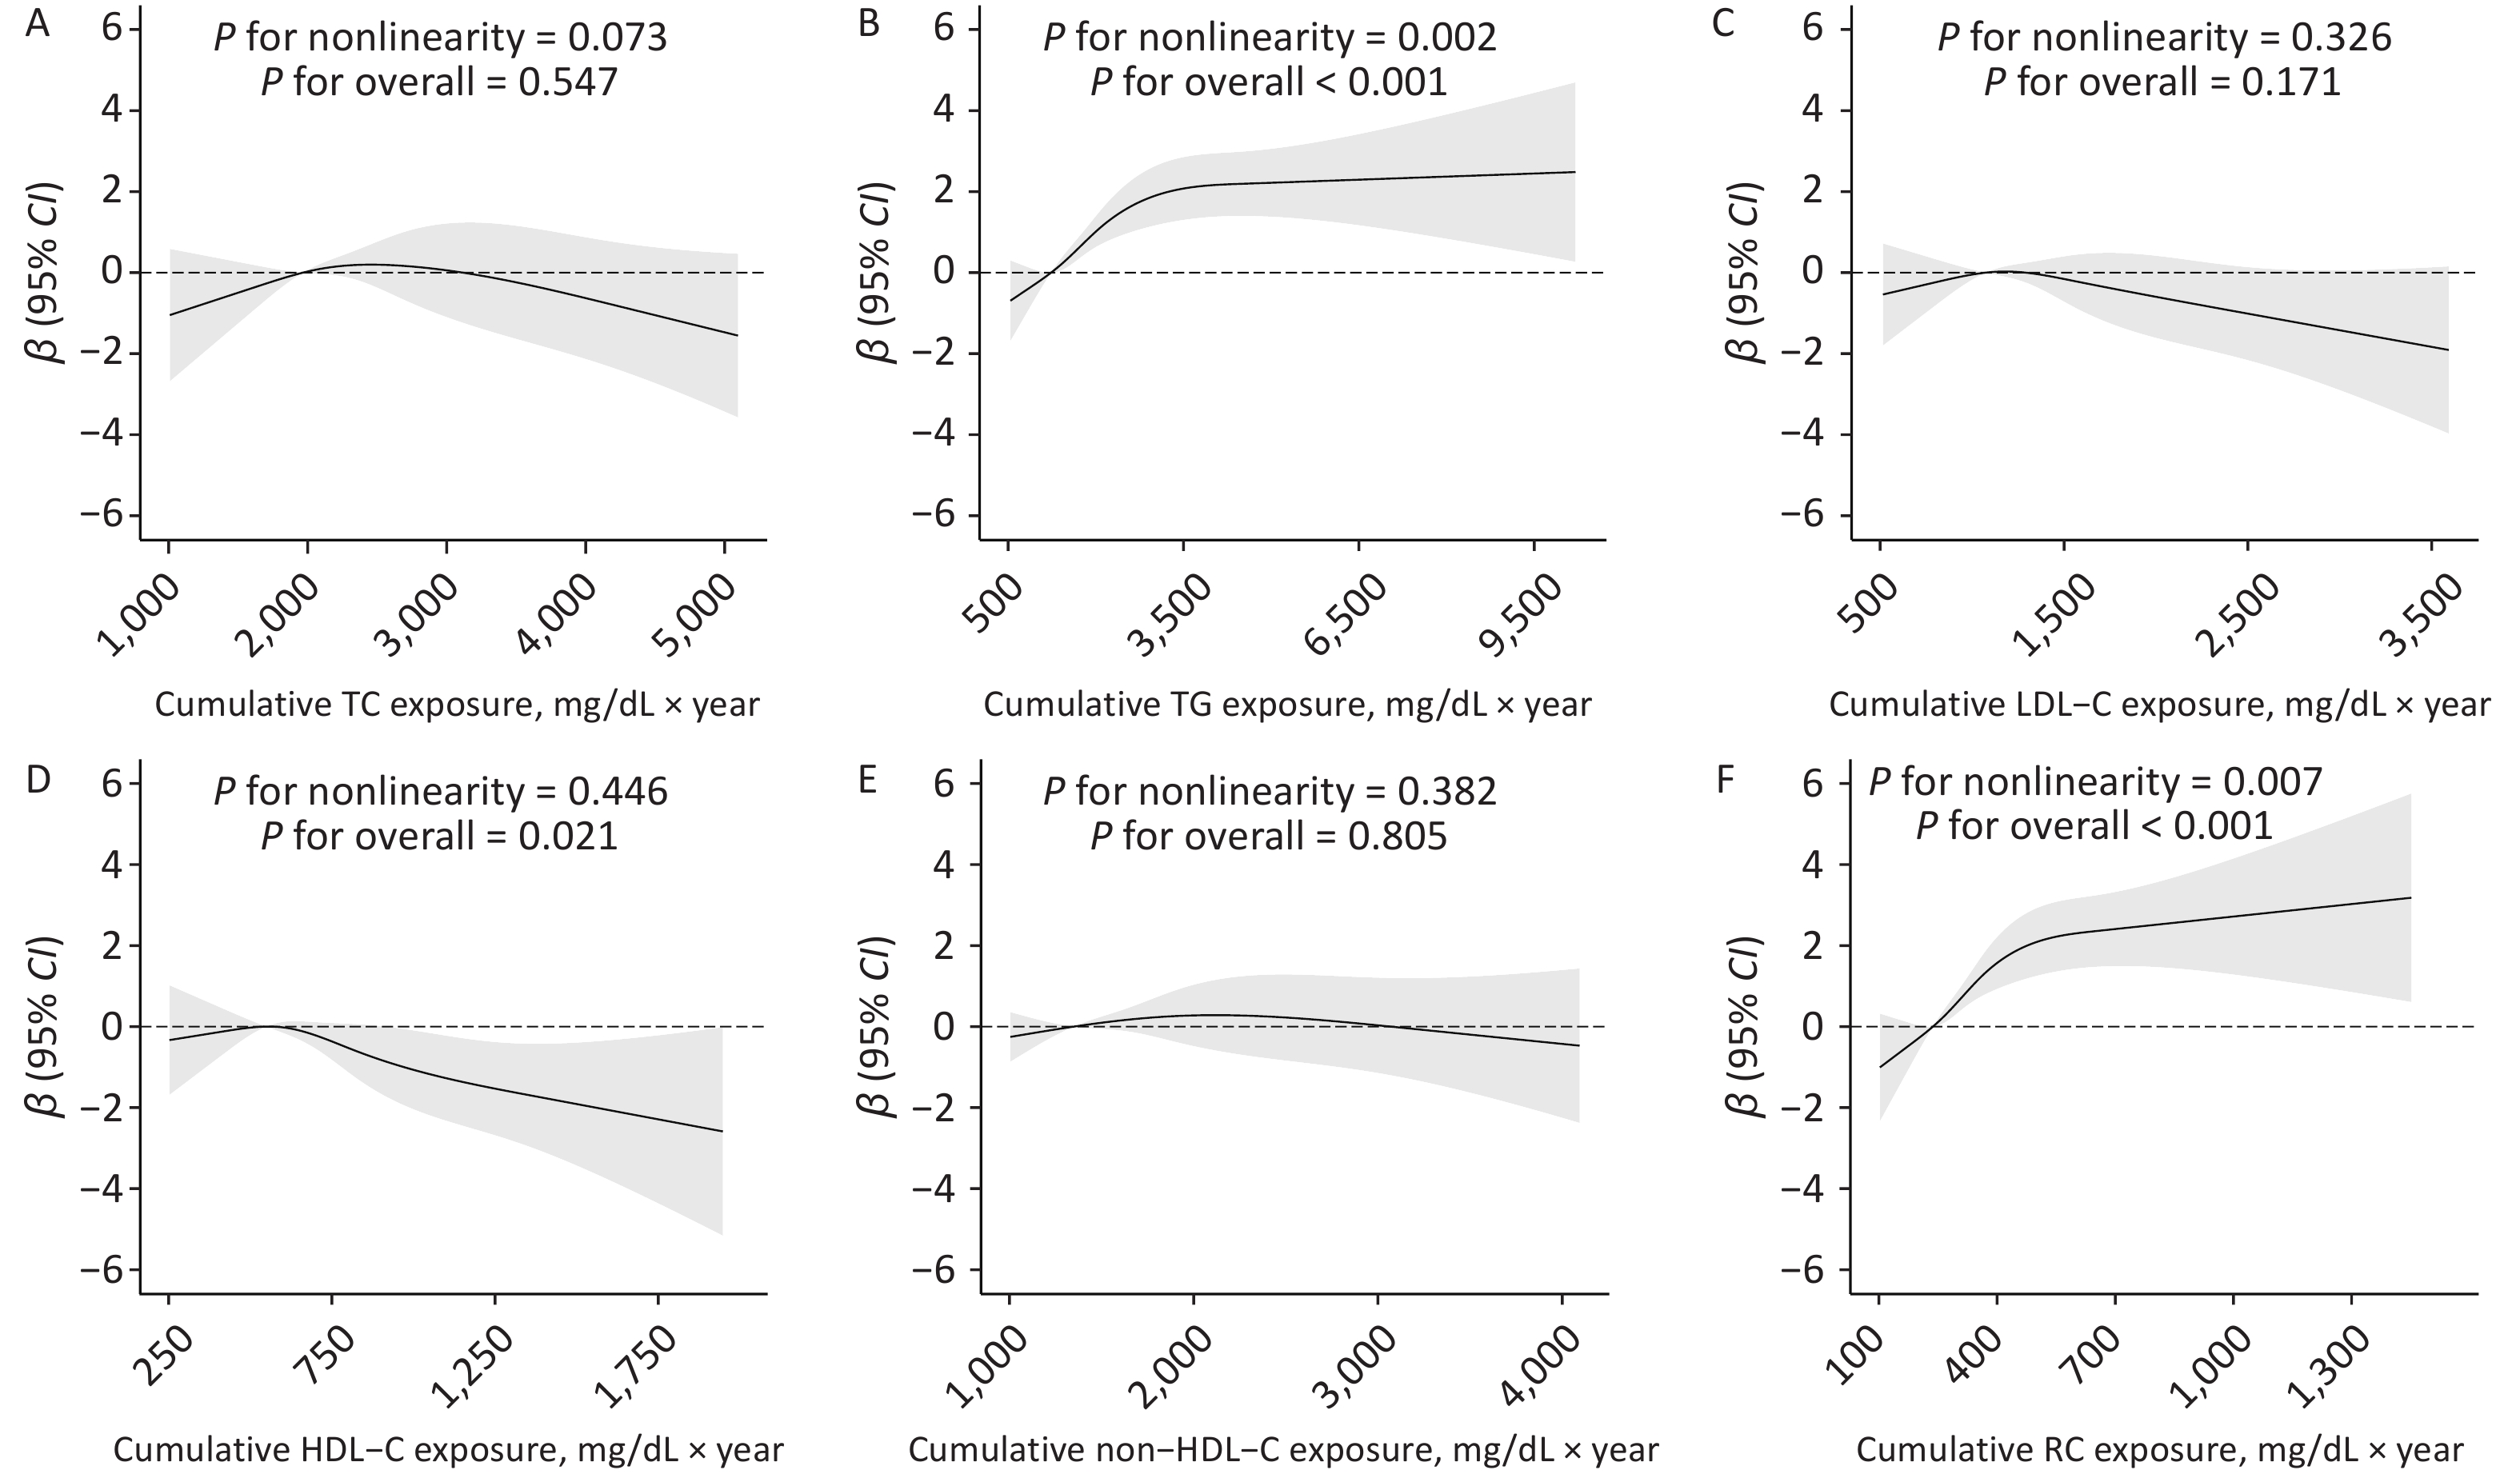
For AVI, only cumulative HDL-C showed a negative association, with a β (95% CI) of −1.16 (−2.12, −0.21) for the highest quartile compared with the lowest quartile. However, the association per SD increase in cumulative HDL-C did not reach statistical significance, with a β (95% CI) of −0.26 (−0.64, 0.12). No significant associations were found for other lipid parameters (Table 3). Restricted cubic spline analyses indicated nonlinear dose–response relationships of cumulative TG and RC with API (P for nonlinearity = 0.002 and 0.007, respectively) (Figures 2B and 2F). In addition, we observed a linear dose–response relationship between HDL-C and API (P for overall linearity = 0.021; Figure 2D), whereas a nonlinear association was observed for AVI (P for nonlinearity = 0.018; Supplementary Figure S1).
Characteristics Model 1 Model 2 Model 3 β (95% CI) P value β (95% CI) P value β (95% CI) P value Cumulative TC, mg/dL × y Quartile 1 Reference Reference Reference Quartile 2 −0.34 (−0.90, 0.22) 0.240 −0.44 (−1.01, 0.13) 0.129 −0.51 (−1.08, 0.06) 0.078 Quartile 3 −0.44 (−1.07, 0.19) 0.167 −0.53 (−1.18, 0.11) 0.104 −0.56 (−1.20, 0.09) 0.091 Quartile 4 0.06 (−0.92, 1.03) 0.910 −0.05 (−1.04, 0.95) 0.927 −0.02 (−1.09, 1.05) 0.973 Per SD increase −0.23 (−0.63, 0.17) 0.254 −0.29 (−0.69, 0.12) 0.166 −0.35 (−0.79, 0.09) 0.116 Cumulative TG, mg/dL × y Quartile 1 Reference Reference Reference Quartile 2 0.26 (−0.30, 0.82) 0.364 0.18 (−0.39, 0.74) 0.535 0.20 (−0.37, 0.78) 0.491 Quartile 3 −0.35 (−0.93, 0.24) 0.244 −0.45 (−1.04, 0.14) 0.135 −0.47 (−1.08, 0.15) 0.135 Quartile 4 0.14 (−0.49, 0.76) 0.672 −0.03 (−0.66, 0.60) 0.932 −0.02 (−0.70, 0.65) 0.947 Per SD increase 0.01 (−0.21, 0.22) 0.934 −0.04 (−0.25, 0.18) 0.727 −0.09 (−0.33, 0.16) 0.494 Cumulative LDL-C, mg/dL × y Quartile 1 Reference Reference Reference Quartile 2 −0.05 (−0.61, 0.51) 0.863 −0.09 (−0.65, 0.48) 0.760 −0.13 (−0.70, 0.43) 0.641 Quartile 3 −0.40 (−1.01, 0.20) 0.188 −0.42 (−1.03, 0.19) 0.173 −0.41 (−1.03, 0.21) 0.192 Quartile 4 −0.45 (−1.29, 0.39) 0.296 −0.46 (−1.31, 0.39) 0.290 −0.39 (−1.32, 0.54) 0.407 Per SD increase −0.10 (−0.40, 0.21) 0.533 −0.11 (−0.42, 0.20) 0.482 −0.12 (−0.45, 0.22) 0.491 Cumulative HDL-C, mg/dL × y Quartile 1 Reference Reference Reference Quartile 2 −0.51 (−1.07, 0.05) 0.075 −0.53 (−1.09, 0.03) 0.064 −0.58 (−1.14, −0.01) 0.046 Quartile 3 −1.00 (−1.62, −0.39) 0.001 −1.03 (−1.66, −0.41) 0.001 −1.12 (−1.76, −0.48) 0.001 Quartile 4 −1.18 (−2.07, −0.28) 0.010 −1.27 (−2.18, −0.37) 0.006 −1.16 (−2.12, −0.21) 0.017 Per SD increase −0.15 (−0.48, 0.18) 0.367 −0.18 (−0.52, 0.15) 0.289 −0.26 (−0.64, 0.12) 0.180 Cumulative non-HDL-C, mg/dL × y Quartile 1 Reference Reference Reference Quartile 2 −0.19 (−0.75, 0.37) 0.499 −0.26 (−0.82, 0.31) 0.370 −0.30 (−0.87, 0.27) 0.300 Quartile 3 −0.32 (−0.93, 0.28) 0.297 −0.37 (−0.99, 0.24) 0.235 −0.41 (−1.04, 0.22) 0.204 Quartile 4 −0.27 (−1.14, 0.60) 0.543 −0.32 (−1.19, 0.56) 0.478 −0.47 (−1.43, 0.49) 0.334 Per SD increase −0.12 (−0.43, 0.20) 0.467 −0.15 (−0.46, 0.17) 0.370 −0.18 (−0.53, 0.16) 0.298 Cumulative RC, mg/dL × y Quartile 1 Reference Reference Reference Quartile 2 0.13 (−0.43, 0.69) 0.648 0.04 (−0.52, 0.60) 0.893 −0.00 (−0.58, 0.57) 0.993 Quartile 3 −0.11 (−0.71, 0.50) 0.727 −0.24 (−0.85, 0.37) 0.447 −0.20 (−0.83, 0.44) 0.546 Quartile 4 0.07 (−0.62, 0.77) 0.839 −0.11 (−0.82, 0.59) 0.751 −0.20 (−0.95, 0.56) 0.605 Per SD increase −0.03 (−0.27, 0.20) 0.779 −0.09 (−0.32, 0.15) 0.482 −0.14 (−0.41, 0.12) 0.285 Note. Model 1: adjusted for age, sex, region, urban or rural residence, educational attainment, and cohort; Model 2: model 1 + smoking status, alcohol consumption, physical activity, and follow-up duration; and Model 3: model 2 + body mass index, hypertension, diabetes mellitus, and lipid-lowering drug use. AVI, arterial velocity-pulse index; CI, confidence interval; TC, total cholesterol; TG, triglyceride; LDL-C, low-density lipoprotein cholesterol; HDL-C, high-density lipoprotein cholesterol; RC, remnant cholesterol. Table 3. Associations between cumulative lipid exposure and AVI
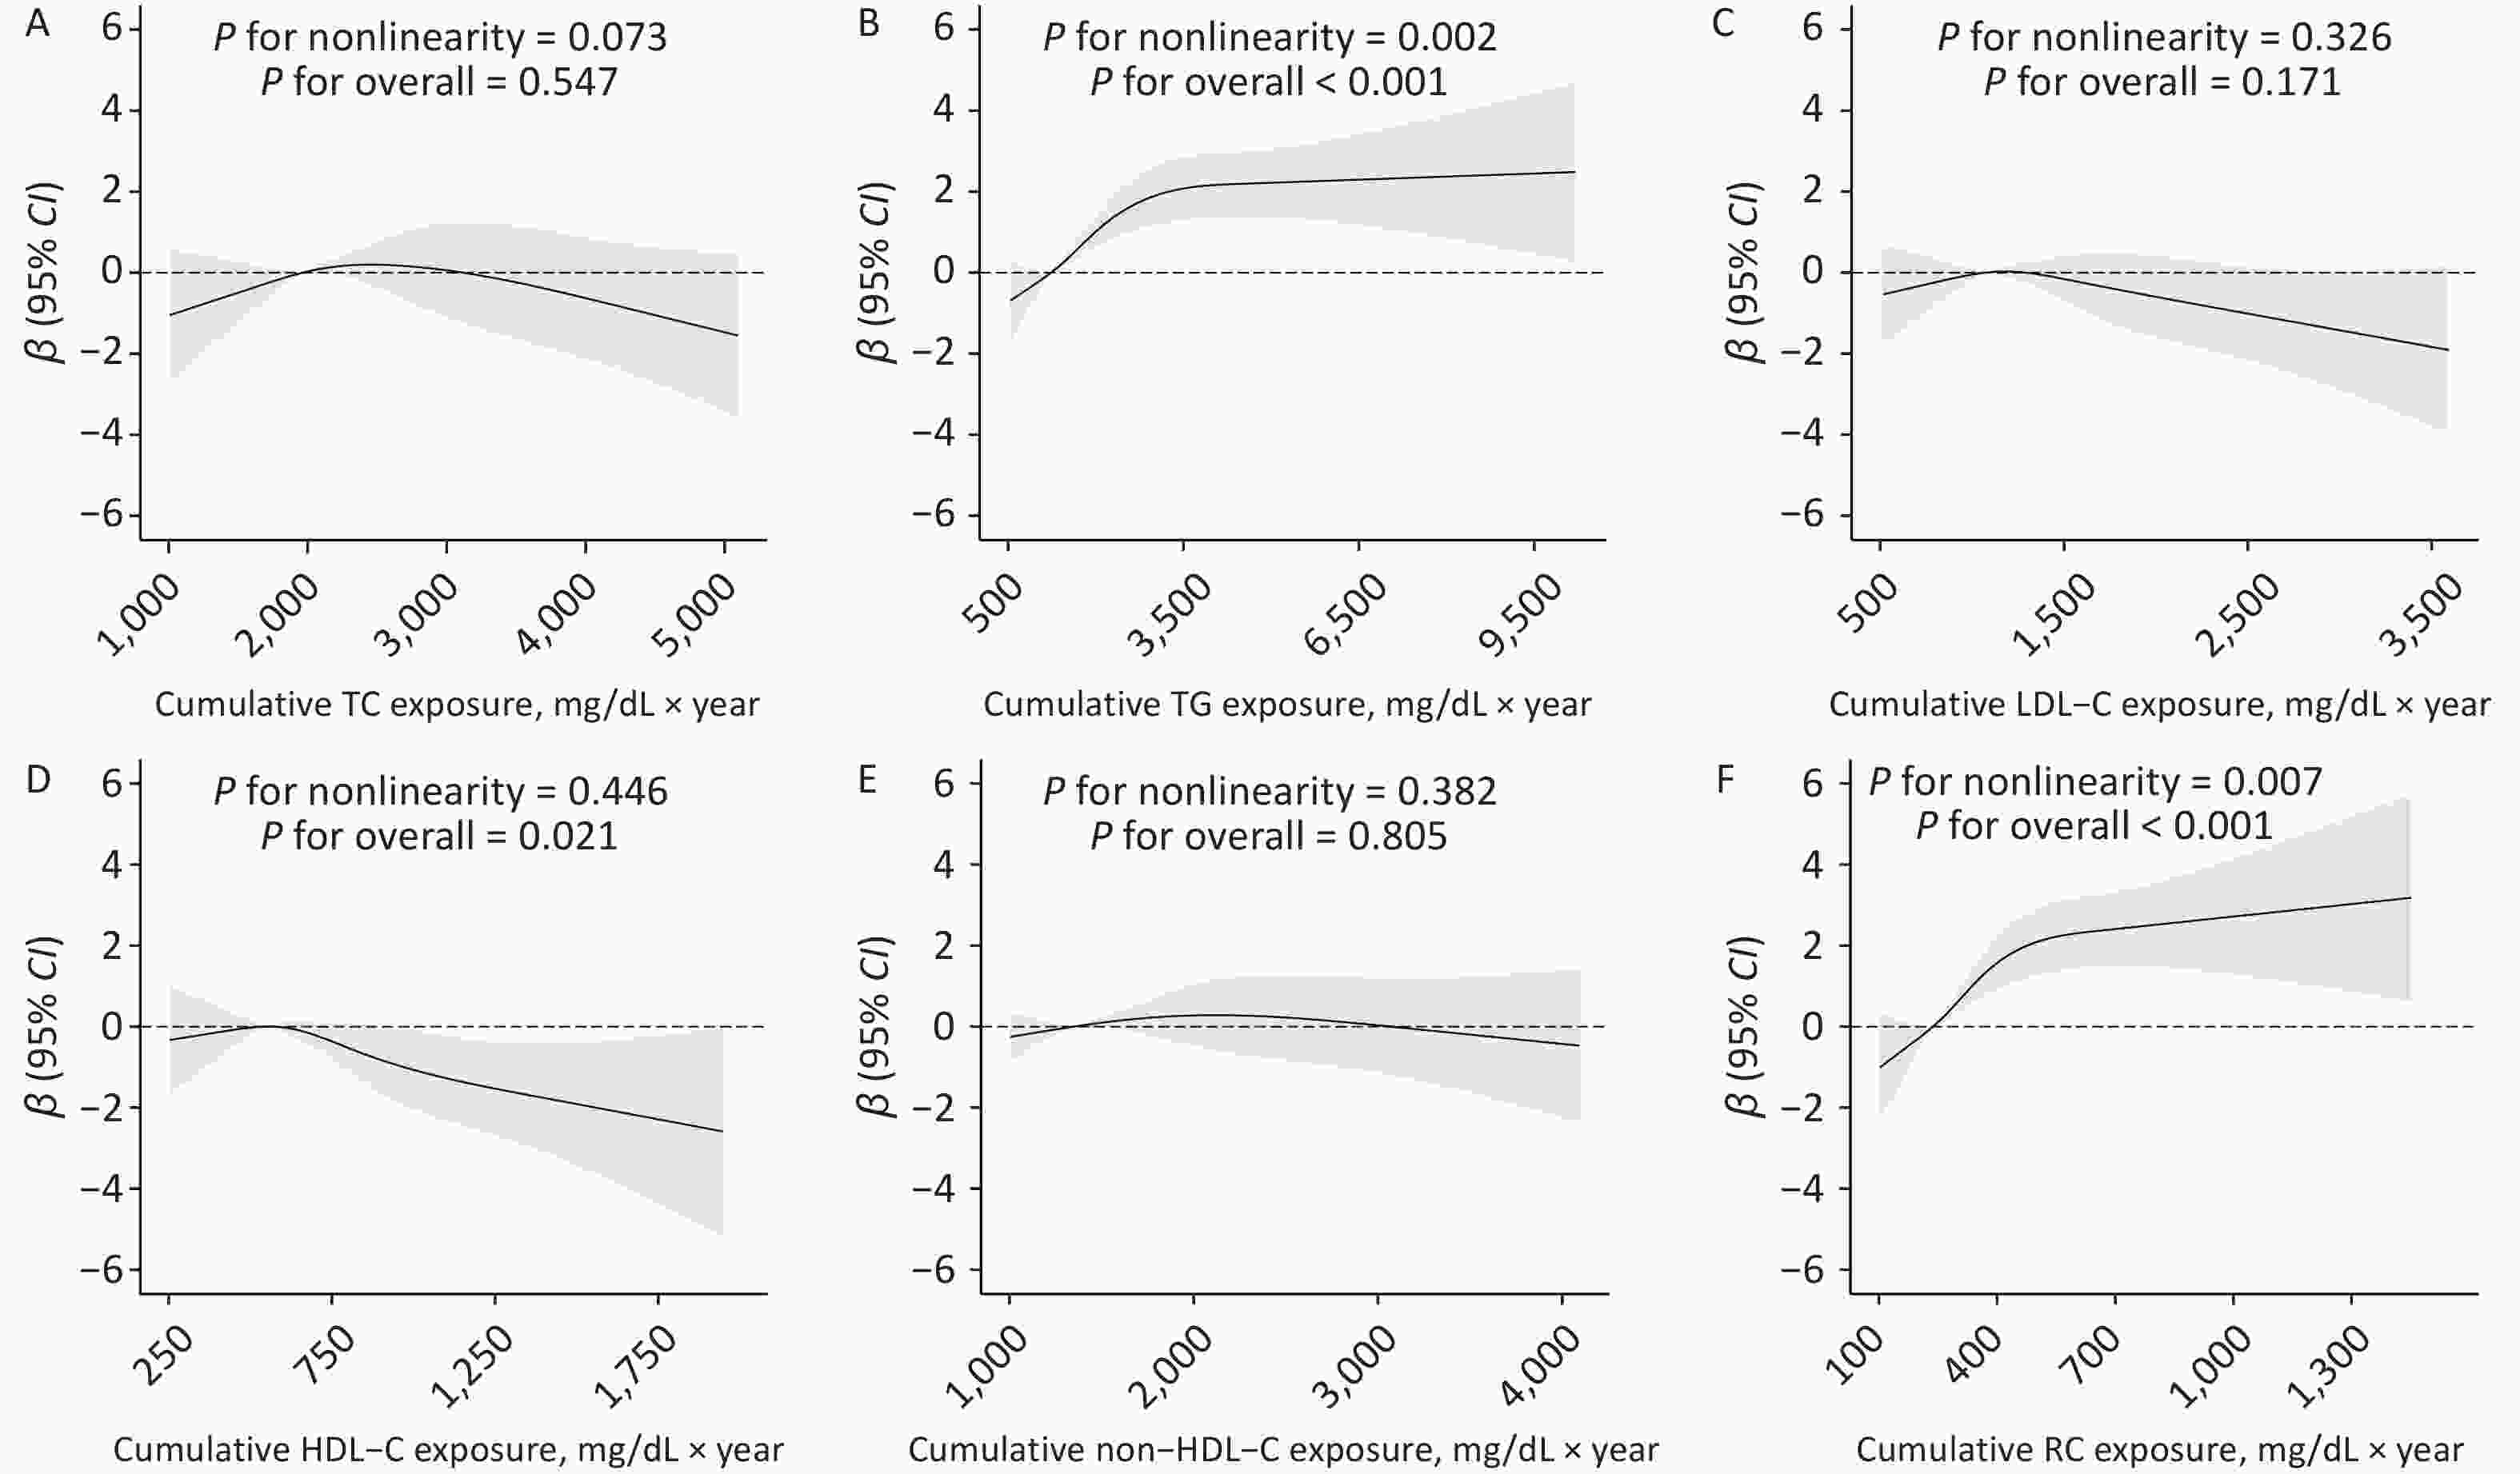
Figure 2. Dose–response associations between cumulative lipid exposure and API. Adjusted for age, sex, region, urban or rural residence, educational attainment, cohort, smoking status, alcohol consumption, physical activity, follow-up duration, body mass index, hypertension, diabetes mellitus, and lipid-lowering drug use. API, arterial pressure-volume index; CI, confidence interval; TC, total cholesterol; TG, triglyceride; LDL-C, low-density lipoprotein cholesterol; HDL-C, high-density lipoprotein cholesterol; RC, remnant cholesterol.
-
Supplementary Figures S2–S7 present the results of subgroup analyses for the associations between cumulative lipid exposure and API and AVI. The associations were generally consistent across several subgroups. Cumulative TG was more strongly associated with API in participants aged ≥ 60 years than in those aged < 60 years (β = 1.57 vs. β = 0.57; P for interaction = 0.045). A similar pattern was observed for cumulative RC (β = 1.57 vs. β = 0.63), although the difference between groups was not statistically significant. To assess the robustness of our results, we conducted several sensitivity analyses. Overall, no substantial changes were observed in the associations between cumulative lipid exposure and arterial stiffness across the various analyses. For instance, adjusting for covariates at the 2018–2020 visit did not substantially influence the results (Supplementary Table S2). In addition, the results remained stable after excluding participants using lipid-lowering drugs or those with chronic diseases (CVD, cancer, and chronic kidney failure) (Supplementary Tables S3–S4). Furthermore, separate analyses were conducted by cohort, followed by a meta-analysis to synthesize the results. Similar results were obtained (Supplementary Table S5).
-
We comprehensively investigated the cumulative effects of lipid profiles on arterial stiffness. Cumulative TG and RC were positively associated with peripheral arterial stiffness, as measured by API, whereas cumulative HDL-C was negatively associated. Only cumulative HDL-C levels showed a significant inverse association with central arterial stiffness as measured by AVI. These results provide new evidence supporting the long-term cumulative effects of lipid profiles on subclinical indicators of CVD.
Several studies have investigated the association between lipids and arterial stiffness; however, the results have been inconsistent[9-12,34]. For instance, a cross-sectional study of 4,653 individuals from the general population in China found that TG, TC, LDL-C, and RC were significantly associated with arterial stiffness, as measured by brachial–ankle PWV (baPWV)[12]. In addition, a study using machine learning to predict arterial stiffness in coal miners found that TG was a predictor of arterial stiffness[35]. However, another community-based cross-sectional study of 2,357 adults found no significant association between TC and TG and arterial stiffness measured by carotid–femoral PWV (cfPWV) and carotid–radial PWV (crPWV)[9]. These discrepancies may stem from differences in population characteristics, study design, sample size, quantification of arterial stiffness, and quality control of lipid measurements. Moreover, most previous studies have focused only on baseline lipid levels without considering long-term fluctuations.
The current study incorporated a population-based cohort of Chinese adults, assessed both central and peripheral arterial stiffness using AVI and API, and applied stringent quality control for lipid measurements. More importantly, we accounted for long-term lipid fluctuations and estimated cumulative lipid exposure using up to four repeated measurements over a mean duration of 14.02 years, and found that cumulative TG and RC were associated with API, whereas HDL-C was negatively associated with both API and AVI. Cumulative lipid exposure remained strongly associated with arterial stiffness after adjustment for baseline lipid levels, indicating that it affects arterial stiffness independently of baseline levels. These design and methodological strengths enhance the robustness of our findings. Important pathophysiological differences exist between atherosclerosis and arterial stiffness. Arterial stiffness mainly reflects structural and functional alterations in the arterial media[4], whereas atherosclerosis mainly involves intimal inflammatory responses and the formation of lipid plaques[36]. In our study, we did not find significant associations between TC or LDL-C and arterial stiffness, consistent with most previous findings[15,16]. This may be explained by the predominant role of TC and LDL-C in atheromatous plaque development[37] rather than in the pathogenesis of arterial stiffening.
We specifically investigated the differential effects of lipid profiles on arterial stiffness in peripheral and central arteries. We used API and AVI to reflect the stiffness of the peripheral and central arteries, respectively. Our results showed that the association between lipid profiles and peripheral and central arterial stiffness differed. Long-term cumulative TG and RC were associated with increased peripheral arterial stiffness but not central arterial stiffness. However, the underlying causes of this difference remain unclear. Central and peripheral arteries may exhibit differences in their vascular structure and functional properties. Structurally, central arteries are rich in elastic fibers, making them more susceptible to long-term hemodynamic stress and age-related structural remodeling, whereas peripheral arteries are primarily composed of collagen fibers and vascular smooth muscle cells[36,38]. Functionally, given the high proportion of smooth muscle cells in peripheral arteries, arterial stiffening in these vessels may primarily result from functional alterations caused by increased vascular smooth muscle tension[39]. Future studies are needed to clarify the roles of these mechanisms. Our findings emphasize the importance of considering distinct mechanisms when evaluating the effects of lipid exposure on arterial stiffness in different arterial segments.
Notably, cumulative exposure to TG and RC remained strongly associated with arterial stiffness even after adjustment for baseline lipid levels. The adjusted β-values of 2.31 (TG), 2.39 (RC), and −1.14 (HDL-C) for the highest versus lowest quartiles corresponded to approximately 21.73%, 22.48%, and 10.72% of the standard deviation of API in our study population. According to a previous observational study, a one-unit increase in API was associated with SBP (β = 0.531) and the Framingham cardiovascular risk score (β = 0.379)[21]. Using these estimates, elevated lipid levels would translate to an approximate increase in BP of up to 2.4 mmHg. These findings underscore the importance of long-term management of TG and RC, together with HDL-C, as part of a life-course approach to preserving vascular health.
The mechanisms underlying the association between TG, RC, and arterial stiffness have not been fully elucidated. RC refers to the cholesterol content of triglyceride-rich lipoproteins, including very low-density lipoproteins and chylomicron remnants[40]. Because of their larger size, remnant particles may more easily infiltrate the arterial wall than LDL-C particles, thereby promoting lipid deposition in the subendothelial space[41]. Moreover, elevated RC levels have been identified as a risk factor for endothelial dysfunction and low-grade inflammation, which may accelerate arterial aging[41,42]. RC and TG are components of the same lipoproteins, and their concentrations are highly correlated because they share common metabolic pathways[43]. The specific association of TG and RC with API alone may reflect structural differences in arterial walls. Peripheral arteries, which contain abundant collagen and vascular smooth muscle cells (VSMCs) but few elastic fibers, are uniquely vulnerable to TG/RC-induced VSMC dysfunction and collagen remodeling, potentially increasing susceptibility to lipid-induced inflammation and oxidative stress[9,38]. Although the precise mechanisms by which TG and RC contribute to arterial stiffness remain unclear, the strong relationship between these lipids highlights the need for further research to better understand how they drive arterial stiffening independently and synergistically. We also observed that the association between cumulative TG and API appeared stronger in participants aged ≥ 60 years compared with those < 60 years (P = 0.045). This suggests that older adults may be more susceptible to the adverse vascular effects of long-term elevated lipid levels, possibly due to age-related declines in vascular compensatory mechanisms, such as elastin degradation and endothelial impairment[38,44].
Our study has several strengths, including a relatively large sample size with stringent quality control, a long follow-up duration, and repeated blood lipid measurements to construct cumulative exposure indices, allowing more accurate quantification of the effects of long-term lipid exposure on arterial stiffness. Furthermore, arterial stiffness was evaluated in two central and peripheral dimensions, revealing potential heterogeneity in lipid-related vascular effects across different arterial segments. Finally, we simultaneously examined six lipid indicators and compared their differential associations with arterial stiffness, which helped to elucidate the potential etiological links between lipid metabolism and both central and peripheral arterial changes.
However, this study had certain limitations. First, arterial stiffness information was collected during the 2018–2020 follow-up visits; thus, baseline arterial stiffness and its progression over time were not considered in this study. Second, while we considered cumulative exposure to lipids, the cumulative effects of other risk factors changing over time were not accounted for. Third, AVI and API are derived from oscillometric BP waveforms. Their precision may be limited compared with directly measured hemodynamic parameters, and their reliability requires further validation. Finally, although we adjusted for various sociodemographic and lifestyle factors to minimize residual confounding, the possibility of residual confounding cannot be completely ruled out.
-
The present study found that long-term cumulative TG and RC were positively associated with peripheral arterial stiffness but not with central arterial stiffness, and cumulative HDL-C was negatively associated with both peripheral and central arterial stiffness, highlighting the importance of maintaining optimal lipid levels. These findings may have implications for primary prevention of arterial stiffness and CVD through lipid management.
HTML
Study Population
Data Collection and Covariate Definitions
Laboratory Methods
Calculation of Cumulative Lipid Exposure
Measurement of Arterial Stiffness
Statistical Analyses
Study Population Characteristics
Association of Baseline Lipid Levels and Arterial Stiffness
Association of Cumulative Lipid Exposure and Arterial Stiffness
Subgroup and Sensitivity Analyses
Competing Interests The authors declare that they have no competing interests.
Ethics This study was approved by the Institutional Review Board and Ethics Committee of Fuwai Hospital, Beijing (Approval No. 2022-1665) and all participants provided written informed consent before data collection.
Authors’ Contributions Study design, investigation and data curation, original draft: Bingqing Kou; Study design, investigation and data curation, review and editing: Yifan Zang; Data curation, review and editing: Bisen Liu; Study design, data curation, original draft: Yijin Pei; Study design, investigation and data curation, review and editing: Chong Shen; Investigation and data curation: Jianxin Li, Fangchao Liu, Jie Cao and Shufeng Chen; Study design, investigation and data curation: Jianfeng Huang; Study design, investigation and data curation, implementation, funding acquisition: Dongfeng Gu; Study design, data curation, review and editing: Tong Wang; Study design, data curation, review and editing: Keyong Huang; Study design, investigation and data curation, implementation, funding acquisition, review and editing: Xiangfeng Lu.
&These authors contributed equally to this work.

 Quick Links
 DownLoad: