
-
Chronic obstructive pulmonary disease (COPD) ranks as the fourth-leading cause of mortality both globally and in China[1,2]. In 2021, COPD accounted for 1.285 million deaths in China, representing 34.6% of the global COPD-related mortality[3]. Although tobacco smoking is the predominant risk factor for COPD, the role of long-term exposure to air pollution has attracted increasing attention[4].
With the effective implementation of the “Air Pollution Prevention and Control Action Plan,” ambient concentrations of fine particulate matter (PM2.5) in China have decreased significantly, with a reduction of 45.4% reported nationwide[5]. In contrast, the national average concentration of ground-level ozone has increased markedly at an annual rate of 2.49 μg/m3. As a result, ozone has surpassed PM2.5 as the primary pollutant affecting urban air quality in China[6,7].
According to the 2021 Global Burden of Diseases (GBD) study, ozone was identified as the fifth-leading risk factor for COPD-related deaths, accounting for approximately 490,000 deaths worldwide[8,9]. However, this evidence was mainly derived from studies conducted in Europe and North America, where ozone concentrations are relatively low[10–13]. Although ozone levels in many regions of China exceed World Health Organization guidelines[14], epidemiological evidence for the long-term health effects of ozone pollution is scarce, and the findings from existing studies are inconsistent[15–17].
The heterogeneity observed across these studies may stem from substantial regional differences in socioeconomic conditions, climate, genetic backgrounds, and lifestyles. For example, populations in economically disadvantaged regions may exhibit lower awareness of air pollution prevention, engage in prolonged outdoor activities, and face restricted access to healthcare resources, thereby increasing their susceptibility to air pollution-associated respiratory diseases[18]. Climatic conditions may further modify ozone-related health effects. In colder regions, low winter temperatures can trigger bronchoconstriction and increase mucus production. Similarly, in hotter regions, heat exposure can lead to airway dehydration and thickening of mucus. These physiological responses may amplify airway susceptibility to ozone exposure[19,20]. Thus, distinguishing regional differences in the long-term association between ozone exposure and COPD and evaluating the potential interactions of ozone exposure, socioeconomic conditions, and temperature are critical for advancing the understanding of regional heterogeneity in ozone-induced respiratory health hazards and their underlying mechanisms. This evidence is essential for identifying the priority regions for ozone pollution control. However, few studies have assessed the modifying roles of regional economic development and temperature in the association between long-term ozone exposure and COPD.
On the basis of a large-scale, cross-sectional investigation covering 31 provinces across mainland China, this study aimed to (1) analyze the association between long-term ozone exposure and COPD prevalence as well as the shape of the concentration-response association; (2) evaluate the heterogeneity in this association across different geographical regions, urban-rural areas, and regions with varying per capita gross domestic product (GDP) and temperature characteristics; and (3) explore potential synergistic effects among ozone exposure, per capita GDP, and temperature on COPD prevalence.
-
In 2015, a probability sampling method was used to select 125 counties and districts (Supplemenatary Figure S1) from 605 national disease surveillance points (DSPs) (counties and districts) with national representativeness. These counties/districts were distributed across 31 provinces, autonomous regions, and municipalities directly under the Central Government in China. A 5-stage comprehensive probability sampling method was used to select 600 individuals aged 40 years or older from each of these 125 counties/districts[21]. The specific sampling process is described in the online supplementary methods. A total of 77,974 permanent residents who had lived at their current address for at least six months in the previous year were invited to participate in the investigation. Residents who could not be interviewed or declined to provide informed consent were excluded from the study. Finally, we successfully completed interviews with 75,107 residents, for a total response rate of 96.3%. This study was approved by the Ethical Review Committee of the National Center for Chronic and Noncommunicable Disease Control and Prevention and the Chinese Center for Disease Control and Prevention (No. 201410). All the participants provided written informed consent.
-
Trained staff interviewed participants using tablets to collect data regarding demographic characteristics, COPD-related risk factors, medical history of tuberculosis, and family history of respiratory diseases. COPD-related risk factors included smoking history, exposure to second-hand smoke, hospitalization due to severe lung disease in childhood, living with smokers during childhood, exposure to indoor biofuels, exposure to indoor coal, and exposure to dust or chemicals at the workplace. A history of tuberculosis was based on diagnoses made by a hospital at the township level or above. Indoor exposure to biofuels was defined as the use of biofuels (including firewood, grass, crop straw, and animal manure) for cooking or heating. Indoor exposure to coal was defined as the use of coal-based fuels (including raw coal, lignite, and kerosene) for cooking or heating. Exposure to dust or chemicals at the workplace was defined as cumulative exposure to dust or harmful chemical gases in the working environment (including agricultural production) for at least 12 months. Detailed definitions of dust and chemicals can be found in our previous study[21]. In this analysis, we used qualitative indicators (yes/no) to assess indoor exposure to biofuels or coal, as well as exposure to dust or chemicals at the workplace. In addition, height and weight of all participants were measured to calculate their body mass index (BMI).
After completing the questionnaire interview, eligible participants underwent pulmonary function tests conducted by trained and qualified staff using MasterScreen Pneumo spirometer (Jaeger, Germany). In accordance with the recommendations of the American Thoracic Society, the forced vital capacity (FVC) and forced expiratory volume in 1 s (FEV1) were measured before and after bronchodilator administration.
All pulmonary function test results were graded into five levels (A, B, C, D, and F) based on acceptable operation and the repeatability of FVC and FEV1 measurements. Grades A, B, and C were regarded as acceptable measurement results and included in the analysis. COPD was defined spirometrically as a post-bronchodilator FEV1/FVC ratio < 70%, in line with the 2025 Global Initiative for Chronic Obstructive Lung Disease (GOLD) criteria[22].
All collected data were uploaded to a real-time data management system and assessed by reviewers and experienced clinicians within 24 h of the survey. For data that did not meet the quality requirements, re-interviews or repeat pulmonary function tests were requested. Details regarding the procedures and quality control measures are provided in Supplementary Methods.
-
We employed a four-dimensional (4D) spatiotemporal deep forest (STDF) model to estimate the 1-kilometer-resolution near-surface maximum 8-hour moving average ozone concentration across the country from 2009 to 2015. This method mainly utilized 1-kilometer-resolution downward shortwave radiation (DSR) and temperature derived from satellite inversion as key predictor variables, while integrating national ozone observation data, atmospheric reanalysis data, satellite remote sensing products, and emission inventory data. The results of ten-fold cross-validation indicated that the model had high accuracy (spatial prediction capability). The sample-based and station-based cross-validation coefficients (R2) were 0.89 and 0.84, respectively, with root mean square error (RMSE) of 15.77 and 10.48 µg/m3, and mean absolute error (MAE) of 10.48 and 12.36 µg/m3, respectively[14]. These data have been widely used in studies on ozone pollution and health[23].
For PM2.5, we employed the multi-angle implementation of the atmospheric correction (MAIAC) algorithm of the moderate resolution imaging spectroradiometer (MODIS) to generate long-term, high-spatial-resolution aerosol optical thickness data. In combination with the space-time extra-trees (STET) model, we estimated the 1-km high-resolution PM2.5 concentration across the country from 2009 to 2015. The cross-validation coefficient R2 of the model reached 0.86−0.90, and the prediction coefficient R2 reached 0.80−0.82[6,24].
In this study, long-term exposure refers to the average annual concentrations of ozone and PM2.5 over multiple years, rather than implying data obtained using a longitudinal follow-up design. We used the average concentrations of ozone and PM2.5 in the grids covering the residential areas of participants as the exposure levels. We assumed that the exposure levels of ozone and PM2.5 for participants living in the same county were the same. We calculated the average annual concentrations of ozone and PM2.5 in the 1st, 3rd, 5th, and 7th years before the survey (i.e., 2015, 2013–2015, 2011–2015, and 2009–2015) as the exposure levels, and incorporated them respectively into the model for analysis. We compared the strength of the relationship between ozone exposure and COPD during different periods. The results showed that the association with ozone exposure was the most significant during 2013-2015 (Supplemenatary Table S1). Therefore, we finally included the atmospheric pollution exposure level during this period in the model.
-
The 2015 population data for 125 counties and districts were obtained from the National Bureau of Statistics. Regional GDP data were obtained from the 2015 China County Statistical Yearbook and used to calculate the per capita GDP of each county and district. The daily average temperature of each county and district in 2015 was obtained from the ERA5-Land dataset with a spatial resolution of 9 km × 9 km. These data have been widely used in environmental epidemiology[25,26]. After dividing the period into summer (June-August) and winter (December-February), the average temperatures for the two seasons were calculated.
-
Considering the research sampling design and non-response of the participants, the data were weighted to represent the general population aged 40 years and older in mainland China. We performed descriptive analysis, with continuous variables presented as mean ± standard deviation (SD) and categorical variables summarized as proportions (%). Participants were divided into low and high ozone exposure groups on the basis of the median annual mean ozone exposure level from 2013 to 2015, and the differences in general characteristics between the two groups were presented. The prevalence of COPD in the 125 counties and districts surveyed and the spatial distribution of atmospheric ozone concentrations in China are displayed on a map.
A multivariate logistic regression analysis was conducted to investigate the relationship between atmospheric ozone exposure and COPD. Three logistic regression models were fitted: Model 1 was adjusted only for age and sex; Model 2 was further adjusted for urban-rural areas, individual educational level, pack-years of smoking, exposure to second-hand smoke, hospitalization due to severe lung disease in childhood, living with smokers in childhood, indoor exposure to biofuels, indoor exposure to coal, exposure to dust or chemicals at the workplace, history of tuberculosis, family history of respiratory diseases, and BMI; and Model 3 was further adjusted for the PM2.5 level.
To explore the concentration-response relationship between ozone exposure and COPD prevalence, a restricted cubic spline (RCS) model was established. The likelihood ratio (LR) method was used to test whether the nonlinear associations were statistically significant. According to the Akaike information criterion (AIC), four knots were set at the 5th, 35th, 65th, and 95th percentiles of the ozone concentration distribution. The adjusted variables are consistent with those in Model 3.
In addition, based on Model 3, we conducted stratified analyses in relation to the geographical divisions of counties and districts, place of residence (urban vs. rural), county-level per capita GDP (quartiles), and county-level average temperatures in summer and winter. We also performed stratified analyses based on individual’s age (< 65 years vs. ≥ 65 years), sex, smoking, indoor exposure to biomass fuel and coal, and exposure to dust or chemicals at the workplace. We further used a meta-regression model to compare the differences in ozone–COPD associations among different strata.
To explore the synergistic effects of ozone with socioeconomic status (SES) and with temperature on COPD, we evaluated the additive interactions between ozone with county-level per capita GDP and with winter average temperature. Since the ozone–COPD association stratified by summer average temperature showed no statistically significant difference, the interaction between ozone and summer average temperature was not analyzed further. The ozone exposure concentration, per capita GDP, and average winter temperature were divided into two layers on the basis of their medians. Using this approach, two new variables were created to reflect the different combinations of ozone with per capita GDP and with average winter temperature respectively, and the new variables were classified into four categories. The four categories of the new variable for the interaction with per capita GDP included low ozone exposure and high per capita GDP, low ozone exposure and low per capita GDP, high ozone exposure and high per capita GDP, and high ozone exposure and low per capita GDP. The four categories of the new variable for the interaction with average winter temperature were low ozone exposure and high winter average temperature, low ozone exposure and low winter average temperature, high ozone exposure and high winter average temperature, and high ozone exposure and low winter average temperature. These new four-category variables were incorporated into Model 3 to calculate the ORs and three indicators of additive interaction: relative excess risk due to interaction (RERI), attributable proportion (AP), and synergy index (SI). A RERI or AP value greater than zero or an SI value greater than one suggested the presence of a synergistic interaction, whereas a RERI or AP value less than zero or an SI value less than one suggested an antagonistic interaction[27,28].
All analyses were conducted using R (version 4.0.3), and two-sided P values < 0.05 were considered statistically significant.
-
After excluding participants who were unable to complete the pulmonary function tests (n = 2,282), were ineligible for post-bronchodilator tests (n = 3,841), or had unacceptable pulmonary function test grades (D or F; n = 2,232), the final analysis included 66,752 individuals. The participant inclusion flowchart is shown in Supplemenatary Figure S2. The general characteristics of the participants included and excluded from the analyses are shown in Supplementary Table S2. Sex distribution, ozone exposure, prevalence of hospital admissions due to severe pulmonary diseases in childhood, and indoor coal exposure were broadly comparable between the two groups (P > 0.05). However, in comparison with the participants included in the analyses, the excluded participants were older, more likely to reside in rural areas, had lower educational attainment (P < 0.05).
The demographic characteristics, risk factors related to COPD, prevalence of COPD among the included participants, and distribution of these variables across the low and high ozone exposure groups are shown in Table 1. Most participants (95.5%) had high school education or lower, and 51.8% resided in rural areas. Among them, 40.2% were former or current smokers; 56.5% were exposed to second-hand smoke; 40.7% were exposed to indoor biofuels; and 44.6% were exposed to workplace dust or chemicals. The average ozone exposure among the participants from 2013 to 2015 was 84.9 µg/m3 (SD, 7.0 µg/m3). The spatial distribution of ozone concentrations is shown in Supplemenatary Figure S3. In total, 9,134 patients with COPD were included in the study, with an average prevalence rate of 13.6%. The prevalence of COPD in the 125 countries/districts is shown in Supplementary Figure S1.
Characteristics Entire population
(n = 66752)Low ozone exposure
group (n = 32608)High ozone exposure
group (n = 34144)Age, mean (SD), years 54.9 (11.1) 55.4 (11.5) 54.5 (10.8) Women, n (%) 33615 (49.5) 15922 (48.8) 17693 (50.1) Education level, n (%) Primary school or less 33693 (47.1) 18380 (57.6) 15313 (39.7) Middle and high school 30213 (48.4) 12908 (38.9) 17305 (55.1) College or higher 2827 (4.5) 1309 (3.5) 1518 (5.1) Rural residence, n (%) 34743 (51.8) 19551 (61.5) 15192 (44.9) Smoking history, n (%) Never smoking 40070 (59.8) 18832 (57.7) 21238 (61.3) Former smoking 6438 (8.8) 3135 (8.5) 3303 (9.0) Current smoking 20059 (31.4) 10537 (33.8) 9522 (29.7) Pack-years of cigarette smoking, n (%) * < 1 44929 (68.5) 21334 (67.1) 23595 (69.6) 1–9 2667 (4.3) 1253 (3.9) 1414 (4.6) 10–19 3994 (6.7) 1853 (6.3) 2141 (7.0) ≥ 20 13423 (20.5) 7161 (22.8) 6262 (18.8) Exposure to second-hand smoke, n (%) 38040 (56.5) 19773 (60.1) 18267 (53.9) Hospital admission for severe pulmonary disease in childhood, n (%) 1656 (2.7) 795 (2.7) 861 (2.7) Smokers living at home in childhood, n (%) 34857 (54.5) 17260 (57.7) 17597 (52.3) Indoor exposure to biomass, n (%) 28914 (40.7) 15906 (51.4) 13008 (33.0) Indoor exposure to coal fuel, n (%) 22881 (34.3) 8731 (26.2) 14150 (40.1) Exposure to dust or chemicals in the workplace, n (%) 29808 (44.6) 14841 (48.3) 14967 (41.9) History of tuberculosis, n (%) 1247 (1.7) 688 (2.0) 559 (1.5) Family history of respiratory diseases, n (%) 16085 (26.9) 7228 (28.0) 8857 (26.2) Body mass index, n (%), kg/m2 < 18·5 (underweight) 1515 (2.3) 1025 (3.7) 490 (1.3) 18·5–23·9 (normal weight) 28600 (42.4) 15759 (50.0) 12841 (36.9) 24·0–27·9 (overweight) 25810 (39.1) 11649 (34.7) 14161 (42.2) ≥ 28·0 (obese) 10818 (16.3) 4171 (11.7) 6647 (19.5) PM2.5 exposure, mean (SD), µg/m³ 61.8 (18.8) 51.2 (14.5) 70.0 (17.6) COPD, n (%) 9134 (13.6) 4412 (14.6) 4722 (12.9) Note. COPD, chronic obstructive pulmonary disease; PM2.5, fine particulate matter; SD, standard deviation. Table 1. Characteristics of the participants in the study
-
The model with ozone and most covariates (Model 2) showed that long-term exposure to ozone was associated with a higher risk of COPD (odds ratio [OR]: 1.180, 95% confidence interval [CI]: 1.031−1.350) (Table 2). The model with further adjustment for PM2.5 levels (Model 3) also showed a significant association between ozone exposure and COPD risk (OR: 1.172, 95% CI: 1.039−1.322).
Characteristics OR (95% CI) Model 1 Model 2 Model 3 Ozone exposure, per 10 µg/m³ 1.084 (0.933–1.259) 1.180 (1.031–1.350) 1.172 (1.039–1.322) Age, years 1.061 (1.053–1.069) 1.063 (1.055–1.072) 1.063 (1.054–1.072) Women 0.343 (0.304–0.387) 0.466 (0.396–0.548) 0.465 (0.397–0.545) Education level Primary school or less 1.177 (0.861–1.608) 1.178 (0.868–1.599) Middle and high school 1.037 (0.786–1.369) 1.038 (0.787–1.367) College or higher 1 (ref) 1 (ref) Rural residence 1.100 (0.878–1.377) 1.100 (0.880–1.373) Pack-years of cigarette smoking, n (%) * < 1 1 (ref) 1 (ref) 1–9 1.387 (1.127–1.706) 1.386 (1.129–1.703) 10–19 1.326 (1.094–1.608) 1.326 (1.093–1.609) ≥ 20 1.818 (1.554–2.127) 1.818 (1.554–2.127) Exposure to second-hand smoking 1.052 (0.903–1.226) 1.054 (0.901–1.233) Hospital admission for severe pulmonary disease in childhood 1.967 (1.524–2.539) 1.966 (1.517–2.549) Smokers living at home in childhood 0.923 (0.843–1.011) 0.923 (0.846–1.008) Indoor exposure to biomass 1.164 (0.911–1.488) 1.166 (0.928–1.465) Indoor exposure to coal fuel 0.938 (0.753–1.168) 0.935 (0.754–1.158) Exposure to dust or chemicals in the workplace 1.223 (1.069–1.400) 1.222 (1.055–1.415) History of tuberculosis 1.681 (1.203–2.349) 1.682 (1.202–2.353) Family history of respiratory diseases 1.555 (1.374–1.760) 1.555 (1.374–1.759) Body mass index, kg/m2 < 18·5 (underweight) 1.107 (0.891–1.376) 1.107 (0.892–1.375) 18·5–23·9 (normal weight) 1 (ref) 1 (ref) 24·0–27·9 (overweight) 0.776 (0.702–0.859) 0.776 (0.697–0.864) ≥ 28·0 (obese) 0.817 (0.677–0.986) 0.815 (0.692–0.960) PM2.5 exposure, per 10 µg/m³ 1.007 (0.898–1.128) Note. Model 1 was adjusted for age and sex. Model 2 was adjusted for covariates in Model 1 + educational level, rural residence, pack-years of cigarette smoking, exposure to second-hand smoke, hospital admission for severe pulmonary disease in childhood, smoking at home in childhood, indoor exposure to biomass, indoor exposure to coal fuel, exposure to dust or chemicals in the workplace, history of tuberculosis, family history of respiratory diseases, and body mass index. Model 3 was adjusted for covariates in Model 1 and Model 2 + PM2.5 exposure. OR, odds ratio; CI, confidence interval; COPD, chronic obstructive pulmonary disease; PM2.5, fine particulate matter. Table 2. Associations of COPD with ozone exposure and other risk factors
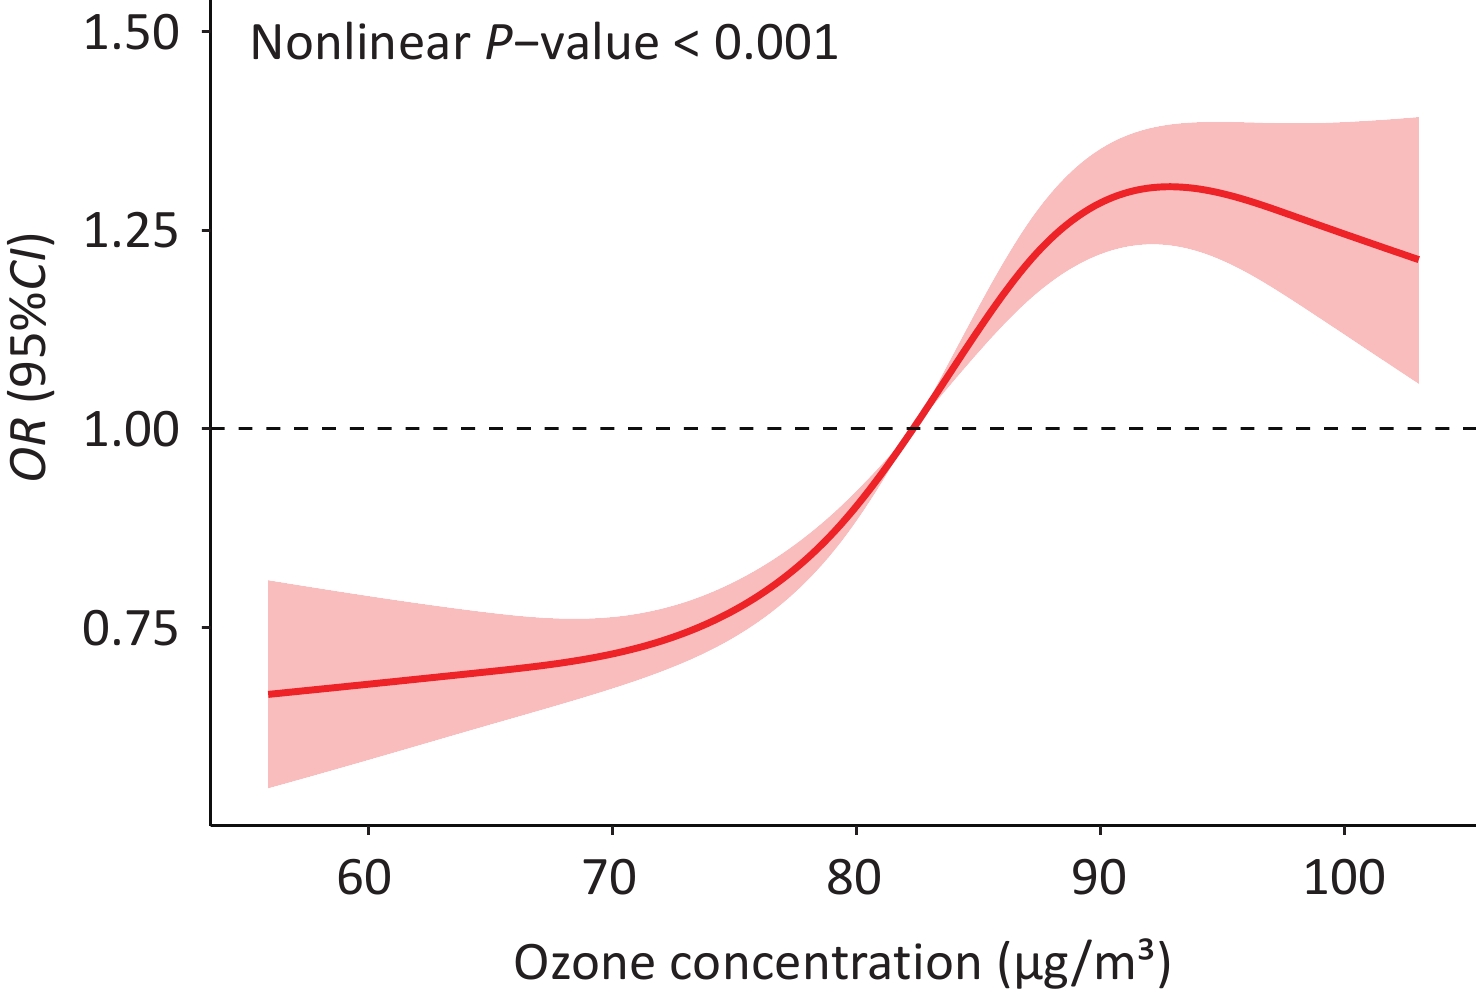
Figure 1 shows the concentration-response relationship curve of ozone exposure and COPD prevalence in the full model (Model 3). The P value for the comparison of linear and nonlinear relationships was less than 0.001, indicating a nonlinear association between ozone and COPD prevalence.
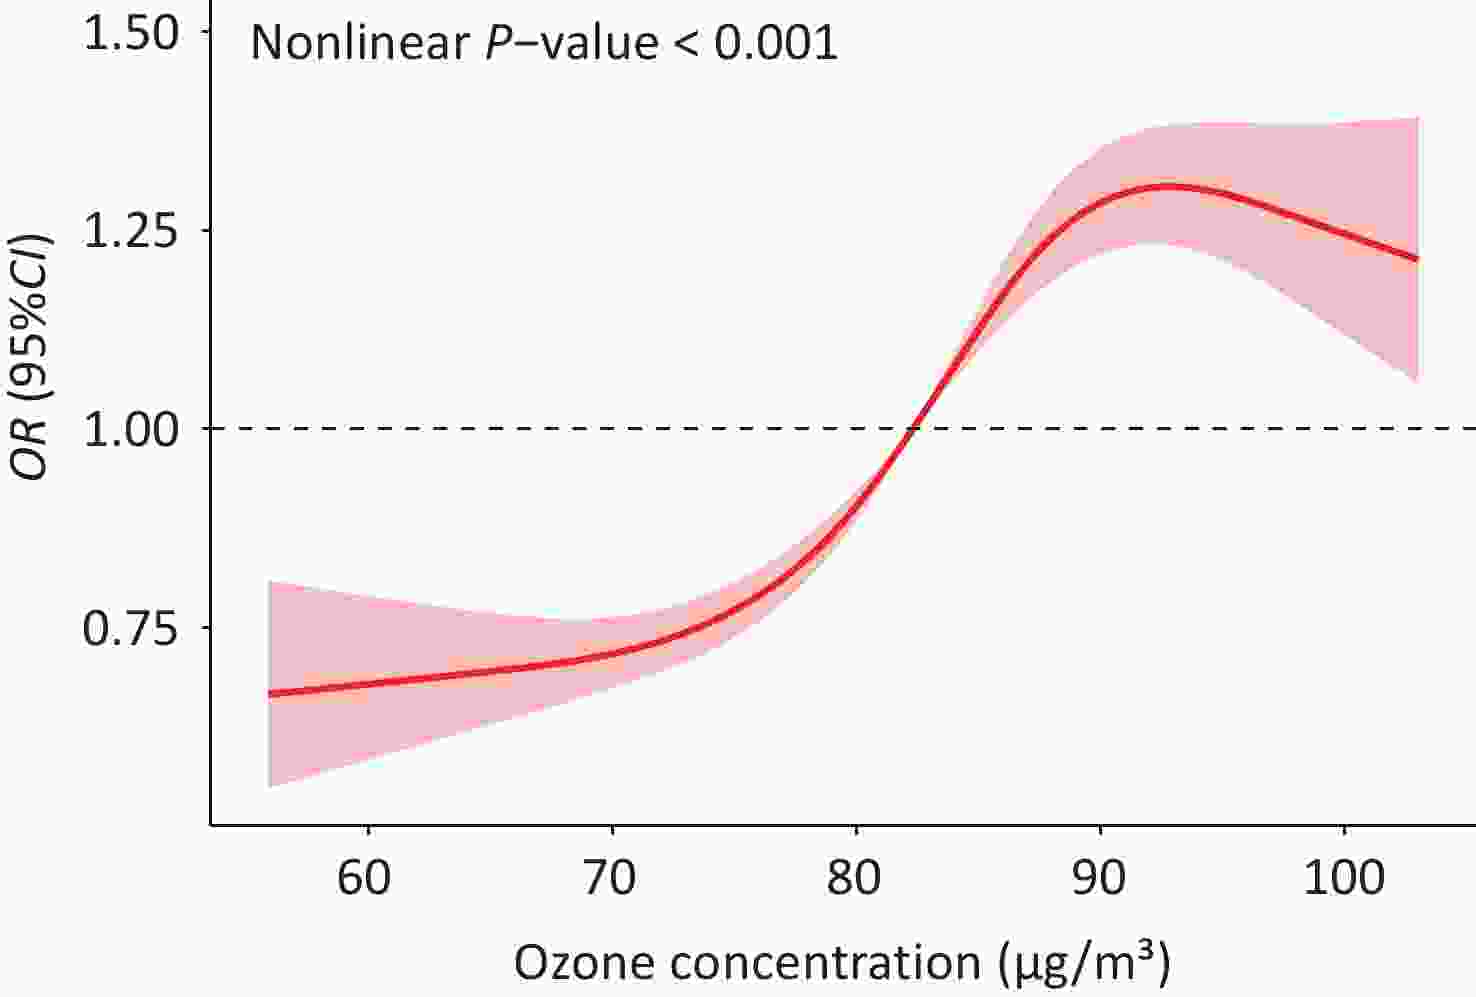
Figure 1. Concentration-response curve between ozone exposure and COPD. OR, odds ratio; CI, confidence interval; COPD, chronic obstructive pulmonary disease.
-
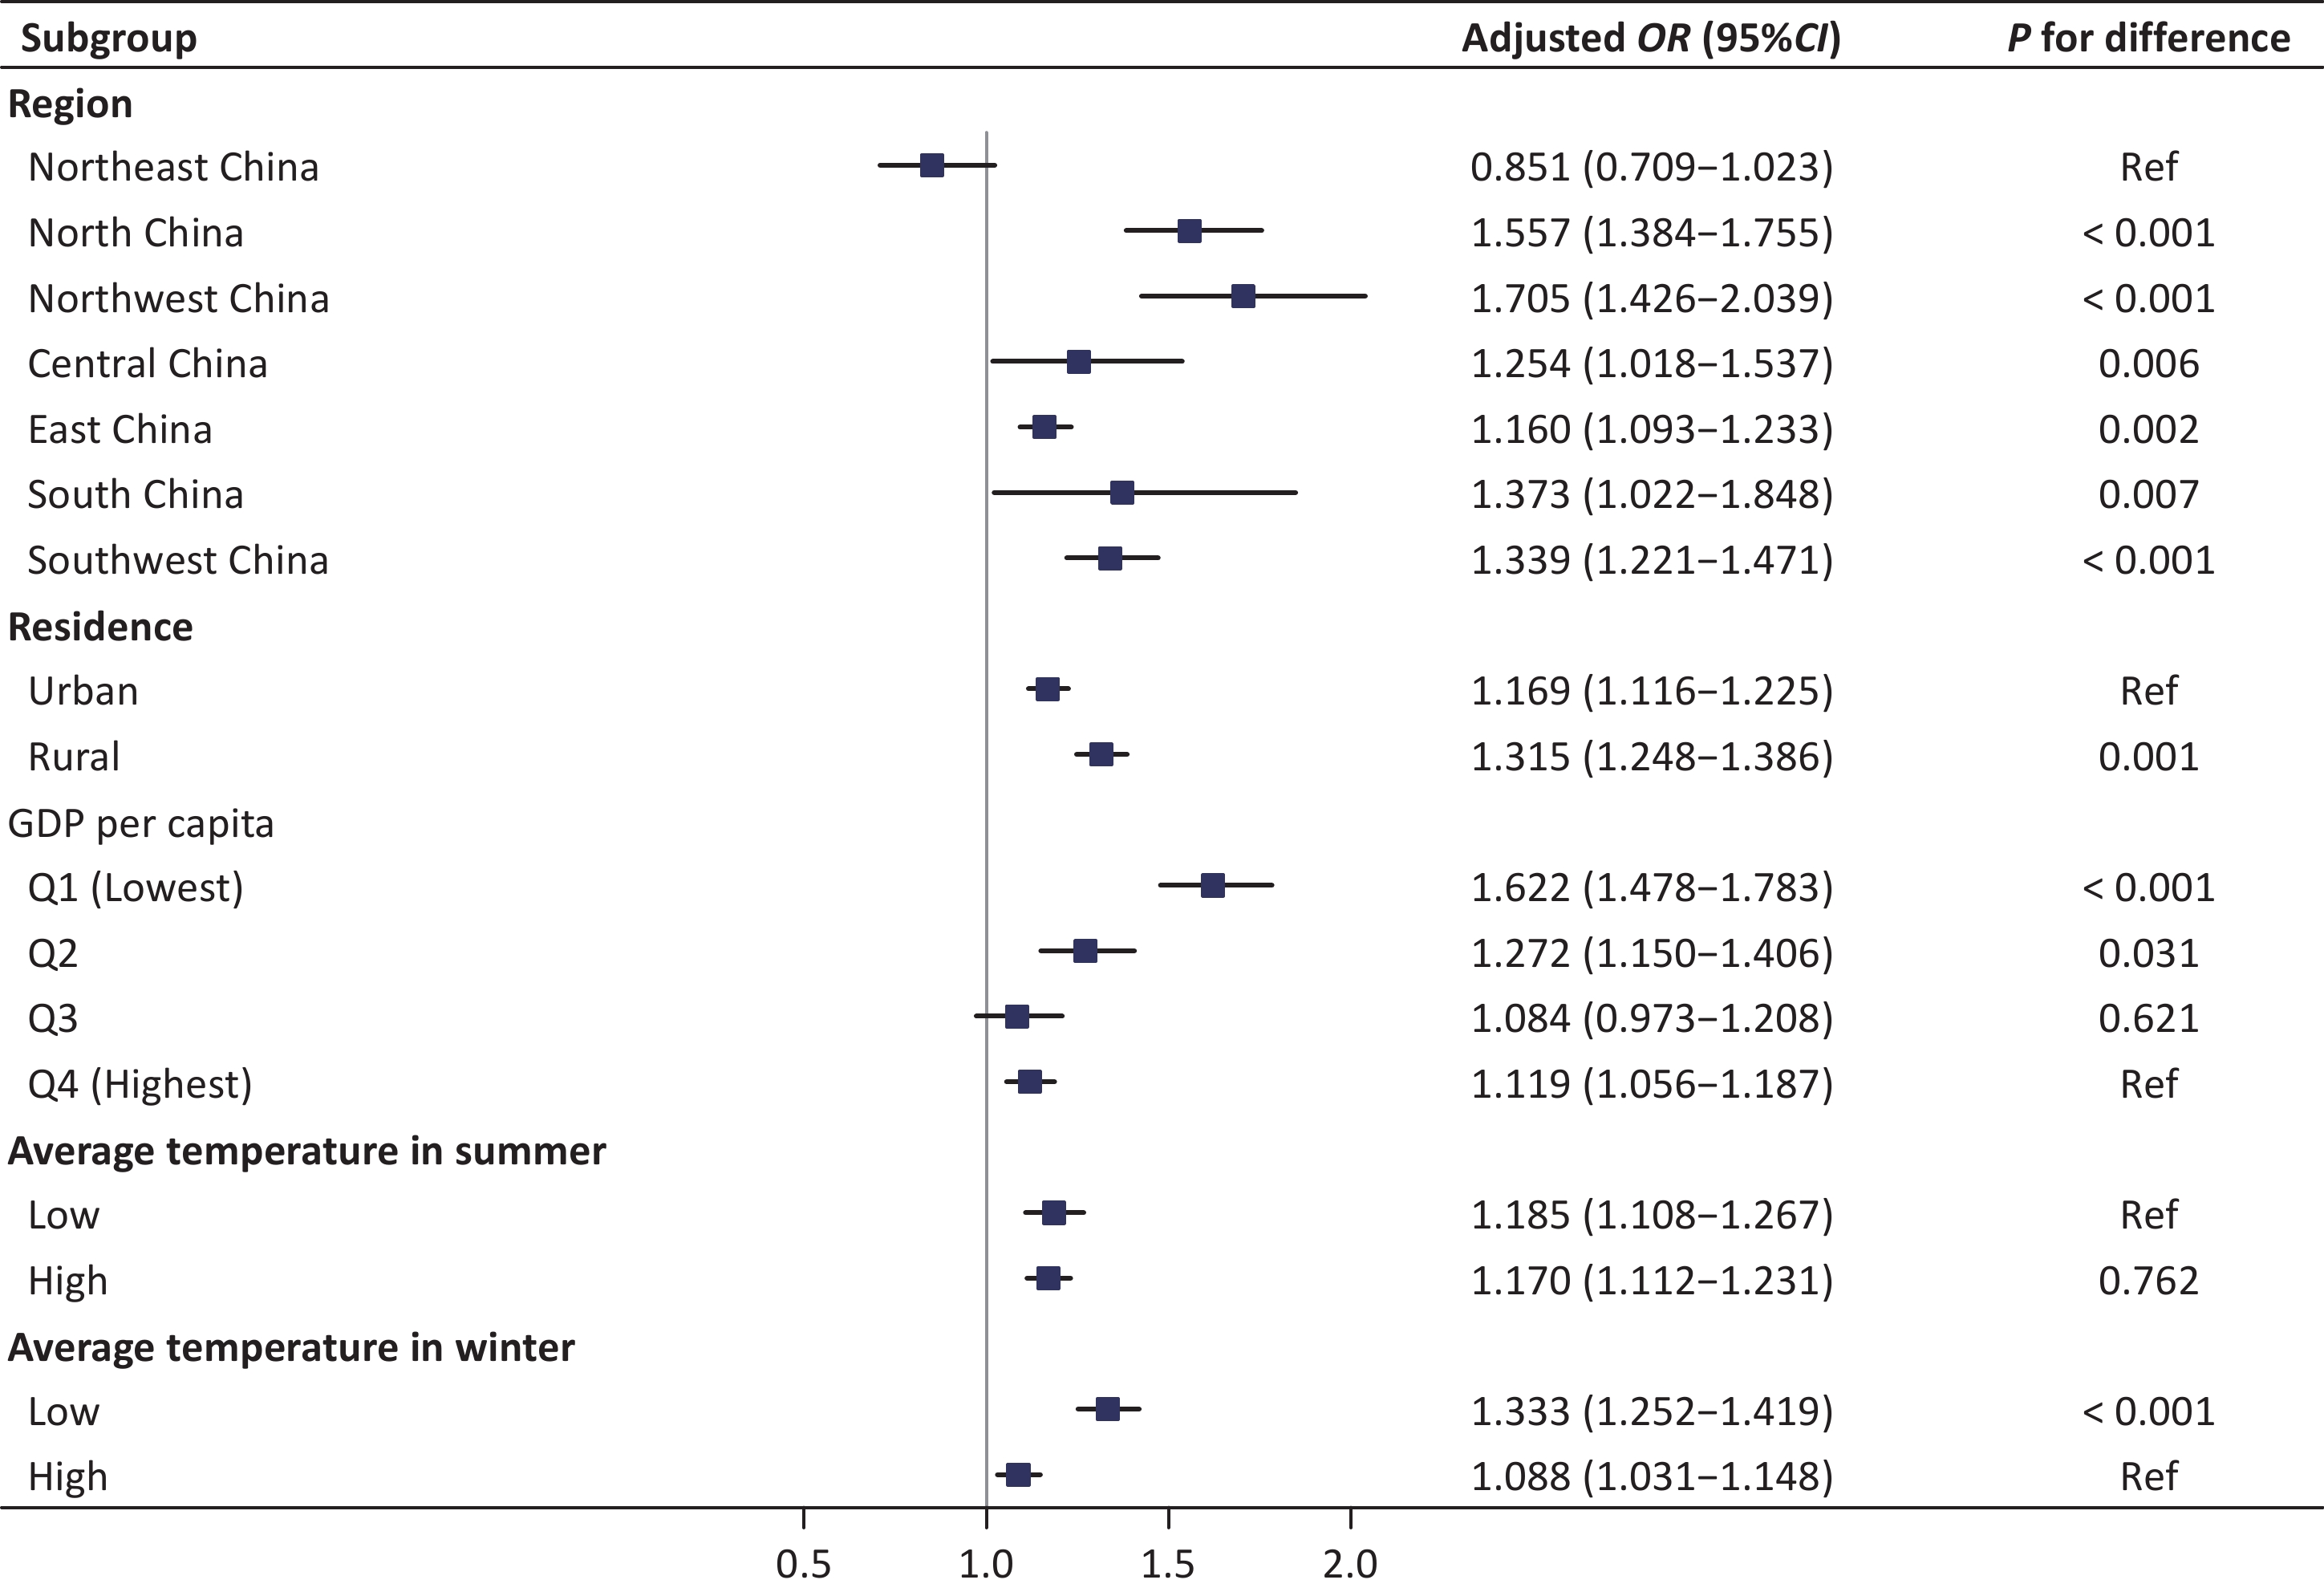
The association between ozone exposure and COPD risk was the strongest in the northwest region, followed by the north, south, and southwest regions (Figure 2). This association was stronger in rural areas (vs. urban areas, P = 0.001), regions in the second and lowest quartiles of per capita GDP (vs. regions in the highest quartile of per capita GDP, P < 0.05), and in regions with lower average winter temperatures (vs. regions with higher average winter temperatures, P < 0.001). However, no statistically significant differences were observed across the strata of the summer average temperature.
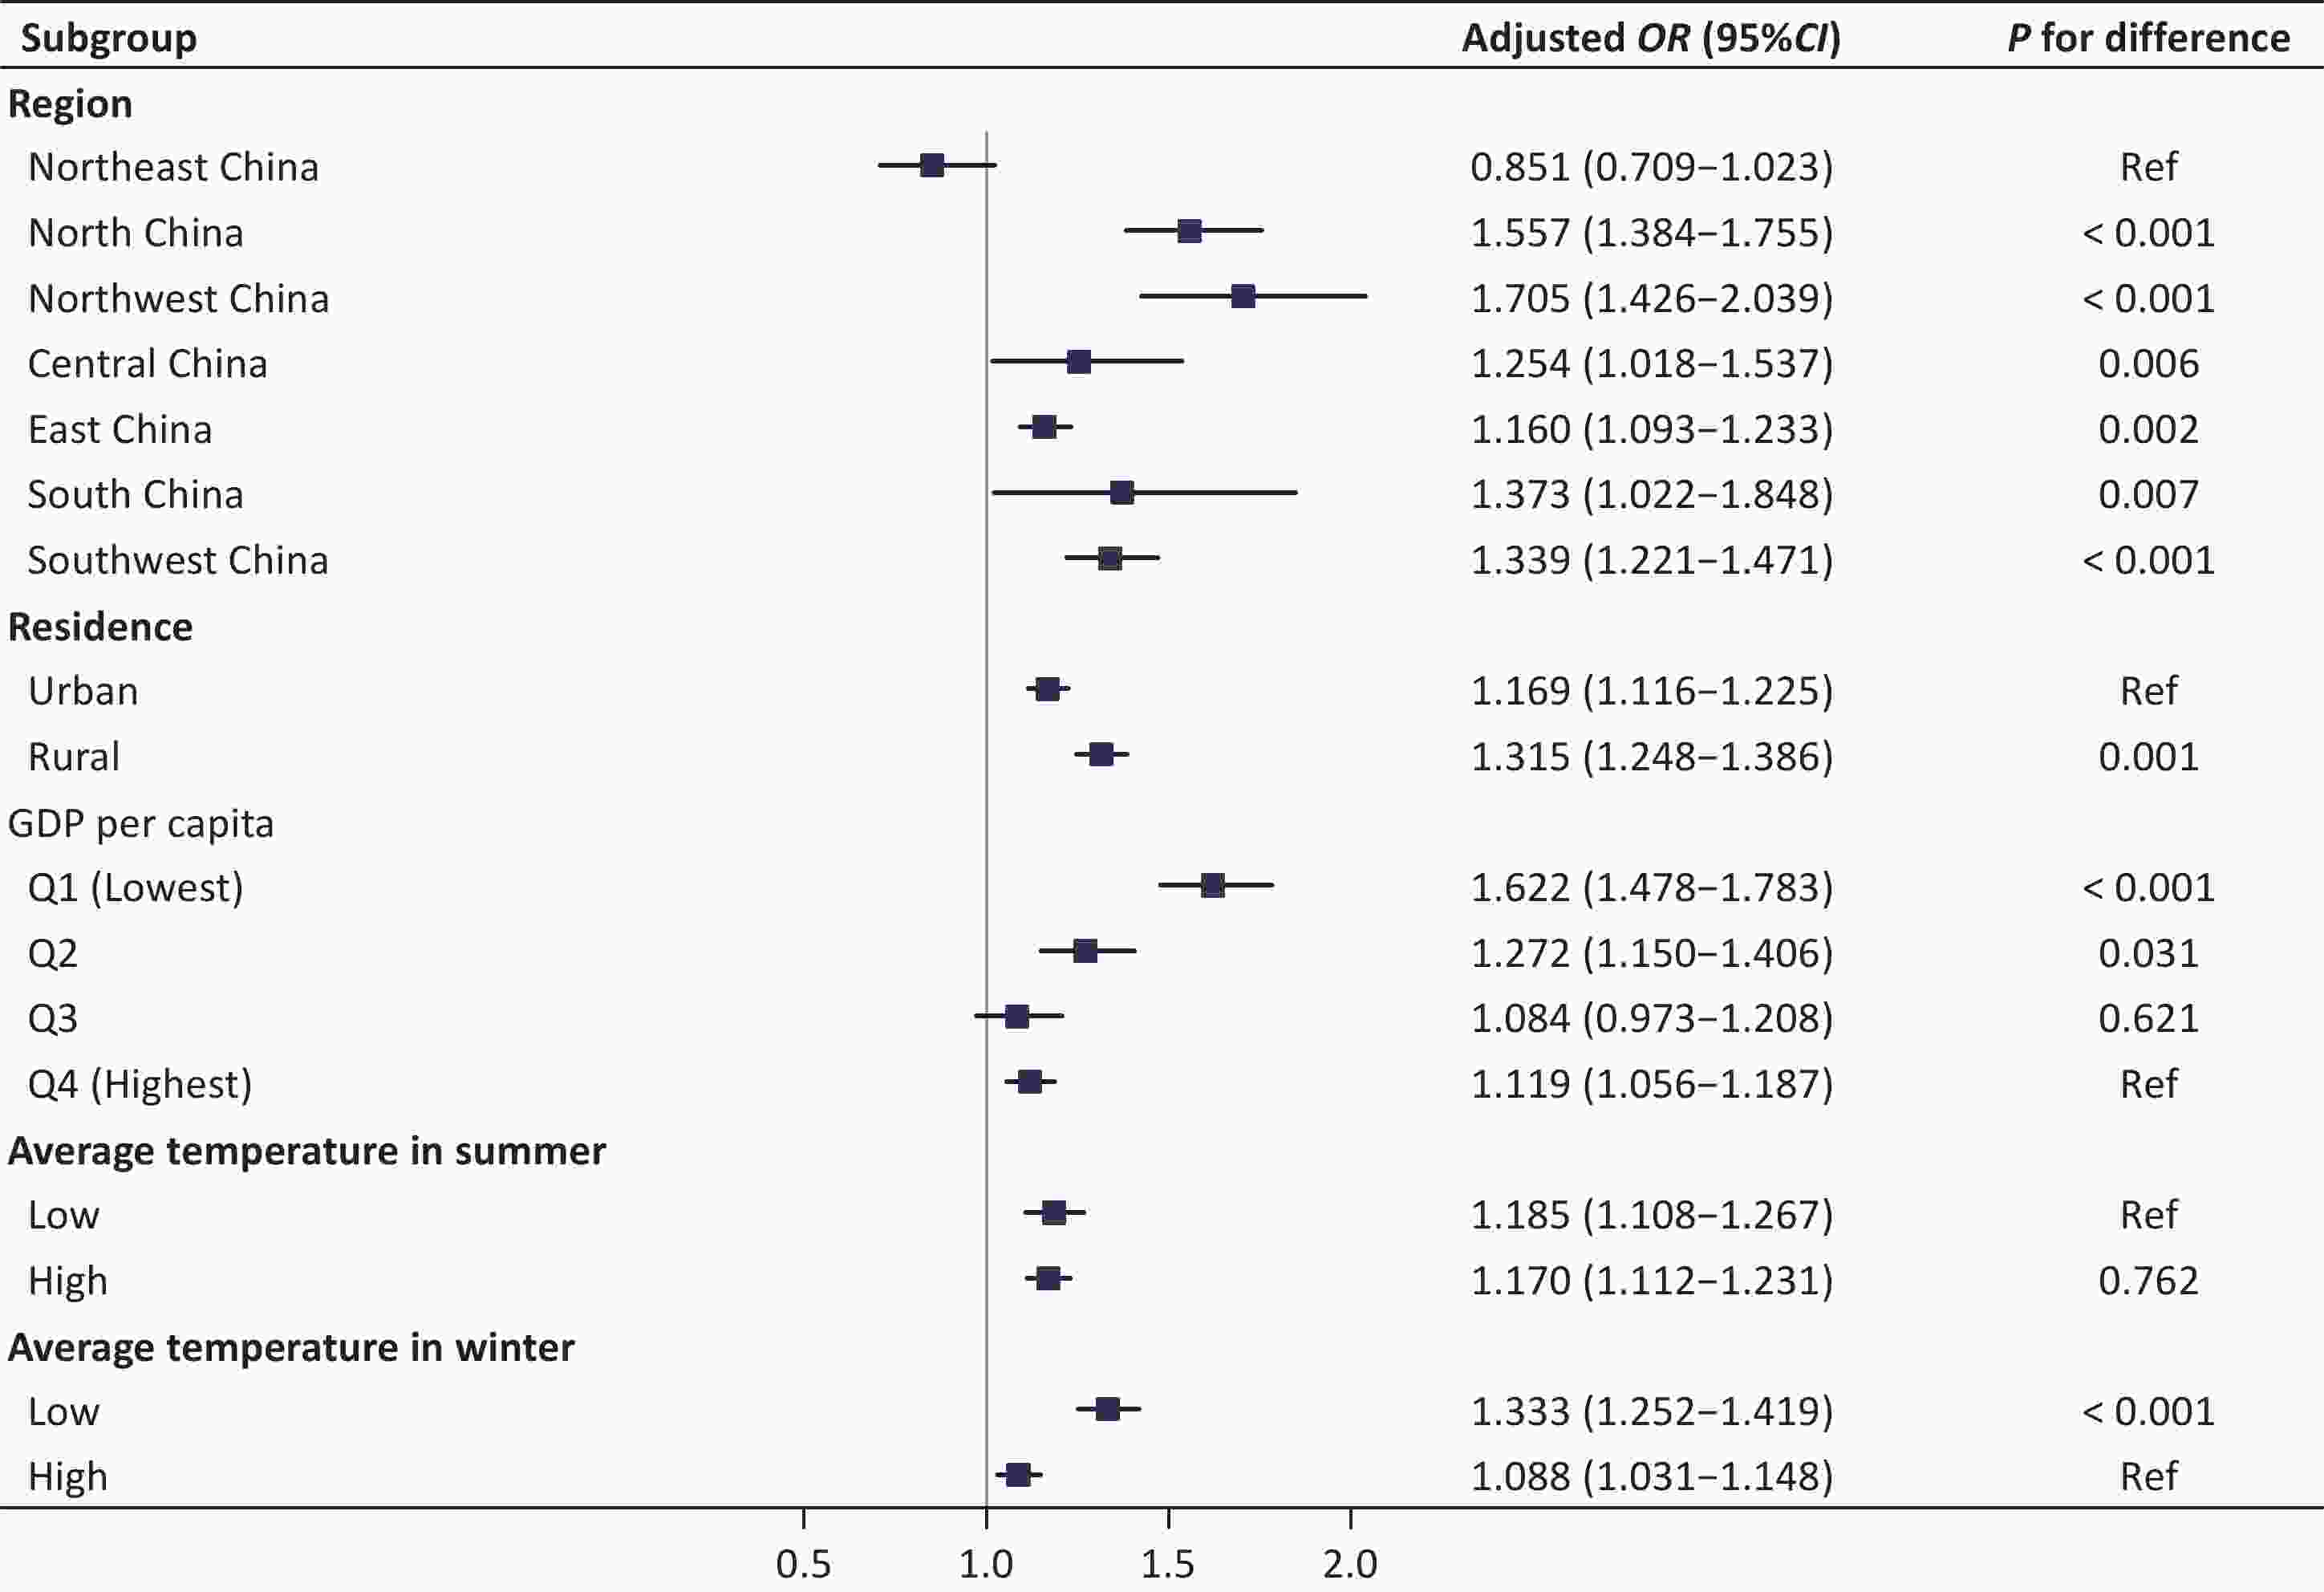
Figure 2. Associations between ozone exposure and COPD across subgroups of region, residence, GDP per capita, and seasonal temperature. OR, odds ratio; CI, confidence interval; COPD, chronic obstructive pulmonary disease; GDP, gross domestic product.
The association between ozone exposure and COPD risk was stronger in the subgroups exposed to biofuels and coal fuels (compared to the reference group, P values were 0.003 and < 0.001, respectively) (Supplementary Figure S4). However, the magnitude of the association did not differ in relation to age, sex, smoking status, or exposure to workplace dust or chemicals (P > 0.05).
-
In comparison with the group showing low ozone exposure and high per capita GDP, the OR for the group with high ozone exposure and low per capita GDP was 1.290 (95% CI: 1.179–1.411) (Table 3). The RERI, AP, and SI of the interaction between ozone exposure and low per capita GDP were 0.219 (95% CI: 0.095–0.344), 0.170 (95% CI: 0.075–0.265), and 4.121 (95% CI: −4.006 to 12.247), respectively. In comparison with the group with low ozone exposure and high average winter temperature, the OR for the group with high ozone exposure and low average winter temperature was notably higher (OR: 1.371, 95% CI: 1.266−1.486) (Table 4). The RERI, AP, and SI of the interaction between ozone and the average winter temperature were 0.254 (95% CI: 0.103−0.404), 0.185 (95% CI: 0.077–0.293), and 3.152 (95% CI: −0.972 to 7.275), respectively, indicating a synergistic additive interaction between ozone exposure and low winter temperature on COPD risk.
Group N Adjusted OR
(95% CI)P value RERI
(95% CI)AP
(95% CI)SI
(95% CI)Low ozone exposure & high GDP per capita 13225 1 (Ref) 0.219 (0.095–0.344) 0.170 (0.075–0.265) 4.121 (−4.006–12.247) Low ozone exposure & low GDP per capita 16589 0.982 (0.901–1.070) 0.675 High ozone exposure & high GDP per capita 14817 1.088 (0.991–1.195) 0.076 High ozone exposure & low GDP per capita 11875 1.290 (1.179–1.411) < 0.001 Note. OR, odds ratio; CI, confidence interval; COPD, chronic obstructive pulmonary disease; GDP, gross domestic product; RERI, relative excess risk due to interaction; AP, attributable proportion; SI, synergy index Table 3. Interaction effect of ozone exposure and GDP per capita on COPD
Group N Adjusted OR
(95% CI)P value RERI
(95% CI)AP
(95% CI)SI
(95% CI)Low ozone exposure & high average winter temperature 22899 1 (Ref) 0.254 (0.103–0.404) 0.185 (0.077–0.293) 3.152 (−0.972–7.275) Low ozone exposure & low average winter temperature 6915 1.107 (1.002–1.222) 0.044 High ozone exposure & high average winter temperature 6105 1.011 (0.911–1.120) 0.842 High ozone exposure & low average winter temperature 20587 1.371 (1.266–1.486) <0.001 Note. OR, odds ratio; CI, confidence interval; COPD, chronic obstructive pulmonary disease; RERI, relative excess risk due to interaction; AP, attributable proportion; SI, synergy index Table 4. Interaction effect of ozone exposure and average winter temperature on COPD
-
On the basis of nationwide data from 31 provinces in mainland China, this study confirmed that long-term exposure to ozone was associated with a higher risk of COPD. Notably, this association was more pronounced in regions with lower per capita GDP and average winter temperature. The interaction analysis revealed a significant additive interaction effect between ozone exposure and county-level per capita GDP, as well as county-level average winter temperature. Our findings for China, a country undergoing rapid economic transformation with the world’s largest population, underscore the significant regional heterogeneity in the long-term association between ozone exposure and COPD and offer critical evidence for understanding environmental health inequality.
Existing studies in Europe and America examining the long-term association between ozone exposure and COPD have largely relied on self-reported diagnoses, medical insurance records, or mortality registries for outcome assessment[18,29,30]. Moreover, covariate data in these studies were often collected only at the municipal level, limiting the generalizability of the findings at the individual level[11,13,31]. Previous relevant studies conducted in China have usually been restricted to specific regions[15–17], with COPD outcomes also predominantly drawn from medical insurance records and mortality registries[15]. Thus, variations in the quality and completeness of the medical insurance records across regions may have led to missed diagnoses or misclassifications. Furthermore, the use of mortality as a disease outcome may be less sensitive than disease prevalence. Our study was a large-scale, nationally representative epidemiological investigation in which COPD was determined through uniformly administered and strictly quality-controlled pulmonary function tests. This approach enabled more sensitive identification of disease outcomes in comparison with approaches based on mortality-based data. In addition, we adjusted the findings for key individual-level risk factors for COPD, including smoking, indoor air pollution, and occupational exposure, to reveal the robust association between long-term ambient ozone exposure and COPD. Notably, even after adjusting for individual-level SES, we still found that county-level low SES and colder winter temperatures amplified the harmful associations of long-term ozone exposure with COPD. These findings offer valuable insights into targeted prevention strategies to address environmental health inequalities.
Ozone can impair respiratory health through several pathways, such as direct cellular toxicity, promotion of inflammation and oxidative stress, and alterations in the gut and lung microbiota[32]. The amplified adverse associations observed between long-term ambient ozone exposure and COPD in low-SES countries may stem from multiple mechanisms. First, socioeconomic stressors may intensify these physiological pathways[33,34]. Second, residents in low-SES regions may be at a higher risk of childhood malnutrition[35], which could impair lung development and thereby increase physiological susceptibility to ozone in adulthood[36]. Third, although ambient ozone concentrations tend to be lower in low-SES regions, residents may experience greater personal exposure. This may result from a greater reliance on natural ventilation through open windows instead of air conditioning during summer when ozone levels peak, increasing the infiltration of ozone into indoor environments[10]. Fourth, residents of low-SES regions generally exhibit limited awareness and implement fewer protective measures against ambient air pollution. Fifth, limited access to healthcare in low-SES areas may reduce opportunities for prevention and early diagnosis, further exacerbating the detrimental effects of ozone exposure.
A stronger association between long-term ambient ozone exposure and COPD was observed in counties and districts with lower average winter temperatures. This may be explained by multiple interactions between environmental and physiological-pathological mechanisms. First, the annual average ozone concentration was higher in northern China than in southern China. This was likely attributable to the higher population density and industrial activity[37]. Second, cold environments can increase airway sensitivity, potentially triggering a more intense inflammatory response and subsequent airway obstruction upon ozone exposure[38]. Furthermore, exposure to cold air can induce vasoconstriction, which can impair local blood supply and immune function. This impairment may reduce the efficiency of pollutant clearance and exacerbate oxidative stress and inflammatory responses.
Our study revealed that the risk factors for COPD extended beyond individual behaviors such as smoking. Even among non-smokers, residence in regions with high ambient ozone concentrations was significantly associated with a high prevalence of COPD. Moreover, the effects were not uniformly distributed across populations. Residents of regions with low SES and colder climates were particularly vulnerable. Our findings have several important policy implications. First, stricter regulations on industrial emissions and vehicle exhaust should be implemented in low-SES regions. In the northern regions with low average winter temperatures, the adoption of clean energy for heating should be promoted. Such measures would help reduce emissions of ozone precursors such as nitrogen oxides (NOₓ) and volatile organic compounds (VOCs). Second, an early-warning system for high ambient ozone pollution should be established, with particular attention to socioeconomically disadvantaged and colder regions. Health advisories should employ straightforward communication strategies suitable for these communities to enhance public awareness and self-protection capacities. Third, the assessment of the health effects associated with ambient ozone pollution depends on reliable monitoring data. However, current air quality monitoring stations in China are unevenly distributed, with particularly sparse coverage in socioeconomically disadvantaged rural areas[39,40]. Our results highlight the urgent need to enhance air quality monitoring networks in these areas to assess ozone exposure accurately. Fourth, efforts to strengthen early identification, diagnosis, and treatment of COPD in low-SES areas should be enhanced through measures such as training primary healthcare providers and improving the accessibility of spirometry equipment.
Moreover, the concentration-response curve in our study revealed a nonlinear association between ozone exposure and COPD prevalence. Notably, the association appeared to cross OR = 1.0 at approximately 80–82 µg/m3 (expressed as the annual average of the daily maximum 8-h moving average concentration), suggesting that this concentration may represent a potential reference point beyond which ozone exposure is more clearly associated with elevated COPD risk. These observed patterns suggest that reducing ozone concentrations to below 80 µg/m3 may be a meaningful target for reducing the COPD burden at the population level. However, as this concentration-response curve was generated descriptively using restricted cubic splines rather than a formal threshold analysis, these observations should be interpreted with caution and warrant further investigation in future longitudinal studies using formal threshold modeling.
This study had several limitations. First, its cross-sectional design precluded the establishment of a causal relationship between long-term ozone exposure and COPD; notably, “long-term” exposure here refers to average annual ozone concentrations over multiple years, reflecting chronic ambient exposure levels rather than data obtained from a longitudinal follow-up design. Second, ozone exposure misclassification cannot be ruled out because we relied on ambient ozone concentrations at the participants’ residential addresses as a proxy for personal exposure. However, if such a misclassification exists, it would likely bias our estimates toward the null hypothesis. Third, participants excluded due to the inability to complete or meet the spirometric quality criteria were generally older, and thus, may have a higher prevalence of COPD. This may have attenuated the observed association between ozone exposure and COPD. Fourth, our assessment of SES at the county level relied exclusively on GDP per capita, a metric that failed to capture other crucial area-level dimensions of SES, such as access to green spaces and healthcare facilities. Finally, we were unable to account for other meteorological factors, such as solar radiation, which may have modified the association between ozone and COPD, owing to data scarcity[41].
-
In conclusion, this large-scale, nationally representative study provided robust evidence that long-term ambient ozone exposure is associated with a higher prevalence of COPD in China. Importantly, individuals residing in socioeconomically disadvantaged and colder regions bore a disproportionately higher burden of ozone-related COPD, even after adjusting for individual-level behavioral risk factors and socioeconomic confounders. These findings revealed pronounced environmental inequalities in chronic respiratory health outcomes and shed light on the underlying determinants. Our findings underscore the urgent need for targeted public health interventions, including more stringent air quality regulations in high-risk areas and strengthened healthcare capacity in low-SES regions, to mitigate the further widening disparities in the ozone-related COPD burden.
HTML
Participants and Study Design
Data Source
Individual-level Prevalence of COPD and Risk Factors
Exposure to Air Pollutants
County-level Covariates
Statistical Analysis
General Characteristics
Association between Ozone Exposure and COPD Prevalence
Stratified Analyses by County-level Geographic, Socioeconomic, and Temperature Factors and Individual-level Factors
Additive Interactions of Ozone with SES and Winter Temperature
Competing Interests The authors declare that they have no competing financial interests or personal relationships that could have influenced the work reported in this study. Ning Wang is an editorial board member of the Biomedical and Environmental Sciences.
Ethics This study was approved by the Ethical Review Committee of the National Center for Chronic and Noncommunicable Disease Control and Prevention, Chinese Center for Disease Control and Prevention (Reference No. 201410). All the participants provided written informed consent.
Authors’ Contributions Conceptualization: Jing Wu, and Ning Wang; Data Curation: Baohua Wang, Rui Zhao, and Bingbing Wang; Formal Analysis: Ning Wang; Funding Acquisition: Jing Wu and Ning Wang; Methodology: Ning Wang, Zhiwei Xu, Jian Cheng, and Wenbiao Hu; Supervision: Jing Wu; Writing - Original Draft: Ning Wang; Writing - Review & Editing: Baohua Wang, Zhiwei Xu, Jian Cheng, Xuefei Feng, Shuai Wang, Rui Zhao, Bingbing Wang, Wenbiao Hu, and Jing Wu.
Data Sharing The authors do not have permission to share data. The supplementary materials will be available in www.besjournal.com.

 Quick Links
 DownLoad: