



-
Hyperuricemia (HUA) is a common metabolic disorder characterized by abnormal purine metabolism and impaired uric acid excretion[1]. It is a significant risk factor for gout, cardiovascular diseases, and chronic kidney disease and imposes a substantial burden on global public health[2]. Notably, its epidemiological profile is shifting, with a marked increase in prevalence among younger populations[3]. This trend underscores the urgency to identify modifiable environmental and lifestyle drivers beyond traditional factors such as diet and renal function.
The circadian rhythm is a physiological cycle driven by an organism's internal timing system and regulated by environmental light exposure, which participates in modulating numerous metabolic and physiological processes[4]. In modern society, circadian rhythms are frequently disrupted by common behaviors, such as shift work, transmeridian travel, and chronic sleep deprivation[5]. Such circadian rhythm disruption (CRD) impairs metabolic homeostasis and has been recognized as a key environmental trigger for metabolic dysregulation, including insulin resistance and dyslipidemia[6]. Furthermore, the study found a positive correlation between CRD and the prevalence of hyperuricemia, with prolonged light exposure significantly increasing the risk of hyperuricemia[7]. These findings suggest that CRD may be an overlooked environmental contributor to HUA.
Increasing evidence suggests that non-renal excretion pathways, particularly intestinal excretion, have an indispensable role in regulating uric acid homeostasis[8]. ATP-binding cassette transporter G superfamily member 2 (ABCG2), a core urate transporter expressed in intestinal epithelial cells, serves as the key effector molecule in the intestinal uric acid excretion pathway[9]. Its dysfunction is closely associated with reduced intestinal uric acid clearance and the onset of hyperuricemia[10]. However, in CRD-induced hyperuricemia, the upstream regulatory factors and molecular mechanisms governing intestinal ABCG2 expression remain poorly understood. The gut microbiota (GM), a complex microbial community colonizing the intestines, possesses an intrinsic circadian rhythm regulated by the host light-dark cycle[11]. Importantly, the GM plays a central role in maintaining intestinal function by participating in nutrient absorption, preserving intestinal epithelial barrier integrity, modulating mucosal immune responses, and maintaining the intestinal microenvironment[12]. Numerous studies have confirmed that gut dysbiosis is a key factor mediating CRD-induced metabolic disorders, and microbial metabolites serve as crucial intercellular messengers linking gut microbial homeostasis with host metabolic function[13]. Notably, indole-3-lactic acid (ILA), a microbiota-derived metabolite with potential metabolic regulatory functions, is downregulated in animal models of CRD[14]. ILA exerts protective effects in various metabolic disorders by modulating intestinal epithelial cell function and transporter expression[15]. Although gut microbiota and their metabolites can regulate intestinal transport proteins[16], it remains unclear whether ILA mediates intestinal ABCG2 expression and uric acid excretion, thereby contributing to CRD-induced HUA.
Accordingly, the present study aimed to clarify whether light-induced CRD leads to hyperuricemia, investigate the role of gut microbiota in this process, and elucidate how GM influence uric acid levels. Specifically, we focused on the molecular mechanisms by which reduced levels of GM metabolite ILA contribute to CRD-induced HUA, the regulatory role of Ras in mediating ILA effects on intestinal uric acid metabolism, and the potential therapeutic value of ILA as a target for CRD-induced HUA.
-
Male Sprague-Dawley (SD) rats weighing 200–220 g were supplied by the Animal Experiment Center of the Naval Specialty Medical Center. The rats were housed in a well-ventilated animal facility with controlled temperature (26 ± 2 °C) and humidity (50%–60%) and had ad libitum access to water and food. The normal rhythm group was maintained under a 12-h light/12-h dark cycle, whereas the CRD model group was exposed to the designated lighting conditions for model establishment. All experimental protocols adhered to ethical guidelines and were approved by the Institutional Animal Care and Use Committee (IACUC) of Naval Medical University (Protocol No. NMU-20210901).
-
Information on the main reagents are as follows: PBS buffer (Wuhan Servicebio), uric acid colorimetric assay kit (Wuhan Elabscience), reverse transcription kit (Takara, Japan), fluorescence quantitative PCR kit and RNA extraction kit (Beijing TransGen Biotech), BCA protein quantification kit (Beijing Solarbio), ILA and xanthine oxidase activity detection kit (Beijing Solarbio), sodium pentobarbital (Beijing Fanbo), and the human normal intestinal epithelial cell line HIEC-6 (Shanghai zqxzbio).
-
Information on the main apparatus are as follows: time controlled light animal breeding box (Shanghai Experiment Factory), small animal gas anesthesia machine (E-Z Systems, USA), vortex mixer (Jiangsu Guohua Instruments), constant-temperature incubator (Heraeus, Germany), pipette (Eppendorf, Germany), handheld centrifuge (Scilogex, USA), lightCycler® 96 fluorescence quantitative PCR instrument (Roche, Switzerland), tissue grinder (Wuhan Servicebio), PCR gene amplifier (Hangzhou LongGene), electronic precision balance (METTLER TOLEDO, Shanghai), small animal ventilator (RWD, Shenzhen), and ice maker (Scotsman, Italy).
-
All experimental animals were initially housed in an animal room with suitable temperature and humidity for a 1-week acclimation period and had ad libitum access to food and water. After acclimation, rats were assigned to different experimental groups using a random number table to minimize selection bias. Rats in the experimental and control groups were housed under a 12-h light/12-h dark (12L:12D) photoperiod, with lights on at circadian time (CT) CT8 and lights off at CT20. Light intensity was uniformly set at 250–300 lux in the dark cycle (LD), constant light (LL), and circadian disruption (CD) groups, whereas the constant dark (DD) group was maintained in complete darkness throughout the experiment. The LL model was established by housing rats in light-controlled chambers under continuous 24-h illumination for 4 weeks, with ad libitum access to food and water.
The DD model was established by maintaining rats in light-controlled chambers under continuous 24-h darkness for 4 weeks, with ad libitum access to food and water.
For the CD model, circadian time 8 (CT8) was designated as Zeitgeber Time 0 (ZT0), and CT20 was designated as ZT12. The light-controlled chambers were programmed to turn on at ZT0 and turn off at ZT12, maintaining a 12L:12D photoperiod. Subsequently, the light-on and light-off times were advanced by 6 h every 2 days while retaining the 12L:12D cycle, shifting the light phase to lights-on at ZT18 and lights-off at ZT6. This schedule was maintained continuously for 4 weeks.
-
Six rats were randomly allocated to three cages, with two rats housed in each cage. Cumulative food intake was recorded for each cage over 4 weeks. Average daily food intake per cage was calculated as total food intake per cage divided by 28 (g/d). The body weight of each rat was measured at the same time each week, and body weight growth rate was calculated as follows: body weight growth rate = (current-week body weight - previous-week body weight)/previous-week body weight × 100%.
-
All plasma, intestinal tissue, and fecal samples were collected at the fixed time point of ZT0 (light-on moment) to minimize interference from endogenous circadian fluctuations in experimental indicators.
For ILA administration, ILA was dissolved in sterile PBS. Rats received ILA by intragastric gavage at a daily dose of 20 mg/kg for 4 consecutive weeks.
-
Fresh fecal samples from rats (1–2 fecal pellets) were collected in sterile Eppendorf (EP) tubes and immediately stored in liquid nitrogen. Bacterial genomic DNA was extracted using the DNeasy PowerSoil kit (QIAGEN). DNA concentration was evaluated by spectrophotometry, and DNA integrity was assessed by agarose gel electrophoresis.
The hypervariable V3–V4 region of the bacterial 16S rRNA gene was amplified by polymerase chain reaction (PCR) in a 25 μL reaction system using universal primer pairs 343F (5′-TACGGRAGGCAGCAG-3′) and 798R (5′-AGGTATCTAATCCT-3′). The quality of the amplification products was verified by gel electrophoresis. After purification using a nucleic acid purification kit, products were quantified with the Qubit double-stranded DNA (dsDNA) assay kit. After adjusting the concentration, sequencing was performed on the Illumina NovaSeq6000 platform.
Primer sequences were removed from the raw FASTQ data using Cutadapt software. Quality filtering, denoising, sequence merging, and chimera removal were then performed using the DADA2 plugin in QIIME 2 (2020.11) to obtain valid tags and an amplicon sequence variant (ASV) abundance table. ASV representative sequences were aligned against the Silva database (version 138) using the q2-feature-classifier plugin for taxonomic annotation.
Alpha diversity was analyzed using the ACE, Chao1, Shannon, and Simpson indices, whereas beta diversity was evaluated using principal coordinate analysis (PCoA). Differential species between groups were screened using t-tests and the Wilcoxon algorithm. The numbers of differential ASVs and differential genera were statistically analyzed to clarify the influence of CRD on GM composition in rats.
-
Rat plasma (100 μL) was extracted with a methanol-acetonitrile mixed solution containing L-2-chlorophenylalanine. After extraction, the mixture was centrifuged. Subsequently, the supernatant was redissolved in a methanol-water solution, filtered, and stored at -80°C. Quality control samples were prepared by mixing equal volumes of extracts from each sample. Detection was performed using an ultra-high-performance liquid chromatography-high-resolution mass spectrometry system (UHPLC-QE MS) in both positive and negative ion modes. Multivariate statistical analysis was conducted using orthogonal partial least squares discriminant analysis (OPLS-DA) and Venn diagrams, combined with volcano plot screening, to identify differential metabolites. Kyoto Encyclopedia of Genes and Genomes (KEGG) pathway enrichment analysis was performed on the differential metabolites to identify significantly enriched metabolic pathways.
-
ILA content in rat plasma was measured using an ELISA kit (Shanghai FUSHENBIO) according to the manufacturer's instructions.
-
After 3 weeks of antibiotic administration, SPF-grade rats were divided into two groups for the FMT experiments. Rats in the LD group received 1 mL of PBS by daily gavage (LDPBS), whereas rats in the LDFMT group received 1 mL of fecal bacterial suspension from LL rats by daily gavage fresh feces were collected from each group, diluted with sterile saline, thoroughly mixed, and centrifuged at 3,000 rpm for 10 minutes. The supernatant was collected as the fecal bacterial suspension, and each rat received 1 mL by daily gavage for 4 consecutive weeks.
-
Total RNA from intestinal tissue was extracted with TransZol UP reagent (TransGen Biotech, China). RNA was reverse transcribed into cDNA using a reverse transcription kit (Takara, Japan), and cDNA was amplified using SYBR Green qPCR Mix (TransGen Biotech). Relative expression was calculated using the 2-ΔCt method and normalized to GAPDH. All primers used in the experiment are listed in Table 1.
Gene ID Forward (5’-3’) Reverse (5’-3’) GAPDH(Glyceraldehyde-3-phosphate dehydrogenase) GACATGCCGCCTGGAGAAAC AGCCCAGGATGCCCTTTAGT Gli(Glioma-associated oncogene) CGTTTGAAGGCTGTCGGAAGTCC GGTCACTGGCGTTGCTGAAGG ERK1(Extracellular signal-regulated kinase 1 ) ACCCTGAGCACGACCACACTG CAGCCCACAGACCAGATGTCAATG ERK2(Extracellular signal-regulated kinase 2) TGAAGACACAGCACCTCAGCAATG GGTGTTCAGCAGGAGGTTGGAAG NFE2L2(Nuclear factor, erythroid 2 like 2) GCCTTCCTCTGCTGCCATTAGTC TGCCTTCAGTGTGCTTCTGGTTG NF-κB(Nuclear factor kappa-light-chain-enhancer of activated B cells) TGTGGTGGAGGACTTGCTGAGG AGTGCTGCCTTGCTGTTCTTGAG YAP(Yes-associated protein) AGCCGCCTGAGCCCAAGTC GGGAGGCTGGAGACGAGTGAG TAZ(WW domain containing transcription regulator 1) ATTGGACGGCTGATTGCTGAGTG GTAGGGTGGACTGTTAGGGAGGAC TCF7L2(Transcription factor 7 like 2) TCGCCAGCACACATCGTTTCG CTGGTAAGTGCGGAGGTGGATTTC TCF7L1(Transcription factor 7 like 1) GCCAGCAACTCCAGCCAGATG AGCAGAGCGGTGGGCATAGAG TCF7(Transcription factor 7) GGAAAGAAGAAGAGGCGGTCAAGG GAGCACTGTCATCGGAAGGAACG STAT1(Signal transducer and activator of transcription 1) TCGCACCTTCGTCCTCTTCCAG ACCAACAGTCTCAGCTTCACAGTG STAT2(Signal transducer and activator of transcription 2) GCACTCAGTTGGCAGTTCTCCTC GCTCTCTCGCTTGCTGAAGTCTG STAT3(Signal transducer and activator of transcription 3) AGGGCTTCTCGTTCTGGGTCTG CTCCCGCTCCTTGCTGATGAAAC STAT4(Signal transducer and activator of transcription 4) GGCAGAGAAGCTCACAGTTCAGTC CAAGCCAGGTCCAGAAGGTAAACG STAT5a(Signal transducer and activator of transcription 5A) GCCGTGGGATGCTATTGACTTGG CCTGGTGTTCTGCCTTCTTCTGC STAT5b(Signal transducer and activator of transcription 5B) AACAGCAGCAGCAACCACCTC AACACCTCCATCACACCGTCAAAC STAT6(Signal transducer and activator of transcription 6) TTGGCAGTGGTTTGATGGTGTCC TGGCTCGTTGAGGAGAAGGCTAG Ras(Rat sarcoma virus oncogene homolog) CCTCGGGGCTCTACCTGCTG CGCTGTTTGTCGGACTCCTTGG BRAF(B-Raf proto-oncogene, serine/threonine kinase) TCCATTCCAATTCCACAGCCCTTC GCGGAGGAGGAGCGGTCTC Raf1(Raf-1 proto-oncogene, serine/threonine kinase) CCCACATCAACAACCGAGACCAG CACAGTCAGCCACCAACCTCTTC ARAF(A-Raf proto-oncogene, serine/threonine kinase) AGTTTGGCCTTCTGTGACTTCTGC TTGGAGGAACAATGCTGGTGGAAC Map2k2(Mitogen-activated protein kinase kinase 2) GCTGTCCGCAACCAGATCATCC TCTCGCCGTCGCTGTAGAAGG Map2k1(Mitogen-activated protein kinase kinase 1) GACGAGCAGCAGCGGAAGC ACCTTGAACACCACTCCACCATTG AKT(AKT serine/threonine kinase) CAGGAGGAGGAGACGATGGACTTC CACACGGTGCTTGGGCTTGG Lats2(Large tumor suppressor kinase 2) GAGCACAGAAGCAGCACCAGAG ACCGACACTCCACCAGTCACAG Lats1(Large tumor suppressor kinase 1) ACCACCACCACCATATCCTCTGAC GACTGTTCCTGTTCGGCACCATC Tead4(TEA domain transcription factor 4) AGCCAGTATGAGAGCACGGAGAG CCAGTGAAAGGGAGCACACAGAC Tead3(TEA domain transcription factor 3) GCTCGGAAGAAGGTTCGGGAATAC TGTAGGACGCTGGCAGAGACG Tead2(TEA domain transcription factor 2) AGTGGTGGAGAAGGTGGAGACAG ACGGAGCTTGTGCAGGAAGTTG Tead1(TEA domain transcription factor 1) AGCTGGGACTGCCTGGGATTC GCTGTGACTGCTGGCTGGATG Tyk2(Tyrosine kinase 2) CACCTCTGCCATCTTGCTCTCAAC GTGCTGGCGGATGTGCTGAC Jak3(Janus kinase 3) TGTGCCGCTACGACCCTCTG AATCTCTCGCTGGAAGTCCCTCTG Jak2(Janus kinase 2) AAGTGCGTGCGAGCGAAGATC ACTGCTGAATGAACCTGCGGAATC Jak1(Janus kinase 1) GTTGACCACTTTCCCAGCCTGAG CAGCAGCGTTTCAGCACAAAGC Keap1(Kelch-like ECH-associated protein 1) TGCTCAACCGCTTGCTGTATGC TCATCCGCCACTCATTCCTCTCC Mtor(Mechanistic target of rapamycin kinase) GTGTGGCAAGAGCGGCAGAC TGTTGGCAGAGGATGGTCAAGTTG PI3k(Phosphoinositide 3-kinase) GCTGTTGATAGACCACCGCTTCC TGCCCTGTTCCTCTGCCTTCC NF2(neurofibromin 2) TGAAGTGCTGGCGTTGAAGATG GTGGGCTTGGTGGCGATTTC Ikkβ(inhibitor of nuclear factor kappa B kinase subunit beta) CTGCCTCTCCAAGATGAAGAATGC GATGTGATGCCAAACTCCGTCTG ABCG2(ATP binding cassette subfamily G member 2) GATAAACGGGGCACCTCAACCTG GGCGAAGAGCTGCTGAGAACTG Bmal1(Aryl hydrocarbon receptor nuclear translocator-like protein 1) AGGACTTCGCCTCCACCTGTTC GCCCTCATTGTCTGGTTCACTGTC Clock(clock circadian regulator) ACGGCGAGAACTTGGCATTGAG ACCTTTCCAGTGCTTCCTTGAGAC Per2(period circadian regulator 2) CGCCATCCACAAGAAGATCCTACAG CCTGCTCCACGGGTTGATGAAG Cry1(cryptochrome circadian regulator) CCAGCAGACACCATCACATCAGAC GCAGAGGACAAGCCATCGGTATC Cry2(cryptochrome circadian regulator) CGTCAGTGGGCATCAAC CCTTGGGAACACATCAGC Note. Table 1. Primer sequences used in this experiment
-
After thawing in a 37°C water bath, HIEC-6 cells were centrifuged, resuspended in specialized complete medium, and seeded into T25 flasks. The medium was replaced every 2 days after washing with PBS. During subculture, cells were digested with trypsin, centrifuged to terminate digestion, and passaged at a 1:2 ratio. In siRNA transfection experiments, cells were seeded in 6-well plates at the appropriate density and incubated with transfection reagent for 24 h, after which RNA samples were collected by centrifugation for subsequent experiments.
-
All data are presented as mean ± SD. The Shapiro-Wilk test was used to evaluate normality, and Bartlett's test or the F-test was used to assess homogeneity of variance. For two-group comparisons, the t-test was performed for normally distributed data with homogeneous variance, whereas the Wilcoxon rank-sum test was used for non-normally distributed data. Multiple-group comparisons were analyzed using one-way and two-way ANOVA, followed by Tukey's post hoc test. Longitudinal body weight and food intake data were analyzed using repeated-measures ANOVA. For gut microbiota analysis, alpha diversity was compared using nonparametric tests, and beta diversity differences were evaluated by PERMANOVA. For plasma metabolomics, OPLS-DA combined with permutation testing was used to distinguish metabolic profiles between groups. Because metabolomics is exploratory and hypothesis-generating, overly strict FDR thresholds may limit the identification of biologically meaningful metabolites. Differential metabolites were screened using raw P < 0.05 combined with fold change (FC ≥ 2 or ≤ 0.5) to balance statistical rigor and biological discovery. The Benjamini-Hochberg method was applied for multiple-comparison correction, and both uncorrected P values and FDR-adjusted P values (Q values) were listed in the supplementary tables for reference (Supplementary Material 1). Pearson correlation analysis was used to evaluate correlations between two continuous variables. Statistical significance was defined as *P < 0.05, **P < 0.01, ***P < 0.001, ****P < 0.0001; ns P>0.05.
-
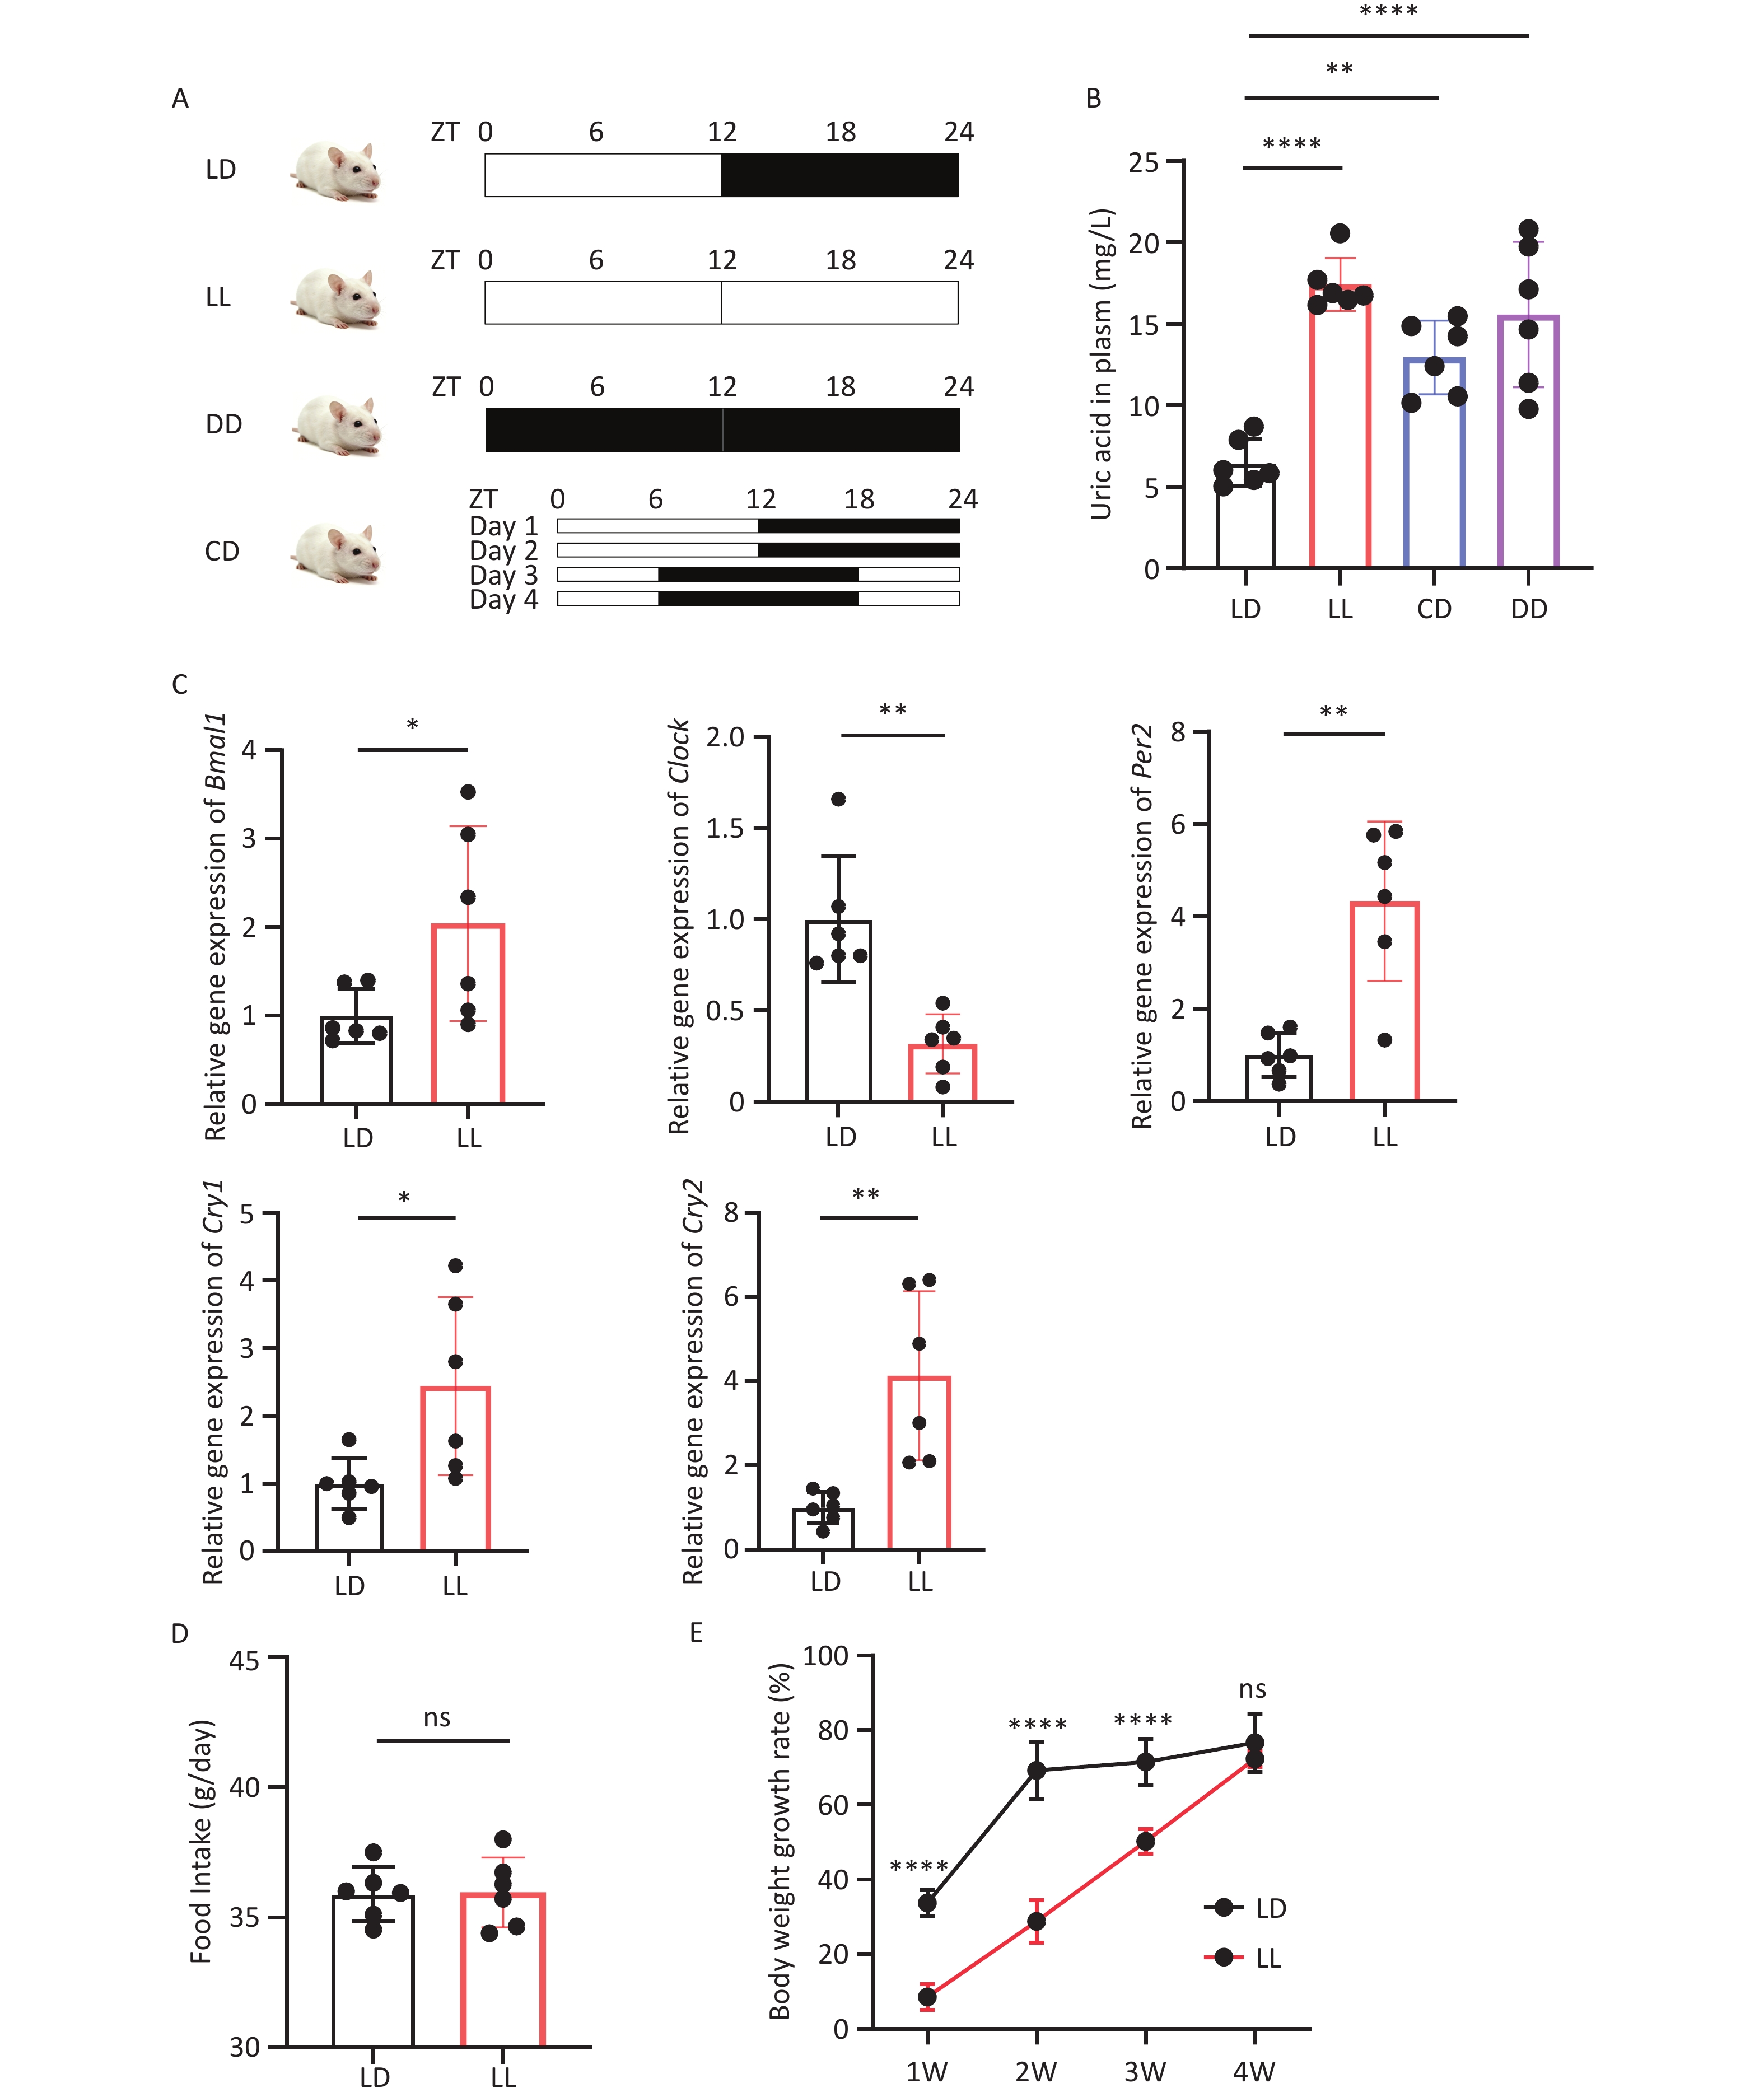
To investigate whether light-induced CRD affects uric acid metabolism, rats were randomly divided into LD, LL, CD, and DD groups after 1 week of environmental adaptation, and each group was exposed to the corresponding light conditions for 4 weeks. At the end of the modeling period, plasma uric acid levels were measured in all four groups. Compared with the LD group under normal light-dark cycles, the LL, CD, and DD groups all showed significant increases in plasma uric acid levels. Among these groups, the LL group exhibited the most pronounced elevation, whereas the CD group showed the smallest increase (Figure 1A,Figure 1B). Therefore, continuous light exposure was subsequently adopted as the CRD model for this study.
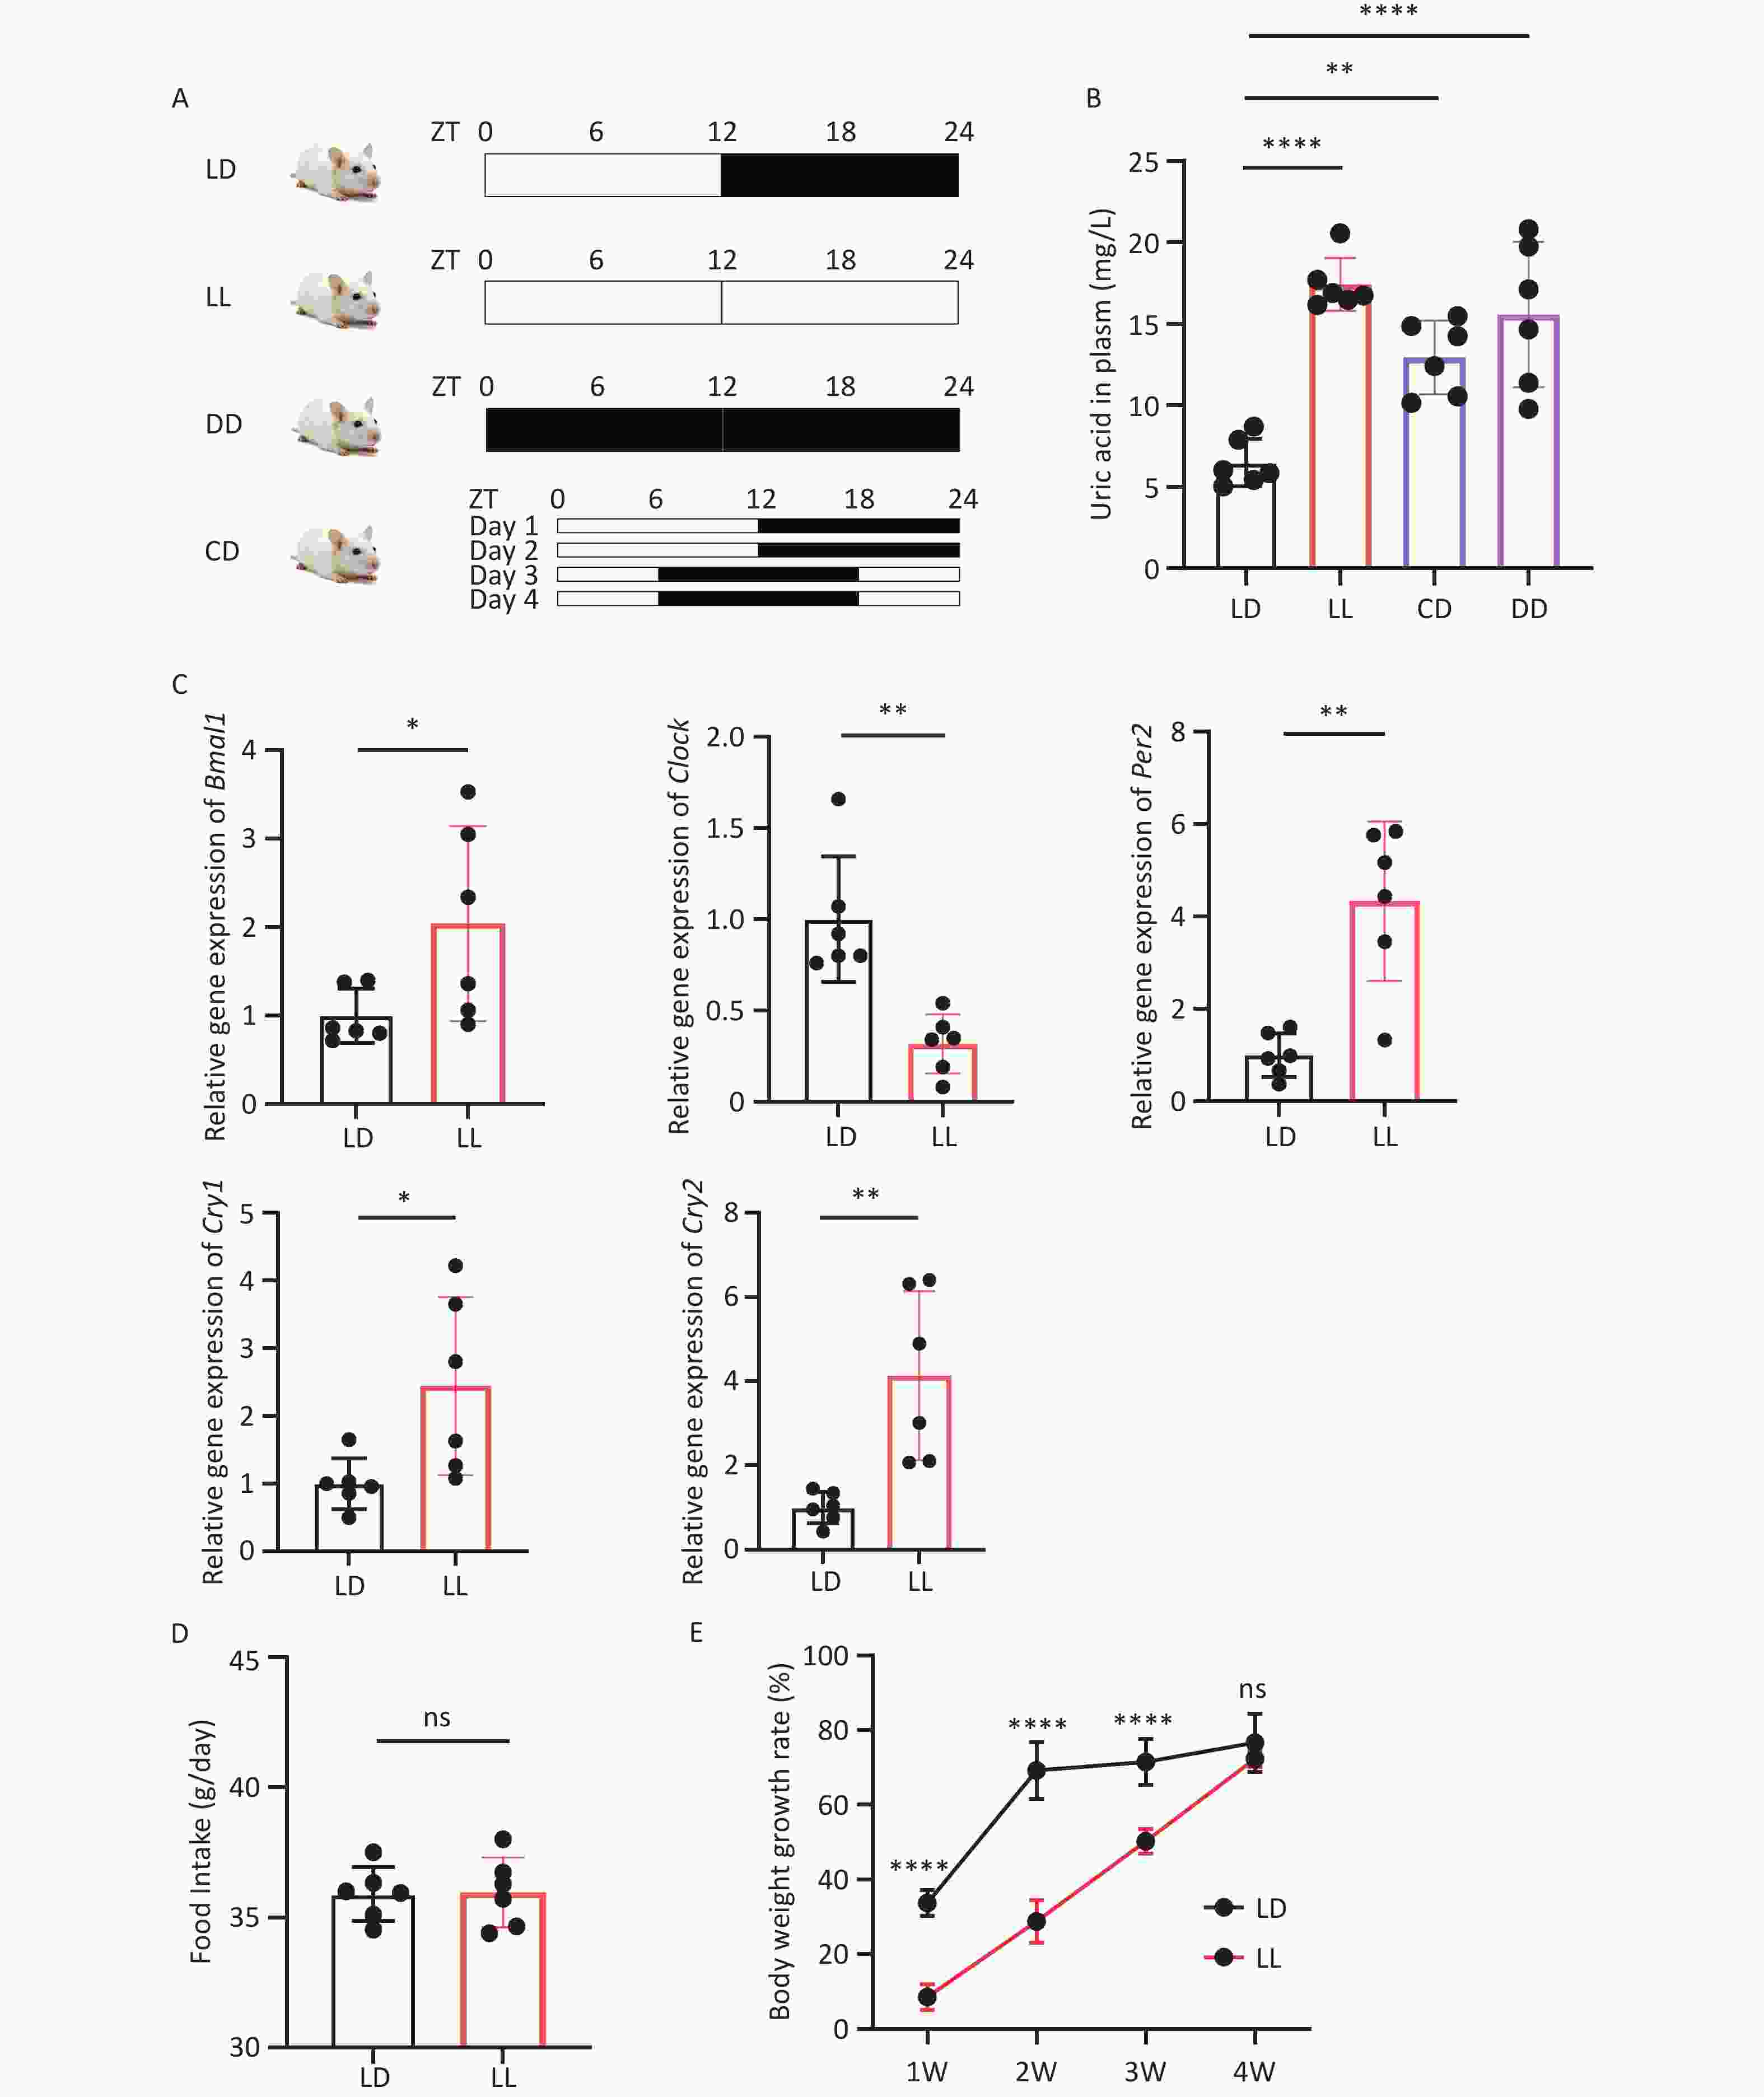
Figure 1. Intestinal clock disruption and uric acid elevation induced by CRD. (A) Schematic diagram of four experimental photoperiod regimens (LD, LL, DD, CD). (B) Plasma uric acid levels in four groups. (C) Relative mRNA expression of intestinal circadian clock genes. (D) Average daily food intake of rats. (E) Body weight gain rate within four weeks. ZT, Zeitgeber Time; CRD, circadian rhythm disruption. All data are presented as mean ± SD. Statistical differences were determined by one-way ANOVA followed by Tukey’s post-hoc test for multiple groups and t-test for two-group comparisons. *P < 0.05, **P < 0.01, ****P < 0.0001, ns P > 0.05, n = 6.
To determine whether the model affected intestinal circadian rhythm, small intestinal tissues were collected from rats at the same time point, and qPCR was used to detect the expression of clock genes. The expression levels of Bmal1, Per2, Clock, Cry1, and Cry2 in small intestinal tissues were altered under continuous light conditions (Figure 1C). Compared with the LD group, the LL group showed increased intestinal expression of Bmal1, Per2, Cry1, and Cry2, whereas the gene expression of Clock was decreased.
To assess energy metabolism of rats under altered light-dark cycles, we monitored food intake and body weight gain rate of rats in the LD and LL groups throughout the 4-week modeling period. Six rats from each group were randomly allocated to three cages (two rats per cage), and average daily food intake per cage was calculated over 4 weeks. No significant difference in average daily food intake was observed between the LD and LL groups (Figure 1D). Body weight was measured at the same time point each week to determine the weight gain rate, which was significantly decreased in the LL group (Figure 1E). Thus, after CRD, LL rats showed no significant change in food intake but had a notably reduced body weight gain rate compared with LD rats. This hypermetabolic state is distinct from traditional hyperuricemia characterized by elevated purine intake.
-
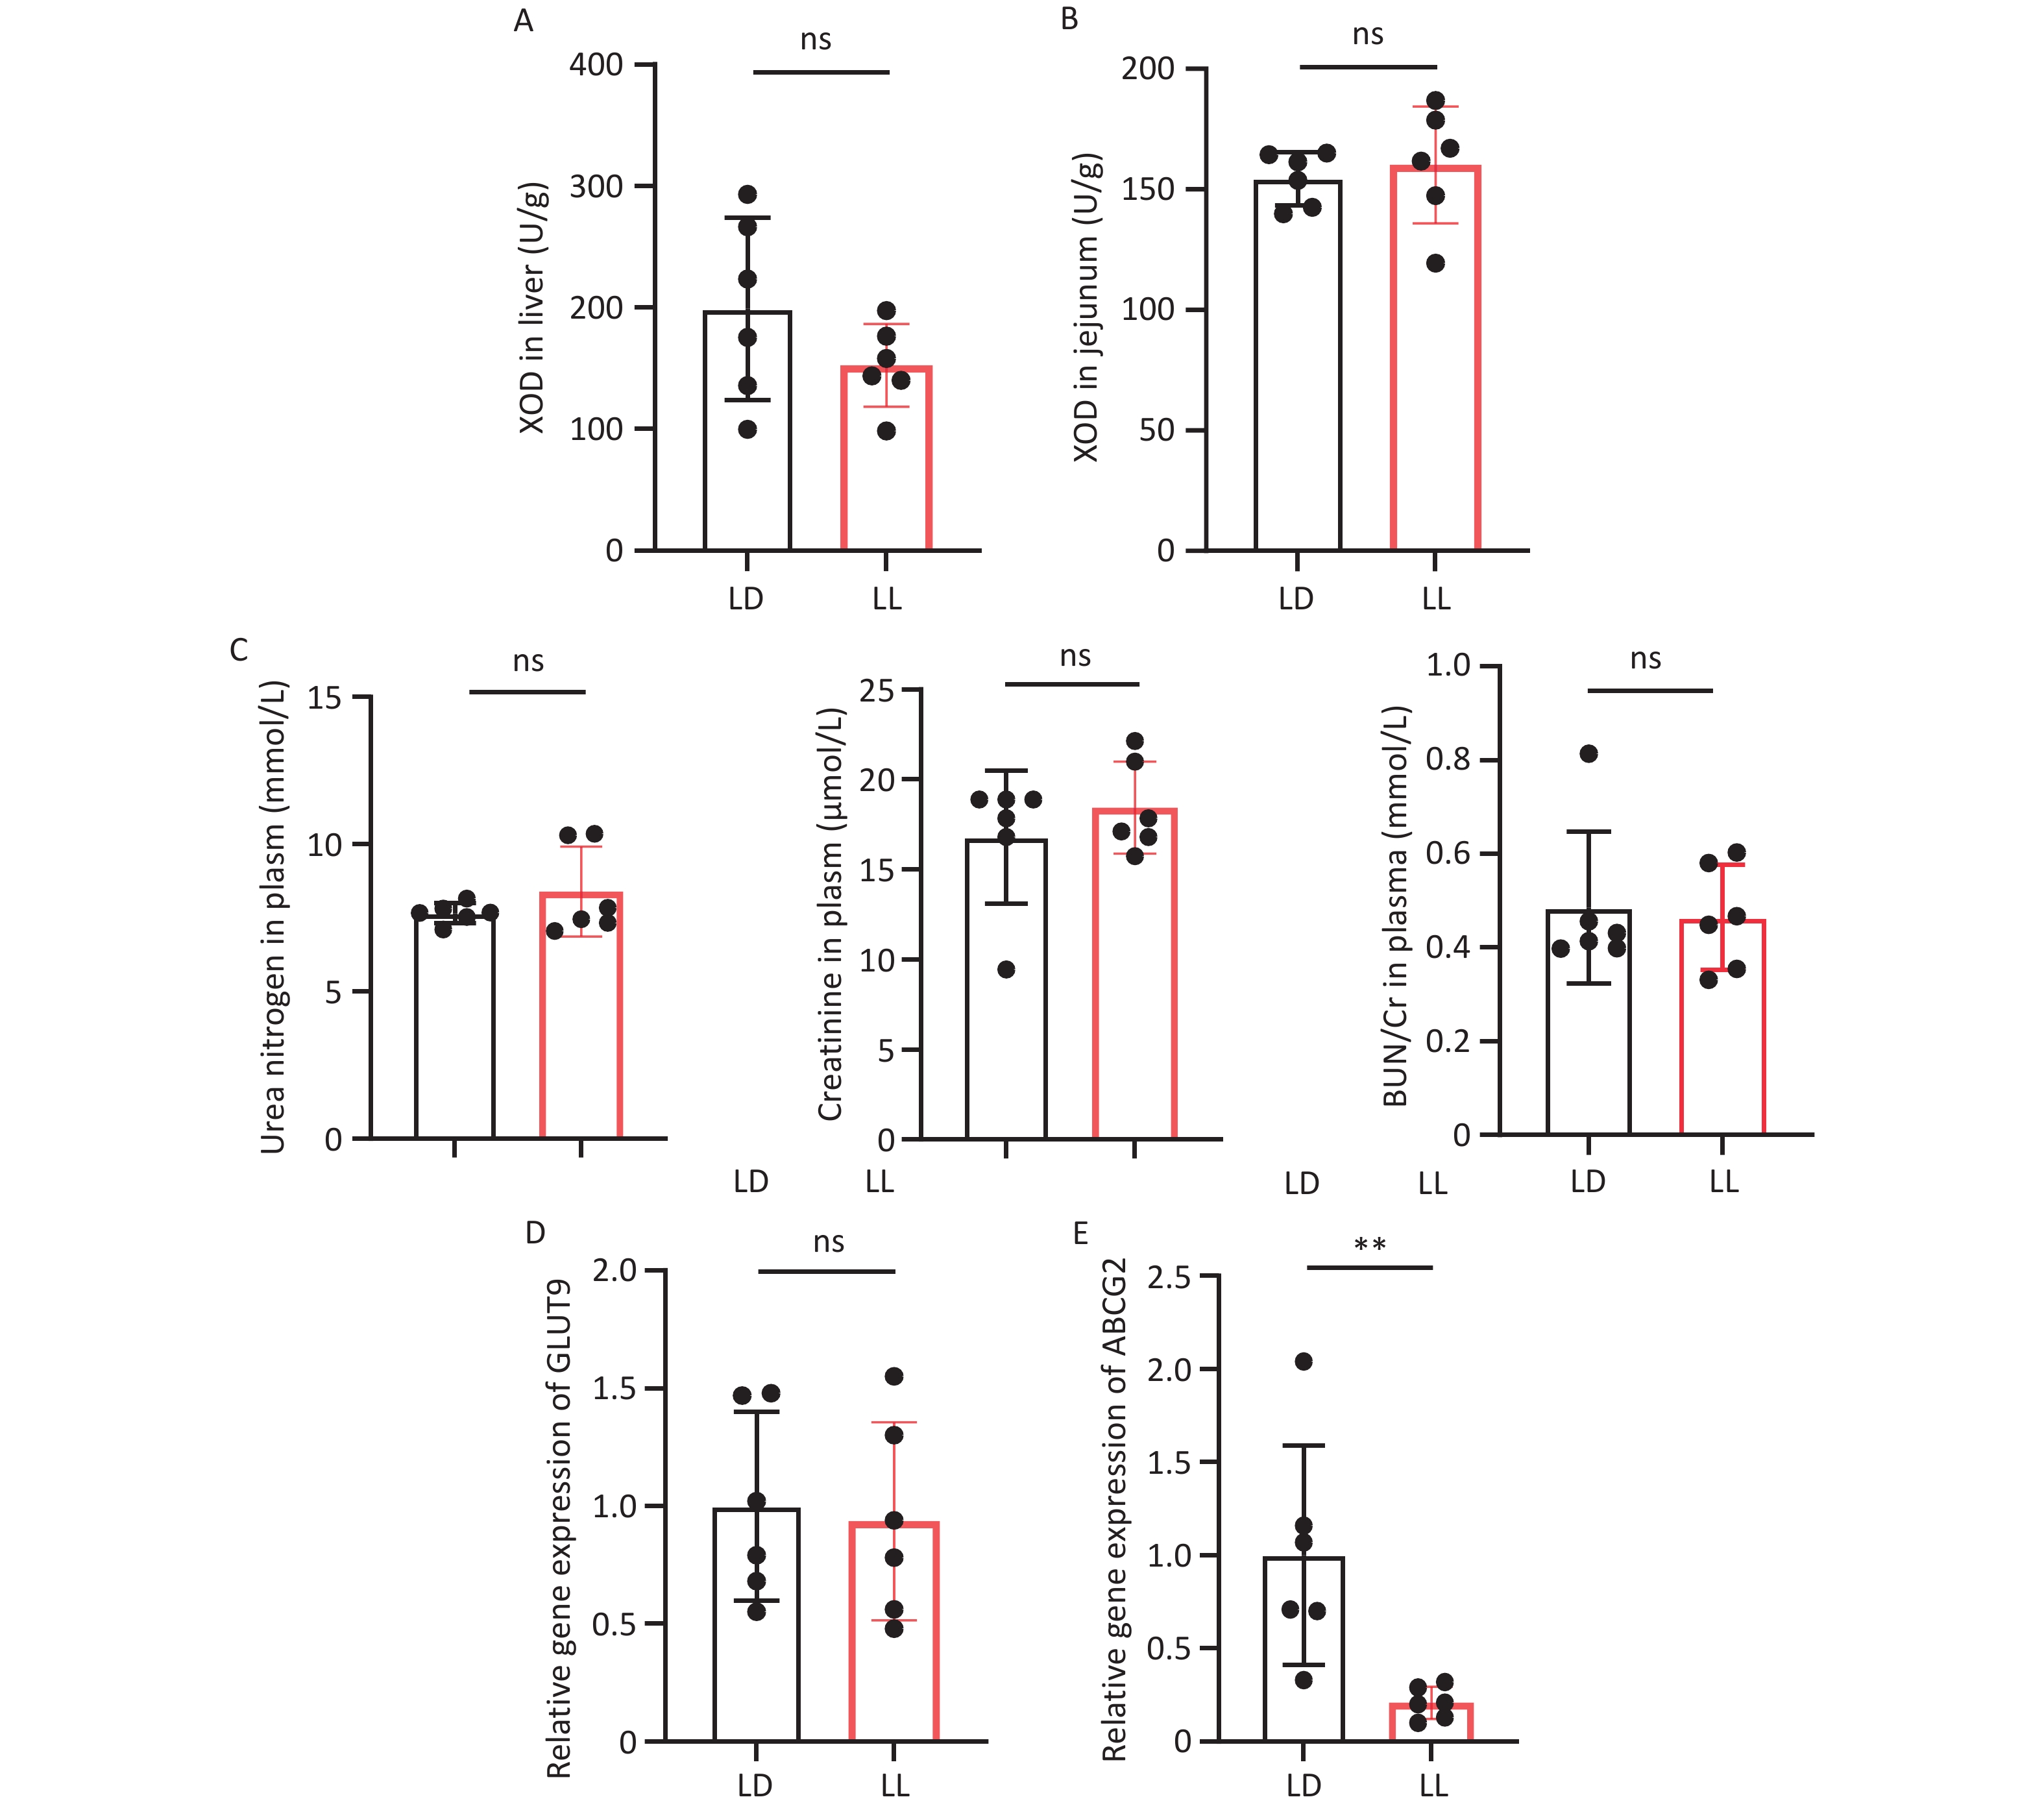
XOD is the most important rate-limiting enzyme in the purine synthesis pathway. To explore whether elevated uric acid levels after CRD were associated with increased purine synthesis, we first quantified XOD activity in rat liver tissues. No significant difference in hepatic XOD activity was observed between the LD and LL groups (Figure 2A). Because the gut microbiota can also synthesize XOD[17], we further examined intestinal XOD activity in rats. Similarly, no significant difference in small intestinal XOD activity was detected between the LD and LL groups (Figure 2B). These findings suggested that abnormalities in the purine synthesis pathway were unlikely to explain CRD-induced HUA.
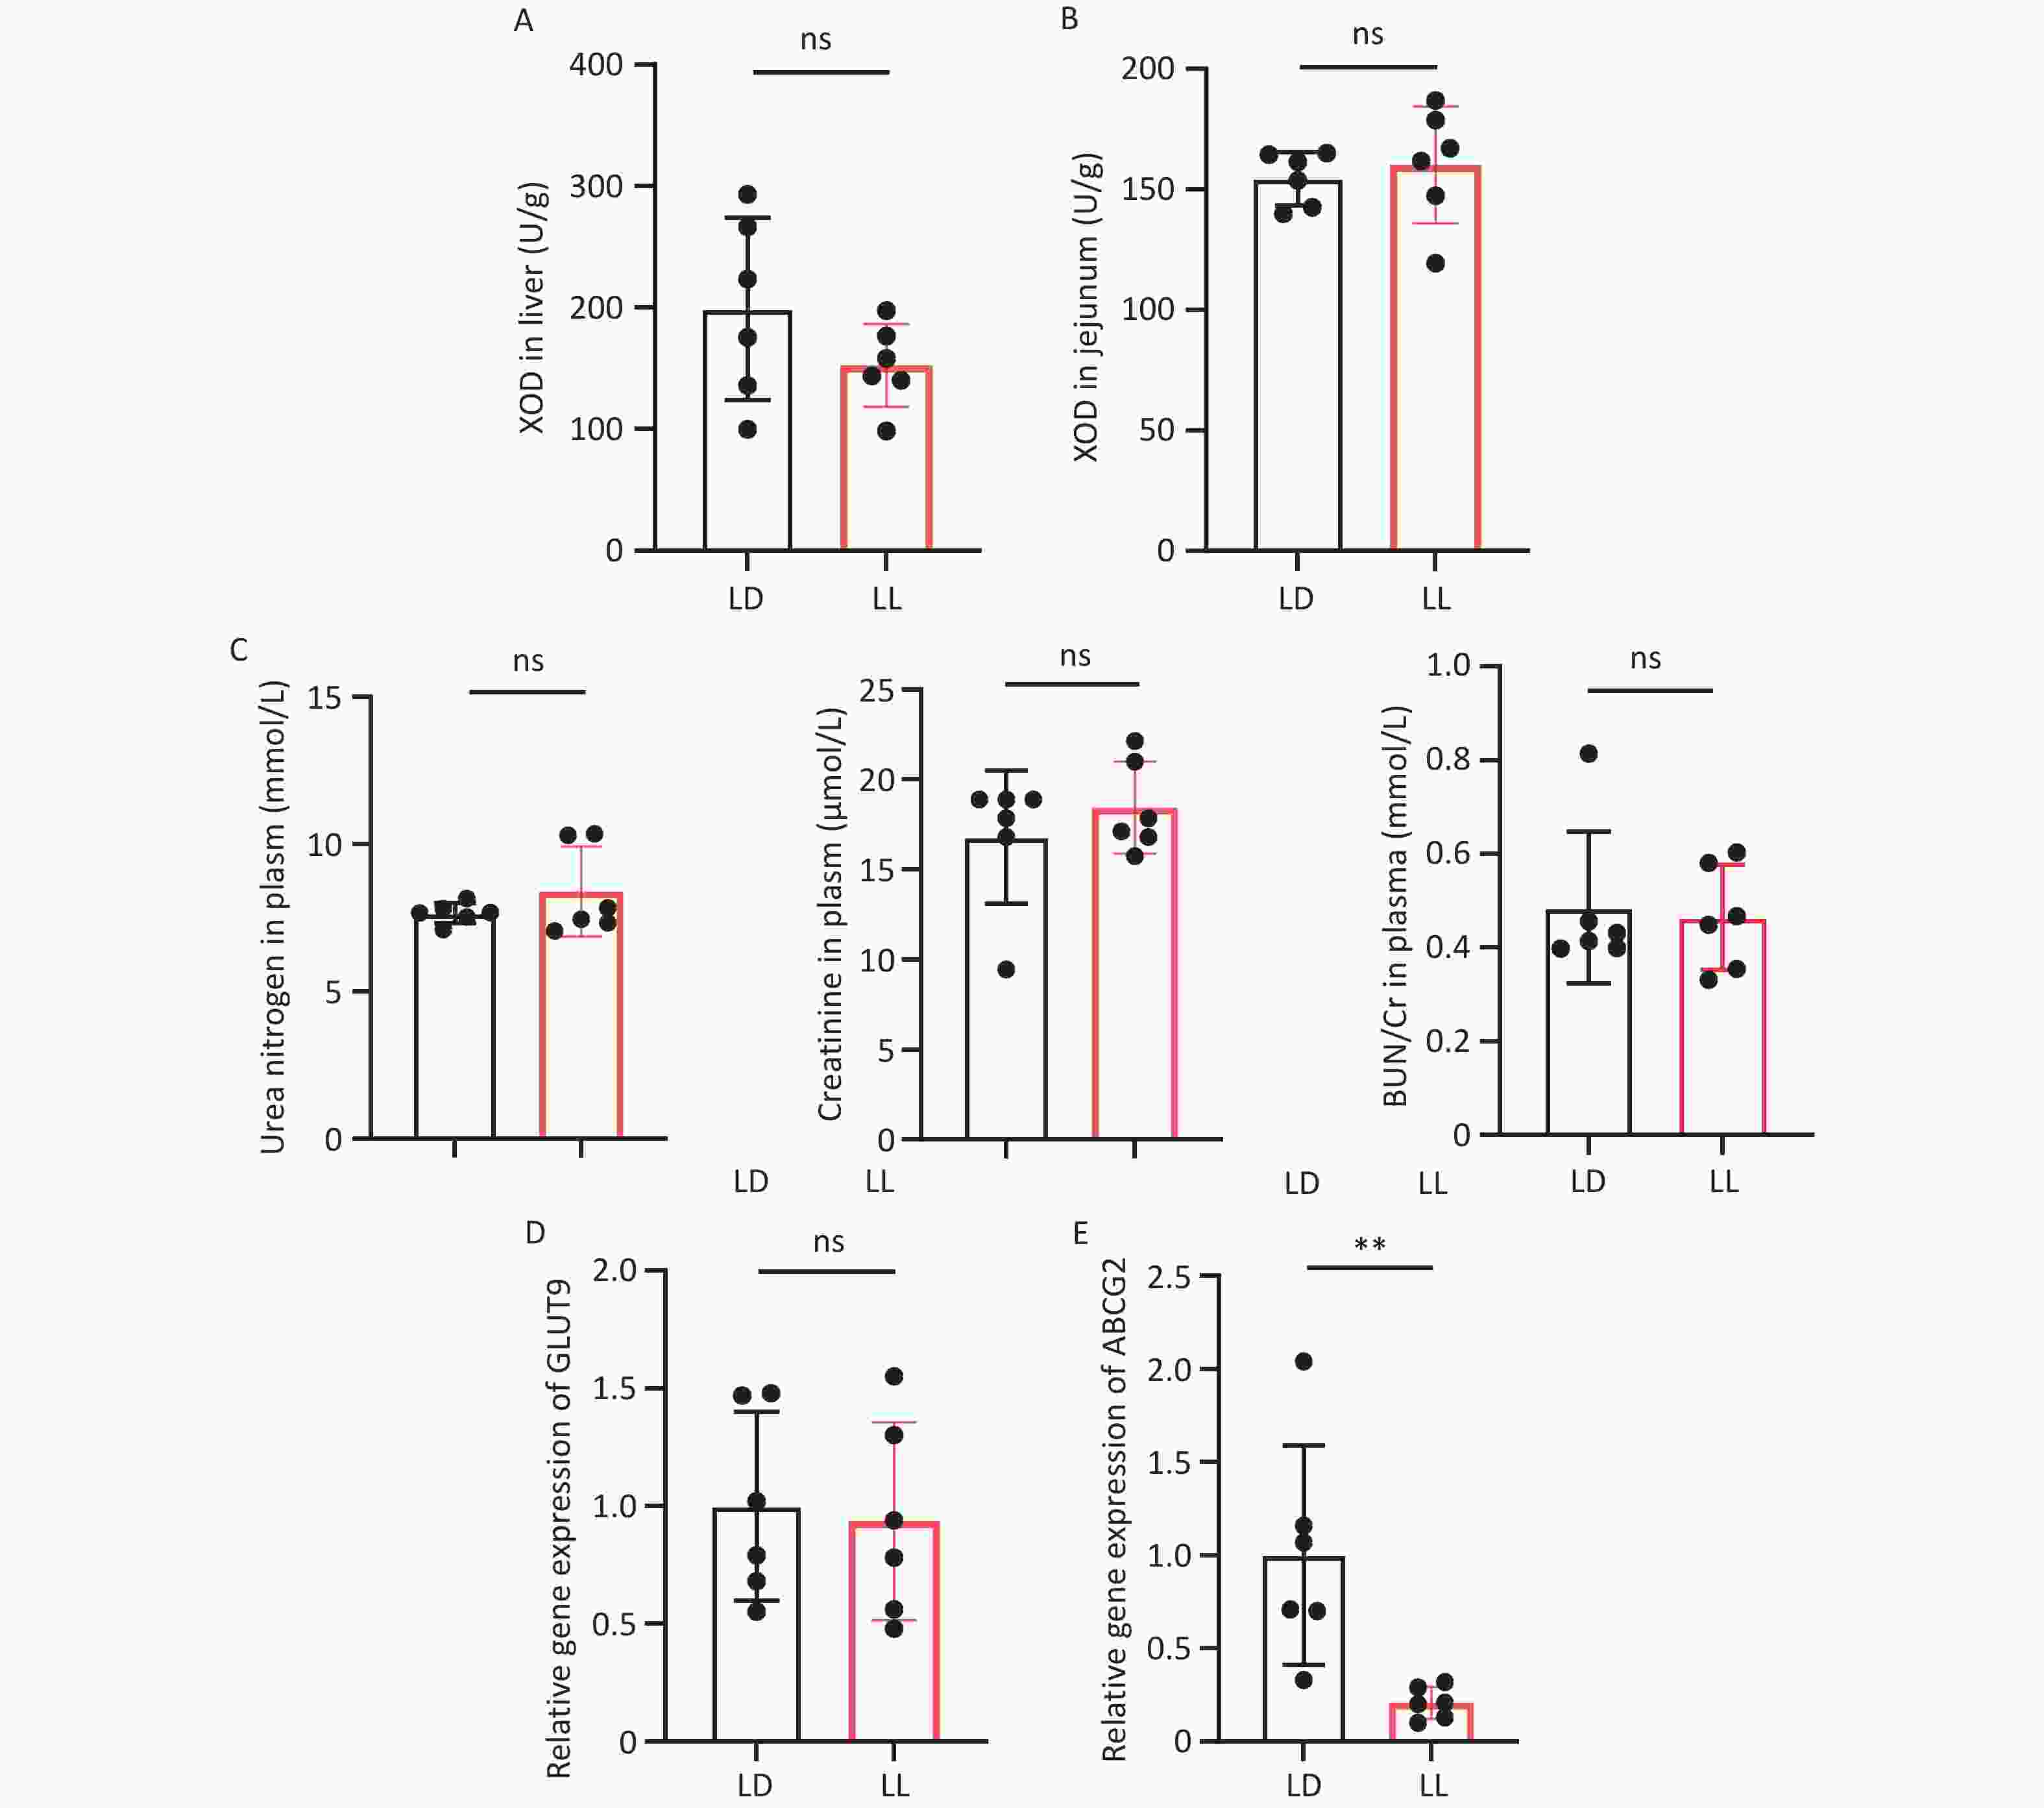
Figure 2. Intestinal excretion pathways are impaired in rats with CRD. (A) Hepatic XOD activity. (B) Jejunal XOD activity. (C) Plasma urea nitrogen content, creatinine content, and urea nitrogen to creatinine ratio. (D) Relative gene expression of intestinal urate transporter GLUT9. (E) Relative gene expression of intestinal urate transporter ABCG2. CRD, circadian rhythm disruption; XOD, xanthine oxidase; GLUT9, glucose transporter 9. Data are shown as mean ± SD. Two-group comparisons were performed using t-test. **P < 0.01, ns P > 0.05, n = 6.
Blood urea nitrogen (BUN) and creatinine (Cr) levels reflect renal excretory function, and their elevation suggests impaired glomerular filtration function. To investigate whether CRD-induced hyperuricemia resulted from reduced renal excretion, we measured BUN and Cr levels as well as the BUN/Cr ratio. However, no significant differences were observed in BUN, Cr, or the BUN/Cr ratio between the LD and LL groups (Figure 2C). These findings suggested that CRD-induced HUA was not attributable to renal excretory dysfunction.
To determine whether intestinal uric acid excretion was reduced after CRD, we examined the main urate transporters in the intestine. No significant difference in the gene expression of glucose transporter 9 (GLUT9) in small intestinal tissues was observed between the LD and LL groups (Figure 2D). In contrast, ABCG2 gene expression was significantly lower in the LL group than in the LD group (Figure 2E). These findings suggest that decreased intestinal expression of the urate transporter ABCG2 may blunt intestinal uric acid excretion and contribute to CRD-induced hyperuricemia.
-
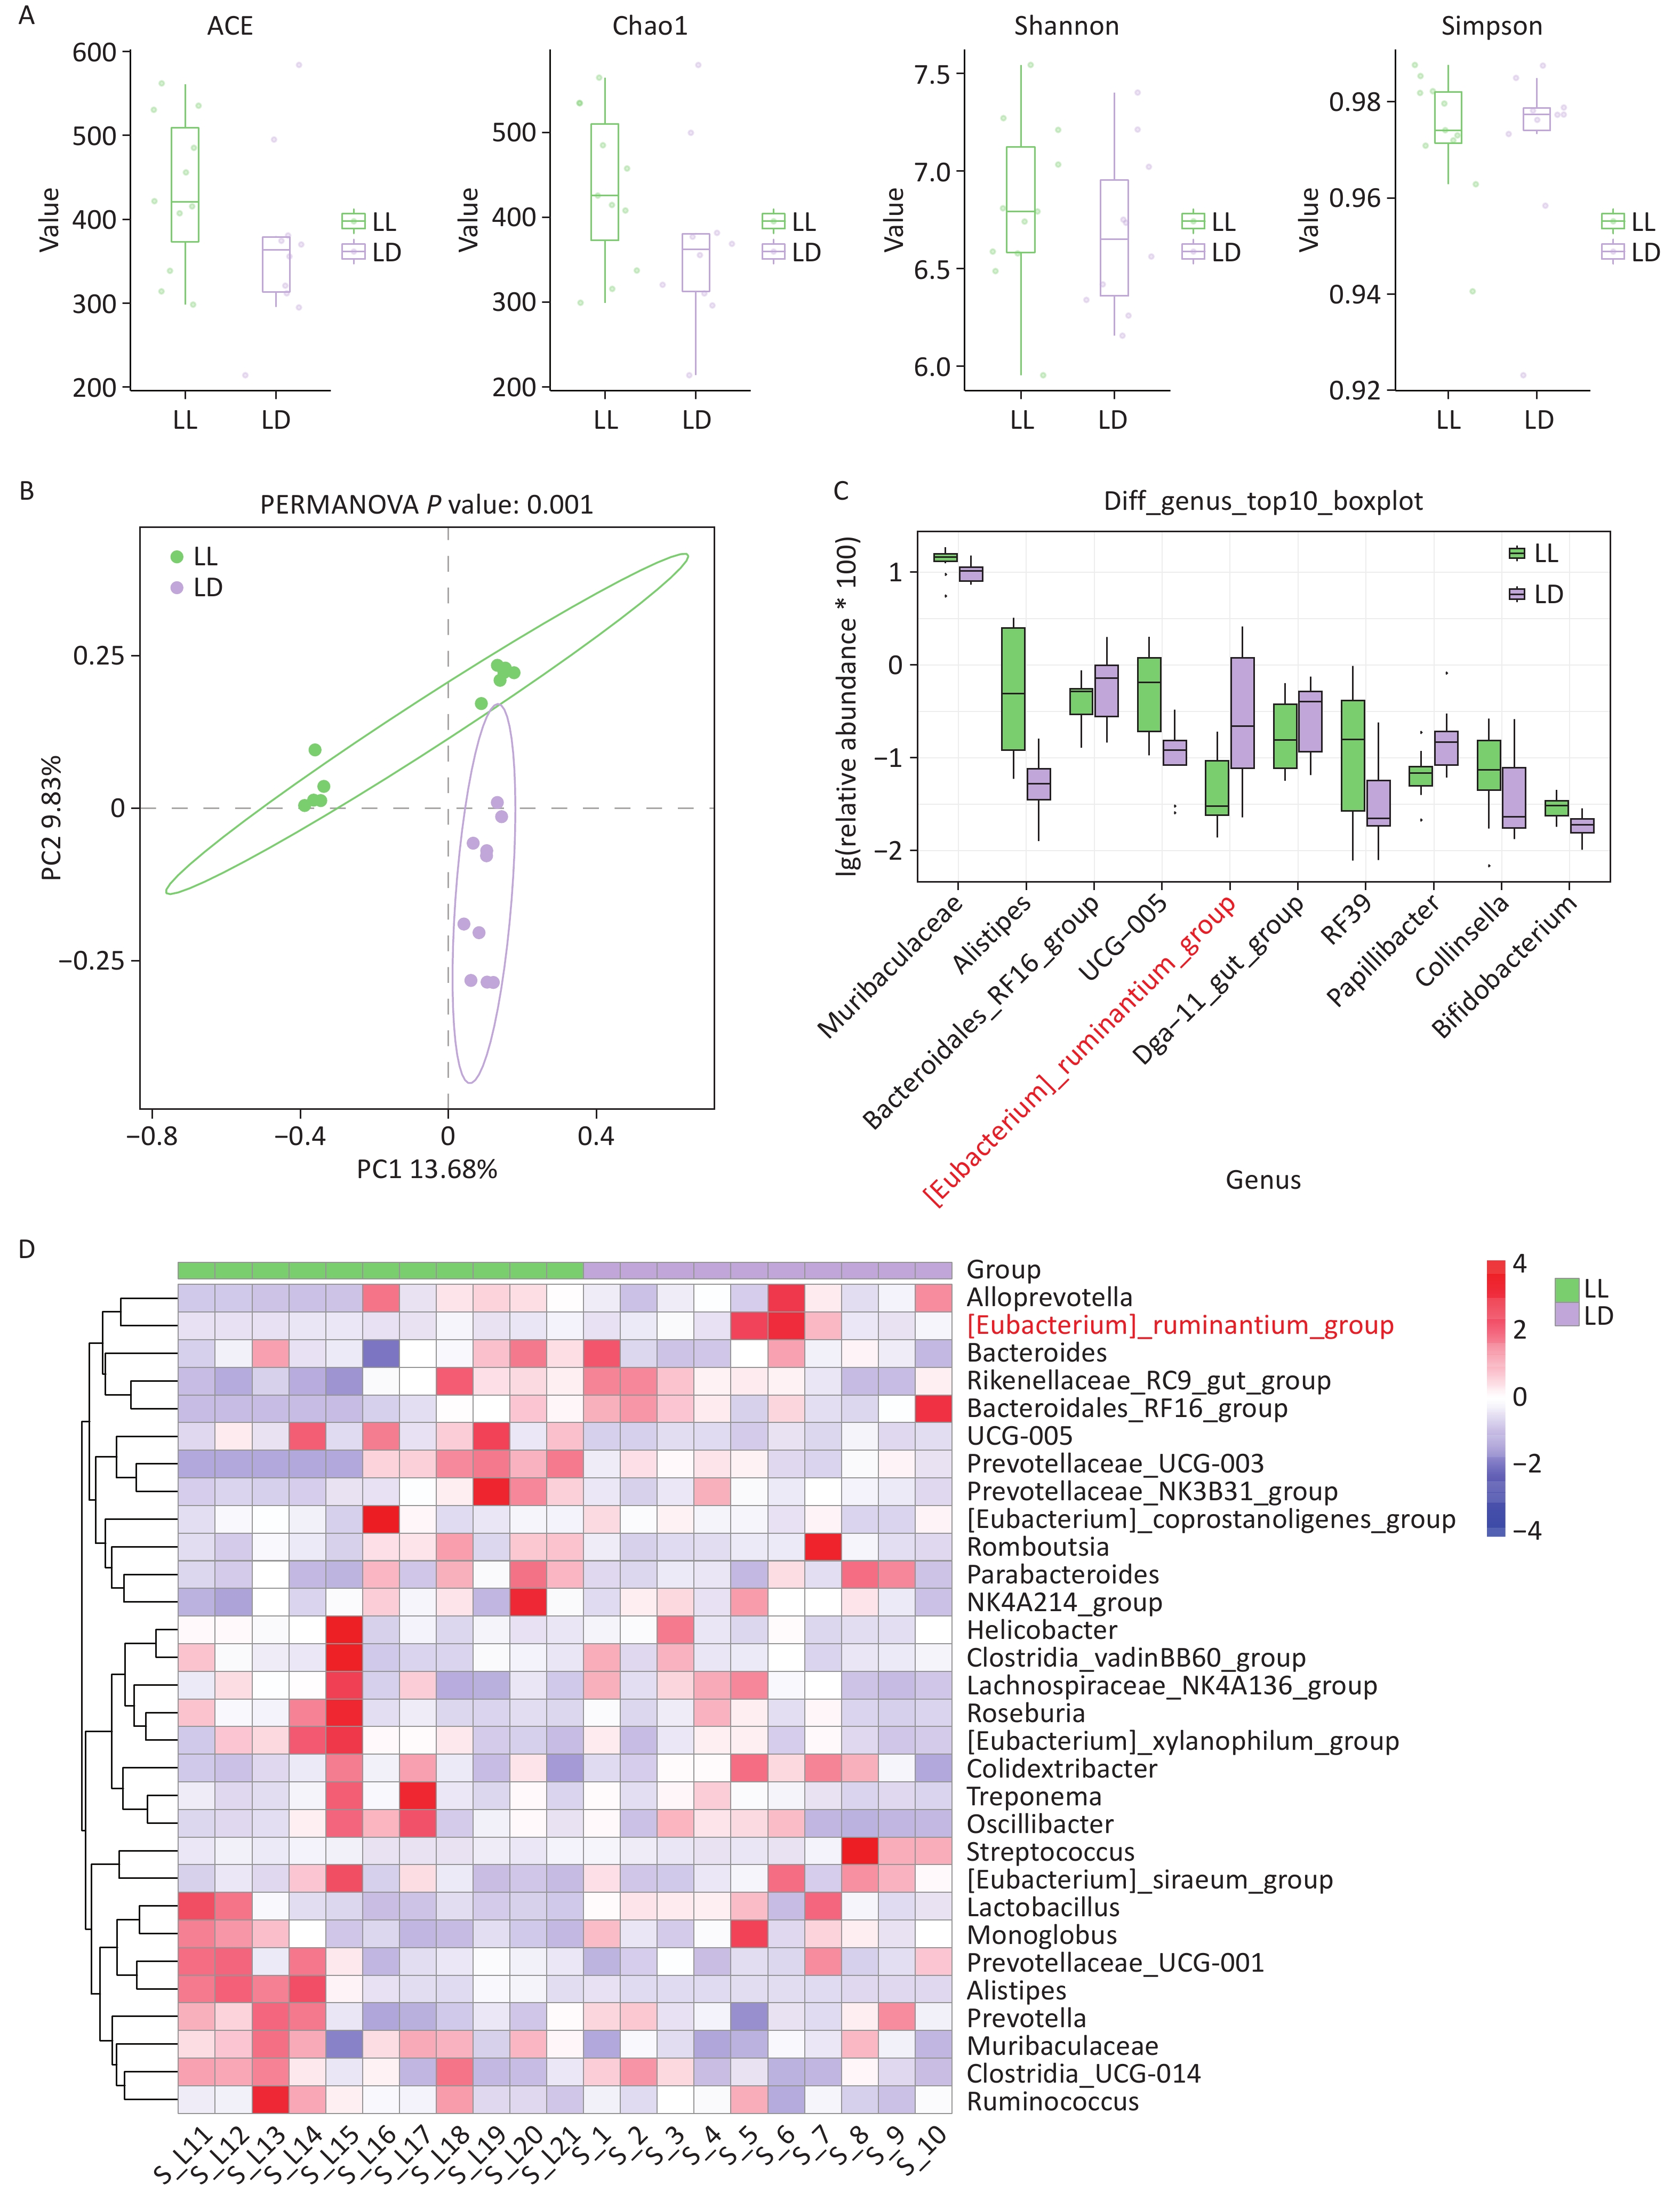
To explore the role of gut microbiota in CRD-induced hyperuricemia, we utilized 16S rRNA sequencing to determine microbial composition and abundance based on genomic fragments of the small ribosomal subunit. After sequencing, alpha diversity was evaluated using the ACE, Chao1, Shannon, and Simpson indices (Figure 3A). No significant differences in these indices were observed between the LD and LL groups. Subsequent PCoA showed clear separation between the LD and LL groups, indicating significant compositional differences in the GM (Figure 3B). To further examine between-group differences in bacterial composition, genus-level boxplots of the top 10 differential species showed significant enrichment of [Eubacterium]_ruminantium_group, Bacteroidales_RF16_group, and Papillibacter in the LD group, whereas Alistipes, UCG-005, and RF39 were enriched in the LL group (Figure 3C). The same enrichment patterns were observed in the clustered heatmap of genus-level abundance (Figure 3D).
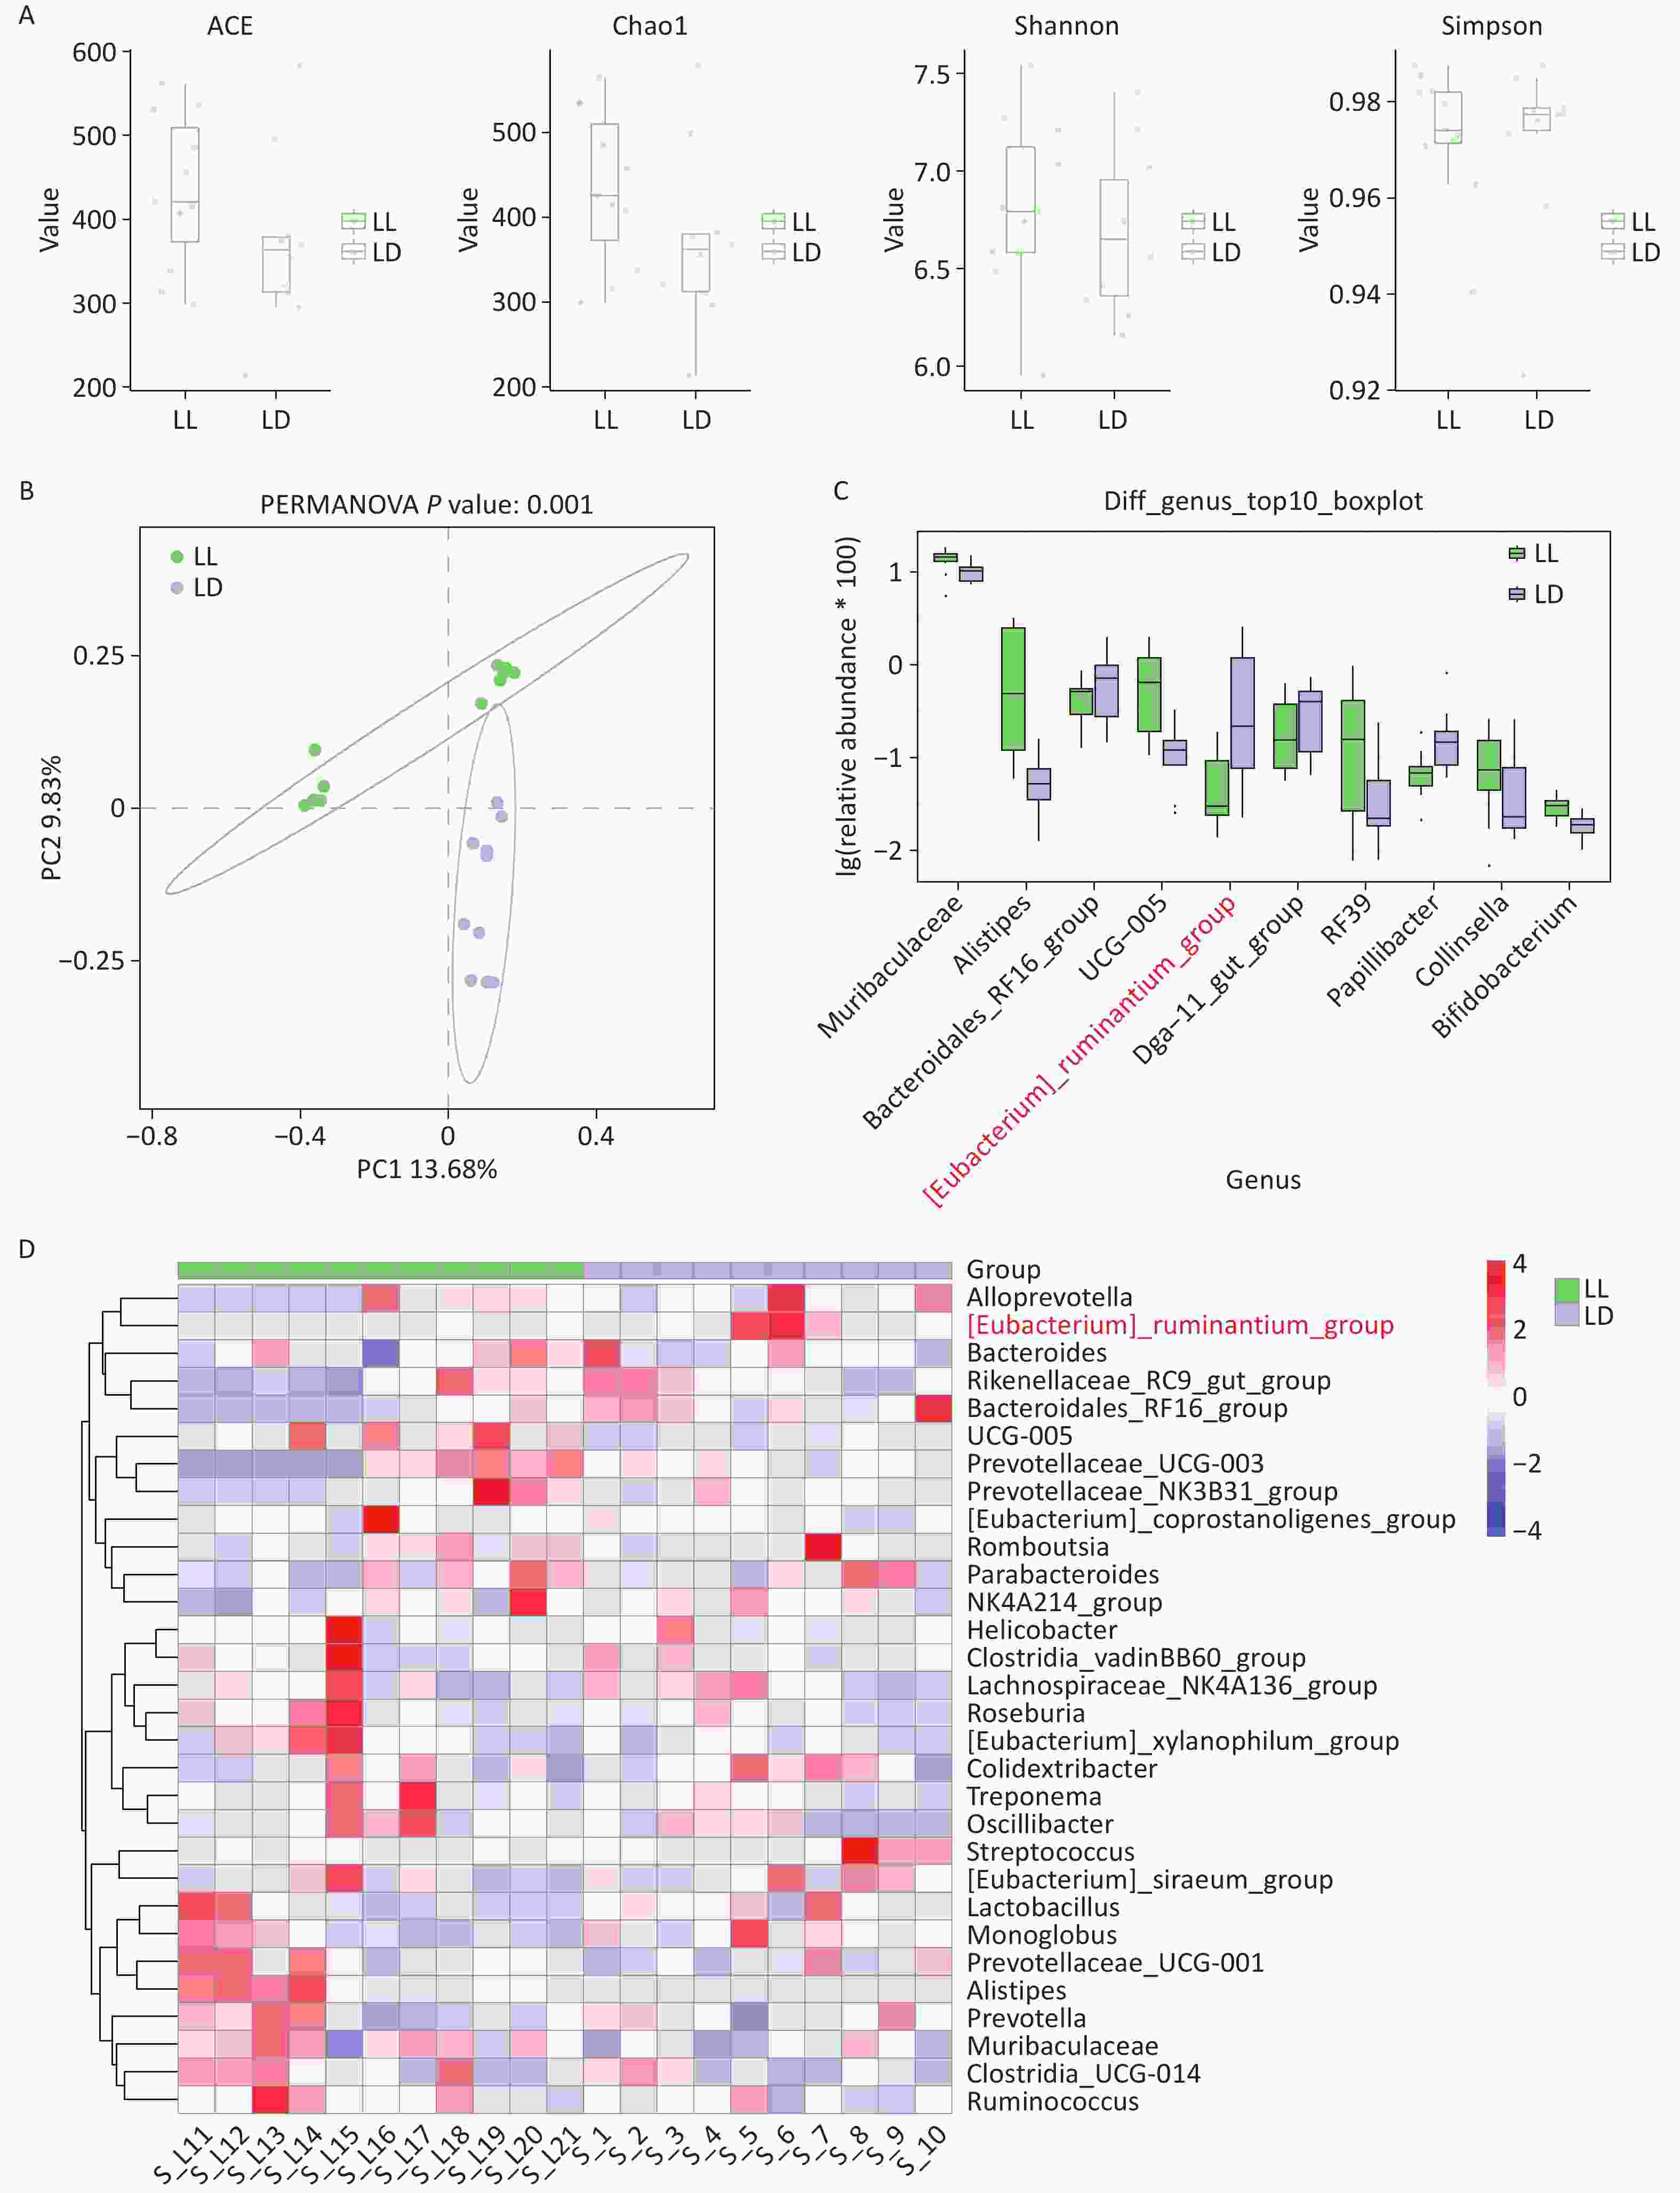
Figure 3. Changes in the gut microbiota structure of CRD rats. (A) Alpha diversity indices of gut microbiota (four metrics: ACE index, Chao1 index, Shannon index, and Simpson index). (B) Principal coordinate analysis (PCoA) results. (C) Box plots showing the top 10 differentially abundant species at the genus level. (D) Clustered heatmap of abundance at the genus level. CRD, circadian rhythm disruption. All values are presented as mean ± SD. Statistical analysis was conducted by t-test for alpha diversity and PERMANOVA for PCoA. n = 10.
-
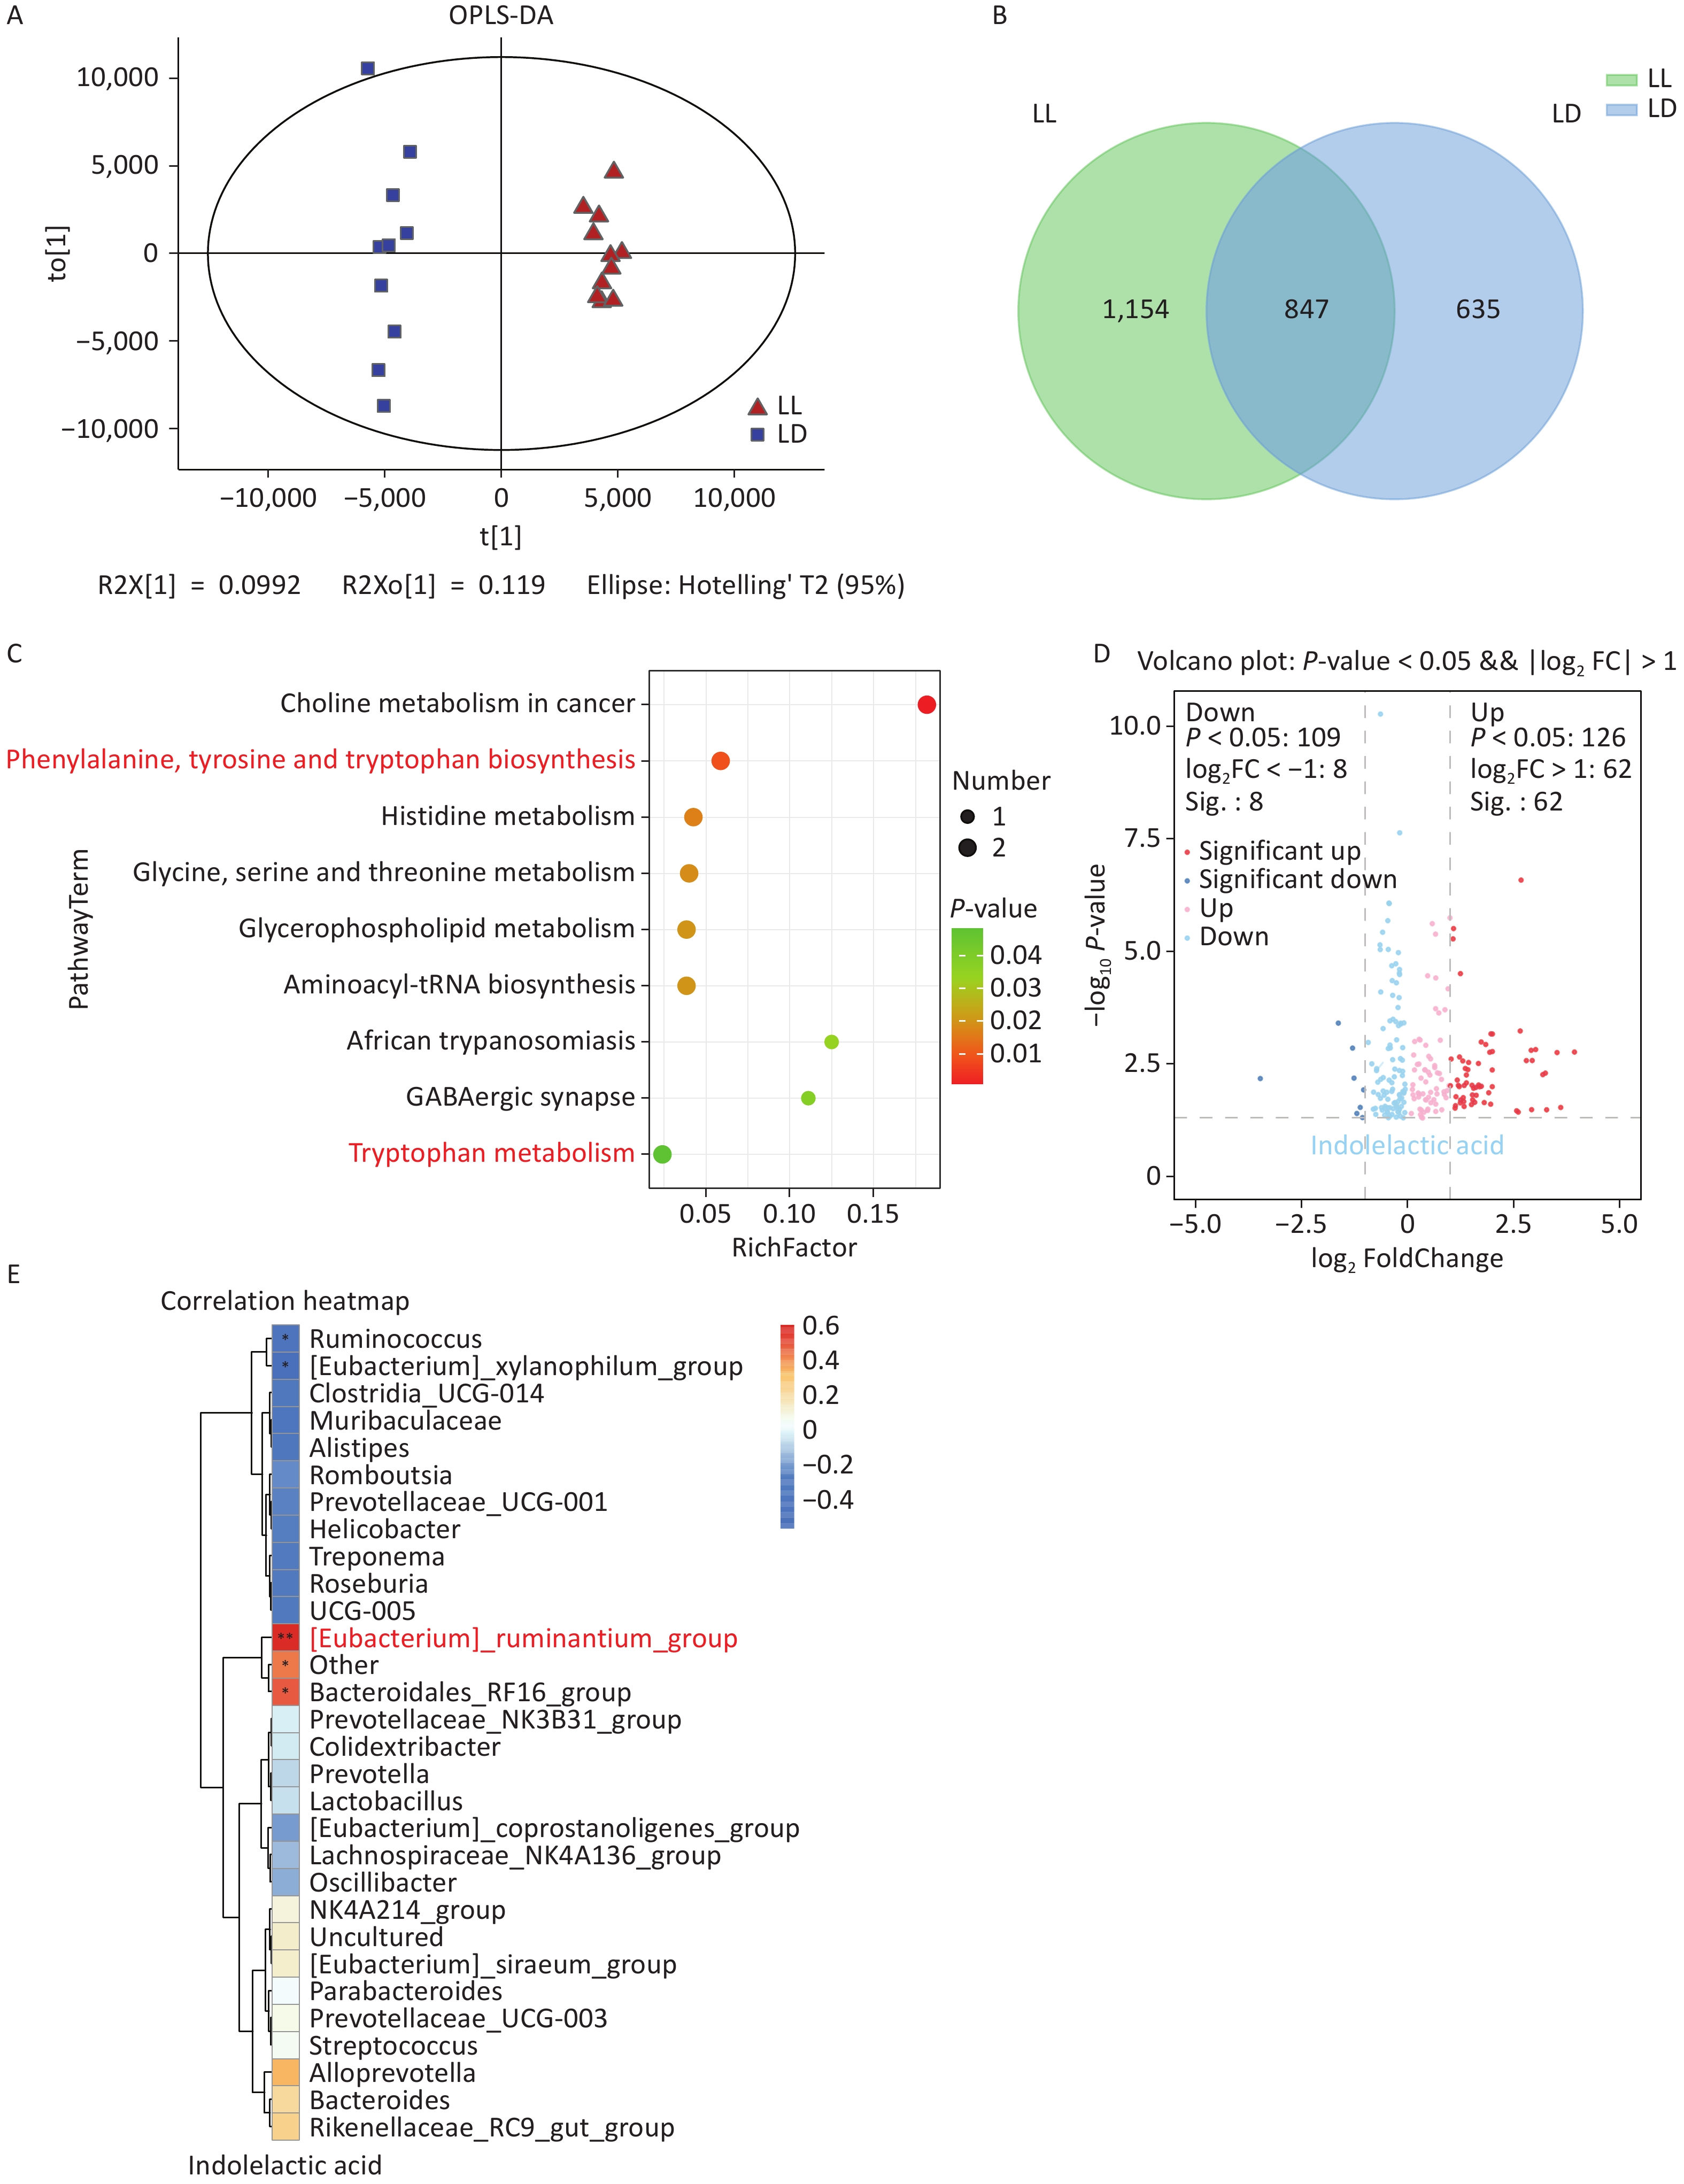
To explore changes in metabolic substances after CRD, we employed liquid chromatography-mass spectrometry (LC-MS) to detect metabolites in rat plasma, followed by orthogonal partial least squares-discriminant analysis (OPLS-DA). The plot showed a distinct separation trend between the LD and LL groups, suggesting significant differences in metabolic profiles between the two groups (Figure 4A). A Venn diagram was then constructed to further examine differences in plasma metabolites between the two groups. The analysis identified 635 metabolites in the LD group, 1,154 metabolites in the LL group, and 847 metabolites shared by both groups (Figure 4B).
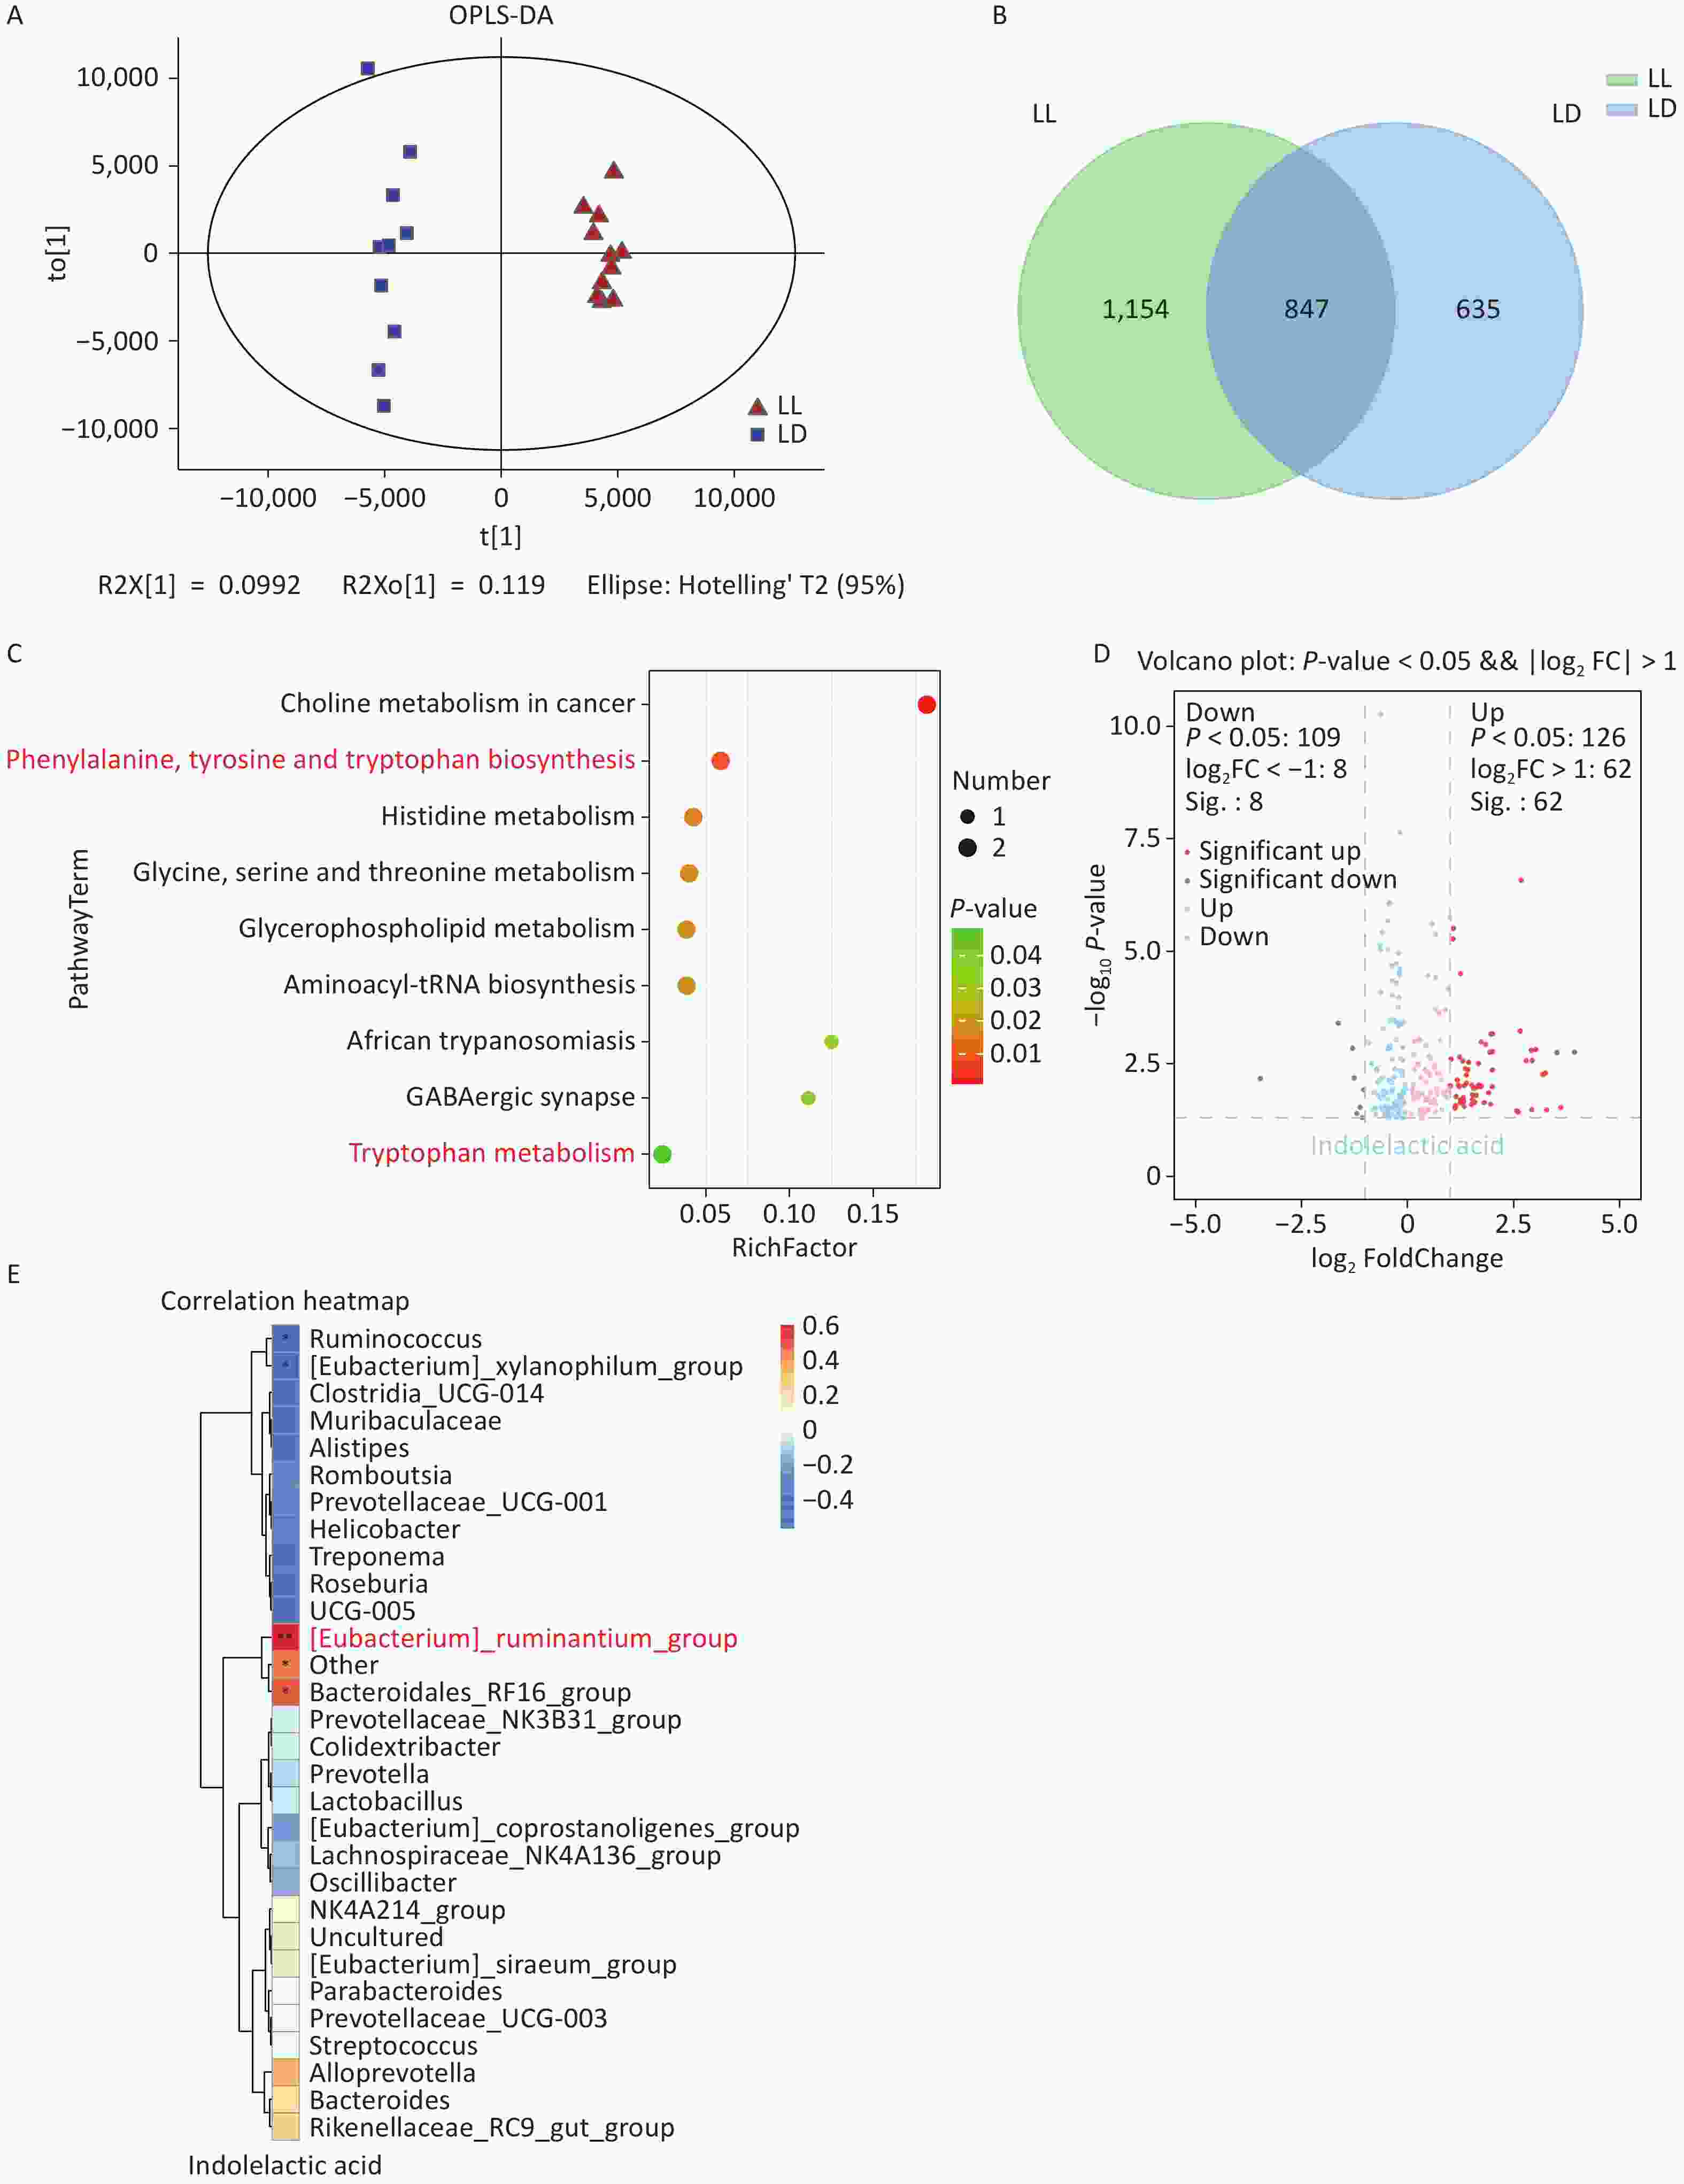
Figure 4. Plasma metabolomics analysis. (A) Orthogonal partial least squares-discriminant analysis (OPLS-DA). (B) Venn diagram. (C) Bubble plot of significantly enriched pathways. (D) Volcano plot of differential metabolites. (E) Heatmap of correlation analysis of 30 changed GM with ILA between LD and LL group. ILA, indole-3-lactic acid; GM, gut microbiota. Metabolomics statistical analysis was performed by multivariate statistical analysis and univariate t-test. Correlation analysis was conducted using Pearson correlation analysis. Data are expressed as mean ± SD, n = 10.
To investigate pathway changes among differential metabolites, pathway enrichment analysis was performed and bubble plots were generated for significantly enriched pathways. Differential metabolites were significantly enriched in choline metabolism in cancer, biosynthesis of phenylalanine, tyrosine, and tryptophan, histidine metabolism, glycine, serine, and threonine metabolism, glycerophospholipid metabolism, aminoacyl-tRNA biosynthesis, the African trypanosomiasis pathway, GABAergic synapse, and tryptophan metabolism (Figure 4C). Volcano plot analysis showed significant downregulation of ILA (Figure 4D). Previous studies have demonstrated that ILA is a characteristic metabolite derived from microbial tryptophan metabolism, in which microbial aromatic amino acid transaminase (AraT) catalyzes tryptophan conversion to indole-3-pyruvic acid (IPA), which is then reduced to ILA by indole-3-lactic acid dehydrogenase (FldH/Aldh)[5]. In metabolic disease models such as diabetes, disruptions in tryptophan metabolism reduce protective metabolites, such as ILA, whereas supplementation with ILA-producing probiotics or tryptophan can ameliorate symptoms by restoring this pathway[18]. Subsequently, the correlation analysis between the top 30 dominant gut microbiota and ILA revealed a strongest positive correlation between ILA and the [Eubacterium]_ruminantium_group (Figure 4E). This finding was consistent with the differential gut microbiota enrichment results, in which [Eubacterium]_ruminantium_group was decreased by constant light exposure.
-
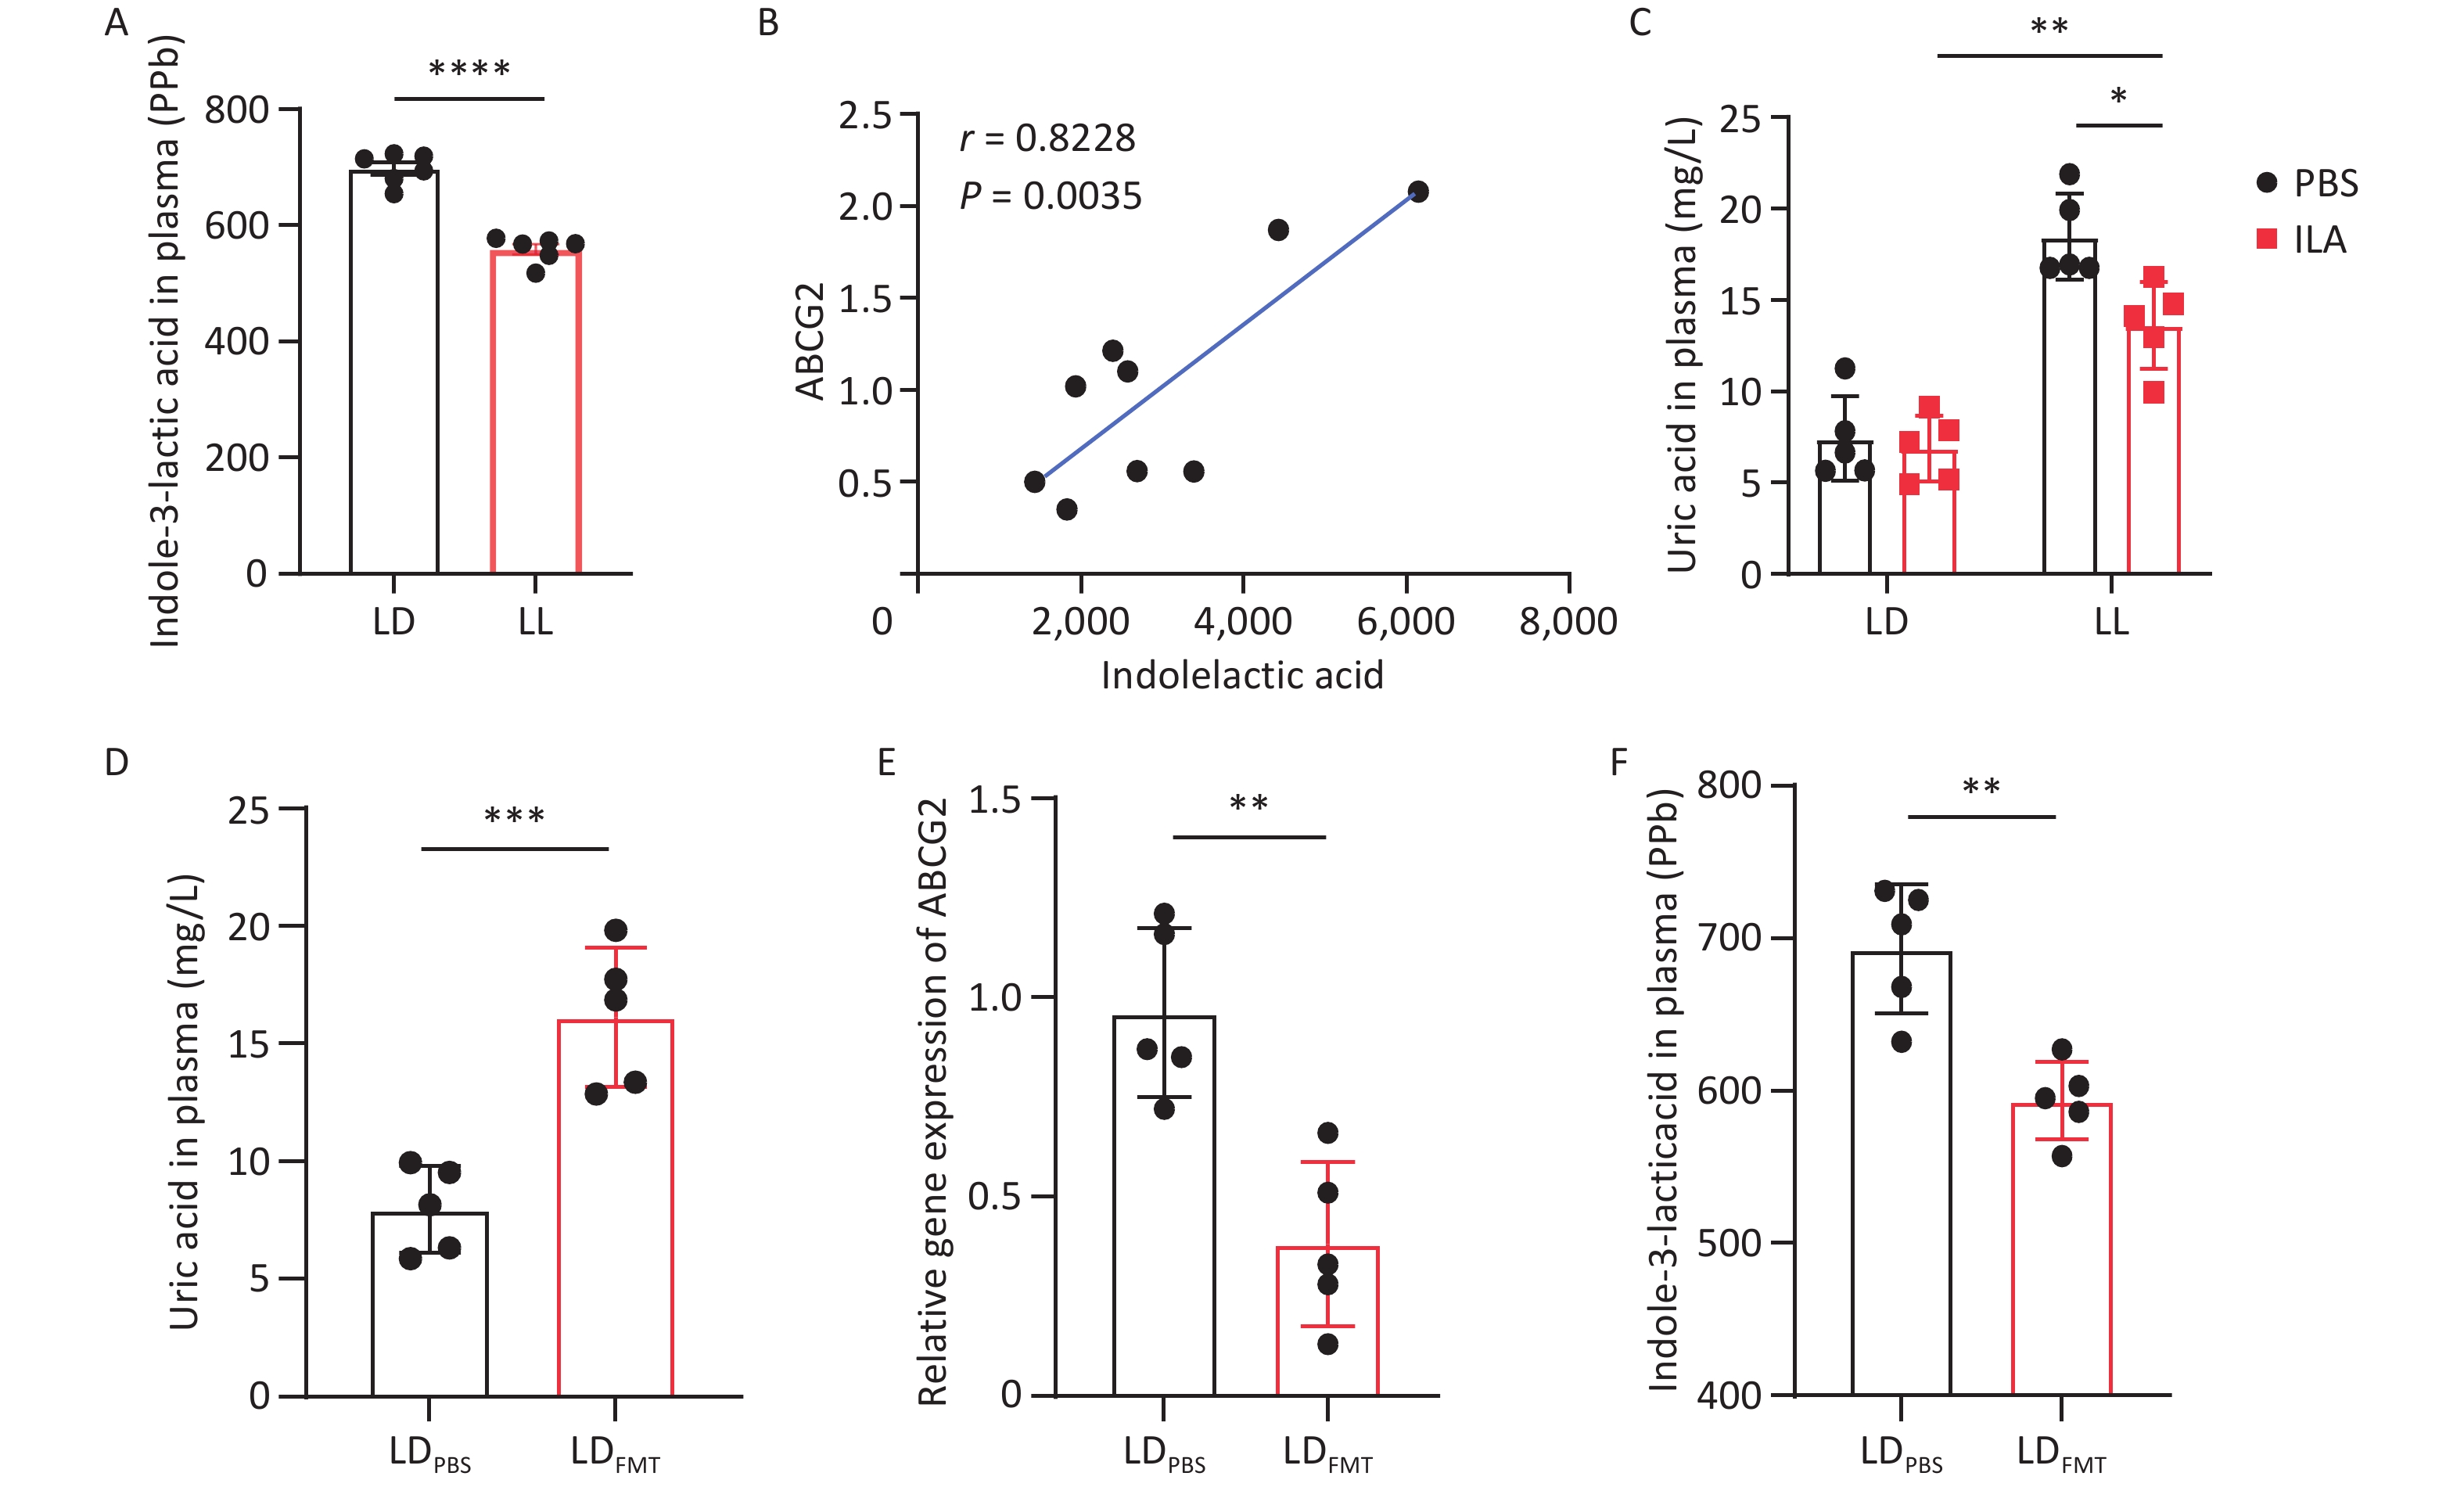
To explore the relationship between ILA and HUA in rats with CRD, we measured plasma ILA levels in both groups. Compared with the LD group, the LL group showed significantly decreased ILA levels (Figure 5A). We then examined the correlation between ILA and intestinal ABCG2 expression, which showed a positive association between the two variables (Figure 5B).
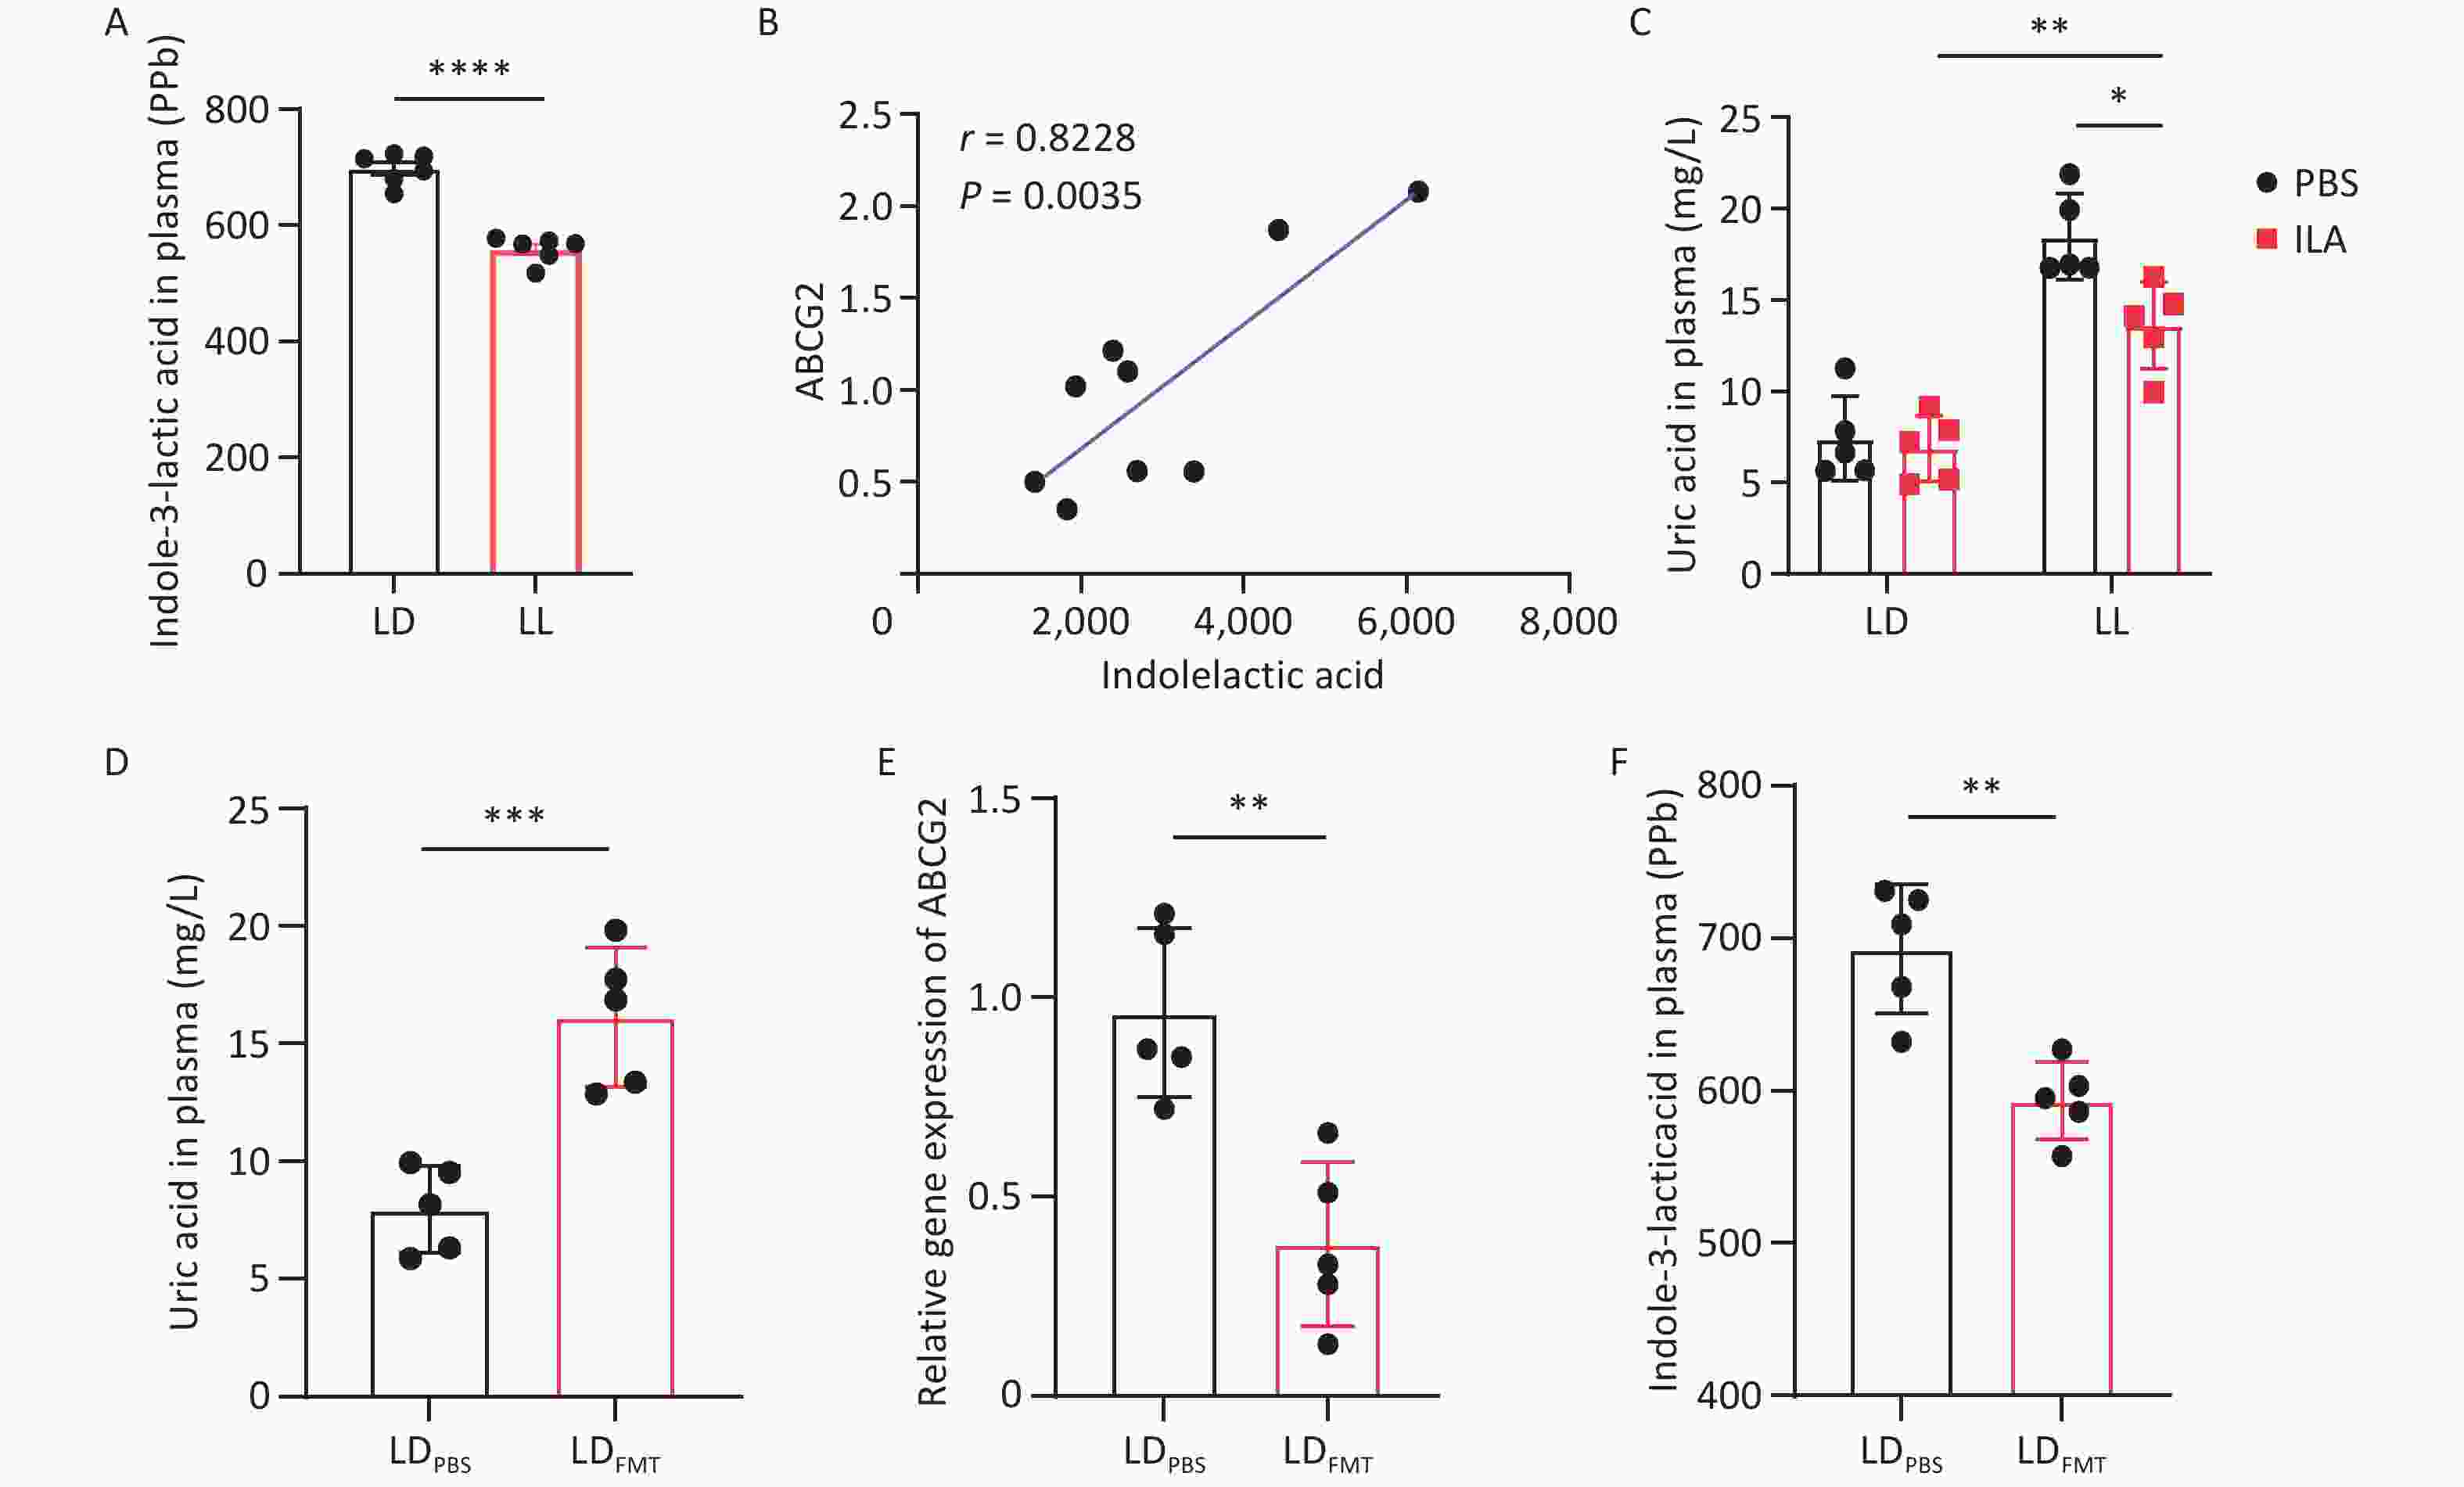
Figure 5. ILA can reduce blood uric acid levels elevated by CRD. (A) Plasma ILA concentration in LD and LL groups. (B) Pearson correlation analysis between ILA level and intestinal ABCG2 expression. (C) Plasma UA levels after ILA intervention. (D) Plasma UA levels after FMT. (E) Intestinal ABCG2 expression after FMT. (F) Plasma ILA level after FMT. CRD, circadian rhythm disruption; ILA, indole-3-lactic acid; FMT, fecal microbiota transplantation; UA, uric acid. Data are presented as mean ± SD. Two-group comparisons used t-test; multiple-group comparisons adopted one-way ANOVA and two-way ANOVA with Tukey’s post-hoc test. *P < 0.05, **P < 0.01, ***P < 0.001, ****P < 0.0001, ns P>0.05, n = 5–9.
To further elucidate the role of ILA in CRD-induced HUA, rats were divided into four groups: LD rats gavaged with phosphate-buffered saline (PBS, LDPBS) or ILA (LDILA) and LL rats gavaged with PBS (LLPBS) or ILA (LLILA). After ILA gavage, uric acid levels in the LLILA group remained slightly higher than those in the LDILA group but were significantly decreased compared with the LLPBS group (Figure 5C). These findings suggest that ILA can reduce uric acid levels in CRD-induced HUA.
After 3 weeks of antibiotic administration, specific pathogen-free (SPF)-grade rats were divided into two groups for the FMT experiment. The LD group received daily oral gavage of 1 mL PBS (LDPBS), whereas the LDFMT group received fecal microbiota suspension from LL rats LDFMT and was evaluated for uric acid levels, ABCG2 expression, and ILA concentration. Compared with the LDPBS group, the LDFMT group had significantly elevated uric acid levels (Figure 5D). Additionally, intestinal ABCG2 gene expression (Figure 5E) and ILA concentration (Figure 5F) were significantly reduced.
-
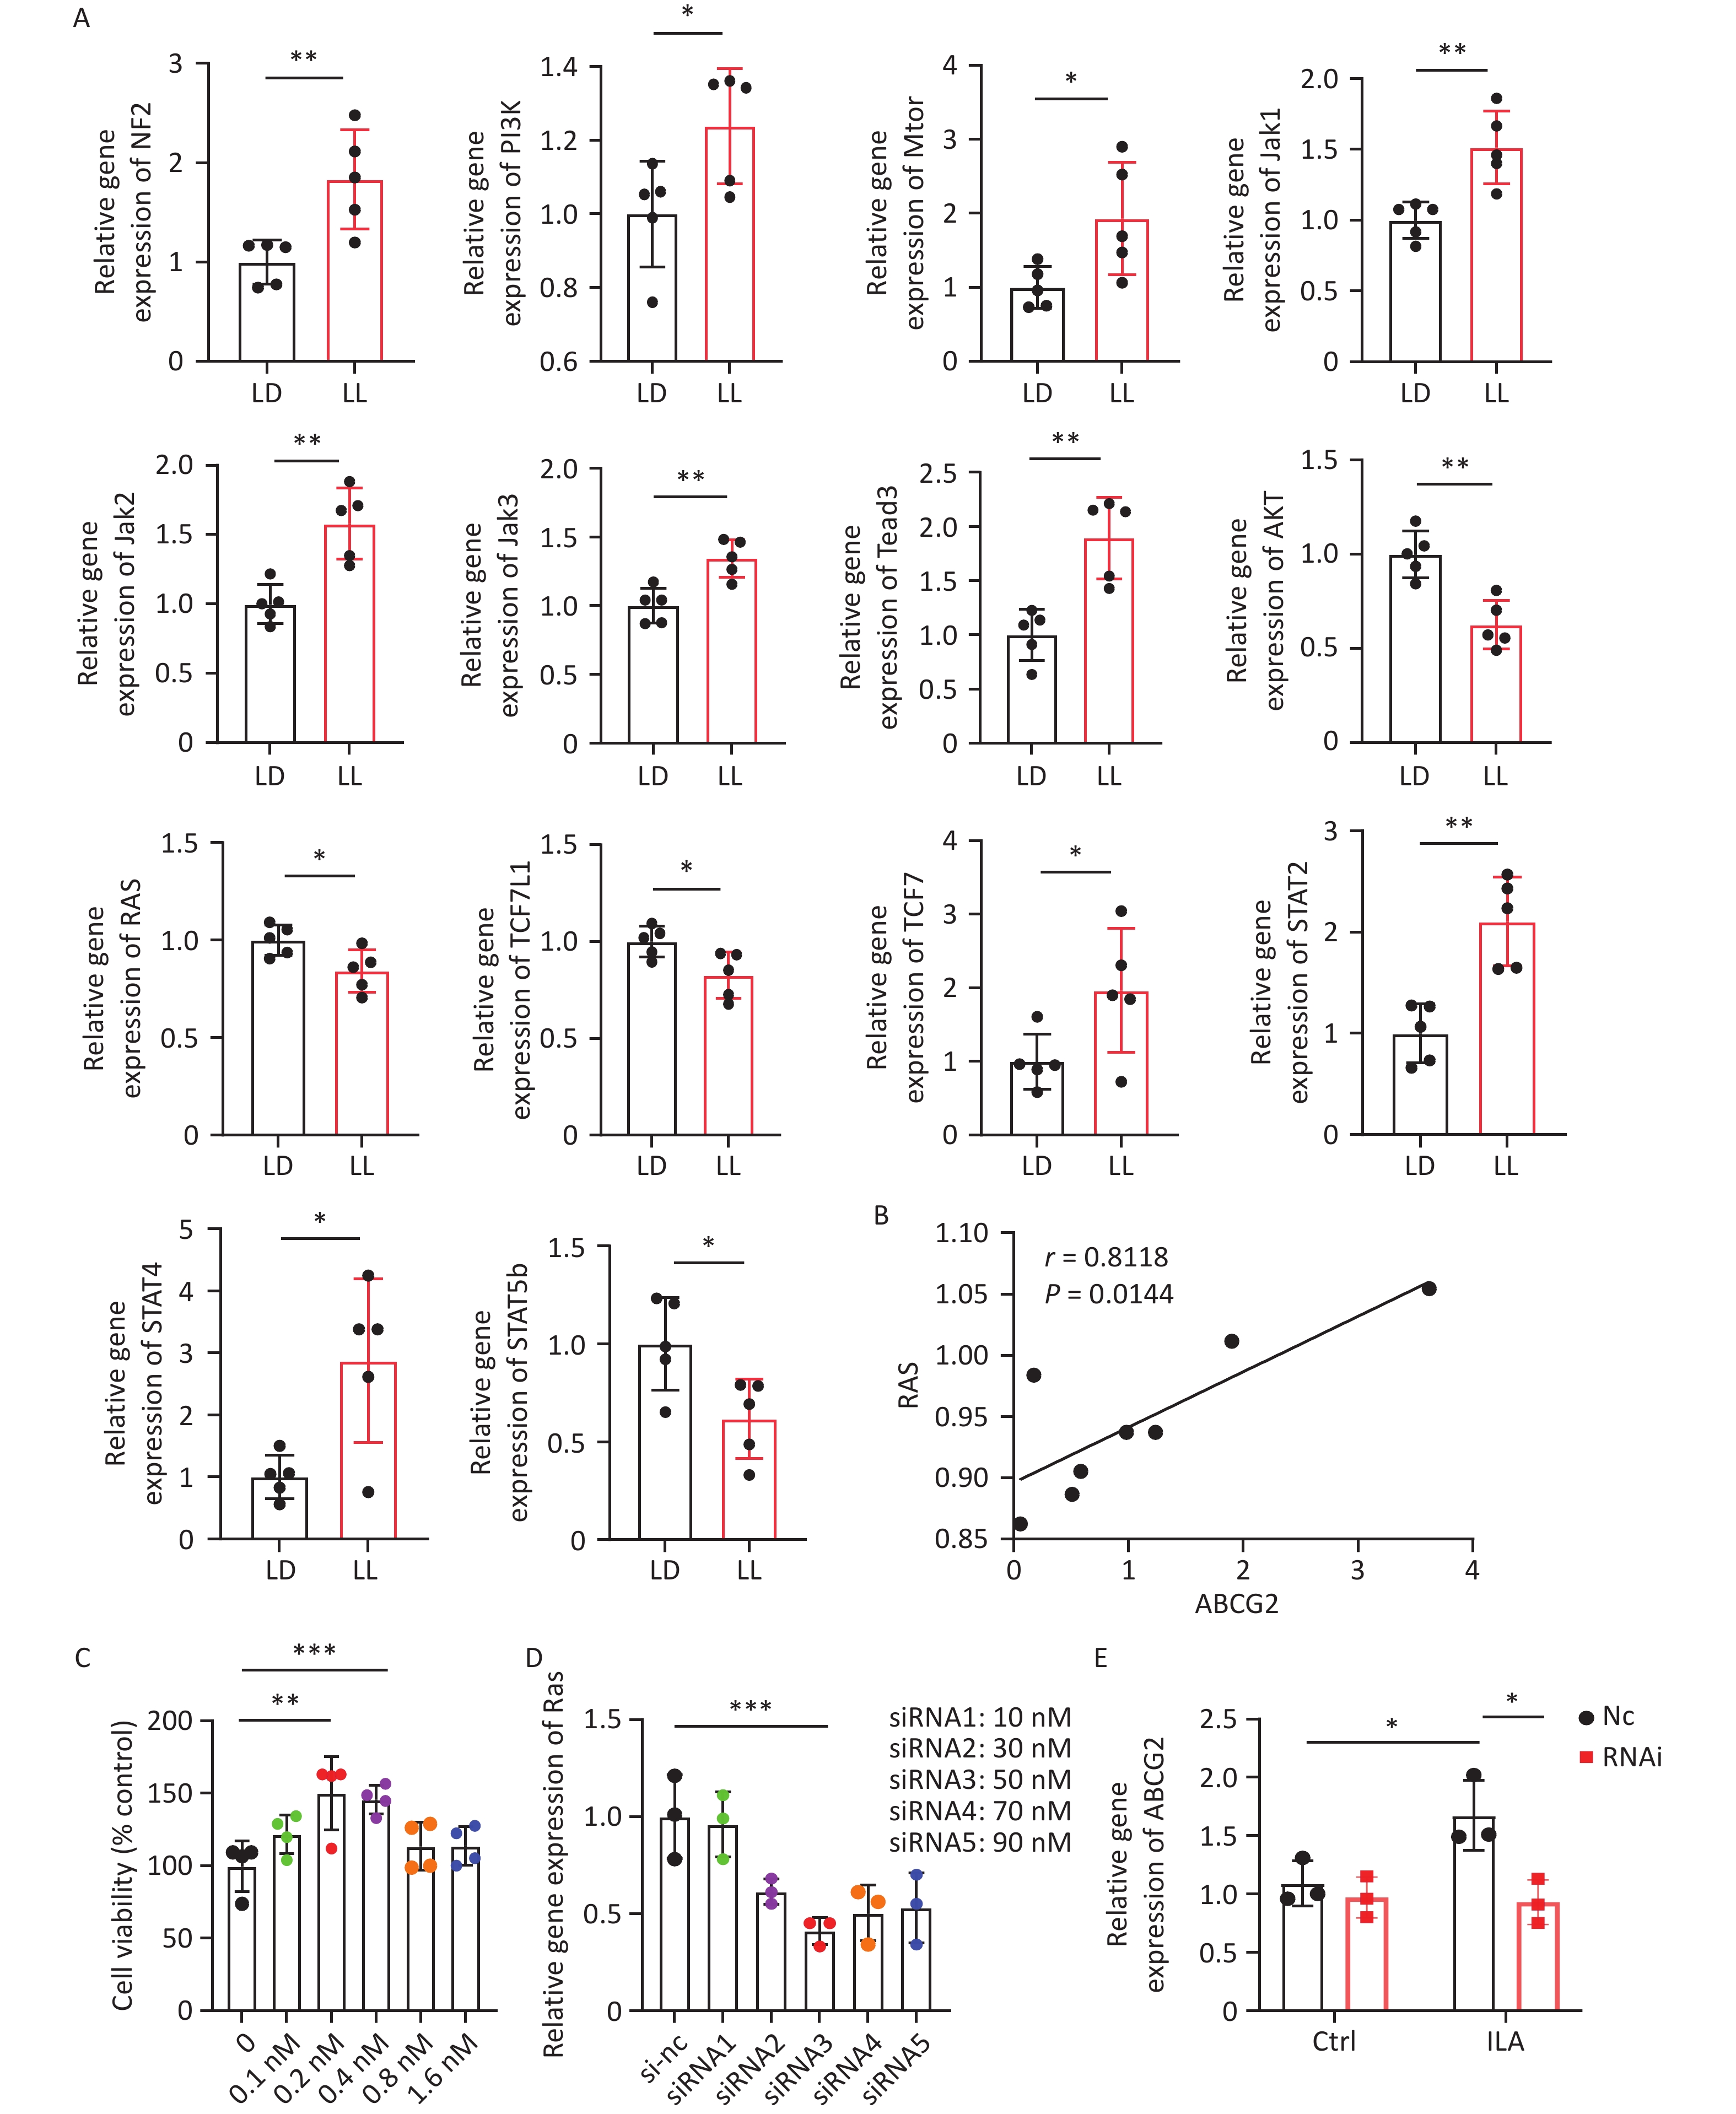
To further explore the mechanism by which ILA influences ABCG2, we examined the mRNA expression of known transcription factors and signaling molecules capable of binding to or regulating the ABCG2 urate transporter[19]. Detection of Gli, ERK1, ERK2, NFE2L2, NF-κB, YAP, TAZ, TCF7L1, TCF7L2, TCF7, STAT1, STAT2, STAT3, STAT4, STAT5b, STAT6, Ras, BRAF, Raf1, ARAF, Map2k1, Map2k2, AKT, Lats1, Lats2, Tead1, Tead2, Tead3, Tead4, Tyk2, Jak1, Jak2, Jak3, Keap1, Mtor, PI3k, NF2, and Ikkβ mRNA in small intestinal tissues showed that compared with the LD group, the relative expression levels of NF2, PI3k, Mtor, Jak1, Jak2, Jak3, Tead3, TCF7, STAT2, and STAT4 genes were increased in the LL group, while the relative expression levels of Ras, AKT, TCF7L1, and STAT5b genes were decreased (Figure 6A). Correlation analysis was then performed between the downregulated genes Ras, AKT, TCF7L1, and STAT5b and intestinal ABCG2 gene expression. The results indicated a linear correlation between Ras and ABCG2 expression (Figure 6B), suggesting that Ras may be involved in regulating intestinal ABCG2 after CRD.
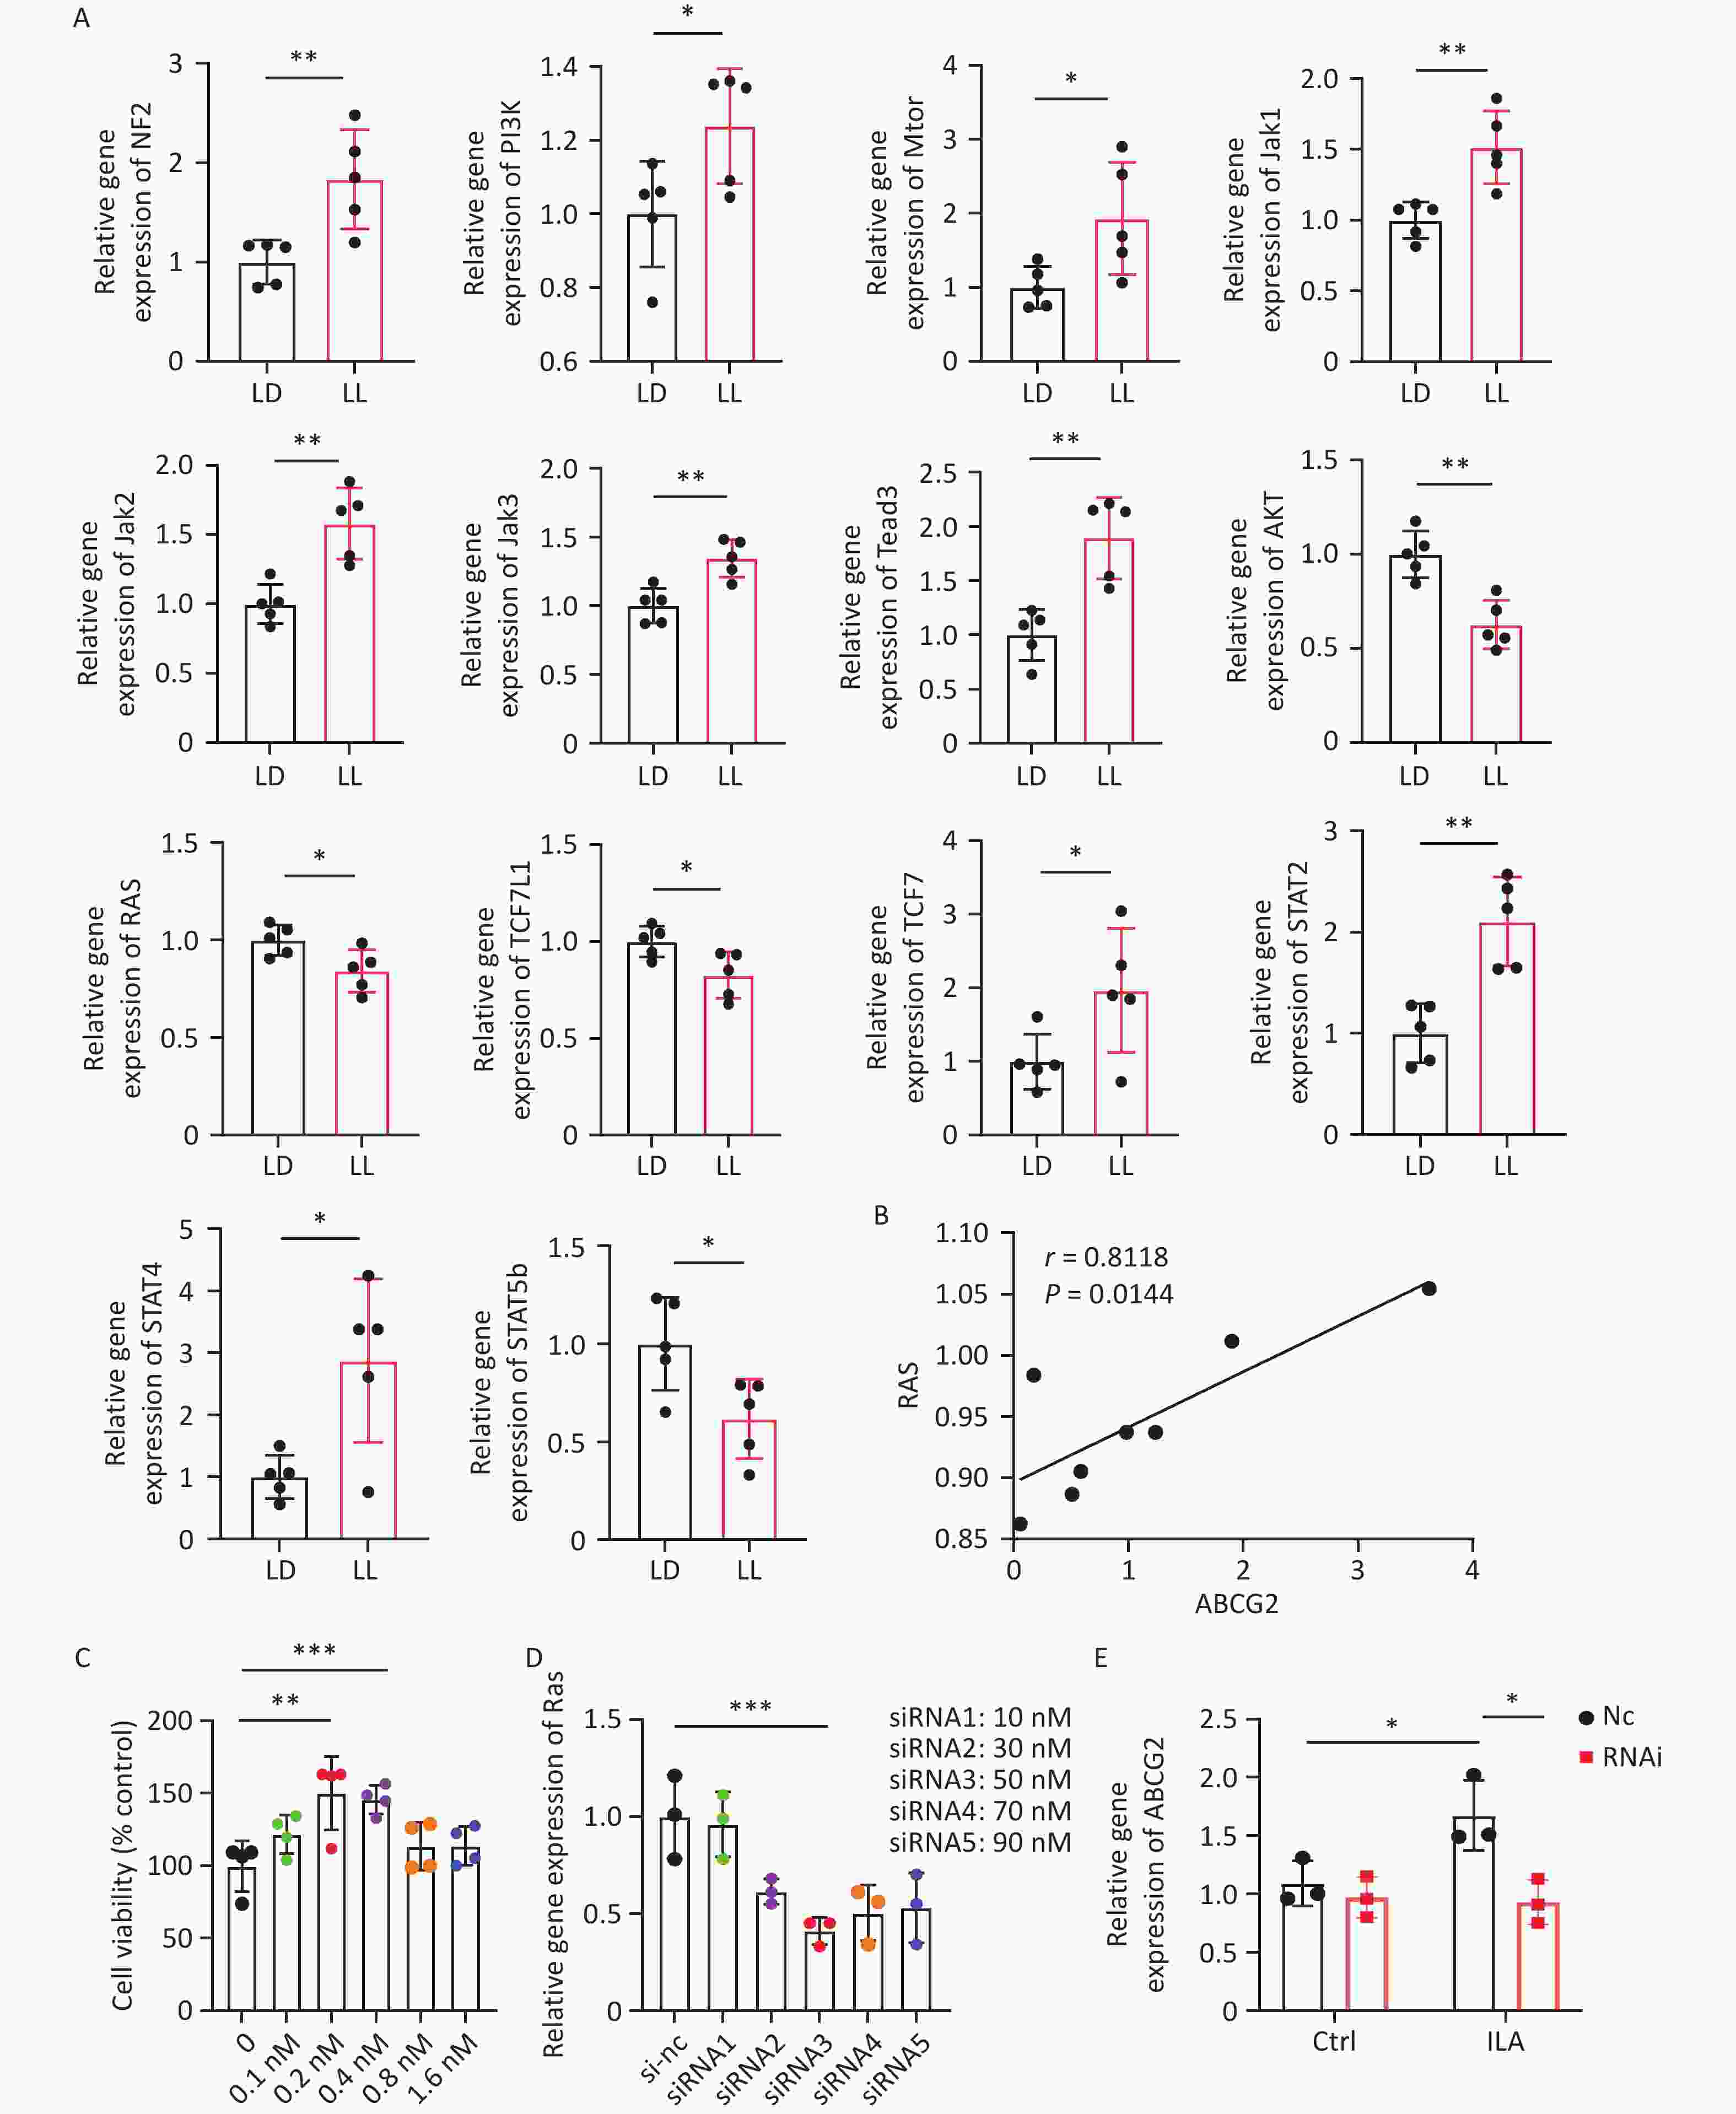
Figure 6. ILA affects the expression of ABCG2 gene in the small intestine through RAS. (A) mRNA expression screening of downstream signaling molecules in intestinal tissues. (B) Pearson correlation analysis between RAS and ABCG2 expression. (C) Cell viability of HIEC-6 cells treated with gradient ILA concentrations. (D) Interference efficiency of Ras siRNA. (E) Changes of ABCG2 expression after RAS knockdown combined with ILA treatment. ILA, indole-3-lactic acid. All data are shown as mean ± SD. Statistical differences were analyzed by one-way ANOVA and two-way ANOVA followed by Tukey’s post-hoc test and t-test. *P < 0.05, **P < 0.01, ***P < 0.001, ns P>0.05. n = 3–8.
To further explore the relationship between ILA and Ras, we intervened in Ras gene expression in human small intestinal epithelial cells (HIEC-6). After determining 0.2 nmol/L as the optimal concentration for ILA administration (Figure 6C) and validating the interference level of the Ras gene (Figure 6D), qPCR was used to detect ABCG2 gene expression in HIEC-6 cells. Compared with the blank control group, HIEC-6 cells treated with ILA showed increased ABCG2 gene expression. However, after Ras gene knockdown, the increase in ABCG2 expression after ILA administration was no longer significant (Figure 6E). These data suggest that ILA acts on the intestinal urate transporter ABCG2 through Ras, providing evidence that CRD-induced HUA may be associated with ILA-mediated reductions in intestinal Ras and ABCG2.
-
This study established a continuous light-induced CRD rat model and preliminarily explored the relationships among gut microbiota alterations, ILA levels, intestinal ABCG2 expression, and HUA. We found that CRD altered gut microbiota composition, leading to a reduction in [Eubacterium]_ruminantium_group and a corresponding decrease in ILA levels. Reduced ILA was associated with downregulated Ras expression, which was in turn associated with decreased expression of the key intestinal uric acid transporter ABCG2. Therefore, the ILA-Ras-ABCG2 cascade may represent a potential pathway. Notably, direct functional evidence proving impaired intestinal urate excretion remains insufficient, and ABCG2 downregulation serves only as indirect supporting evidence. These findings partly link environmental factors, gut microbiota-derived metabolites, and UA homeostasis, providing a new perspective for understanding CRD-related metabolic disease and offering a theoretical basis and potential therapeutic targets for prevention. This work may help enrich understanding of HUA etiology and pathogenesis and guide future clinical research.
In the present study, we selected constant light exposure (LL) as the CRD model because it simulates the widespread exposure to artificial nighttime light in modern society[20]. Plasma uric acid levels increased most significantly in the LL group, whereas the DD and CD groups showed weaker effects. This may be because light is the main zeitgeber regulating mammalian circadian rhythms. Continuous light persistently disrupts central and intestinal circadian homeostasis, thereby exerting the strongest effect on uric acid balance and recapitulating common circadian disturbances in human populations. In contrast, the constant dark group passively loses light entrainment signals and may not effectively suppress endogenous circadian oscillation, leading to only mild uric acid metabolic disorder. This model also poorly resembles real human living conditions. The CD group only triggers intermittent rhythm rearrangement rather than sustained circadian dysregulation, which may explain its weaker and unstable elevation of uric acid. Furthermore, rats in the LL group showed slower weight gain despite unchanged food intake, indicating a hypermetabolic state. This differs from traditional HUA models induced by high-purine diets or renal insufficiency[21] and suggests that CRD-related HUA has unique metabolic features that do not arise from increased purine intake, which eliminates confounding interference caused by dietary factors and renal impairment.
To identify the mechanism by which CRD induces hyperuricemia, we systematically excluded other common pathways. No changes were observed in hepatic or intestinal XOD activity, arguing against accelerated de novo purine synthesis[22]. Stable plasma urea nitrogen, creatinine, and BUN/Cr ratio indicated preserved glomerular filtration and essentially normal urinary excretion. These findings excluded the two major traditional causes of HUA. However, we identified specific downregulation of ABCG2, rather than GLUT9, in the intestine, which may indicate a previously under-recognized pathway in CRD-related HUA. Notably, ABCG2 appears sensitive to circadian signals, most likely mediated through E-box elements in its promoter region by core clock genes such as Bmal1 and Clock[23]. Accordingly, our finding of dysregulated intestinal clock gene expression suggests that CRD may contribute to these changes, although the intestinal clock regulatory mechanism requires further investigation.
As a crucial mediator linking the environment and host, the gut microbiota is regulated by circadian rhythms, and dysbiosis is associated with various metabolic diseases[24]. Consistent with previous evidence that CRD can induce GM abnormalities[25], the present study found that although α-diversity did not change significantly, CRD induced broad alterations in gut microbiota structure. One important finding was the significant decrease in Eubacterium_ruminantium_group in the LL group. As an important component of the gut microbiota, Eubacterium_ruminantium_group may have dual roles in metabolic disease through its regulation of key metabolites. In physiological states, this group contributes to metabolic homeostasis by producing short-chain fatty acids (SCFAs), such as butyrate[26], which can enhance intestinal barrier function and promote glucose metabolism through GPR43-mediated signaling[27]. However, it has also been linked to inflammatory risk in normal-pressure hydrocephalus[28] and proposed as a potential marker related to healthy and sustainable diets and disease prevention[29]. These opposing associations highlight the context-dependent role of Eubacterium_ruminantium_group in disease development. In this study, we mainly propose a beneficial role because of its marked positive correlation with ILA production. As a crucial tryptophan-derived indole metabolite, intestinal ILA synthesis does not depend on a single bacterial genus but is collaboratively regulated by specialized gut microbiota. Bacterial genera such as Lactobacillus, Bifidobacterium, and Clostridium can convert tryptophan into ILA through intrinsic tryptophan metabolic enzyme systems[30]. Furthermore, these probiotics may help alleviate HUA by regulating ABCG2[31]. Thus, given the importance of Eubacterium in gut health and butyrate production, our findings provide preliminary evidence that this bacterial group may protect against CRD-induced HUA, possibly by modulating ILA production and regulating intestinal ABCG2 expression.
Another core finding of this study was the close correlation between ILA and ABCG2 expression. A recent study reported that L. plantarum exerted probiotic effects in hyperuricemic mice through multiple pathways, including increased plasma ILA and intestinal ABCG2 expression[32]. This is consistent with our observation of a positive correlation between ILA levels and ABCG2 expression, suggesting that the GM-derived metabolite ILA may act as a crucial signaling molecule regulating ABCG2-mediated intestinal urate excretion homeostasis. Several studies have demonstrated that ILA can regulate ABCG2 expression by activating key signaling pathways, including AMPK and the aryl hydrocarbon receptor (AhR)[33,34]. Among these pathways, AhR is particularly important: as an endogenous AhR ligand, ILA can promote AhR nuclear translocation[35]. Upon ligand activation, AhR can directly bind to the ABCG2 promoter region and positively regulate its expression[36].
The effect of modern-life circadian rhythm disruption, including shift work, on the ILA-ABCG2 regulatory relationship has also been demonstrated in previous studies. The expression of various drug transporters and metabolic enzymes, including ABCG2, exhibits circadian oscillation and is transcriptionally regulated by core clock genes such as Bmal1 and Clock[37]. This suggests that circadian rhythms may regulate the ILA-ABCG2 pathway through two mechanisms: signal generation, by regulating the rhythmic activity of ILA-producing microbiota, and signal response, by regulating rhythmic host ABCG2 expression. CRD perturbs the rhythmic oscillation of core clock genes[38], potentially leading to dual consequences. First, it disrupts the temporal structure of the gut microbiota[39]. This may particularly affect rhythm-sensitive bacteria involved in the tryptophan-ILA pathway, such as Eubacterium_ruminantium_group, leading to reduced abundance and decreased ILA production[40]. Second, CRD may dysregulate the normal circadian rhythm of ABCG2 expression in host intestinal epithelial cells[37]. Together, these effects may disturb uric acid excretion capacity across the temporal dimension. CRD may also indirectly compromise intestinal uric acid metabolic homeostasis by affecting other physiological processes. For example, CRD can impair intestinal mucosal barrier integrity and increase intestinal permeability[41], which may affect the local transport environment for uric acid, trigger low-grade inflammation, and further influence uric acid absorption and excretion processes. This consequently poses greater challenges to maintaining intestinal uric acid metabolic homeostasis.
Furthermore, multiple animal models of circadian rhythm disruption or diet-induced metabolic disorders show decreased endogenous ILA levels accompanied by downregulated ABCG2 expression, which correlates with greater susceptibility to hyperuricemia and other metabolic diseases[42,43]. Exogenous ILA supplementation has been shown to reverse these abnormalities, including partial restoration of ABCG2 expression[43], supporting the potential regulatory role of the ILA-ABCG2 axis from an interventional perspective. Although overall differences in circadian clock gene expression were detected between the CRD and control groups, we could not systematically characterize whether the diurnal oscillation patterns of core circadian clock genes were lost or disrupted in local intestinal regions, such as intestinal epithelial cells or specific intestinal segments, under CRD conditions. In addition, we did not directly confirm whether rhythmic abnormalities in these genes contribute to rhythmic fluctuations in downstream microbiota. These questions should be addressed in subsequent research.
During the screening process, alterations in the expression of the small GTPase Ras were notably prominent, with a robust positive correlation between Ras mRNA levels and ABCG2. Ras itself is not a transcription factor but an upstream GTPase that functions as a core molecular switch at the top of multiple signaling pathways[44]. Through conformational changes induced by GTP/GDP binding, RAS receives signals from cell membrane receptors, which may include receptors sensing microbiota metabolites, and initiates downstream kinase cascades such as the MAPK cascade, ultimately regulating transcription factors, such as AP-1[45]. RAS signaling plays a pivotal role not only in cell proliferation and tumorigenesis but also in immune inflammatory responses, intestinal barrier homeostasis, metabolic regulation, and circadian rhythm synchronization[45,46]. Thus, Ras may be a crucial molecule linking the key events observed in this study, namely CRD, gut microbiota dysbiosis, altered ILA levels, and downregulated ABCG2 expression. This provides a potential entry point for clarifying the mechanism by which CRD induces HUA.
In this context, Ras signaling may have a central role in integrating circadian inputs with gut microbiota signals to regulate ABCG2 expression. First, Ras has a close bidirectional regulatory relationship with the circadian system. Core circadian clock transcription factors, such as BMAL1/CLOCK, can directly regulate key components of the Ras-MAPK signaling pathway, resulting in intrinsic circadian oscillation of pathway activity[47]. Conversely, abnormally activated Ras signaling can disrupt circadian rhythm homeostasis by interfering with clock protein stability and function through mechanisms such as phosphorylation[48]. In this study, Ras expression was downregulated during CRD, suggesting that CRD may disrupt the biological clock and attenuate normal rhythmic activation of the Ras/MAPK pathway, thereby impairing its capacity to rhythmically regulate downstream target genes such as ABCG2. Second, Ras functions as a critical signaling hub in gut microbiota-host interactions. In this interaction system, microbiota and metabolite-derived signals can exert bidirectional regulatory effects on the Ras pathway and jointly maintain intestinal homeostasis. On the one hand, chronic low-grade inflammation associated with dysbiosis can release cytokines such as TNF-α, which abnormally activate the Ras-MAPK pathway and promote pathological processes such as intestinal barrier damage[49]. On the other hand, beneficial microbial metabolites represented by ILA may maintain basal Ras pathway activity and homeostatic function through anti-inflammatory properties or direct effects on specific G protein-coupled receptors[50,51]. This bidirectional regulation reflects the complex mutual adaptation between gut microbiota and the host.
In this study, the reduction of ILA following CRD coincided with Ras downregulation, supporting a potential correlative microbiota-ILA-Ras regulatory pattern. When CRD occurs, circadian rhythm disruption weakens the rhythmic drive on Ras, whereas microbiota dysbiosis-induced ILA reduction diminishes sustained activation signals for Ras. These combined effects may decrease Ras signal output, subsequently causing transcriptional downregulation of ABCG2 through factors such as AP-1 and potentially resulting in altered uric acid metabolism and increased uric acid levels.
Several limitations should be acknowledged. First, the sample size of each experimental group was relatively small (n = 6), which may limit the statistical robustness and generalizability of the results; future studies with larger sample sizes are needed to confirm these findings. Second, the current CRD model was screened only on the basis of a single plasma uric acid indicator and lacked multidimensional evaluation combining behavioral phenotypes, circadian behavioral rhythms, and multiple metabolic indices, making model evaluation relatively limited. Third, although altered ABCG2 gene expression was observed, this study did not directly assess intestinal urate excretion at the functional level, nor did it examine protein expression of core circadian clock and downstream signaling molecules, which limits mechanistic interpretation. Fourth, all animal experiments were performed exclusively in male SD rats, and the present conclusions cannot be directly generalized to female individuals. Sex-dependent differences in circadian disruption-related hyperuricemia remain to be clarified in further research. Finally, the proposed ILA-Ras-ABCG2 regulatory axis was only preliminarily inferred from animal models, FMT, metabolomics, and in vitro cell experiments; it has not been verified using gene knockout/overexpression assays or human clinical cohort data. More rigorous functional experiments and population validation are needed to confirm the causal relationship and clinical applicability.
-
This study established a continuous light-induced CRD rat model and confirmed correlations among circadian rhythm disruption, gut microbiota dysbiosis, reduced ILA levels, downregulated intestinal ABCG2 expression, and elevated UA. The ILA-Ras-ABCG2 axis is proposed as a potential regulatory mechanism linking CRD to HUA. Because direct functional evidence for impaired intestinal urate excretion remains lacking, ABCG2 downregulation should be regarded only as indirect evidence. The current findings are preliminary and are derived from multi-omics, animal, and cell experiments; further validation is needed in future investigations. These results provide mechanistic insight into how common lifestyle factors such as shift work and sleep deprivation may increase HUA risk. They also partly bridge environmental factors, gut microecology, and uric acid metabolic homeostasis, offering new perspectives for understanding CRD-related metabolic disorders. This study opens avenues for future prevention and treatment of HUA, such as restoring intestinal uric acid excretion through targeted gut microbiota modulation, supplementation with ILA or its precursors, or intervention in the Ras signaling pathway, which may help relieve metabolic disorders potentially caused by CRD.
HTML
Experimental Animals
Main Reagents
Experimental Apparatus
Establishment of Animal Models
Food Intake and Body Weight Monitoring
Sample Collection Time and Drug Administration Protocol
16. S rRNA Amplification and Data Analysis of Gut Microbiota
Plasma Metabolomics Detection and Analysis
Enzyme-linked Immunosorbent Assay (ELISA)
Fecal Microbiota Transplantation (FMT) Experiment
Quantitative Polymerase Chain Reaction (qPCR)
Culture of HIEC-6 Cells
Statistical Analysis
CRD Leads to Elevated Uric Acid Levels
CRD Reduces Intestinal Uric Acid Excretion
CRD Alters Gut Microbiota Composition in Rats
CRD Decreases Plasma ILA Levels in Rats
Ameliorative Effects of ILA and FMT on CRD-Induced HUA
ILA Increases Intestinal ABCG2 Expression Through Ras
Competing Interests No conflicts of interest, financial or otherwise, are declared by the authors.
Ethics All animal experiments were performed in accordance with the relevant guidelines and regulations of Naval Medical University, and were approved by the Institutional Animal Care and Use Committee (IACUC) of Naval Medical University (approval number: NMU-20210901).
Authors’ Contributions Yixin Zhang: Writing-review & editing, Writing-original draft, Validation, Methodology, Investigation, Formal analysis, Data curation, Conceptualization. Qinyao Li: Validation, Methodology, Investigation, Formal Methodology, Investigation, Conceptualization. Yuwan Wang: Methodology, Software, Investigation, Data curation. Hongrong Zhu: Methodology, Formal, analysis, Data curation. Xing Tan: Formal analysis, Data curation. Jiacen Sun: Writing-review & editing, Writing-original draft, Validation, Software, Resources, Project administration, Funding acquisition, Methodology, Investigation, Formal analysis, Data curation, Conceptualization. Weizhong Wang: Writing-review & editing, Writing-original draft, Validation, Resources, Projectad ministration, Fundingacquisition, Methodology, Supervision, Conceptualization.
Data Sharing Data will be made available upon reasonable request.
&These authors contributed equally to this work.

 Quick Links

 DownLoad: