

 下载:
下载:

-
Overweight and obesity have become major global public health problems[1]. In addition, waist circumference and abdominal obesity have increased over the years in China[2]. Action needs to be directed at the main drivers of this epidemic to meet the global target of halting the rise in obesity by 2025[3]. With the accelerating global obesity pandemic, there is a corresponding pandemic of youth classified as overweight and obese. In low and middle-income countries, where almost two in three of the world's obese people live, there are likely to be continual increases in childhood overweight or obesity[1]. Conversely, in high income countries, trends in weight gain have been slowing in recent years[1]. Even though existing evidence shows that the prevalence of childhood overweight or obesity has not changed or reversed in France[4], Switzerland[5], Sweden[6], UK[7], Australia[8], or the US[9], evidence suggests a rapid increase from 0.1% to 7.3% between 1985 and 2014 in China[10-12].
Childhood and adolescence are critical developmental periods during which individuals establish foundations for their future health. The 'tracking' or 'carryover' of obesity from childhood to adulthood has been well-established[13-14]. Evidence shows consistent risks as BMI reached more than 23 kg/m, especially for cardiovascular disease, cancer, diabetes, osteoarthritis, and chronic kidney disease[15]. Without a substantial decrease in the prevalence of childhood obesity, the impact will continue to increase as the large number of currently obese children become obese adults; consequently, occurrence of diabetes, heart disease, stroke, cancer, or other weight-related diseases will also increase. Obesity prevention during childhood and adolescence is particularly important in China with the emergence of obesogenic environments coinciding with (if not caused by) China's rapid economic development.
The etiology of overweight and obesity among girls and boys may be different due to biology as well as society and culture[16]. Boys and girls differ in body composition, patterns of weight gain, hormone biology, and the susceptibility to certain social, ethnic, genetic, and environmental factors[17]. Understanding gender differences in child and adolescent overweight and obesity risk and associated predictors is critical for the development and implementation of policy and interventions. Gender differences in prevalence of childhood obesity have been observed in many countries. Some studies reported higher overweight and obesity prevalence in girls than in boys[18-20], whereas others have reported the opposite[11, 21]. Some recent studies reported gender differences with respect to the behavioral determinants of overweight, including calorie intake and physical activity[21-23]. Similar studies have been absent in China so far. Addressing this gap is vital to provide guidance to program planners and public health decision makers with a mandate in childhood obesity prevention in China. Accordingly, the purpose of this study was to investigate potential gender differences in the odds of being, or perceiving oneself as, overweight, and in related behaviors among Chinese primary school children.
-
A national cross-sectional survey was conducted between September and October in 2010. Participants were selected using a three-stage cluster random sampling method. For the first stage of sampling (provincial level), eight provinces, autonomous regions, or municipalities were selected from southern and northern China. This sampling strategy was described in detail in a work published elsewhere[24]. Briefly, each province, autonomous region, or municipality was classified into three strata of lower-, middle-, and higher-economic levels according to the gross domestic product (GDP) per capita. For the second sampling stage, three counties or county-level cities were randomly selected in each stratum. For the third sampling stage, one urban and one rural primary school were randomly selected in each county or city.
Letters were sent out to families of 12, 811 children in grades 4 through 6, informing parents about the study. Letters of informed consent for the students were obtained from both schools and parents. After measurements of height, weight, waist circumference, and blood pressure, all attending students were administered a survey that they filled out by themselves, and a family questionnaire that was filled out by the parents or guardians. Of all the children available in the selected schools according to class lists, 84.7% of children were included in the present study. An overview of the inclusion process in the nationwide school-based survey in 2010 is described in Figure 1. Ethics approval was obtained from the Ethics Committee of China Centers for Disease Control and Prevention. All participants signed written informed consent forms.
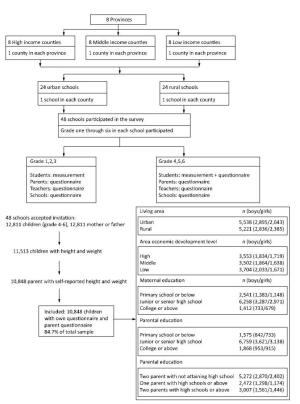
Figure 1. An overview of the inclusion process in the nationwide school-based survey in 2010.
-
The primary outcome was overweight or obese status compared with 'normal' weight, based upon body mass index (BMI) categories. Height was measured to the nearest 0.1 cm and weight to the nearest 0.1 kg[25]; children wore light clothing and no shoes during measurement. The International Obesity Task Force (IOTF) cutoffs are recommended for use in international comparisons of the prevalence of overweight and obesity. Considering the differences in body composition across different ethnic groups, the Working Group for Obesity in China (WGOC) organized by International Life Science Institute Focal Point in China conducted an analysis of BMI in children and adolescents aged 7-18 years; the age-, sex-specific BMI 85th and 95th percentiles were developed, respectively, by using the B-spline curve to adjust the curves passing through a BMI of 24 and 28 kg/m2 (the cutoff points used for Chinese adults to define overweight and obesity, respectively) at 18 years of age[26]. The BMI classification reference for overweight and obesity recommended by the WGOC is a rational way to predict and prevent health risks in Chinese children and adolescents[27]. This standard is the most appropriate one and has been applied extensively in recent years.
Secondary outcomes included weight-related perceptions and behaviors. Students were asked 'how do you describe your weight?' with response options including 'very underweight', 'slightly underweight', 'about the right weight', 'slightly overweight', and 'very overweight'. Eight daily eating behaviors included: eating breakfast, fruits, vegetables, fried foods, western fast food, desserts, drinking sugar-sweetened drinks, and carbohydrate drinks (e.g., Coke or Sprite), were asked of participating children. Consumption of high-energy food or drinks included fried food, western fast food, desert, sugar-sweetened drinks, and carbohydrate beverages. Responses to these dietary questions were dichotomized into '4 days per week or more' or '3 days per week or less'. The survey also asked how many hours per day students spent on (ⅰ) homework; (ⅱ) TV; (ⅲ) sedentary extracurricular activities (e.g. playing the piano); and (ⅳ) outdoor physical activities. These questions were asked separately for weekdays and weekends. Approximate hours per day were calculated by adding the hours on weekdays (× 5 days) plus hours on weekends (× 2 days) and dividing by seven for each variable. The three variables concerning sedentary activity (ⅰ-ⅲ) were used to estimate total sedentary activity per day by adding up the time spent on each item (ⅰ-ⅲ). Physical activity on weekdays or weekends was used separately in the analysis after being dichotomized into '1 hour per day' or 'less than 1 hour per day'. Sedentary activity on weekdays or weekends were analyzed separately after being dichotomized into '4 hours per day' or 'less than 4 hours per day'. Finally, two questions were included in the survey on weight control practices. Exercise was measured with the question 'do you plan to do exercise to lose weight or keep from gaining weight?' Diet was measured with the question 'do you plan to diet to lose weight or keep from gaining weight?'
-
The location of the school was classified into an urban or rural area. Urban students were defined as students living in an urban area as defined by the national census or statistical bureau. Area economic development level was classified based on the county or city where schools were located into high, medium, or low based on per capita GDP.
-
Parents were asked to state the highest level of completed education for both the mother and the father. This was classified into primary school or lower (low education), middle or high school (medium education), and college or above (higher education). Self-reported height and weight were used to calculate parental BMI. A BMI of 24 kg/m2 and 28 kg/m2 were cutoffs for overweight and obesity, respectively, for parents.
-
All analyses were performed using Stata 14 (StataCorp, College Station, TX, USA). Means, proportions, and their confidence intervals were calculated. Z-tests were used to examine statistical significance of proportional differences. Chi-square tests were used to examine the difference in perceived overweight by level of urbanization and gender. Logistic regressions were used to examine gender differences in the odds of each outcome, before and after adjusting for confounders. All tests for statistical significance were two-sided and the significance level was set as α = 0.05.
-
The characteristics of the study sample are presented in Table 1. Approximately 53.3% of the participants were boys and 46.7% were girls. The mean age of children was 10.6 ± 1.0. The prevalence of overweight and obesity according to the Chinese WGOC definition was 16.5%, including overweight 9.7% and obesity 6.7%, respectively. The prevalence of overweight and obesity differed significantly between boys (20.9%) and girls (11.6%) (P < 0.001). Eating behaviors were statistically different between boys and girls (P < 0.001); a higher percentage of girls reported healthier diets, such as having breakfast (73.3% of girls vs. 68.4% of boys), fruit (40.9% vs. 33.3%), and vegetables (63.9% vs. 58.3%) every day. Girls also reported a lower percentage of high-energy diets, for example, fried food (8.8% vs. 10.5%), western fast food (2.3% vs. 3.6%), sugar-sweetened drinks (15.4% vs. 21.3%), and carbohydrate drinks (8.8% vs. 13.7%) 4 days or more per week. Approximately 18.2% of participants reported having dessert 4 days or more per week, and this differed statistically between boys (17.5%) and girls (19.1%). No gender differences were observed in the reporting of physical activity and sedentary activity. Relative to girls, boys reported more exercise or dieting to lose weight or keep from gaining weight (P < 0.001).
Table 1. Characteristics of Study Sample from Grade 4 through 6 Students in Eight Provinces across China
Variables Total (%) Boys (%) Girls (%) P Value* Body weight status Overweight 9.8 12.0 7.1 < 0.001 Obesity 6.8 8.8 4.4 < 0.001 Overweight and obesity 16.5 20.9 11.6 < 0.001 Weight perception 0.001 Perceived underweight 26.9 27.8 26.1 Perceived normal weight 49.5 47.8 51.4 Perceived overweight 23.6 24.5 22.5 Mother's education 0.099 Primary school or low 24.9 25.7 23.9 Junior or senior middle school 61.3 60.7 61.9 College or above 13.8 13.5 14.2 Father's education 0.096 Primary school or low 16.2 16.2 16.1 Junior or senior middle school 65.8 66.5 65.0 College or above 18.0 17.3 18.9 Level of urbanization 0.034 Urban 51.5 50.5 52.6 Rural 48.5 49.5 47.4 Eating behavior Having breakfast every day 70.7 68.4 73.3 < 0.001 Having fruit every day 36.8 33.3 40.9 < 0.001 Having vegetable every day 60.9 58.3 63.9 < 0.001 Having fried food 4 days or more per week 9.7 10.5 8.8 < 0.001 Having western fast food 4 days or more per week 3.0 3.6 2.3 < 0.001 Having desert 4 days or more per week per week 18.2 17.5 19.1 < 0.001 Drinking sugar-sweeten drinks 4 days or more per week 18.6 21.3 15.4 < 0.001 Drinking carbohydrate drinks 4 days or more per week 11.4 13.7 8.8 < 0.001 Physical activity Physical activity one hour on weekday 98.9 98.7 99.0 0.123 Physical activity one hour on weekend 98.9 98.8 99.1 0.17 Sedentary activity Sedentary activity 4 hours per day on weekday 47.4 46.9 47.9 0.11 Sedentary activity 4 hours per day on weekend 84.9 84.4 85.5 0.31 Weight control practices Doing exercise to control weight 57.0 58.0 55.7 0.043 Diet to control weight 36.9 39.5 34.0 < 0.001 Note. *Difference between boys and girls. Table 2 reports the odds in each outcome for boys relative to girls. After adjusting for confounders, (area economic development level, level of urbanization, and maternal education), boys in urban areas had greater odds of being overweight or obese than girls [Adjusted Odds Ratio (AOR) 2.30, 95% Confidence Interval (95% CI) 2.00 to 2.65]. Slightly lower odds were observed in rural areas (AOR 1.85, 95% CI 1.55 to 2.20). Relative to girls, boys in urban areas had greater odds of perceiving themselves as overweight (AOR 1.22, 95% CI 1.08 to 1.38), though there were no appreciable differences in rural areas. Boys, relative to girls, had lower odds of meeting the recommendation of having breakfast (AOR 0.79, 95% CI 0.72 to 0.86), fruit (AOR 0.74, 95% CI 0.68 to 0.80), and vegetables (AOR 0.79, 95% CI 0.73 to 0.85) every day. Relative to girls, boys reported having consumed more high-energy food, although girls' diets, relative to boys, were more likely to include desserts (AOR 0.89, 95% CI 0.80 to 0.98).
Table 2. Odds of Being Overweight or Engaging in Eating Behaviors, Physical Activity, and Weight Control Practices of Boys Relative to Girls
Variables Unadjusted Adjusted* OR 95% CI P value OR 95% CI P value Overweight and obesity Overweight and obesity, urban (ref: not overweight or obese) 2.24 1.95-2.57 < 0.001 2.30 2.00-2.65 < 0.001 Overweight and obesity, rural (ref: not overweight or obese) 1.80 1.52-2.14 < 0.001 1.85 1.55-2.20 < 0.001 Perceived overweight Perceived overweight, urban (ref: perceived not overweight) 1.20 1.06-1.36 0.003 1.22 1.08-1.38 0.007 Perceived overweight, rural (ref: perceived not overweight) 1.03 0.90-1.18 0.664 1.04 0.91-1.20 0.549 Eating behavior Having breakfast every day (ref: less than everyday) 0.79 0.73-0.86 < 0.001 0.79 0.72-0.86 0.002 Having fruit every day (ref: less than everyday) 0.72 0.67-0.78 < 0.001 0.74 0.68-0.80 < 0.001 Having vegetable every day (ref: less than everyday) 0.79 0.73-0.86 < 0.001 0.79 0.73-0.85 < 0.001 Having fried food 4 days or more per week (ref: less than 4 days per week) 1.22 1.07-1.39 0.003 1.21 1.06-1.38 0.006 Having western fast food 4 days or more per week (ref: less than 4 days per week) 1.54 1.22-1.94 < 0.001 1.61 1.27-2.05 < 0.001 Having desert 4 days or more per week per week (ref: less than 4 days per week) 0.90 0.82-0.99 0.036 0.89 0.80-0.98 0.018 Drinking sugar-sweeten drinks 4 days or more per week (ref: less than 4 days per week) 1.49 1.35-1.65 < 0.001 1.49 1.34-1.65 < 0.001 Drinking carbohydrate drinks 4 days or more per week (ref: less than 4 days per week) 1.66 1.47-1.88 < 0.001 1.66 1.46-1.89 < 0.001 Physical activity Physical activity one hour on weekday (ref: less than one hour on weekday) 0.75 0.54-1.08 0.171 0.74 0.49-1.09 0.128 Physical activity one hour on weekend (ref: less than one hour on weekday) 0.77 0.53-1.12 0.124 0.75 0.50-1.12 0.168 Sedentary activity Sedentary activity 4 hours per day on weekday (ref: less than four hours on weekday) 0.96 0.89-1.04 0.305 0.95 0.88-1.03 0.214 Sedentary activity 4 hours per day on weekend (ref: less than four hours on weekday) 0.92 0.82-1.02 0.111 0.91 0.82-1.02 0.100 Weight control practices Doing exercise to control weight (ref: no) 1.10 1.00-1.21 0.043 1.11 1.01-1.23 0.026 Diet to control weight (ref: no) 1.26 1.15-1.39 < 0.001 1.29 1.16-1.42 < 0.001 Note.*Adjusted for area economic development level, maternal education, residence (urban versus rural). Table 3 describes the frequency of actual and perceived weight status responses. Although the prevalence of overweight and obesity was higher in urban areas than rural, the pattern of perceived weight status appeared to be similar in both areas. Approximately 30.9% of total boys and 29.7% of total girls who were overweight or obese misclassified themselves as either underweight or normal weight. Among boys who were not overweight or obese, 33.7% misclassified themselves as underweight and 12.7% misclassified themselves as overweight. Among girls who were not overweight or obese, 29.1% said they were underweight and 16.2% said they were overweight. Despite not being overweight or obese, girls were more likely to perceive themselves as overweight.
Table 3. Frequency Distribution of Perceived Weight Status by Urban and Rural
Variables Boys, Actual Overweight and Obese, n(%) Girls, Actual Overweight and Obese, n(%) Yes No P Valuea Yes No P Valuea Urban Perceived underweight 34 (4.6%) 742 (35.0%) < 0.001 12 (3.4%) 663 (29.1%) < 0.001 Perceived normal weight 192 (26.0%) 1, 130 (53.3%) 92 (25.9%) 1, 251 (55.0%) Perceived overweight 514 (69.4%) 250 (11.7%) 251 (70.7%) 361 (15.9%) Rural Perceived underweight 24 (5.4%) 769 (32.6%) < 0.001 8 (3.6%) 619 (29.0%) < 0.001 Perceived normal weight 117 (26.1%) 1, 273 (54.0%) 60 (26.7%) 1, 161 (54.4%) Perceived overweight 307 (68.5%) 317 (13.4%) 157 (69.7%) 356 (16.6%) Total Perceived underweight 58 (4.9%) 1, 511 (33.7%) < 0.001 20 (3.5%) 1, 282 (29.1%) < 0.001 Perceived normal weight 309 (26.0%) 2, 403 (53.6%) 152 (26.2%) 2, 412 (54.7%) Perceived overweight 821 (69.1%) 567 (12.7%) 408 (70.3%) 717 (16.2%) P valueb 0.831 0.112 0.971 0.770 Note.aDifference in the frequency distribution of those who were actual overweight and obesity, and who were not; bDifference in the frequency distribution between urban and rural. Table 4 shows the association between odds of perceived overweight and eating behaviors, physical activity, sedentary activity, and weight control practices. After adjusting for individual characteristics and behaviors, parental and environmental determinants, boys and girls had higher odds of perceiving themselves to be overweight if they were indeed overweight or obese, or doing exercise or dieting to lose weight. Boys whose mothers had higher educational attainment had higher odds of perceiving themselves as overweight (AOR 1.35, 95% CI 1.09 to 1.68), as did boys whose fathers had lower educational attainment (AOR 0.79, 95% CI 0.63 to 0.99).
Table 4. Association between Perceived Weight Statusa and Eating Behaviors, Physical Activity, Sedentary Activity, and Weight Control Practices
Variables Adjusted*, Boys Adjusted*, Girls OR 95% CI P value OR 95% CI P value Actual overweight and obese (ref: not overweight or obese) 17.5 14.0-22.0 < 0.001 11.7 8.84-15.6 < 0.001 Urban (ref: rural) 0.84 0.67-1.06 0.167 0.96 0.76-1.21 0.732 Mother's education (ref: primary school or none) junior or senior high school 1.30 0.98-1.74 0.074 1.04 0.77-1.40 0.797 college or above 1.96 1.25-3.08 0.003 0.96 0.60-1.53 0.860 Father's education (ref: primary school or none) junior or senior high school 0.96 0.69-1.34 0.798 0.87 0.62-1.24 0.449 college or above 0.62 0.39-0.97 0.038 0.81 0.51-1.30 0.386 Parental overweight and obese (ref: not overweight or obese) 1.19 0.96-1.47 0.122 1.24 0.99-1.55 0.064 Eating behavior Having breakfast every day (ref: less than everyday) 0.79 0.63-0.99 0.059 0.94 0.73-1.21 0.621 Having fruit every day (ref: less than everyday) 0.81 0.65-1.00 0.071 0.87 0.69-1.09 0.216 Having vegetable every day (ref: less than everyday) 1.00 0.80-1.25 0.963 1.11 0.88-1.41 0.378 Having fried food 4 days or more per week (ref: less than 4 days per week) 0.86 0.60-1.23 0.363 1.19 0.81-1.75 0.383 Having western fast food 4 days or more per week (ref: less than 4 days per week) 1.62 0.93-2.84 0.083 1.23 0.59-2.57 0.585 Having desert 4 days or more per week per week (ref: less than 4 days per week) 1.17 0.87-1.57 0.326 0.93 0.69-1.24 0.608 Drinking sugar-sweeten drinks 4 days or more per week (ref: less than 4 days per week) 0.81 0.61-1.07 0.131 1.01 0.73-1.41 0.942 Drinking carbohydrate drinks 4 days or more per week (ref: less than 4 days per week) 1.48 1.07-2.05 0.019 1.16 0.76-1.75 0.500 Physical activity Physical activity one hour on weekday (ref: less than one hour on weekday) 0.63 0.08-5.33 0.996 1.59 0.16-16.26 0.560 Physical activity one hour on weekend (ref: less than one hour on weekday) 0.99 0.11-9.14 0.680 1.80 0.24-13.19 0.697 Sedentary activity Sedentary activity 4 hours per day on weekday (ref: less than four hours on weekday) 1.22 0.98-1.52 0.071 1.35 1.08-1.69 0.009 Sedentary activity 4 hours per day on weekend (ref: less than four hours on weekday) 0.84 0.62-1.14 0.250 0.76 0.55-1.05 0.091 Weight control practices Doing exercise to control weight (ref: no) 1.77 1.38-2.28 0.001 1.71 1.31-2.22 < 0.001 Diet to control weight (ref: no) 1.48 1.17-1.87 < 0.001 1.90 1.48-2.44 < 0.001 Note.aDependent variable: perceived weight status 1 = see themselves overweight; 0 = see themselves normal weight or underweight; *Adjusted for grade and variables listed above. -
This study of Chinese primary school children in grades 4 to 6 revealed many gender differences among primary school children in China with respect to the odds of being overweight or obese, the odds of perceiving themselves as overweight, and the odds of participating in weight-related behaviors including physical activity and eating behaviors. The prevalence of overweight and obesity was higher among boys than girls. Boys were also more likely to perceive themselves as overweight than girls. Girls reported healthier diets, whereas boys reported more high-energy diets. Differences in physical activity and sedentary behavior between boys and girls were marginal. Our results support the development of gender-focused obesity prevention programs as a strategy to reduce the burden of overweight and the consequent chronic diseases.
-
Higher prevalence of overweight and obesity among boys in this study is consistent with findings among some previous work on children and youths aged 7 to 18 years from primary schools through high schools residing in an urban area of China[11, 28]. In our study, we found gender differences in the prevalence of overweight and obesity was higher in urban areas than in rural areas. These results are supported by a study in Japan, which reported increasing overweight and obesity among boys, but not girls, aged 9 to 11 years in urban areas[29].
Recent evidence also shows that the prevalence of childhood overweight and obesity is slightly higher among boys than girls in Asian countries like South Korea[5] and Hong Kong[30]. Conversely, some studies in European countries and the US reported higher levels of childhood obesity among girls than boys[5, 31-32].
-
Some recent studies showed gender differences with respect to the behavioral determinants of overweight including calorie intake and physical activity[21-23]. Existing evidence shows that girls pay more attention to foods as a way to influence health and to meet nutritional recommendations, and boys reportedly eat more fast food[22, 33]. Boys generally are at a risk of higher intakes of energy-dense food, like fruit juice and French fries[18, 22-33]. Our study consistently observed that girls were more likely to engage in healthy eating, (i.e., having fruits, vegetables, and breakfast) every day, whereas boys were more likely to consume high-energy food, (i.e., fried food, western fast food, sugar-sweetened drinks, and carbohydrate drinks). Preference for fruit and vegetables is a strong predictor of fruit and vegetable consumption[34-35], and previous work reported girls had a stronger preference for vegetables than boys on average[36]. Eating more fruits and vegetables can help maintain a healthy body weight and children who eat less fruit and vegetables are at a higher risk of obesity[37-38]. A previous study suggested that children were less likely to eat sugary foods or foods with poor nutrient density when fruit and vegetables made up a substantial proportion of their dietary intake[38]. In our study, 36.8% and 60.9% of children consumed fruit and vegetables every day, respectively. In addition, a study in French reported that having breakfast is a protective factor against childhood obesity[39]. These results call for programs to promote healthy eating, having breakfast every day, and sufficient fruit and vegetable consumption, particularly among boys.
-
Although more boys than girls were overweight, an opposite gender discrepancy was observed in weight perception. This present study found that among not overweight or obese children, girls were more likely to perceive themselves as overweight than boys. This is parallel with previous studies among Chinese adolescents[40-41]. Perception of being overweight among actually normal weight children may have reflected the weight dissatisfaction status of preadolescent girls in this study. An international comparison study suggested Chinese girls are more likely to be dissatisfied with their weight compared with their US counterparts[40]. The possible reason might be that Asian media promotes popularity of hyper-slim movie stars, pop music idols, and models. A Chinese study reported that exposure to Asian media lead to perceived overweight in girls[41]. Existing evidence suggests that distortion of weight perception may have detrimental influences on the psychological development of adolescents[42] and strongly correlates with a desire to lose weight through unhealthy weight control behaviors such as skipping meals, fasting, vomiting, and taking laxatives[43-44], which are risk factors for eating disorders and obesity[43]. Hence, excessive concern about weight among Chinese preadolescent girls may put them at risk for unhealthy weight control practices. Theoretical models of health behavior change emphasize the need to perceive oneself at risk as a prerequisite to behavior change[45]. In this present study, we observed that approximately one third of boys and girls who were actually overweight do not perceive themselves overweight, which strongly correlated with their intention to engage in weight control practices. This observation is consistent with findings among both U.S. and Chinese adolescents[40]. A recent study consistently reported that weight underestimation was prevalent in overweight children in China[46]. These results suggest that actual weight and perception of weight status do not coincide, and that deviations between actual and perceived weight status are more common among overweight and obese children and adolescents in China. Furthermore, these results suggest that both boys and girls who perceive themselves as overweight, are favorable towards healthy eating and physical activity to control weight. To improve the effectiveness of obesity prevention interventions, it may be prudent to help children and adolescents recognize they are at risk of overweight and obesity, and to correct their misperceptions of weight. Our understanding of the gender difference in weight perception highlights the importance of addressing both obesity and eating disorder problems at the same time. Healthy weight image should be promoted when addressing childhood obesity to prevent the development of body dissatisfaction and unhealthy weight control practices, particularly among girls.
Strengths of the present study include its large representative sample, measured height and weight and its response rate that is considered high for school-based research. A further limitation relates to the cross-sectional design that related to directionality and causality. Self-report is prone to error. As in other studies, in the present study this may have led to an over-reporting of physical activity. The use of objective measure of physical activity would have permitted us to more accurately estimate physical activity levels of students, although it is acknowledged that the use of such devices may be logistically and financially challenging in large population studies.
-
Gender frameworks are not only important to our understanding of the determinants of health, but also for the development of effective health promotion programs. With respect to health in general, there is indication that integrating gender considerations into interventions will improve their effectiveness[47]. A study in Japan presented considerable gender-related differences in the development of obesity in Japanese children[48]. A study in Chile suggested gender differences in physical activity[49]. The present study consistently raised the concern for understanding the gender difference in developing obesity in China. The results from this present study contribute to understanding of the gender difference in overweight and obesity, associated behavior, and weight perception among Chinese children. The results reinforce the need to support the development of gender-focused population-level obesity prevention strategies to reduce the burden of obesity and prevent the development of chronic diseases in adulthood. Healthy weight image should be promoted among boys who were more likely to be overweight and obese, but are less likely to see that they are overweight.
Childhood obesity has become a significant public health problem in China. The analyses and results presented in this paper suggest that interventions to prevent weight gain in Chinese primary school children need to be gender sensitive, and in particular, shift gendered eating behaviors and weight perceptions via population-level strategies.
-
The authors would like to thank all investigators from provincial and county level Centers for Disease Control and Prevention in the eight participating Provinces. We are grateful to participating schools and families.
-
The authors declare no conflict of interest.
doi: 10.3967/bes2018.001
Gender Differences in the Prevalence of Overweight and Obesity, Associated Behaviors, and Weight-related Perceptions in a National Survey of Primary School Children in China
-
Abstract:
Objective To in vestigate potential gender differences in the odds of overweight/obese, weight-related perceptions, and behaviors among Chinese school children. Methods Height, weight, and a survey of weight-related perceptions and behaviors were measured in a nationally representative survey of 12, 811 children in primary schools in China. Logistic regression analyses were used to assess gender differences, adjusting for confounders. Results Boys had higher odds of being overweight/obese compared to girls within both urban[adjusted odds ratio (OR) 2.30, 95% CI 2.00 to 2.65] and rural areas (OR=1.85, 95% CI 1.55 to 2.20). Girls reported healthier diets (e.g., daily vegetables OR=0.79, 95% CI 0.73 to 0.85) whereas boys consumed fried food (OR=1.21, 95% CI 1.06 to 1.38) and sugar-sweetened drinks more often (OR=1.49, 95% CI 1.34 to 1.65). Gender differences included higher odds of boys perceiving themselves as overweight if they had more highly educated mothers (OR=1.35, 95% CI 1.09 to 1.68), less educated fathers (OR=0.79, 95% CI 0.63 to 0.99), and if they frequently consumed carbonated drinks (OR=1.48, 95% CI 1.07 to 2.05). Conclusion Childhood obesity prevention in China should be gender-focused, particularly for boys who reported an unhealthier diet but were less likely to see they were fat, even though more boys were overweight or obese than girls. -
Key words:
- Overweight and obesity /
- Behaviors /
- Weight perception /
- Gender /
- Children
-
Figure 1. An overview of the inclusion process in the nationwide school-based survey in 2010.
Table 1. Characteristics of Study Sample from Grade 4 through 6 Students in Eight Provinces across China
Variables Total (%) Boys (%) Girls (%) P Value* Body weight status Overweight 9.8 12.0 7.1 < 0.001 Obesity 6.8 8.8 4.4 < 0.001 Overweight and obesity 16.5 20.9 11.6 < 0.001 Weight perception 0.001 Perceived underweight 26.9 27.8 26.1 Perceived normal weight 49.5 47.8 51.4 Perceived overweight 23.6 24.5 22.5 Mother's education 0.099 Primary school or low 24.9 25.7 23.9 Junior or senior middle school 61.3 60.7 61.9 College or above 13.8 13.5 14.2 Father's education 0.096 Primary school or low 16.2 16.2 16.1 Junior or senior middle school 65.8 66.5 65.0 College or above 18.0 17.3 18.9 Level of urbanization 0.034 Urban 51.5 50.5 52.6 Rural 48.5 49.5 47.4 Eating behavior Having breakfast every day 70.7 68.4 73.3 < 0.001 Having fruit every day 36.8 33.3 40.9 < 0.001 Having vegetable every day 60.9 58.3 63.9 < 0.001 Having fried food 4 days or more per week 9.7 10.5 8.8 < 0.001 Having western fast food 4 days or more per week 3.0 3.6 2.3 < 0.001 Having desert 4 days or more per week per week 18.2 17.5 19.1 < 0.001 Drinking sugar-sweeten drinks 4 days or more per week 18.6 21.3 15.4 < 0.001 Drinking carbohydrate drinks 4 days or more per week 11.4 13.7 8.8 < 0.001 Physical activity Physical activity one hour on weekday 98.9 98.7 99.0 0.123 Physical activity one hour on weekend 98.9 98.8 99.1 0.17 Sedentary activity Sedentary activity 4 hours per day on weekday 47.4 46.9 47.9 0.11 Sedentary activity 4 hours per day on weekend 84.9 84.4 85.5 0.31 Weight control practices Doing exercise to control weight 57.0 58.0 55.7 0.043 Diet to control weight 36.9 39.5 34.0 < 0.001 Note. *Difference between boys and girls.  下载: 导出CSV
Table 2. Odds of Being Overweight or Engaging in Eating Behaviors, Physical Activity, and Weight Control Practices of Boys Relative to Girls
Variables Unadjusted Adjusted* OR 95% CI P value OR 95% CI P value Overweight and obesity Overweight and obesity, urban (ref: not overweight or obese) 2.24 1.95-2.57 < 0.001 2.30 2.00-2.65 < 0.001 Overweight and obesity, rural (ref: not overweight or obese) 1.80 1.52-2.14 < 0.001 1.85 1.55-2.20 < 0.001 Perceived overweight Perceived overweight, urban (ref: perceived not overweight) 1.20 1.06-1.36 0.003 1.22 1.08-1.38 0.007 Perceived overweight, rural (ref: perceived not overweight) 1.03 0.90-1.18 0.664 1.04 0.91-1.20 0.549 Eating behavior Having breakfast every day (ref: less than everyday) 0.79 0.73-0.86 < 0.001 0.79 0.72-0.86 0.002 Having fruit every day (ref: less than everyday) 0.72 0.67-0.78 < 0.001 0.74 0.68-0.80 < 0.001 Having vegetable every day (ref: less than everyday) 0.79 0.73-0.86 < 0.001 0.79 0.73-0.85 < 0.001 Having fried food 4 days or more per week (ref: less than 4 days per week) 1.22 1.07-1.39 0.003 1.21 1.06-1.38 0.006 Having western fast food 4 days or more per week (ref: less than 4 days per week) 1.54 1.22-1.94 < 0.001 1.61 1.27-2.05 < 0.001 Having desert 4 days or more per week per week (ref: less than 4 days per week) 0.90 0.82-0.99 0.036 0.89 0.80-0.98 0.018 Drinking sugar-sweeten drinks 4 days or more per week (ref: less than 4 days per week) 1.49 1.35-1.65 < 0.001 1.49 1.34-1.65 < 0.001 Drinking carbohydrate drinks 4 days or more per week (ref: less than 4 days per week) 1.66 1.47-1.88 < 0.001 1.66 1.46-1.89 < 0.001 Physical activity Physical activity one hour on weekday (ref: less than one hour on weekday) 0.75 0.54-1.08 0.171 0.74 0.49-1.09 0.128 Physical activity one hour on weekend (ref: less than one hour on weekday) 0.77 0.53-1.12 0.124 0.75 0.50-1.12 0.168 Sedentary activity Sedentary activity 4 hours per day on weekday (ref: less than four hours on weekday) 0.96 0.89-1.04 0.305 0.95 0.88-1.03 0.214 Sedentary activity 4 hours per day on weekend (ref: less than four hours on weekday) 0.92 0.82-1.02 0.111 0.91 0.82-1.02 0.100 Weight control practices Doing exercise to control weight (ref: no) 1.10 1.00-1.21 0.043 1.11 1.01-1.23 0.026 Diet to control weight (ref: no) 1.26 1.15-1.39 < 0.001 1.29 1.16-1.42 < 0.001 Note.*Adjusted for area economic development level, maternal education, residence (urban versus rural).
下载: 导出CSV
Table 3. Frequency Distribution of Perceived Weight Status by Urban and Rural
Variables Boys, Actual Overweight and Obese, n(%) Girls, Actual Overweight and Obese, n(%) Yes No P Valuea Yes No P Valuea Urban Perceived underweight 34 (4.6%) 742 (35.0%) < 0.001 12 (3.4%) 663 (29.1%) < 0.001 Perceived normal weight 192 (26.0%) 1, 130 (53.3%) 92 (25.9%) 1, 251 (55.0%) Perceived overweight 514 (69.4%) 250 (11.7%) 251 (70.7%) 361 (15.9%) Rural Perceived underweight 24 (5.4%) 769 (32.6%) < 0.001 8 (3.6%) 619 (29.0%) < 0.001 Perceived normal weight 117 (26.1%) 1, 273 (54.0%) 60 (26.7%) 1, 161 (54.4%) Perceived overweight 307 (68.5%) 317 (13.4%) 157 (69.7%) 356 (16.6%) Total Perceived underweight 58 (4.9%) 1, 511 (33.7%) < 0.001 20 (3.5%) 1, 282 (29.1%) < 0.001 Perceived normal weight 309 (26.0%) 2, 403 (53.6%) 152 (26.2%) 2, 412 (54.7%) Perceived overweight 821 (69.1%) 567 (12.7%) 408 (70.3%) 717 (16.2%) P valueb 0.831 0.112 0.971 0.770 Note.aDifference in the frequency distribution of those who were actual overweight and obesity, and who were not; bDifference in the frequency distribution between urban and rural.
下载: 导出CSV
Table 4. Association between Perceived Weight Statusa and Eating Behaviors, Physical Activity, Sedentary Activity, and Weight Control Practices
Variables Adjusted*, Boys Adjusted*, Girls OR 95% CI P value OR 95% CI P value Actual overweight and obese (ref: not overweight or obese) 17.5 14.0-22.0 < 0.001 11.7 8.84-15.6 < 0.001 Urban (ref: rural) 0.84 0.67-1.06 0.167 0.96 0.76-1.21 0.732 Mother's education (ref: primary school or none) junior or senior high school 1.30 0.98-1.74 0.074 1.04 0.77-1.40 0.797 college or above 1.96 1.25-3.08 0.003 0.96 0.60-1.53 0.860 Father's education (ref: primary school or none) junior or senior high school 0.96 0.69-1.34 0.798 0.87 0.62-1.24 0.449 college or above 0.62 0.39-0.97 0.038 0.81 0.51-1.30 0.386 Parental overweight and obese (ref: not overweight or obese) 1.19 0.96-1.47 0.122 1.24 0.99-1.55 0.064 Eating behavior Having breakfast every day (ref: less than everyday) 0.79 0.63-0.99 0.059 0.94 0.73-1.21 0.621 Having fruit every day (ref: less than everyday) 0.81 0.65-1.00 0.071 0.87 0.69-1.09 0.216 Having vegetable every day (ref: less than everyday) 1.00 0.80-1.25 0.963 1.11 0.88-1.41 0.378 Having fried food 4 days or more per week (ref: less than 4 days per week) 0.86 0.60-1.23 0.363 1.19 0.81-1.75 0.383 Having western fast food 4 days or more per week (ref: less than 4 days per week) 1.62 0.93-2.84 0.083 1.23 0.59-2.57 0.585 Having desert 4 days or more per week per week (ref: less than 4 days per week) 1.17 0.87-1.57 0.326 0.93 0.69-1.24 0.608 Drinking sugar-sweeten drinks 4 days or more per week (ref: less than 4 days per week) 0.81 0.61-1.07 0.131 1.01 0.73-1.41 0.942 Drinking carbohydrate drinks 4 days or more per week (ref: less than 4 days per week) 1.48 1.07-2.05 0.019 1.16 0.76-1.75 0.500 Physical activity Physical activity one hour on weekday (ref: less than one hour on weekday) 0.63 0.08-5.33 0.996 1.59 0.16-16.26 0.560 Physical activity one hour on weekend (ref: less than one hour on weekday) 0.99 0.11-9.14 0.680 1.80 0.24-13.19 0.697 Sedentary activity Sedentary activity 4 hours per day on weekday (ref: less than four hours on weekday) 1.22 0.98-1.52 0.071 1.35 1.08-1.69 0.009 Sedentary activity 4 hours per day on weekend (ref: less than four hours on weekday) 0.84 0.62-1.14 0.250 0.76 0.55-1.05 0.091 Weight control practices Doing exercise to control weight (ref: no) 1.77 1.38-2.28 0.001 1.71 1.31-2.22 < 0.001 Diet to control weight (ref: no) 1.48 1.17-1.87 < 0.001 1.90 1.48-2.44 < 0.001 Note.aDependent variable: perceived weight status 1 = see themselves overweight; 0 = see themselves normal weight or underweight; *Adjusted for grade and variables listed above.
下载: 导出CSV
-
[1] Ng M, Fleming T, Robinson M, et al. Global, regional, and national prevalence of overweight and obesity in children and adults during 1980-2013:a systematic analysis for the Global Burden of Disease Study 2013. Lancet, 2014; 384, 766. doi: 10.1016/S0140-6736(14)60460-8 [2] Zhai Y, Fang HY, Yu WT, et al. Changes in Waist Circumference and Abdominal Obesity among Chinese Adults over a Ten-year Period. Biomed Environ Sci, 2017; 30, 315-22. doi: 10.1186/1471-2458-13-1064 [3] World Health Organization. Global action plan for the prevention and control of noncommunicable diseases 2013-2020. 2013. [4] Lioret S, Touvier M, Dubuisson C, et al. Trends in child overweight rates and energy intake in France from 1999 to 2007:relationships with socioeconomic status. Obesity, 2009; 17, 1092-100. doi: 10.1038/oby.2008.619 [5] Aeberli I, Amman R, Knabenhans M, et al. The national prevalence of overweight in school-age children in Switzerland has decreased between 2002 and 2007. Int J Obesity, 2008; 32, 214. https://www.researchgate.net/publication/304998330_The_national_prevalence_of_overweight_in_school-age_children_in_Switzerland_has_decreased_between_2002_and_2007 [6] Sundblom E, Petzold M, Rasmussen F, et al. Childhood overweight and obesity prevalences levelling off in Stockholm but socioeconomic differences persist. Int J Obesity, 2008; 32, 1525. doi: 10.1038/ijo.2008.104 [7] Stamatakis E, Wardle J, Cole TJ. Childhood obesity and overweight prevalence trends in England:evidence for growing socio-economic disparities. Int J Obesity, 2010; 34, 41-7. doi: 10.1038/ijo.2009.217 [8] Olds TS, Tomkinson GR, Ferrar KE, et al. Trends in the prevalence of childhood overweight and obesity in Australia between 1985 and 2008. Int J Obesity, 2010; 34, 57-66. doi: 10.1038/ijo.2009.211 [9] Ogden CL, Carroll MD, Flegal KM. High body mass index for age among US children and adolescents, 2003-2006. JAMA, 2008; 299, 2401-5. doi: 10.1001/jama.299.20.2401 [10] Wang S, Dong Y, Wang Z, et al. Trends in overweight and obesity among Chinese children of 7-18 years old during 1985-2014. Chin DJ Rev Med, 2017; 51, 300-5. (In Chinese). https://www.sciencedirect.com/science/article/pii/S2095254617301126 [11] Song Y, Wang HJ, Dong B, et al. 25-year trends in gender disparity for obesity and overweight by using WHO and IOTF definitions among Chinese school-aged children:a multiple cross-sectional study. BMJ Open, 2016; 6, e011904. doi: 10.1136/bmjopen-2016-011904 [12] Song Y, Ma J, Wang HJ, et al. Secular trends of obesity prevalence in Chinese children from 1985 to 2010:Urban-rural disparity. Obesity, 2015; 23, 448. doi: 10.1002/oby.v23.2 [13] Stark O, Atkins E, Wolff OH, et al. Longitudinal study of obesity in the National Survey of Health and Development. British Medical Journal, 1981; 283, 13-7. doi: 10.1136/bmj.283.6283.13 [14] Serdula MK, Ivery D, Coates RJ, et al. Do obese children become obese adults? A review of the literature. Preventive Medicine, 1993; 22, 167-77. doi: 10.1006/pmed.1993.1014 [15] Wormser D, Kaptoge S, Di AE, et al. Separate and combined associations of body-mass index and abdominal adiposity with cardiovascular disease:collaborative analysis of 58 prospective studies. Lancet, 2011; 377, 1085-95. doi: 10.1016/S0140-6736(11)60105-0 [16] Krieger N. Genders, sexes, and health:what are the connections-and why does it matter? Int J Epidemiol, 2003; 32, 652-7. doi: 10.1093/ije/dyg156 [17] Wisniewski AB, Chernausek SD. Gender in childhood obesity:Family environment, hormones, and genes. Gender Med, 2009; 6, 76. doi: 10.1016/j.genm.2008.12.001 [18] Keane E, Kearney PM, Perry IJ, et al. Trends and prevalence of overweight and obesity in primary school aged children in the Republic of Ireland from 2002-2012:a systematic review. BMC Public Health, 2014; 14, 974. doi: 10.1186/1471-2458-14-974 [19] Thorkild IAS. Secular Trends in Childhood Obesity in Denmark During 50 Years in Relation to Economic Growth. Obesity, 2007; 15, 977-85. doi: 10.1038/oby.2007.603 [20] Olds TS, Tomkinson GK. Trends in the prevalence of childhood overweight and obesity in Australia between 1985 and 2008. Int J Obesity, 2010; 34, 57-66. doi: 10.1038/ijo.2009.211 [21] Simenkapeu A, Veugelers PJ. Should public health interventions aimed at reducing childhood overweight and obesity be gender-focused? BMC Public Health, 2010; 10, 1-7. doi: 10.1186/1471-2458-10-340 [22] Lorson BA, Melgarquinonez HR, Taylor CA. Correlates of fruit and vegetable intakes in US children. J Am Diet Assoc, 2009; 109, 474-8. doi: 10.1016/j.jada.2008.11.022 [23] Caine-Bish NL, Scheule B. Gender Differences in Food Preferences of School-Aged Children and Adolescents. J Sch Health, 2009; 79, 532-40. doi: 10.1111/josh.2009.79.issue-11 [24] He L, Zhai Y, Engelgau M, et al. Association of children's eating behaviors with parental education, and teachers' health awareness, attitudes and behaviors:a national school-based survey in China. Eur J Public Health, 2014; 30, 880-7. https://www.pubfacts.com/detail/24287031/Association-of-childrens-eating-behaviors-with-parental-education-and-teachers-health-awareness-atti [25] Zhai Y, Shen C, Weirong LI, et al. An epidemical survey of body mass index and obesity among 26 558 elementary school children in China. Chin J Endocrinol Metab, 2013; 29, 669-73. (In Chinese) [26] Ji CY. Report on Childhood Obesity in China (1) Body Mass Index Reference for Screening Overweight and Obesity in Chinese School-age Children. Biomed Environ Sci, 2005; 18, 390-400. [27] Ma GS, Li YP, Hu XQ, et al. Report on childhood obesity in China (2). Verification of BMI classification reference for overweight and obesity in Chinese children and adolescents. Biomed Environ Sci, 2006; 19, 1. https://www.researchgate.net/publication/7106709_Report_on_childhood_obesity_in_China_2_Verification_of_BMI_classification_reference_for_overweight_and_obesity_in_Chinese_children_and_adolescents [28] Fu LG, Sun LL, Wu SW, et al. The Influence of Secular Trends in Body Height and Weight on the Prevalence of Overweight and Obesity among Chinese Children and Adolescents. Biomed Environ Sci, 2016; 29, 849-57. https://www.researchgate.net/publication/227710570_Trends_in_general_and_abdominal_obesity_among_Chinese_children_and_adolescents_1993-2009 [29] Matsushita Y, Yoshiike N, Kaneda F, et al. Trends in childhood obesity in Japan over the last 25 years from the national nutrition survey. Obesity Res, 2004; 12, 205-14. doi: 10.1038/oby.2004.27 [30] So HK, Nelson EA, Li AM, et al. Secular changes in height, weight and body mass index in Hong Kong Children. BMC Public Health, 2008; 8, 320. doi: 10.1186/1471-2458-8-320 [31] Emmanuel S, Jane W, Cole TJ. Childhood obesity and overweight prevalence trends in England:evidence for growing socio-economic disparities. Int J Obesity, 2010; 34, 41-7. doi: 10.1038/ijo.2009.217 [32] Ng M, Fleming T, Robinson M, et al. Global, regional, and national prevalence of overweight and obesity in children and adults during 1980-2013:a systematic analysis for the Global Burden of Disease Study 2013. Lancet, 2014; 384, 766-81. doi: 10.1016/S0140-6736(14)60460-8 [33] Simen-Kapeu A, Veugelers PJ. Should public health interventions aimed at reducing childhood overweight and obesity be gender-focused? BMC Public Health, 2010; 10, 1-7. doi: 10.1186/1471-2458-10-1 [34] Tuuri G, Zanovec M, Silverman L, et al. "Smart Bodies" school wellness program increased children's knowledge of healthy nutrition practices and self-efficacy to consume fruit and vegetables. Appetite, 2009; 52, 445-51. doi: 10.1016/j.appet.2008.12.007 [35] Wall DE, Least C, Gromis J, et al. Nutrition education intervention improves vegetable-related attitude, self-efficacy, preference, and knowledge of fourth-grade students. J Sch Health, 2012; 82, 37-43. doi: 10.1111/josh.2012.82.issue-1 [36] Granner ML, Sargent RG, Calderon KS, et al. Factors of fruit and vegetable intake by race, gender, and age among young adolescents. J Nutr Educ Behav, 2004; 36, 173-80. doi: 10.1016/S1499-4046(06)60231-5 [37] Sahota P, Rudolf MC, Dixey R, et al. Randomised controlled trial of primary school based intervention to reduce risk factors for obesity. BMJ, 2001; 323, 633-4. [38] Epstein LH, Gordy CC, Raynor HA, et al. Increasing fruit and vegetable intake and decreasing fat and sugar intake in families at risk for childhood obesity. Obesity, 2002; 9, 171-8. https://www.researchgate.net/profile/Leonard_Epstein/publication/12013592_Increasing_Fruit_and_Vegetable_Intake_and_Decreasing_Fat_and_Sugar_Intake_in_Families_at_Risk_for_Childhood_Obesity/links/02e7e529df1ca29bbc000000/Increasing-Fruit-and-Vegetable-Intake-and-Decreasing-Fat-and-Sugar-Intake-in-Families-at-Risk-for-Childhood-Obesity.pdf [39] Thibault H, Carriere C, Langevin C, et al. Prevalence and factors associated with overweight and obesity in French primary-school children. Public Health Nutr, 2013; 16, 193-201. doi: 10.1017/S136898001200359X [40] Zhang J, Seo DC, Kolbe L, et al. Comparison of overweight, weight perception, and weight-related practices among high school students in three large Chinese cities and two large U.S. cities. J Adolesc Health, 2011; 48, 366-72. doi: 10.1016/j.jadohealth.2010.07.015 [41] Xie B, Chou CP, Spruijt-Metz D, et al. Weight perception and weight-related sociocultural and behavioral factors in Chinese adolescents. Prev Med, 2006; 42, 229-34. doi: 10.1016/j.ypmed.2005.12.013 [42] Zhu H, Ma Y, Du Y, et al. Association between actual weight status, perceived weight and depressive, anxious symptoms in chinese adolescents:a cross-sectional study. BMC Public Health, 2010; 10, 1-8. doi: 10.1186/1471-2458-10-1 [43] Neumark-Sztainer D, Wall M, Guo J, et al. Obesity, Disordered Eating, and Eating Disorders in a Longitudinal Study of Adolescents:How Do Dieters Fare 5 Years Later? J Am Diet Assoc, 2006; 106, 559-68. doi: 10.1016/j.jada.2006.01.003 [44] Hsu LK. Can dieting cause an eating disorder? Psychol Med, 1997; 27, 509-13. doi: 10.1017/S0033291797004753 [45] Maximova K, Mcgrath JJ, Barnett T, et al. Do you see what I see? Weight status misperception and exposure to obesity among children and adolescents. Int J obes (Lond), 2008; 7, 11-22. https://www.researchgate.net/publication/5535667_Do_you_see_what_I_see_Weight_status_misperception_and_exposure_to_obesity_among_children_and_adolescents [46] Li C, Zhang T, Ma J, et al. Self-perception of weight status and its association with weight-related knowledge, attitudes, and behaviors among Chinese children in Guangzhou. J Epidemiol, 2017; 27, 338-45. doi: 10.1016/j.je.2016.08.011 [47] Brown T, Summerbell C. Systematic review of school-based interventions that focus on changing dietary intake and physical activity levels to prevent childhood obesity:an update to the obesity guidance produced by the National Institute for Health and Clinical Excellence. Obesity Rev, 2010; 10, 110-41. [48] Munakata H, Sei M, Ewis AA, et al. Prediction of Japanese children at risk for complications of childhood obesity:gender differences for intervention approaches. J Med Invest, 2010; 57, 62-8. doi: 10.2152/jmi.57.62 [49] Lizana PA, Paula CV, Araya L, et al. Obesity, Body Fat Distribution, and Physical Activity in Schoo l-age Children:an Urban and Rural Comparison in Valparaíso, Chile. Biomed Environ Sci, 2016; 29, 834-9. https://www.researchgate.net/publication/318110416_Using_LMS_tables_to_determine_waist_circumference_and_waist-to-height_ratios_in_Colombian_children_and_adolescents_The_FUPRECOL_study -

 点击查看大图

计量
- 文章访问数: 4030
- HTML全文浏览量: 1591
- PDF下载量: 188
- 被引次数: 0

 Quick Links