

 下载:
下载:

-
Metabolic syndrome (MetS) is the presence of a battery of cardiovascular risk factors including abdominal obesity, hypertension, dyslipidemia, and disturbed carbohydrate metabolism[1]. MetS affects 20% of adults in the Western world and 33% of adults in China[2] and has become a serious public health problem worldwide. However, the mechanism underlying the occurrence and progression of MetS is still largely unclear. It is now well established that excess fat deposition leads to abdominal obesity, which plays a vital role in the underlying mechanism. Adipose tissue can function as an endocrine organ that secretes various adipokines. The dysregulated expression of adipokines caused by excess adiposity and adipocyte dysfunction, has been linked to the pathogenesis of MetS[3]. Some serum adipokines such as leptin, adiponectin, interleukin 6 (IL-6), and tumour necrosis factor-α (TNF-α), might be potential markers for MetS development.
Glypican 4 (Gpc4) was firstly discovered by Watanaba et al. in the brains and kidneys of mice in 1995[4]. Ussar et al. have confirmed Gpc4 as a newly identified adipokine that is secreted by adipose tissue in 2012[5]. Gpc4 belongs to the family of glycosylphosphatidylinositol-anchored heparan sulfate proteoglycans. Gpc4 can interact with the insulin receptor and enhance insulin signaling, which then promotes adipocyte differentiation[5, 6]. It has been reported that high serum Gpc4 levels are related with high homeostasis model assessment of insulin resistance (HOMA-IR) scores and high fasting insulin levels[5, 6]. Yoo et al. found that serum Gpc4 levels were significantly related with cardiovascular risk factors including insulin resistance (IR) and body fat distribution in Asian women[7]. Our team previously discovered that Gpc4 was associated with obesity and IR. Serum Gpc4 concentrations were significantly elevated in obese subjects with IR and positively related with body mass index (BMI), systolic blood pressure (SBP), alanine aminotransferase (ALT), aspartate aminotransferase (AST), fasting insulin (FINS), and HOMA-IR score[8]. All these findings have demonstrated that Gpc4 is a novel adipokine that may play a crucial role in metabolic disorders. Therefore, it is reasonable for us to wonder whether Gpc4 has any relation with MetS.
Thus, the aim of our present study was to investigate the changes of serum Gpc4 levels and the correlations of Gpc4 levels with MetS components in a Han population with different metabolic statuses from Guizhou Province in China. In addition, the association between circulating Gpc4 concentrations and the risk of MetS was also assessed in our study.
The included participants were recruited from the National Physical and Health Survey Project of the 12th Five-Year Plan of Science and Technology Support, which was a cross-sectional survey of Han Chinese adults in Guizhou Province in 2012. In total, 312 subjects (male 132, female 180) were selected according to age and gender. All the subjects were divided into a control group (normal waist circumference and no abnormal metabolic components), a non-metabolic syndrome group (central obesity combined with 0-1 abnormal metabolic components), and a metabolic syndrome group (central obesity group combined with 2-4 abnormal metabolic components) according to the 2005 International Diabetes Federation (IDF) standard definition of MetS[9]. Individuals diagnosed with MetS had the following characteristics: (1) central obesity: the waist circumference (WC) was ≥ 90 cm in the men and ≥ 80 cm in the women; (2) two of the following: ①Raised triglycerides (TG) ≥ 150 mg/dL (1.7 mmol/L) or specific treatment for this lipid abnormality; ②High-density lipoprotein cholesterol (HDL-C) ≤ 40 mg/dL (1.03 mmol/L) in men or ≤ 50 mg/dL (1.29 mmol/L) in women or specific treatment for this abnormality; ③Systolic blood pressure (SBP) ≥ 130 mmHg or diastolic blood pressure (DBP) ≥ 85 mmHg or treatment for previously diagnosed hypertension; ④Fasting blood glucose (FBG) ≥ 100 mg/dL (5.6 mmol/L) or previously diagnosed type 2 diabetes.
This study was approved by the Ethics Committee of Basic Medical Sciences Institute of Chinese Academy of Medical Sciences (approval No. 028-2013). All participants signed documents of informed consent documents before participating in the study.
All recruited subjects received physical and clinical examinations, and blood samples were collected after an overnight fast for the biochemical measurements by an automatic biochemical analyzer (Beckman Company AU5800, USA). Blood pressure and pulse were measured by Omron HEM-907. Body composition was measured by body composition analyzer (BC-420, TANITAA, Japan). Fasting insulin was measured by the Siemens Centaur XP system (Siemens, Tarrytown, USA). The HOMA-IR score[19] was calculated as fasting insulin (mU/L) × fasting glucose (mmol/L)/22.5. Serum Gpc4 concentrations were determined by commercially available human Gpc4 enzyme-linked immunosorbent assay (ELISA) kits (Wuhan Youersheng Trading Co. Ltd., Wuhan, China). The intra-assay and inter-assay variation coefficients were were 2.9% and 4.1%, respectively.
All statistical analyses were performed using SPSS 19.0 for Windows (SPSS Inc., Chicago, IL, USA). Data are expressed as the mean ± SD or median with interquartile range. The normal distribution of the data was evaluated using the Shapiro-Wilk W test. The comparison of variables between three groups was performed by One Way ANOVA for normally distributed data and Kruskal-Wallis H test in abnormally distributed data. Pearson's or Spearman's correlation coefficients were used to determine the linear association between Gpc4 and the parameters of MetS. Logistic regression analyses were used to estimate the odds ratio (OR) and 95% confidence intervals (CIs) of Gpc4 for the risk of MetS. The level of statistical significance was set at P < 0.05.
The anthropometric, clinical and biochemical characteristics of all subjects are detailed in Table 1. As expected, metabolic-associated parameters such as FBG, FINS, HOMA-IR score, TG, TC, SBP, DBP, BMI, body fat rate (FAT%), WC, WHR, UA, and AST gradually significantly increased among the three groups (P < 0.01). The levels of FBG, FINS, HOMA-IR score, TG, TC, SBP, DBP, BMI, FAT%, WC, WHR, AST, and UA were significantly higher in the MetS group than in the control group (P < 0.05). The subjects in the MetS group had higher levels of FBG, HOMA-IR scores, TG, TC, SBP, DBP, WC, WHR, and UA than the non-MetS group (P < 0.05). HDL-C was significantly lower in the MetS group than in the non-MetS and control groups (P < 0.05).
Table 1. Clinical and Biochemical Characteristics of all Subjects
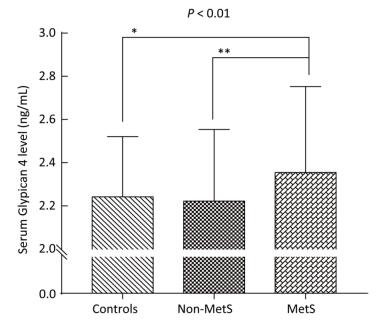
Variable Control Group (n = 70) Non-MetS Group (n = 84) MetS Group (n = 158) P-value Age (year) 47.8 ± 8.6 47.6 ± 10.4 49.3 ± 9.0 0.306 Gender (M/F) 37/33 33/51 62/96 0.128 BMI (kg/m2) 21.4 ± 2.7 26.7 ± 2.3a 27.3 ± 2.6a < 0.001 FAT (%) 23.4 ± 8.0 33.3 ± 6.0a 34.3 ± 6.3a < 0.001 WC (cm) 72.5 ± 7.8 89.3 ± 6.2a 91.4 ± 6.9ab < 0.001 WHR 0.86 ± 0.06 0.96 ± 0.06a 0.98 ± 0.05ab < 0.001 SBP (mmHg) 115 ± 9 127 ± 17a 141 ± 18ab < 0.001 DBP (mmHg) 70 ± 8 78 ± 10a 86 ± 11ab < 0.001 FBG (mmol/L) 4.75 ± 0.40 4.94 ± 0.56a 5.56 ± 1.15ab < 0.001 FINS (mU/L) 4.93 (3.38-6.66) 8.79 (5.81-11.70)a 10.52 (7.41-14.29)a < 0.001 HOMA-IR score 1.06 (0.68-1.51) 1.95 (1.33-2.51)a 2.40 (1.68-3.45)ab < 0.001 TG (mmol/L) 0.92 (0.74-1.20) 1.19 (0.95-1.55)a 2.50 (1.88-3.60)ab < 0.001 TC (mmol/L) 4.77 ± 0.87 5.01 ± 0.88 5.31 ± 1.16ab 0.001 LDL-C (mmol/L) 2.69 ± 0.73 1.46 ± 0.27 3.06 ± 0.78 0.002 HDL-C (mmol/L) 1.62 ± 0.28 3.02 ± 0.73a 1.24 ± 0.27ab < 0.001 AST (U/L) 20.50 (16.00-24.00) 22.00 (19.00-28.00)a 25.00 (19.00-30.25)a < 0.001 Urea (mmol/L) 4.99 ± 1.44 4.68 ± 1.22 4.83 ± 1.30 0.348 Cr (μmol/L) 71.87 ± 13.52 71.40 ± 14.94 72.71 ± 16.31 0.806 UA (μmol/L) 278.99 ± 84.72 303.94 ± 89.12 349.09 ± 95.56ab < 0.001 Gpc4 (ng/mL) 2.24 ± 0.28 2.22 ± 0.33 2.35 ± 0.40ab 0.010 Age < 50 y 2.21 ± 0.27 2.18 ± 0.31 2.30 ± 0.35b 0.052 Age ≥ 50 y 2.33 ± 0.28 2.31 ± 0.35 2.43 ± 0.45 0.329 Note. Values are expressed as the mean ± SD or median (interquartile Range). BMI, body mass index; WC, waist circumference; WHR, waist-hip ratio; SBP, systolic blood pressure; DBP, diastolic blood pressure; FBG, fasting blood glucose; FINS, fasting insulin; HOMA-IR, homeostasis model assessment estimate of insulin resistance; TG, triglycerides; TC, total cholesterol; LDL-C, low-density lipoprotein cholesterol; HDL-C, high-density lipoprotein cholesterol; AST, aspartate transaminase; Urea, urea nitrogen; Cr, Creatinine; UA, uric acid; Gpc4, Glypican 4. The P-value column is the result of comparison among the three groups. aP < 0.05 compared with the control group; bP < 0.05 compared with the non-MetS group. Bold font indicates P < 0.01. As shown in Table 1 and Figure 1, we observed significant difference in serum Gpc4 levels among three groups (P < 0.01). Serum Gpc4 levels were significantly higher in the MetS group than in the control group (2.35 ± 0.40 vs. 2.24 ± 0.28 ng/mL, P < 0.05) and the non-MetS group (2.35 ± 0.40 vs. 2.22 ± 0.33 ng/mL, P < 0.01).
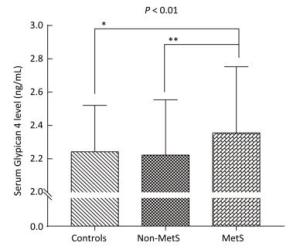
Figure 1. Serum Gpc4 levels (mean ± SD) in the three groups. *P < 0.05, **P < 0.01.
As displayed in Table 2, significant positive associations were found between serum Gpc4 levels and age, FBG, FINS, HOMA-IR, TG, TC, SBP, DBP, UA, urea, and Cr in all subjects (P < 0.05). Serum Gpc4 levels in MetS subjects were positively correlated with age, FBG, SBP, urea, Cr, and UA. Meanwhile, urea were positively related with serum Gpc4 levels in non-MetS subjects. Additionally, serum Gpc4 levels in control subjects were positively associated with age, HDL-C, and urea.
Table 2. Bivariate Correlation Between Serum Gpc4 Levels and Other Parameters
Gpc4 r (P-value) Control Group Non-MetS Goup MetS Group All Subjects Age (year) 0.196 (0.015)* 0.138 (0.210) 0.253 (0.001)** 0.235 (< 0.001)** Gender 0.010 (0.902) 0.037 (0.738) 0.049 (0.545) 0.042 (0.463) BMI (kg/m2) -0.090 (0.268) -0.045 (0.681) 0.020 (0.806) 0.044 (0.440) FAT (%) -0.037 (0.647) 0.008 (0.945) 0.070 (0.382) 0.073 (0.200) WC (cm) -0.043 (0.597) 0.041 (0.711) 0.035 (0.659) 0.075 (0.186) WHR 0.008 (0.924) 0.062 (0.576) 0.002 (0.806) 0.082 (0.149) SBP (mmHg) 0.101 (0.212) 0.121 (0.275) 0.207 (0.009)** 0.228 (< 0.001)** DBP (mmHg) 0.062 (0.448) 0.058 (0.603) 0.085 (0.289) 0.152 (0.007)** FBG (mmol/L) -0.119 (0.141) -0.091 (0.409) 0.217 (0.006)** 0.181 (0.001)** FINS (mU/L) 0.019 (0.819) 0.017 (0.881) 0.071 (0.376) 0.152 (0.007)** HOMA-IR score 0.019 (0.817) 0.023 (0.833) 0.090 (0.259) 0.210 (< 0.001)** TG (mmol/L) 0.016 (0.844) 0.046 (0.675) 0.106 (0.184) 0.117 (0.039)* TC (mmol/L) 0.102 (0.206) 0.057 (0.605) 0.085 (0.286) 0.122 (0.031)* LDL-C (mmol/L) 0.042 (0.607) 0.020 (0.856) -0.032 (0.692) 0.021 (0.707) HDL-C (mmol/L) 0.167 (0.038)* 0.069 (0.532) 0.062 (0.439) 0.016 (0.772) AST (U/L) -0.004 (0.964) 0.076 (0.490) 0.035 (0.664) 0.061 (0.285) Urea (mmol/L) 0.200 (0.013)* 0.232 (0.033)* 0.236 (0.003)** 0.216 (< 0.001)** Cr (μmol/L) 0.111 (0.171) 0.172 (0.118) 0.298 (< 0.001)** 0.226 (< 0.001)** UA (μmol/L) 0.060 (0.461) 0.080 (0.471) 0.240 (0.002)** 0.206 (< 0.001)** Note.*P < 0.05; **P < 0.01. BMI, body mass index; WC, waist circumference; WHR, waist-hip ratio; SBP, systolic blood pressure; DBP, diastolic blood pressure; FBG, fasting blood glucose; FINS, fasting insulin; HOMA-IR, homeostasis model assessment estimate of insulin resistance; TG, triglycerides; TC, total cholesterol; LDL-C, low-density lipoprotein cholesterol; HDL-C, high-density lipoprotein cholesterol; AST, aspartate transaminase; Urea, urea nitrogen; Cr, creatinine; UA, uric acid. Furthermore, stepwise linear regression analysis was performed. As presented in Supplementary Table S1 (available in www.besjournal.com), serum Gpc4 levels were independently positively correlated with age (β = 0.125), gender (β = 0.353), FBG (β = 0.143), UA (β = 0.162), and Cr (β = 0.344) after adjusting for BMI, FAT%, WHR, SBP, FINS, TG, LDL-C, HDL-C, and AST in all subjects (all P < 0.05).
Table Supplementary Table S1. Stepwise Linear Regression Analysis of Independent Factors Associated with Serum Gpc4 Levels in All Subjects
Independent Factors Linear Regression Analysis P-value Nonstandard coefficient B (95% CI) Standard coefficient β constant 0.590 (0.165 to 1.014) 0.007 Age (year) 0.005 (0.001 to -0.009) 0.125 0.028 Gender 0.258 (0.155 to 0.360) 0.353 < 0.001 FBG (mmol/L) 0.054 (0.013 to 0.095) 0.143 0.010 UA (μmol/L) 0.001 (0 to 0.001) 0.162 0.018 Cr (μmol/L) 0.008 (0.004 to -0.012) 0.344 < 0.001 Note. Stepwise Linear regression analysis was used. Adjusted R2 was 0.168. FBG, fasting blood glucose; UA, uric acid; Cr, Creatinine. The subjects were stratified into three sections according to the Gpc4 tertiles between the MetS and control groups (lowest: < 2.131 ng/mL; median: 2.131-2.391 ng/mL; highest: ≥ 2.392 ng/mL). As shown in Table 3, the risk of MetS in participants with the highest serum Gpc4 levels was 1.74-fold higher than that in those with the lowest Gpc4 levels [Model 1, OR = 2.74, 95% CI 1.30-5.77, P < 0.05]. This increased probability of MetS risk still remained after adjusting for age, gender, address, education, activities, exercises, smoking, and alcohol consumption (Model 2, OR = 2.59, 95% CI 1.09-6.16, P < 0.05). The similar categorization of serum Gpc4 tertiles was also done between MetS and non-MetS subjects (lowest: < 2.108 ng/mL; median: 2.108-2.39 ng/mL; highest: ≥ 2.40 ng/mL). In consistent with the above results, the MetS risk of subjects with the highest serum Gpc4 levels was also higher than those with the lowest Gpc4 levels (Model 1, OR = 2.17, 95% CI 1.13-4.20, P < 0.05) and this phenomenon was still existed after further adjusting the same confounders (Model 2, OR = 2.16, 95% CI 1.06-4.40, P < 0.05).
Table 3. Unconditional Logistic Regression Analysis of MetS Risk According to Tertiles of Gpc4
Measurement Gpc4 Tertiles Lowest
OR (95% CI)Median
OR (95% CI)Highest
OR (95% CI)Gpc4 in MetS vs. Control group Range (ng/mL) < 2.131 ≥ 2.131 to < 2.392 ≥ 2.392 MetS/Controls 46/28 49/28 63/14 Model 1 1.000 1.065 (0.550-2.062) 2.739 (1.299-5.774) P 0.851 0.008 Model 2 1.000 0.784 (0.365-1.683) 2.587 (1.087-6.161) P 0.532 0.032 Age < 50 y 1.000 1.318 (0.597-2.906) 2.940 (1.132-7.636) P 0.494 0.027 Age ≥ 50 y 1.000 0.627 (0.182-2.164) 1.882 (0.526-6.739) P 0.461 0.331 Gpc4 in MetS vs. non-MetS group Range (ng/mL) < 2.108 ≥ 2.108 to < 2.399 ≥ 2.399 MetS/non-MetS 42/35 56/26 60/23 Model 1 1.000 1.795 (0.941-3.425) 2.174 (1.126-4.195) P 0.076 0.021 Model 2 1.000 1.847 (0.920-3.708) 2.164 (1.064-4.404) P 0.084 0.033 Gpc4 in non-MetS vs. Control group Range (ng/mL) < 2.062 ≥ 2.062 to < 2.289 ≥ 2.289 non-MetS/Controls 30/20 26/27 28/23 Model 1 1.000 0.642 (0.294-1.402) 0.812 (0.368-1.789) P 0.266 0.605 Model 2 1.000 0.353 (0.142-0.879) 0.547 (0.214-1.397) P 0.025 0.207 Note. Multivariate ORs and 95% CIs from unconditional logistic regression models were used in the analysis. Adjusted for age (≥ 50 y; < 50 y), gender (male; female), FBG (≥ 5.6 mmol/L; < 5.6 mmol/L), UA (male > 416 μmol/L or female > 357 μmol/L; male ≤ 416 μmol/L or female ≤ 357 μmol/L) and Cr (> 106 μmol/L; ≤ 106 μmol/L). Model 1: Unadjusted; Model 2: adjusted for Gender, age, address, education, exercise, activities, smoking, and alcohol consumption. Bold font indicates P < 0.05. Furthermore, the detailed logistic regression subgroup analysis between the tertiles of Gpc4 levels and the risk of MetS was further conducted in MetS and control groups after adjusting for age, gender, FBG, UA, and Cr, which were independent factors associated with serum Gpc4 levels. As depicted in Table 3, only age subgroup (age < 50 y and age ≥ 50 y) showed significant difference in the risk for MetS between MetS and control groups. The participants with the highest serum Gpc4 levels in age < 50 y subgroup was 1.94-fold higher than those with the lowest Gpc4 levels (P < 0.05).
Finally, all subjects were stratified into three sections according to the Gpc4 tertiles and the proportion of subjects with MetS in each tertile was calculated (lowest: < 2.107 ng/mL; median: 2.107-2.376 ng/mL; highest: ≥ 2.377 ng/mL). The trend Chi-square test P-value indicated that the proportion of subjects with MetS gradually increased from the lowest tertile to the highest tertile (lowest: 41.2%, median: 47.7%, and highest: 63.1%; P value for trend < 0.01).
Gpc4 is a newly adipokine identified in 2012[5]. Researchers have reported that Gpc4 is an insulin-sensitizing adipokine[5] that acts directly on insulin receptors and enhances insulin sensitivity. Serum Gpc4 levels are positively correlated with IR. Individuals with IR always have higher serum Gpc4 levels than controls[5]. Serum Gpc4 levels were significantly higher in European women with polycystic ovary syndrome (PCOS) than those in the controls[10]. Meanwhile, compared with controls, increased Gpc4 levels were observed in Asian women with nonalcoholic fatty liver disease (NAFLD), which is now regarded as a hepatic manifestation of metabolic syndrome[7]. Furthermore, in obese Asian children, serum Gpc4 levels also significantly increased with increasing degrees of obesity[11]. Our previous study also found that circulation Gpc4 levels were significantly increased in obesity patients with IR[8]. In agreements with the increasing Gpc4 levels in metabolic-related diseases including PCOS, NAFLD, IR, and obesity, our results for the first time demonstrated that serum Gpc4 levels were significantly increased in MetS subjects compared with
controls and non-MetS subjects. In addition, the constituent ratio of MetS increased in participants with the highest Gpc4 levels compared with those with the lowest Gpc4 levels. Importantly, our results showed that the MetS risk was significantly higher in subjects with the highest Gpc4 levels than those with the lowest serum Gpc4 levels. This phenomenon was observed not only between MetS and control groups, but also between MetS and non-MetS groups. Furthermore, the logistic regression subgroup analysis showed that this increased probability of MetS risk presented more pronounced in subjects with age < 50 y. All these finding imply that the increased serum Gpc4 levels may be an independent risk factor for MetS in the Chinese Han Population.
In our current study, we found that circulating Gpc4 levels were positively associated with FBG, FINS, and HOMA-IR score and independently correlated with FBG in all subjects. In line with our result, Yoo et al.[7] found that serum Gpc4 levels had positive associations with FBG and HOMA-IR levels in Asian women with or without NAFLD. Jedrzejuk et al.[10] found that the serum Gpc4 concentration had significant positive correlation with FINS and HOMA-IR levels in 62 European women with PCOS and was positively associated with FBG, FINS, and HOMA-IR score in 43 controls. Our previous study also demonstrated that serum Gpc4 levels had a significant positive relationship with FINS and HOMA-IR levels in 38 normal controls and 170 obese subjects with different glucose metabolism statuses[8]. However, Li et al. found that Gpc4 is negatively correlated with FBG and glycated hemoglobin A1c (HbA1c) in 300 Chinese volunteers, including 103 subjects with type 2 diabetes mellitus (T2DM), 92 subjects with impaired glucose tolerance (IGT), and 105 healthy controls[12]. These studies indicate that serum Gpc4 levels was closely linked with glucose metabolism related parameters and may play a vital role in the development of glucose metabolism disorders.
In the present study, serum Gpc4 levels were also found to be positively associated with TG and TC. In agreement with our result, Yoo et al.[7] found that circulating Gpc4 levels were significantly positively associated with TG in Asian women. Leelalertlauw et al. reported that serum Gpc4 levels were positively associated with TC, HDL-C, and LDL-C after adjusting for age in 370 overweight and obese Asian children aged 6 to 18y[12]. Our previous study reported that serum Gpc4 levels were also positively associated with TC and LDL-C and negatively associated with HDL-C in males[8]. These results, together with the findings from Ussar et al. who reported that Gpc4 originates from adipocytes and participates in the adipocyte differentiation[5], indicate that Gpc4 may involve with the metabolism of lipids. In addition, our study showed that serum Gpc4 levels were positively correlated with SBP and DBP in all subjects. Our previous study[8] also found that serum Gpc4 levels were positively correlated with SBP in 170 obese patients with different glucose metabolism statuses and 38 normal controls and positively associated with DBP in males. All these findings provide more evidence for the tight associations of Gpc4 with the components of MetS.
More interestingly, we found that Gpc4 was significantly and positively correlated with age. Lee et al.[13] also founded that age was independently and positively associated with serum Gpc4 levels in 152 patients with T2DM. The explanation may be that the MetS risk increases with age, which needs further studies to be elucidated.
In conclusion, our results demonstrated for the first time that serum Gpc4 concentrations were significantly increased in MetS patients compared with the controls. Gpc4 was positively associated with some metabolic-related parameters. The subjects with the highest Gpc4 levels were more likely to have MetS. Further studies are needed to explore the detailed mechanisms by which Gpc4 is involved in MetS development in larger samples and other ethnic populations.
The authors declare that no potential conflicts of interest exist. We thank all the staff and researchers in the China National Health Survey (CNHS) Study.
doi: 10.3967/bes2019.052
Serum Glypican 4 Levels Are Associated with Metabolic Syndrome in a Han Population from Guizhou Province, China
-
-
Table 1. Clinical and Biochemical Characteristics of all Subjects
Variable Control Group (n = 70) Non-MetS Group (n = 84) MetS Group (n = 158) P-value Age (year) 47.8 ± 8.6 47.6 ± 10.4 49.3 ± 9.0 0.306 Gender (M/F) 37/33 33/51 62/96 0.128 BMI (kg/m2) 21.4 ± 2.7 26.7 ± 2.3a 27.3 ± 2.6a < 0.001 FAT (%) 23.4 ± 8.0 33.3 ± 6.0a 34.3 ± 6.3a < 0.001 WC (cm) 72.5 ± 7.8 89.3 ± 6.2a 91.4 ± 6.9ab < 0.001 WHR 0.86 ± 0.06 0.96 ± 0.06a 0.98 ± 0.05ab < 0.001 SBP (mmHg) 115 ± 9 127 ± 17a 141 ± 18ab < 0.001 DBP (mmHg) 70 ± 8 78 ± 10a 86 ± 11ab < 0.001 FBG (mmol/L) 4.75 ± 0.40 4.94 ± 0.56a 5.56 ± 1.15ab < 0.001 FINS (mU/L) 4.93 (3.38-6.66) 8.79 (5.81-11.70)a 10.52 (7.41-14.29)a < 0.001 HOMA-IR score 1.06 (0.68-1.51) 1.95 (1.33-2.51)a 2.40 (1.68-3.45)ab < 0.001 TG (mmol/L) 0.92 (0.74-1.20) 1.19 (0.95-1.55)a 2.50 (1.88-3.60)ab < 0.001 TC (mmol/L) 4.77 ± 0.87 5.01 ± 0.88 5.31 ± 1.16ab 0.001 LDL-C (mmol/L) 2.69 ± 0.73 1.46 ± 0.27 3.06 ± 0.78 0.002 HDL-C (mmol/L) 1.62 ± 0.28 3.02 ± 0.73a 1.24 ± 0.27ab < 0.001 AST (U/L) 20.50 (16.00-24.00) 22.00 (19.00-28.00)a 25.00 (19.00-30.25)a < 0.001 Urea (mmol/L) 4.99 ± 1.44 4.68 ± 1.22 4.83 ± 1.30 0.348 Cr (μmol/L) 71.87 ± 13.52 71.40 ± 14.94 72.71 ± 16.31 0.806 UA (μmol/L) 278.99 ± 84.72 303.94 ± 89.12 349.09 ± 95.56ab < 0.001 Gpc4 (ng/mL) 2.24 ± 0.28 2.22 ± 0.33 2.35 ± 0.40ab 0.010 Age < 50 y 2.21 ± 0.27 2.18 ± 0.31 2.30 ± 0.35b 0.052 Age ≥ 50 y 2.33 ± 0.28 2.31 ± 0.35 2.43 ± 0.45 0.329 Note. Values are expressed as the mean ± SD or median (interquartile Range). BMI, body mass index; WC, waist circumference; WHR, waist-hip ratio; SBP, systolic blood pressure; DBP, diastolic blood pressure; FBG, fasting blood glucose; FINS, fasting insulin; HOMA-IR, homeostasis model assessment estimate of insulin resistance; TG, triglycerides; TC, total cholesterol; LDL-C, low-density lipoprotein cholesterol; HDL-C, high-density lipoprotein cholesterol; AST, aspartate transaminase; Urea, urea nitrogen; Cr, Creatinine; UA, uric acid; Gpc4, Glypican 4. The P-value column is the result of comparison among the three groups. aP < 0.05 compared with the control group; bP < 0.05 compared with the non-MetS group. Bold font indicates P < 0.01.  下载: 导出CSV
Table 2. Bivariate Correlation Between Serum Gpc4 Levels and Other Parameters
Gpc4 r (P-value) Control Group Non-MetS Goup MetS Group All Subjects Age (year) 0.196 (0.015)* 0.138 (0.210) 0.253 (0.001)** 0.235 (< 0.001)** Gender 0.010 (0.902) 0.037 (0.738) 0.049 (0.545) 0.042 (0.463) BMI (kg/m2) -0.090 (0.268) -0.045 (0.681) 0.020 (0.806) 0.044 (0.440) FAT (%) -0.037 (0.647) 0.008 (0.945) 0.070 (0.382) 0.073 (0.200) WC (cm) -0.043 (0.597) 0.041 (0.711) 0.035 (0.659) 0.075 (0.186) WHR 0.008 (0.924) 0.062 (0.576) 0.002 (0.806) 0.082 (0.149) SBP (mmHg) 0.101 (0.212) 0.121 (0.275) 0.207 (0.009)** 0.228 (< 0.001)** DBP (mmHg) 0.062 (0.448) 0.058 (0.603) 0.085 (0.289) 0.152 (0.007)** FBG (mmol/L) -0.119 (0.141) -0.091 (0.409) 0.217 (0.006)** 0.181 (0.001)** FINS (mU/L) 0.019 (0.819) 0.017 (0.881) 0.071 (0.376) 0.152 (0.007)** HOMA-IR score 0.019 (0.817) 0.023 (0.833) 0.090 (0.259) 0.210 (< 0.001)** TG (mmol/L) 0.016 (0.844) 0.046 (0.675) 0.106 (0.184) 0.117 (0.039)* TC (mmol/L) 0.102 (0.206) 0.057 (0.605) 0.085 (0.286) 0.122 (0.031)* LDL-C (mmol/L) 0.042 (0.607) 0.020 (0.856) -0.032 (0.692) 0.021 (0.707) HDL-C (mmol/L) 0.167 (0.038)* 0.069 (0.532) 0.062 (0.439) 0.016 (0.772) AST (U/L) -0.004 (0.964) 0.076 (0.490) 0.035 (0.664) 0.061 (0.285) Urea (mmol/L) 0.200 (0.013)* 0.232 (0.033)* 0.236 (0.003)** 0.216 (< 0.001)** Cr (μmol/L) 0.111 (0.171) 0.172 (0.118) 0.298 (< 0.001)** 0.226 (< 0.001)** UA (μmol/L) 0.060 (0.461) 0.080 (0.471) 0.240 (0.002)** 0.206 (< 0.001)** Note.*P < 0.05; **P < 0.01. BMI, body mass index; WC, waist circumference; WHR, waist-hip ratio; SBP, systolic blood pressure; DBP, diastolic blood pressure; FBG, fasting blood glucose; FINS, fasting insulin; HOMA-IR, homeostasis model assessment estimate of insulin resistance; TG, triglycerides; TC, total cholesterol; LDL-C, low-density lipoprotein cholesterol; HDL-C, high-density lipoprotein cholesterol; AST, aspartate transaminase; Urea, urea nitrogen; Cr, creatinine; UA, uric acid.
下载: 导出CSV
Supplementary Table S1. Stepwise Linear Regression Analysis of Independent Factors Associated with Serum Gpc4 Levels in All Subjects
Independent Factors Linear Regression Analysis P-value Nonstandard coefficient B (95% CI) Standard coefficient β constant 0.590 (0.165 to 1.014) 0.007 Age (year) 0.005 (0.001 to -0.009) 0.125 0.028 Gender 0.258 (0.155 to 0.360) 0.353 < 0.001 FBG (mmol/L) 0.054 (0.013 to 0.095) 0.143 0.010 UA (μmol/L) 0.001 (0 to 0.001) 0.162 0.018 Cr (μmol/L) 0.008 (0.004 to -0.012) 0.344 < 0.001 Note. Stepwise Linear regression analysis was used. Adjusted R2 was 0.168. FBG, fasting blood glucose; UA, uric acid; Cr, Creatinine.
下载: 导出CSV
Table 3. Unconditional Logistic Regression Analysis of MetS Risk According to Tertiles of Gpc4
Measurement Gpc4 Tertiles Lowest
OR (95% CI)Median
OR (95% CI)Highest
OR (95% CI)Gpc4 in MetS vs. Control group Range (ng/mL) < 2.131 ≥ 2.131 to < 2.392 ≥ 2.392 MetS/Controls 46/28 49/28 63/14 Model 1 1.000 1.065 (0.550-2.062) 2.739 (1.299-5.774) P 0.851 0.008 Model 2 1.000 0.784 (0.365-1.683) 2.587 (1.087-6.161) P 0.532 0.032 Age < 50 y 1.000 1.318 (0.597-2.906) 2.940 (1.132-7.636) P 0.494 0.027 Age ≥ 50 y 1.000 0.627 (0.182-2.164) 1.882 (0.526-6.739) P 0.461 0.331 Gpc4 in MetS vs. non-MetS group Range (ng/mL) < 2.108 ≥ 2.108 to < 2.399 ≥ 2.399 MetS/non-MetS 42/35 56/26 60/23 Model 1 1.000 1.795 (0.941-3.425) 2.174 (1.126-4.195) P 0.076 0.021 Model 2 1.000 1.847 (0.920-3.708) 2.164 (1.064-4.404) P 0.084 0.033 Gpc4 in non-MetS vs. Control group Range (ng/mL) < 2.062 ≥ 2.062 to < 2.289 ≥ 2.289 non-MetS/Controls 30/20 26/27 28/23 Model 1 1.000 0.642 (0.294-1.402) 0.812 (0.368-1.789) P 0.266 0.605 Model 2 1.000 0.353 (0.142-0.879) 0.547 (0.214-1.397) P 0.025 0.207 Note. Multivariate ORs and 95% CIs from unconditional logistic regression models were used in the analysis. Adjusted for age (≥ 50 y; < 50 y), gender (male; female), FBG (≥ 5.6 mmol/L; < 5.6 mmol/L), UA (male > 416 μmol/L or female > 357 μmol/L; male ≤ 416 μmol/L or female ≤ 357 μmol/L) and Cr (> 106 μmol/L; ≤ 106 μmol/L). Model 1: Unadjusted; Model 2: adjusted for Gender, age, address, education, exercise, activities, smoking, and alcohol consumption. Bold font indicates P < 0.05.
下载: 导出CSV
-
[1] Sung KC, Rhee EJ, Ryu S, et al. Increased Cardiovascular Mortality in Subjects With Metabolic Syndrome Is Largely Attributable to Diabetes and Hypertension in 159, 971 Korean Adults. J Clin Endocrinol Metab, 2015; 100, 2606-12. doi: 10.1210/jc.2014-4031 [2] Lu J, Wang L, Li M, et al. Metabolic Syndrome Among Adults in China:The 2010 China Noncommunicable Disease Surveillance. J Clin Endocrinol Metab, 2017; 102, 507-15. [3] Ouchi N, Parker JL, Lugus JJ, et al. Adipokines in inflammation and metabolic disease. Nat Rev Immunol, 2011; 11, 85-97. doi: 10.1038/nri2921 [4] Watanabe K, Yamada H, Yamaguchi Y. K-glypican:a novel GPI-anchored heparan sulfate proteoglycan that is highly expressed in developing brain and kidney. J Cell Biol, 1995; 130, 1207-18. http://d.old.wanfangdata.com.cn/Periodical/sygzbzz201305007 [5] Ussar S, Bezy O, Bluher M, et al. Glypican-4 enhances insulin signaling via interaction with the insulin receptor and serves as a novel adipokine. Diabetes, 2012; 61, 2289-98. doi: 10.2337/db11-1395 [6] Tamori Y, Kasuga M. Glypican-4 is a new comer of adipokines working as insulin sensitizer. J Diabetes Investig, 2013; 4, 250-1. doi: 10.1111/jdi.2013.4.issue-3 [7] Yoo HJ, Hwang SY, Cho GJ, et al. Association of glypican-4 with body fat distribution, insulin resistance, and nonalcoholic fatty liver disease. J Clin Endocrinol Metab, 2013; 98, 2897-901. doi: 10.1210/jc.2012-4297 [8] Zhu HJ, Pan H, Cui Y, et al. The changes of serum glypican4 in obese patients with different glucose metabolism status. J Clin Endocrinol Metab, 2014; 99, E2697-701. doi: 10.1210/jc.2014-2018 [9] Alberti KG, Zimmet P, Shaw J. The metabolic syndrome——a new worldwide definition. Lancet, 2005; 366, 1059-62. doi: 10.1016/S0140-6736(05)67402-8 [10] Jedrzejuk D, Lwow F, Kuliczkowska-Plaksej J, et al. Association of serum glypican-4 levels with cardiovascular risk predictors in women with polycystic ovary syndrome-a pilot study. Gynecol Endocrinol, 2016; 32, 223-6. doi: 10.3109/09513590.2015.1110137 [11] Li K, Xu X, Hu W, et al. Glypican-4 is increased in human subjects with impaired glucose tolerance and decreased in patients with newly diagnosed type 2 diabetes. Acta Diabetol, 2014; 51, 981-90. doi: 10.1007/s00592-014-0652-5 [12] Leelalertlauw C, Korwutthikulrangsri M, Mahachoklertwattana P, et al. Serum glypican 4 level in obese children and its relation to degree of obesity. Clin Endocrinol (Oxf), 2017; 87, 689-95. doi: 10.1111/cen.2017.87.issue-6 [13] Lee SA, Koh G, Cho SJ, et al. Correlation of Glypican-4 Level with Basal Active Glucagon-Like Peptide 1 Level in Patients with Type 2 Diabetes Mellitus. Endocrinol Metab (Seoul), 2016; 31, 439-45. doi: 10.3803/EnM.2016.31.3.439 -

 点击查看大图
图(1) / 表ll (4)
计量
- 文章访问数: 2044
- HTML全文浏览量: 552
- PDF下载量: 85
- 被引次数: 0

 Quick Links