

 下载:
下载:


-
Developments in economy and acceleration of urbanization combined with population aging in China over the last 30 years have resulted in a dramatic increase in the risk of cardiovascular disease (CVD). Annual cardiovascular events are predicted to show a > 50% increase from 2010 to 2030. Changes in serum lipids and lipoproteins are a well-established risk factor for CVD morbidity and mortality. Dyslipidemia is characterized by increased levels of blood total cholesterol (TC), triglycerides (TG), and low-density lipoprotein cholesterol (LDL-c) and decreased levels of high-density lipoprotein cholesterol (HDL-c). Many studies have demonstrated that non-HDL-c levels and some lipid-related ratios, such as TC/HDL-c, TG/HDL-c, and LDL-c/HDL-c, exert greater influences on the morbidity and severity of coronary heart disease (CHD) than individual lipid and lipoprotein concentrations. Therefore, diagnosing and preventing CHD by analyzing these indicators is meaningful. However, little national information has been reported on the trends of non-HDL-c and lipid ratio levels among the Chinese population. Given the very low usage of cholesterol-lowering medication and high morbidity of CVD in China, investigating the status of dyslipidemia in the country is an important undertaking.
The criteria for dyslipidemia have been modified several times over the last 20 years; thus, reanalyzing national lipid profiles and the prevalence of dyslipidemia with the same criteria and standard population data is necessary. In the present study, we aimed to investigate whether the trends of lipid profiles and dyslipidemia prevalence differ among regions, genders, and age groups in China.
-
The study data were obtained from three nationwide cross-sectional surveys, namely, the Chinese Adults Nutrition and Chronic Diseases Surveillance in 2015 (CANCDS2015), Chinese Nutrition and Health Surveillance in 2010 (CNHS2010), and the Chinese Nutrition and Health Survey in 2002 (CNHS2002). The three surveys were conducted in 31 provinces, autonomous regions, and municipalities directly under the central government throughout China (except Taiwan, Hong Kong, and Macau). A stratified multistage cluster sampling method was used.
In the 2002 survey, the country was divided into six strata (large cities, medium and small cities, class 1-4 rural areas) based on geographic characteristics, economy, and social development information provided by the China National Bureau of Statistics and the China Ministry of Health Statistics. The first stage of sampling involved a random selection of 22 districts (urban) or counties (rural) from the six strata. In the second stage, random selection of three neighborhoods (urban) or townships (rural) from each of the selected districts/counties was conducted; two residential committees (urban) or villages (rural) were then randomly selected from each of the neighborhoods or townships. Thirty households were randomly sampled from each neighborhood committee or village.
In the 2010 survey, a multistage stratified with proportional to the population cluster random sampling method was conducted at 150 survey sites of four types, including 34 large cities, 41 medium and small cities, 45 general rural areas, and 30 poor rural areas, according to economy and social development. Random sample selection of six neighborhood committees (urban) or villages (rural) equal to the proportion of the local population was conducted. Thirty households were randomly sampled from each neighborhood committee or village.
The 2015 survey was based on the national mortality surveillance system. Multistage stratified cluster random sampling was conducted in 302 surveillance sites of eight strata according to the proportion of the urban population (high/low), overall population size (high/low), and mortality rate (high/low). The first stage of sampling involved systematic sampling of population size ranking of three towns (streets or regiments). In the second stage of sampling, two villages (neighborhood committee or company) in each town were randomly selected by systematic sampling of population size ranking. In the third stage, 45 households were randomly sampled in each community or village. All three surveys were approved by the Ethical Committee of the Chinese Center for Disease Control and Prevention, and all participants provided written informed consent.
-
Similar survey questionnaires and fasting blood measurements were conducted all in studies. A standard questionnaire was conducted by face-to-face interviews at the participants' home, and anthropometric measurements were measured at a community health center; both activities were conducted by trained staff. The questionnaire included general demographic information, such as age, education level, marital status, income, and lifestyle behaviors, including smoking and alcohol consumption. An overnight fasting blood sample was collected by qualified nurses by venipuncture from the antecubital vein before breakfast. Samples were allowed to stand for 30-60 minutes and then centrifuged at 1, 500 rpm for 10 minutes. The centrifuged serum samples were transported to a laboratory and stored at -80 ℃. The blood collection procedure, processing, and determination were identical in the three surveys. Serum TC, LDL-c, HDL-c, and TG were measured by a Hitachi 7600 automatic biochemical analyzer (Hitachi Inc., Tokyo, Japan) with reagents obtained from Wako Pure Chemical Industries Ltd. (Tokyo, Japan) at the central laboratory of the Beijing CDC and National Institute for Nutrition and Health, China CDC. Non-HDL-c was calculated by the equation TC − HDL-c. According to the guidelines of Chinese adult dyslipidemia prevention and treatment (2016 revised edition), a serum TC concentration greater than 6.22 mmol/L (240 mg/dL) is considered hypercholesterolemia, TG greater than 2.26 mmol/L (200 mg/dL) is considered hypertriglyceridemia, LDL-c greater than 4.14 mmol/L (160 mg/dL) is considered high LDL-c, and HDL-c lower than 1.04 mmol/L (40 mg/dL) is considered low HDL-c.
-
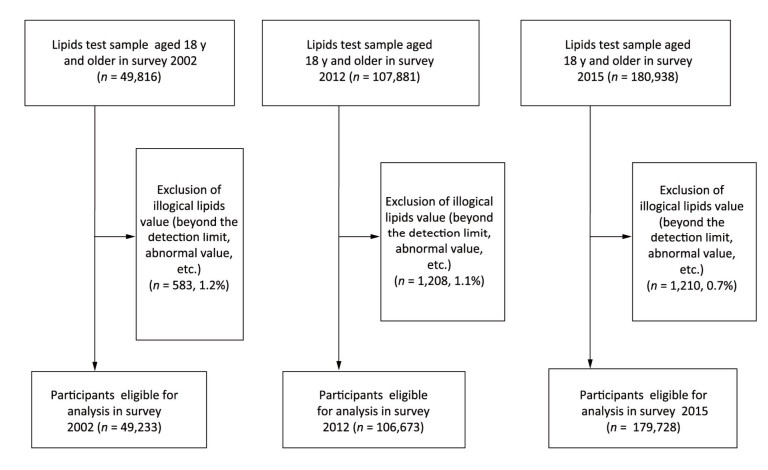
In these surveys, participants aged 18 years and above and who were healthy and able to walk freely to the survey location were included in the survey. Those with missing values of basic demographic information, lysed blood samples, or samples with missing or illogical data were excluded following unified data cleansing rules. Figure 1 showed the flow diagram summarizing the three surveys.
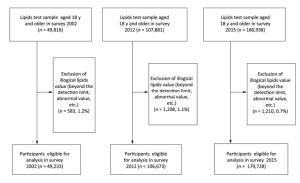
Figure 1. Flow diagram summarizing the study population.
-
All data in the three surveys were collected using specialized software, and data analyses were performed using SAS (Statistical Analysis System) for Windows v9.3.2 (SAS Institute, Cary, NC, USA). As the age, gender, and district distribution of the Chinese population differed among the years 2002, 2010, and 2015, a sampling weight was assigned to each participant based on the study design. During analysis of the prevalence of dyslipidemia and mean levels of lipids, we calculated standardized age and gender values, respectively, based on the 2010 national census data. Specifically, weighted serum TC, TG, HDL-c, and LDL-c, lipid-related ratios, and the prevalence of dyslipidemia in all three surveys were adjusted by using data from the sixth census of the National Bureau of Statistics conducted in 2010. The PROC SURVEYMEANS and PROC SURVEYFREQ procedures in SAS were used to calculate means and proportions, and 95% confidence intervals (95% CIs) were used to reflect the complex sampling design and weights of these surveys, as well as provide nationally representative estimates. A general linear model was used to estimate P for the trend of mean level of lipid profiles, and the chi-squared test was used to calculate P for the trend of prevalence of dyslipidemia. Bilateral P-values < 0.05 were considered statistically significant.
-
Table 1 shows the demographic characteristics of participants in the three surveys. The final sample sizes were 49, 233 in the 2002 survey (16, 828 in urban areas; 32, 405 in rural areas), 106, 673 in the 2010 survey (54, 016 in urban areas; 52, 657 in rural areas), and 179, 728 (73, 443 in urban areas; 106, 285 in rural area) in the 2015 survey. No statistical difference in genders was found among the three surveys.
Table 1. Demographic Characteristic Information of Participants in 2002, 2010, and 2015

In the 2002 survey, the mean age was 45.3 years (47.4 years in urban areas; 44.2 years in rural areas). Participants of Han descent accounted for 90.0% of the population (94.7% of the population in urban areas; 87.6% of the population in rural areas). Most participants completed junior or senior high school in urban areas; in rural areas, 50.2% of the participants attended primary school or below and only 2.6% had gone to college or above. The annual income of most participants was below 5, 000 RMB (44.7% in urban areas; 85.3% in rural areas).
The mean age in the 2010 survey was 52.0 years (50.5 years in urban areas; 52.3 years in rural areas) while that in the 2015 survey was 52.2 years (52.3 years in urban areas; 52.1 years in rural areas). An increasing trend of age was observed in the three surveys (P < 0.001). The number of participants with higher education levels and annual income significantly increased over the years (P < 0.001).
The total proportion of smokers was 26.6% (24.3% in urban areas; 27.7% in rural areas) in 2002, but no trend of smoking was observed among the three surveys. A significant decreasing trend of total proportion of drinkers from 22.3% in 2002 (23.1% in urban areas; 21.9% in rural areas) to 24.5% in 2010 (23.6% in urban area; 25.5% in rural areas) and then to 19.2% in 2015 (17.7% in urban areas; 20.0% in rural areas) (P < 0.001) was noted. By contrast, mean BMI showed a significant increasing trend from 23.2 kg/m2 in 2002 to 23.9 kg/m2 in 2010 and then to 24.2 kg/m2 in 2015 (P < 0.001). The proportions of low body weight (< 18.5 kg/m2), normal weight (18.5-23.9 kg/m2), overweight (24.0-27.9 kg/m2), and obese (≥ 28.0 kg/m2) participants significantly differed among the surveys (P < 0.001). Although the number of participants who had taken lipid control measures significantly increased from 2.4% in 2002 to 4.6% in 2010 and then to 4.5 in 2015 (P < 0.001), the overall proportion was still very low.
The trends of weighted adjustment Measurement of lipid control of lipid profiles among Chinese adults are demonstrated in Table 2. Total mean TC level and their 95% CIs significantly increased from 3.93 (3.87-3.99) mmol/L in 2002 to 4.59 (4.54-4.63) mmol/L in 2010 and then to 4.63 (4.59-4.67) mmol/L in 2015 (P < 0.001). Mean TG levels and their 95% CIs also significantly increased from 1.12 (1.10-1.15) mmol/L to 1.41 (1.39-1.44) mmol/L and then to 1.47 (1.45-1.50) mmol/L. However, mean HDL-c levels and their 95% CIs significantly decreased from 1.30 (1.28-1.31) mmol/L to 1.18 (1.16-1.20) mmol/L and then to 1.26 (1.24-1.27) mmol/L. Mean LDL-c levels and 95% CIs significantly increased from 2.12 (2.08-2.17) mmol/L to 2.78 (2.75-2.82) mmol/L and then to 2.87 (2.84-2.90) mmol/L (P < 0.001). Between the 2002 and 2010 surveys, mean levels of lipids, such as TC, TG and LDL-c, were higher in urban areas than in rural areas, but HDL-c concentrations were similar. However, in the 2015 surveys, TG and LDL-c levels were higher in urban areas than in rural areas; moreover, TC levels between urban and rural areas differed but HDL-c levels were higher in rural areas than in urban area. TG levels were much higher in males than in females in all three surveys. Increasing trends of TC, TG, and LDL-c levels were observed in males from 2002 to 2015; in females, the change in HDL-c was not significant. TC, TG, and LDL-c levels almost increased significantly with increasing age; in the 75-year-old group, a slight fluctuation of HDL-c level with no significant difference was observed during the period. Longitudinally, regardless of area, gender, or BMI, TC, TG, and LDL-c levels consistently increased whereas HDL-c levels decreased from 2002 to 2015 (P < 0.001). Weighted adjusted means of non-HDL-c levels in Table 3 showed an increasing trend in all age groups and both genders. An increasing trend of mean non-HDL-c levels was observed in urban and rural areas from 2002 to 2015. Similarly, the ratios of TC/HDL-c, TG/HDL-c, and LDL-c/HDL-c showed increasing trends among all genders, districts, ages, and BMIs (P < 0.001).
Table 2. Lipids Profiles among Participants in Survey 2002, 2010, and 2015 [mean (95% CI)]

Table 3. Non-HDL-c and Lipid-related Ratios among Participants in Survey 2002, 2010, and 2015 [mean (95% CI)]

Figure 2 shows the prevalence of dyslipidemia among Chinese adults from 2002 to 2015. The total weighted adjusted prevalence of hypercholesterolemia was 1.6% (95% CI: 1.3%-1.8%) in 2002, increased to 5.6% (95% CI: 5.1%-6.1%) in 2010, and then increased to 5.8% (95% CI: 5.3%-6.3%) in 2015 (P for trend < 0.001). Hypertriglyceridemia prevalence dramatically increased from 5.7% (95% CI: 5.1%-6.3%) to 13.6% (95% CI: 12.9%-14.2%) and then to 15.0% (95% CI: 14.3%-15.7%). Low HDL-c prevalence changed remarkably over these years, increasing from 18.8% (95% CI: 17.0%-20.6%) to 35.5% (95% CI: 33.3%-37.6%) and then to 24.9% (95% CI: 23.5%-26.4%). Similarly, LDL-c prevalence increased from 1.3% to 5.6% and then to 7.2% over the 13-year interval. Among urban and rural participants, the prevalence of hypercholesterolemia were much higher in the former than in the latter in the 2002 and 2010 surveys; however, in 2015, hypercholesterolemia prevalence was slightly higher in rural areas than in urban areas. Furthermore, in 2002, hypercholesterolemia prevalence was higher in females than in males, and it increased from 0.7% in the 18-year-old group to 3.4% in the 65-year-old group but then decreased to 2.7% in the 75-year-old group. Similar distributions of hypercholesterolemia were observed in the 2010 and 2015 surveys. From a longitudinal perspective, the prevalence of hypercholesterolemia from 2002 to 2015 remarkably increased in rural areas from 1.0% to 4.4% and then to 6.2%; interestingly, however, this prevalence in urban areas increased from 2.0% to 6.3% but then declined to 5.3%. About high LDL-c similar results with hypercholesterolemia was observed in both urban and rural areas, as well as in all genders, age groups, and BMI groups. However, hypertriglyceridemia prevalence was higher in males than in females, higher in urban areas than in rural areas, and higher in middle-aged adults than in their elderly counterparts. Longitudinally, an increasing trend of hypertriglyceridemia prevalence could be observed from 2002 to 2015. Low HDL-c prevalence was much higher in the dyslipidemia type. Moreover, HDL-c prevalence was higher in rural areas than in urban areas in 2002, while this prevalence was similar between areas in 2010 and then higher in urban areas than in rural areas in 2015. Interestingly, in the age groups of 55 years and above, the trends of low HDL-c prevalence were not statistically significant among the three survey years.
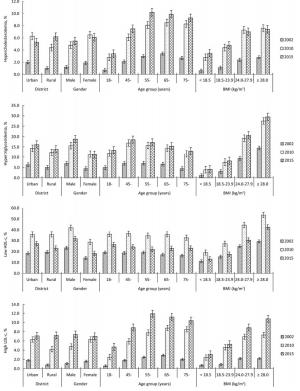
Figure 2. Prevalence of dyslipidemia among participants in survey 2002, 2010, and 2015.
-
In this study, blood lipid data from three nationally representative surveys were analyzed. We found that dyslipidemia increased rapidly from 2002 to 2015. However, slight differences in trend among areas, genders, ages, and BMI were found. Due to differences in geographical distribution and lifestyle in China, some gap in public health services and strategies for the prevention and control of chronic diseases remain between urban and rural areas. Urban residents are more likely to develop healthy living habits than their rural counterparts to reduce the risk-factors of CVDs. As rural residents become more affluent, they may develop unhealthy lifestyle behaviors and psychosocial problems. Urbanization of China may bring about great challenge to the country's CVD burden.
Declining TC and LDL-c levels have been reported in some developed countries, such as the United States of America (USA) and Japan, as well as in a number of European countries. Data from the USA show mean levels of TC, TG, LDL-c, and non-HDL-c higher than those in China, although TC, TG, and non-HDL-c levels reveal a decreasing trend whereas mean HDL-c levels reveal a linear increase. These favorable trends of lipids and lipoproteins may generally be attributed to the consistent use of lipid-lowering medication. A study conducted in Kuwait from 1998 to 2009 showed an increasing trend until 2006-2007 (56.0% in males and 53.6% in females) except in 2002-2003, after which a significant decline was recorded for in both genders (33.7% of men; 30.6% of women). Studies conducted in other Asia-Pacific and Middle Eastern regions, such as Tehran and Pakistan, also show similar trends. A favorable trend of all lipid components was observed in Tehran adults after two decades of follow-up; such improvements were attributed to the increased use of lipid-lowering medication and wider knowledge of the adverse influence of hydrogenated oil. In Pakistan, low HDL-c (17.2%) and Hypertriglyceridemia (11.2%) are the most prevalent form of dyslipidemia, similar to the Chinese population. Because of the inconspicuous symptoms of dyslipidemia, as well as their lack of knowledge, survey participants in China tended not to actively test for blood lipids until their cardiovascular system had been damaged. Considering that high lipids level and maintained dyslipidemia are significant risk factors for CHD events, it will be much more severe in CVD burden especially in China.
In contrast to other Western countries, low HDL-c is the major subtype of dyslipidemia in China, likely due to the carbohydrate-dominant diet of the country and related increases in obesity and diabetes. This study found that the prevalence of low HDL-c in males is much higher than that in females, although similar trends of prevalence of low HDL-c were noted in both genders over the 13-year period considered in this work. The changes in HDL-c levels and low-HDL-c prevalence observed in this study may be attributed to changes in lifestyle. Besides genetic factors, some drugs, obesity, inactivity, cigarette smoking, and long-term heavy drinking are known to contribute to decreased serum HDL-c levels; a poly-unsaturated fat-rich or low-carbohydrate diet may improve these levels. The proportion of total fat in total calories increased but carbohydrate intake decreased in Chinese men, and the rate of physical activity with more than moderate degree showed a decreasing trend within the period. Undesirable lifestyle behaviors, such as smoking and alcohol consumption, in combination with decreased physical activity, can also elevate TC, LDL-c and TG levels. Study reported that heavier cigarette smoking leads to significantly higher TG and lower HDL-c levels; thus, cessation of smoking could benefit normal lipid maintenance. Although moderate alcohol drinking may increase HDL-c levels, such consumption is not generally recommended as a protective factor for dyslipidemia on account of its potential risk to health. Inactive lifestyles increase plasma insulin levels, insulin resistance, the waist circumference, and visceral fat and decrease adiponectin levels. Obesity, which increases cardiovascular risk by increasing plasma triglycerides and promoting high LDL-c and low HDL-c, is also common among the middle-aged and older population. These lipid abnormalities are typical features of metabolic syndrome.
As the second most common dyslipidemic abnormality, hypertriglyceridemia is widely prevalent, especially in China. Elevated plasma TG levels often lead to both LDL-c and HDL-c metabolic disorders, and it is a strong risk factor for the development of atherosclerotic CVD. A one standard deviation increase in log-transformed blood TG concentration has been associated with a 20% increase in CHD. In the present study, TG levels and hypertriglyceridemia among residents living in urban and rural communities linearly increased over the years. However, low TG levels and hypertriglyceridemia were more prevalent in females than in males, in accordance with findings in previous studies. This difference in gender may be attributed to the increased participation of women in healthy lifestyle activities and a greater awareness of health in this gender. Therefore, health programs promoting dyslipidemia awareness among males could be implemented.
Interesting trends of lipids and dyslipidemia among the elderly, especially in the age group of 75 years and above, were noted over the survey years. TC, TG, LDL-c, and non-HDL-c levels, as well as dyslipidemia, increased from the younger- to the middle-aged subgroups but then decreased in the 75-years-and-above subgroup. As age increases, basal metabolism slows down and calorie intake is stored as fat in the body. Increased use of medication for chronic diseases among older participants may have also influenced the decreasing level of lipids found. Lipid prevention and control in the elderly is complicated, and further studies are needed. Statins are regarded as effective drugs for lowering blood lipids, and several large studies have confirmed the efficacy and safety of statins in the primary or secondary prevention of CHD. The use of statins for hypercholesterolemia has been attempted in clinical trials in Japan and Korea; indeed, many clinical trials on statins have also been conducted in China. However, in epidemic studies, the treatment rate was only 6.8% in adults and 14.4% in middle-aged and older within dyslipidemia subjects and only 3.5% to 4.9% was controlled in China, all of the trends in each subgroup are consistent with weak awareness and inadequate control rate of dyslipidemia, so it should be controlled strictly to prevent macro-vascular or micro-vascular complications in middle-aged population.
Our study presents several limitations. First, all of the data were based on three cross-sectional surveys over a 13-year period; thus, the effect of genetic factors on lipid profiles was not considered. Secondly, although our analyses included various districts, genders, and age groups, the data obtained are insufficient to analyze the factors influencing lipids over the same survey period. Third, the measurement methods for lipids and lipoproteins in the three surveys were similar but used different test reagents and instruments and were operated by different technicians; these variations may contribute systematic errors to our work. However, despite these limitations, the surveys we utilized, which are known to provide nationally representative data, enabled us to estimate the current health status of Chinese adults. Further data from longitudinal surveys are needed to verify these trends; examination of the influence of various lifestyle factors is also recommended for future research.
-
Nationwide surveys conducted in 2002, 2010, and 2015 revealed an increasing trend in the prevalence of dyslipidemia among Chinese adults. Increasing trends of TC, TG, LDL-c, and non-HDL-c levels and lipid-related ratios were observed in all gender, area, and BMI groups; however, dyslipidemia prevalence, especially low HDL-c levels, did not show similar tendencies among the age subgroups. These findings demonstrate that an enhanced strategy is needed to control dyslipidemia and prevent CVDs among Chinese adults.
-
The authors' contributions are as follows: SONG Peng Kun conceived and designed the study; SONG Peng Kun, MAN Qing Qing, LI Hong, PANG Shao Jie, JIA Shan Shan, and LI Yu Qian conducted the research and collected and supervised the samples; SONG Peng Kun analyzed the data and wrote the manuscript; HE Li, ZHAO Wen Hua, and ZHANG Jian supervised the study. All authors have read and approve of the final manuscript.
-
We acknowledge all participants and staff of National Institute for Nutrition and Health, China Center for Disease Control and Prevention, all members of the project team, and all participants for their support and cooperation.
-
None of the researchers or technicians have conflicts of interest to declare.
doi: 10.3967/bes2019.074
-
Abstract:
Objective To investigate the trends of lipid profiles and dyslipidemia among Chinese adults from 2002 to 2015. Methods Data were collected from three nationally representative cross-sectional surveys. Fasting venous blood samples were collected and serum lipids were tested by biochemical analysis and enzymatic determination. Lipid levels and the prevalence of dyslipidemia among adults were analyzed with complex sampling weighting adjustment for age and gender. Results The weighted means of TC, TG, and LDL-c significantly increased linearly from 3.93, 1.12, and 2.12 mmol/L in 2002 to 4.59, 1.41, and 2.78 mmol/L in 2010 and then to 4.63, 1.47, and 2.87 mmol/L in 2015, respectively; by contrast, HDL-c levels decreased significantly from 1.30 mmol/L to 1.26 mmol/L over the same period. Similar trends in mean non-HDL-c and lipid-related ratios were observed. The weighted dyslipidemia prevalence linearly increased; in particular, hypercholesterolemia increased from 1.6% to 5.6% and then to 5.8%, hypertriglyceridemia increased from 5.7% to 13.6% and then to 15.0%, low HDL-c increased from 18.8% to 35.5% and then to 24.9%, and high LDL-c increased from 1.3% to 5.6% and then to 7.2% (P for trend < 0.001). Conclusion Dyslipidemia increased among Chinese adults from 2002 to 2015. Development of a comprehensive strategy to decrease lipid levels in this population is urgently required. -
Key words:
- Lipids /
- Dyslipidemia /
- Cross-sectional study /
- Adults /
- China
-
Figure 2. Prevalence of dyslipidemia among participants in survey 2002, 2010, and 2015.
Table 1. Demographic Characteristic Information of Participants in 2002, 2010, and 2015
Table 2. Lipids Profiles among Participants in Survey 2002, 2010, and 2015 [mean (95% CI)]
Table 3. Non-HDL-c and Lipid-related Ratios among Participants in Survey 2002, 2010, and 2015 [mean (95% CI)]
-
[1] Moran A, Gu D, Zhao D, et al. Future cardiovascular disease in china:Markov model and risk factor scenario projections from the coronary heart disease policy model-china. Circ Cardiovasc Qual Outcomes, 2010; 3, 243-52. doi: 10.1161/CIRCOUTCOMES.109.910711 [2] Force M, Catapano AL, Graham I, et al. 2016 esc/eas guidelines for the management of dyslipidaemias:The task force for the management of dyslipidaemias of the european society of cardiology (esc) and european atherosclerosis society (eas) developed with the special contribution of the european assocciation for cardiovascular prevention & rehabilitation (eacpr). Atherosclerosis, 2016; 253, 281-344. doi: 10.1016/j.atherosclerosis.2016.08.018 [3] Rosenberg K. High ldl-c, non-hdl-c levels associated with higher cvd death risk, even in those at low cvd risk. Am J Nurs, 2018; 118, 67. http://www.onacademic.com/detail/journal_1000041622544999_8f6b.html [4] Wang K, Shan S, Zheng H, et al. Non-hdl-cholesterol to hdl-cholesterol ratio is a better predictor of new-onset non-alcoholic fatty liver disease than non-hdl-cholesterol:A cohort study. Lipids Health Dis, 2018; 17, 196. doi: 10.1186/s12944-018-0848-8 [5] Yokoyama K, Tani S, Matsuo R, et al. Increased triglyceride/high-density lipoprotein cholesterol ratio may be associated with reduction in the low-density lipoprotein particle size:Assessment of atherosclerotic cardiovascular disease risk. Heart Vessels, 2019; 34, 227-36. doi: 10.1007/s00380-018-1247-9 [6] Song PK, Li H, Man QQ, et al. Trends in determinants of hypercholesterolemia among chinese adults between 2002 and 2012:Results from the national nutrition survey. Nutrients, 2017; 9, 279. doi: 10.3390/nu9030279 [7] Joint committee for the revision of guidelines for the prevention and treatment of dyslipidemia in Chinese adults. Guidelines for the prevention and treatment of dyslipidemia in chinese adults (2016 revision). Chinese Circulation Journal, 2016; 31, 937-53. (In Chinese) [8] National Bureau of Statistics. Tabulation on the 2010 population census of the people's republic of china. China Statistics Press, Beijing, 2012. [9] Carroll MD, Lacher DA, Sorlie PD, et al. Trends in serum lipids and lipoproteins of adults, 1960-2002. JAMA, 2005; 294, 1773-81. doi: 10.1001/jama.294.14.1773 [10] Ferrieres J, Bongard V, Dallongeville J, et al. Trends in plasma lipids, lipoproteins and dyslipidaemias in french adults, 1996-2007. Arch Cardiovasc Dis, 2009; 102, 293-301. doi: 10.1016/j.acvd.2009.02.002 [11] Cohen JD, Cziraky MJ, Cai Q, et al. 30-year trends in serum lipids among United States adults:results from the National Health and Nutrition Examination Surveys Ⅱ, Ⅲ, and 1999-2006. Am J Cardiol, 2010; 106, 969-75. doi: 10.1016/j.amjcard.2010.05.030 [12] Danaei G, Finucane MM, Lu Y, et al. National, regional, and global trends in fasting plasma glucose and diabetes prevalence since 1980:Systematic analysis of health examination surveys and epidemiological studies with 370 country-years and 2.7 million participants. Lancet, 2011; 378, 31-40. doi: 10.1016/S0140-6736(11)60679-X [13] Carroll MD, Kit BK, Lacher DA, et al. Trends in lipids and lipoproteins in us adults, 1988-2010. Jama, 2012; 308, 1545-54. doi: 10.1001/jama.2012.13260 [14] Okamura T. Dyslipidemia and cardiovascular disease:A series of epidemiologic studies in japanese populations. J Epidemiol, 2010; 20, 259-65. doi: 10.2188/jea.JE20100060 [15] Mercado CI, Gregg E, Gillespie C, et al. Trends in lipid profiles and descriptive characteristics of U. S. adults with and without diabetes and cholesterol-lowering medication use-national health and nutrition examination survey, 2003-2012, United States. PloS One, 2018; 13, e0193756. doi: 10.1371/journal.pone.0193756 [16] Ahmed F, Waslien C, Al-Sumaie M, et al. Trends and risk factors of hypercholesterolemia among Kuwaiti adults:National Nutrition Surveillance Data from 1998 to 2009. Nutrition, 2014; 28, 917-23. http://www.sciencedirect.com/science/article/pii/S0899900712000056 [17] Baghbani-Oskouei A, Tohidi M, Asgari S, et al. Serum Lipids during 20 years in the Tehran Lipid and Glucose Study:Prevalence, trends and impact on non-communicable diseases. Int J Endocrinol Metab, 2018; 16, e84750. [18] Zaid M, Hasnain S. Plasma lipid abnormalities in Pakistani population:trends, associated factors, and clinical implications. Braz J Med Biol Res. 2018; 51, e7239. https://www.onacademic.com/detail/journal_1000040509475810_cd36.html [19] Nejat A, Mirbolouk M, Mohebi R, et al. Changes in lipid measures and incident coronary heart disease:Tehran lipid & glucose study. Clin Biochem, 2014; 47, 1239-44. doi: 10.1016/j.clinbiochem.2014.03.004 [20] Zhao WH, Zhang J, Zhai Y, et al. Blood lipid profile and prevalence of dyslipidemia in chinese adults. Biomed Environ Sci, 2007; 20, 329-35. http://www.wanfangdata.com.cn/details/detail.do?_type=perio&id=bes200704013 [21] Nakamura Y, Okuda N, Turin TC, et al. Fatty acids intakes and serum lipid profiles:NIPPON DATA90 and the national nutrition monitoring. J Epidemiol, 2010; 20, S544-8. doi: 10.2188/jea.JE20090223 [22] Kong C, Nimmo L, Elatrozy T, et al. Smoking is associated with increased hepatic lipase activity, insulin resistance, dyslipidaemia and early atherosclerosis in Type 2 diabetes. Atherosclerosis, 2001; 156, 373-8. doi: 10.1016/S0021-9150(00)00664-X [23] Wood AM, Kaptoge S, Butterworth AS, et al. Risk thresholds for alcohol consumption:combined analysis of individual-participant data for 599 912 current drinkers in 83 prospective studies. Lancet, 2018; 391, 1513-23. doi: 10.1016/S0140-6736(18)30134-X [24] Joshi SR, Anjana RM, Deepa M, et al. Prevalence of dyslipidemia in urban and rural India:the ICMR-INDIAB study. PLoS One, 2014; 9, e96808. doi: 10.1371/journal.pone.0096808 [25] Klop B, Elte JW, Cabezas MC. Dyslipidemia in obesity:mechanisms and potential targets. Nutrient, 2013; 5, 1218-40. doi: 10.3390/nu5041218 [26] Miller M, Stone NJ, Ballantyne C, et al. Triglycerides and cardiovascular disease:A scientific statement from the american heart association. Circulation, 2011; 123, 2292-333. doi: 10.1161/CIR.0b013e3182160726 [27] Nordestgaard BG, Varbo A. Triglycerides and cardiovascular disease. Lancet, 2014; 384, 626-35. doi: 10.1016/S0140-6736(14)61177-6 [28] Chapman MJ, Ginsberg HN, Amarenco P, et al. Triglyceride-rich lipoproteins and high-density lipoprotein cholesterol in patients at high risk of cardiovascular disease:evidence and guidance for management. Eur Heart J, 2011; 32, 1345-61. doi: 10.1093/eurheartj/ehr112 [29] Huang Y, Gao L, Xie X, et al. Epidemiology of dyslipidemia in chinese adults:Meta-analysis of prevalence, awareness, treatment, and control. Popul Health Metr, 2014; 12, 28. doi: 10.1186/s12963-014-0028-7 [30] Pan L, Yang Z, Wu Y, et al. The prevalence, awareness, treatment and control of dyslipidemia among adults in china. Atherosclerosis, 2016; 248, 2-9. doi: 10.1016/j.atherosclerosis.2016.02.006 [31] Baigent C, Keech A, Kearney PM, et al. Efficacy and safety of cholesterol-lowering treatment:prospectivemeta-analysis of data from 90, 056 participants in 14 randomised trials ofstatins. Lancet, 2005; 366, 1267-78. doi: 10.1016/S0140-6736(05)67394-1 [32] Nicholls SJ, Brandrup-Wognsen G, Palmer M, et al. Meta-analysis of comparative efficacy of increasing dose of Atorvastatin versus Rosuvastatin versus Simvastatin on lowering levels of atherogenic lipids (from VOYAGER). Am J Cardiol, 2010; 105, 69-76. doi: 10.1016/j.amjcard.2009.08.651 [33] Kong SH, Koo BK, Moon MK. Efficacy of Moderate Intensity Statins in the Treatment of Dyslipidemia in Korean Patients with Type 2 Diabetes Mellitus. Diabetes Metab J, 2017; 41, 23-30. doi: 10.4093/dmj.2017.41.1.23 [34] Otsuka T, Mizuno K, Shinozaki T, et al. Preventive effect of pravastatin on the development of hypertension in patients with hypercholesterolemia:A post-hoc analysis of the Management of Elevated Cholesterol in the Primary Prevention Group of Adult Japanese (MEGA) Study. J Clin Lipidol, 2017; 11, 998-1006. doi: 10.1016/j.jacl.2017.05.015 [35] Ang J, Li LJ, He YC, et al. An exploring study on the pharmacodynamics of rosuvastatin in Chinese hypercholesterolemic patients. Chin J Clin Pharm Ther, 2010; 15, 894-900. http://d.old.wanfangdata.com.cn/Periodical/zglcylxyzlx201008012 [36] Zhao S, Peng D. Efficacy and safety of rosuvastatin versus atorvastatin in high-risk Chinese patients with hypercholesterolemia:a randomized, double-blind, active-controlled study. Curr Med Res Opin, 2018; 34, 227-35. doi: 10.1080/03007995.2017.1371584 [37] Wu LX. Efficacy and safety of rosuvastatin in aged patients with coronary heart disease and hypercholesterolemia. Chin Mod Med, 2013; 20, 70-1. http://www.wanfangdata.com.cn/details/detail.do?_type=perio&id=zhongguoyy201107003 [38] Li JH, Wang LM, Mi SQ, et al. Awareness rate, treatment rate and control rate of dyslipidemia in chinese adults, 2010. Chin J Prev Med, 2012; 46, 687-91. (In Chinese) http://www.wanfangdata.com.cn/details/detail.do?_type=perio&id=zhyfyx201208004 [39] Song P, Zha M, Yang X, et al. Socioeconomic and geographic variations in the prevalence, awareness, treatment and control of dyslipidemia in middle-aged and older chinese. Atherosclerosis, 2019; 282, 57-66. (In Chinese) doi: 10.1016/j.atherosclerosis.2019.01.005 [40] Zhang FL, Xing YQ, Wu YH, et al. The prevalence, awareness, treatment, and control of dyslipidemia in northeast china:A population-based cross-sectional survey. Lipids Health Dis, 2017; 16, 61. doi: 10.1186/s12944-017-0453-2 -

 点击查看大图
图(2) / 表ll (3)
计量
- 文章访问数: 18126
- HTML全文浏览量: 7965
- PDF下载量: 820
- 被引次数: 0

 Quick Links