

 下载:
下载:

-
Stroke remains a leading cause of mortality and long-term disability in the United States of America (USA)[1], imposing a significant public health burden. Approximately 795,000 people in the USA experience a stroke annually. Approximately 610,000 of these cases are first strokes, and 185,000 people who survive a stroke will have another stroke within 5 years[2]. Ischemic strokes and hemorrhagic strokes make up approximately 87% and 13% of all strokes, respectively[3]. The diagnosis of an arterial stroke differentiates ischemia from hemorrhage. The former may be due to arterial occlusion or stenosis, while the latter may be due to leakage or rupture of an artery[4]. The majority of risk factors for hemorrhagic and ischemic strokes are the same, including a history of hypertension, diabetes, dyslipidemia, cardiovascular disease, and obesity[5]. There are also significant differences in the exposure patterns and levels of certain risk factors, such as a history of hypertension associated with a higher relative risk of hemorrhagic stroke[6]. Patients with atrial fibrillation have a higher risk of ischemic stroke[7]. The symptoms of hemorrhagic stroke can peak within minutes to hours, depending on the amount and location of the bleeding[8]. The onset of ischemic stroke is slow; and often manifests as hemiplegia, sensory disturbances, ataxia, dizziness, and even incontinence[9]. Stroke is a multifaceted condition, influenced by a complex interplay of genetic, lifestyle, and environmental factors[10]. Dyslipidemia, characterized by abnormalities in lipid profiles, is a well-established modifiable risk factor for cerebrovascular diseases[11], notably stroke[12].
The non-high-density lipoprotein (NHDL) cholesterol to HDL-C ratio (NHHR) is an emerging comprehensive indicator of atherosclerotic lipid[13]. Previous studies have shown that the NHHR outperforms traditional blood lipid levels in terms of predictive and diagnostic abilities when evaluating the risk of non-alcoholic fatty liver disease[14], chronic kidney disease[15,16], insulin resistance[17]. Furthermore, numerous recent studies have highlighted NHHR’s predictive worth and its link to a host of other conditions such as periodontitis[18], suicidal ideation[19], kidney stones[20] and depression[21].
Although there is increasing data highlighting the importance of the NHHR, its relationship with stroke remains poorly understood, particularly in diverse populations such as the USA. The NHANES presented a unique opportunity to investigate this association in a comprehensive and representative sample of adults in the USA. We hypothesized that there may be a correlation between NHHR and stroke. Stroke prevention and treatment may benefit from management and control of NHHR. Therefore, we conducted a cross-sectional study based on the NHANES 2005–2018 dataset to explore the association between NHHR and stroke prevalence in adults in the USA.
Thus, through this cross-sectional NHANES study, we aimed to elucidate the relationship between NHHR and incident stroke within the diverse context of the USA adult population and sought to assess whether NHHR could serve as an effective biomarker for stroke risk, thereby providing targeted preventative strategies and yielding implications for clinical practice.
-
The data utilized in this study were sourced from NHANES 2005 to 2018, a research program aimed at evaluating the well-being and nutritional status of adults and children in the USA. The survey included demographic, socioeconomic, dietary, and health-related questions. The screening segment encompasses medical, dental, and physiological measurements along with laboratory tests conducted by trained medical personnel. The survey results will establish the occurrence rates of significant diseases and their disease-causing prevalence. Further details are available online (https://www.cdc.gov/nchs/nhanes/index.htm).
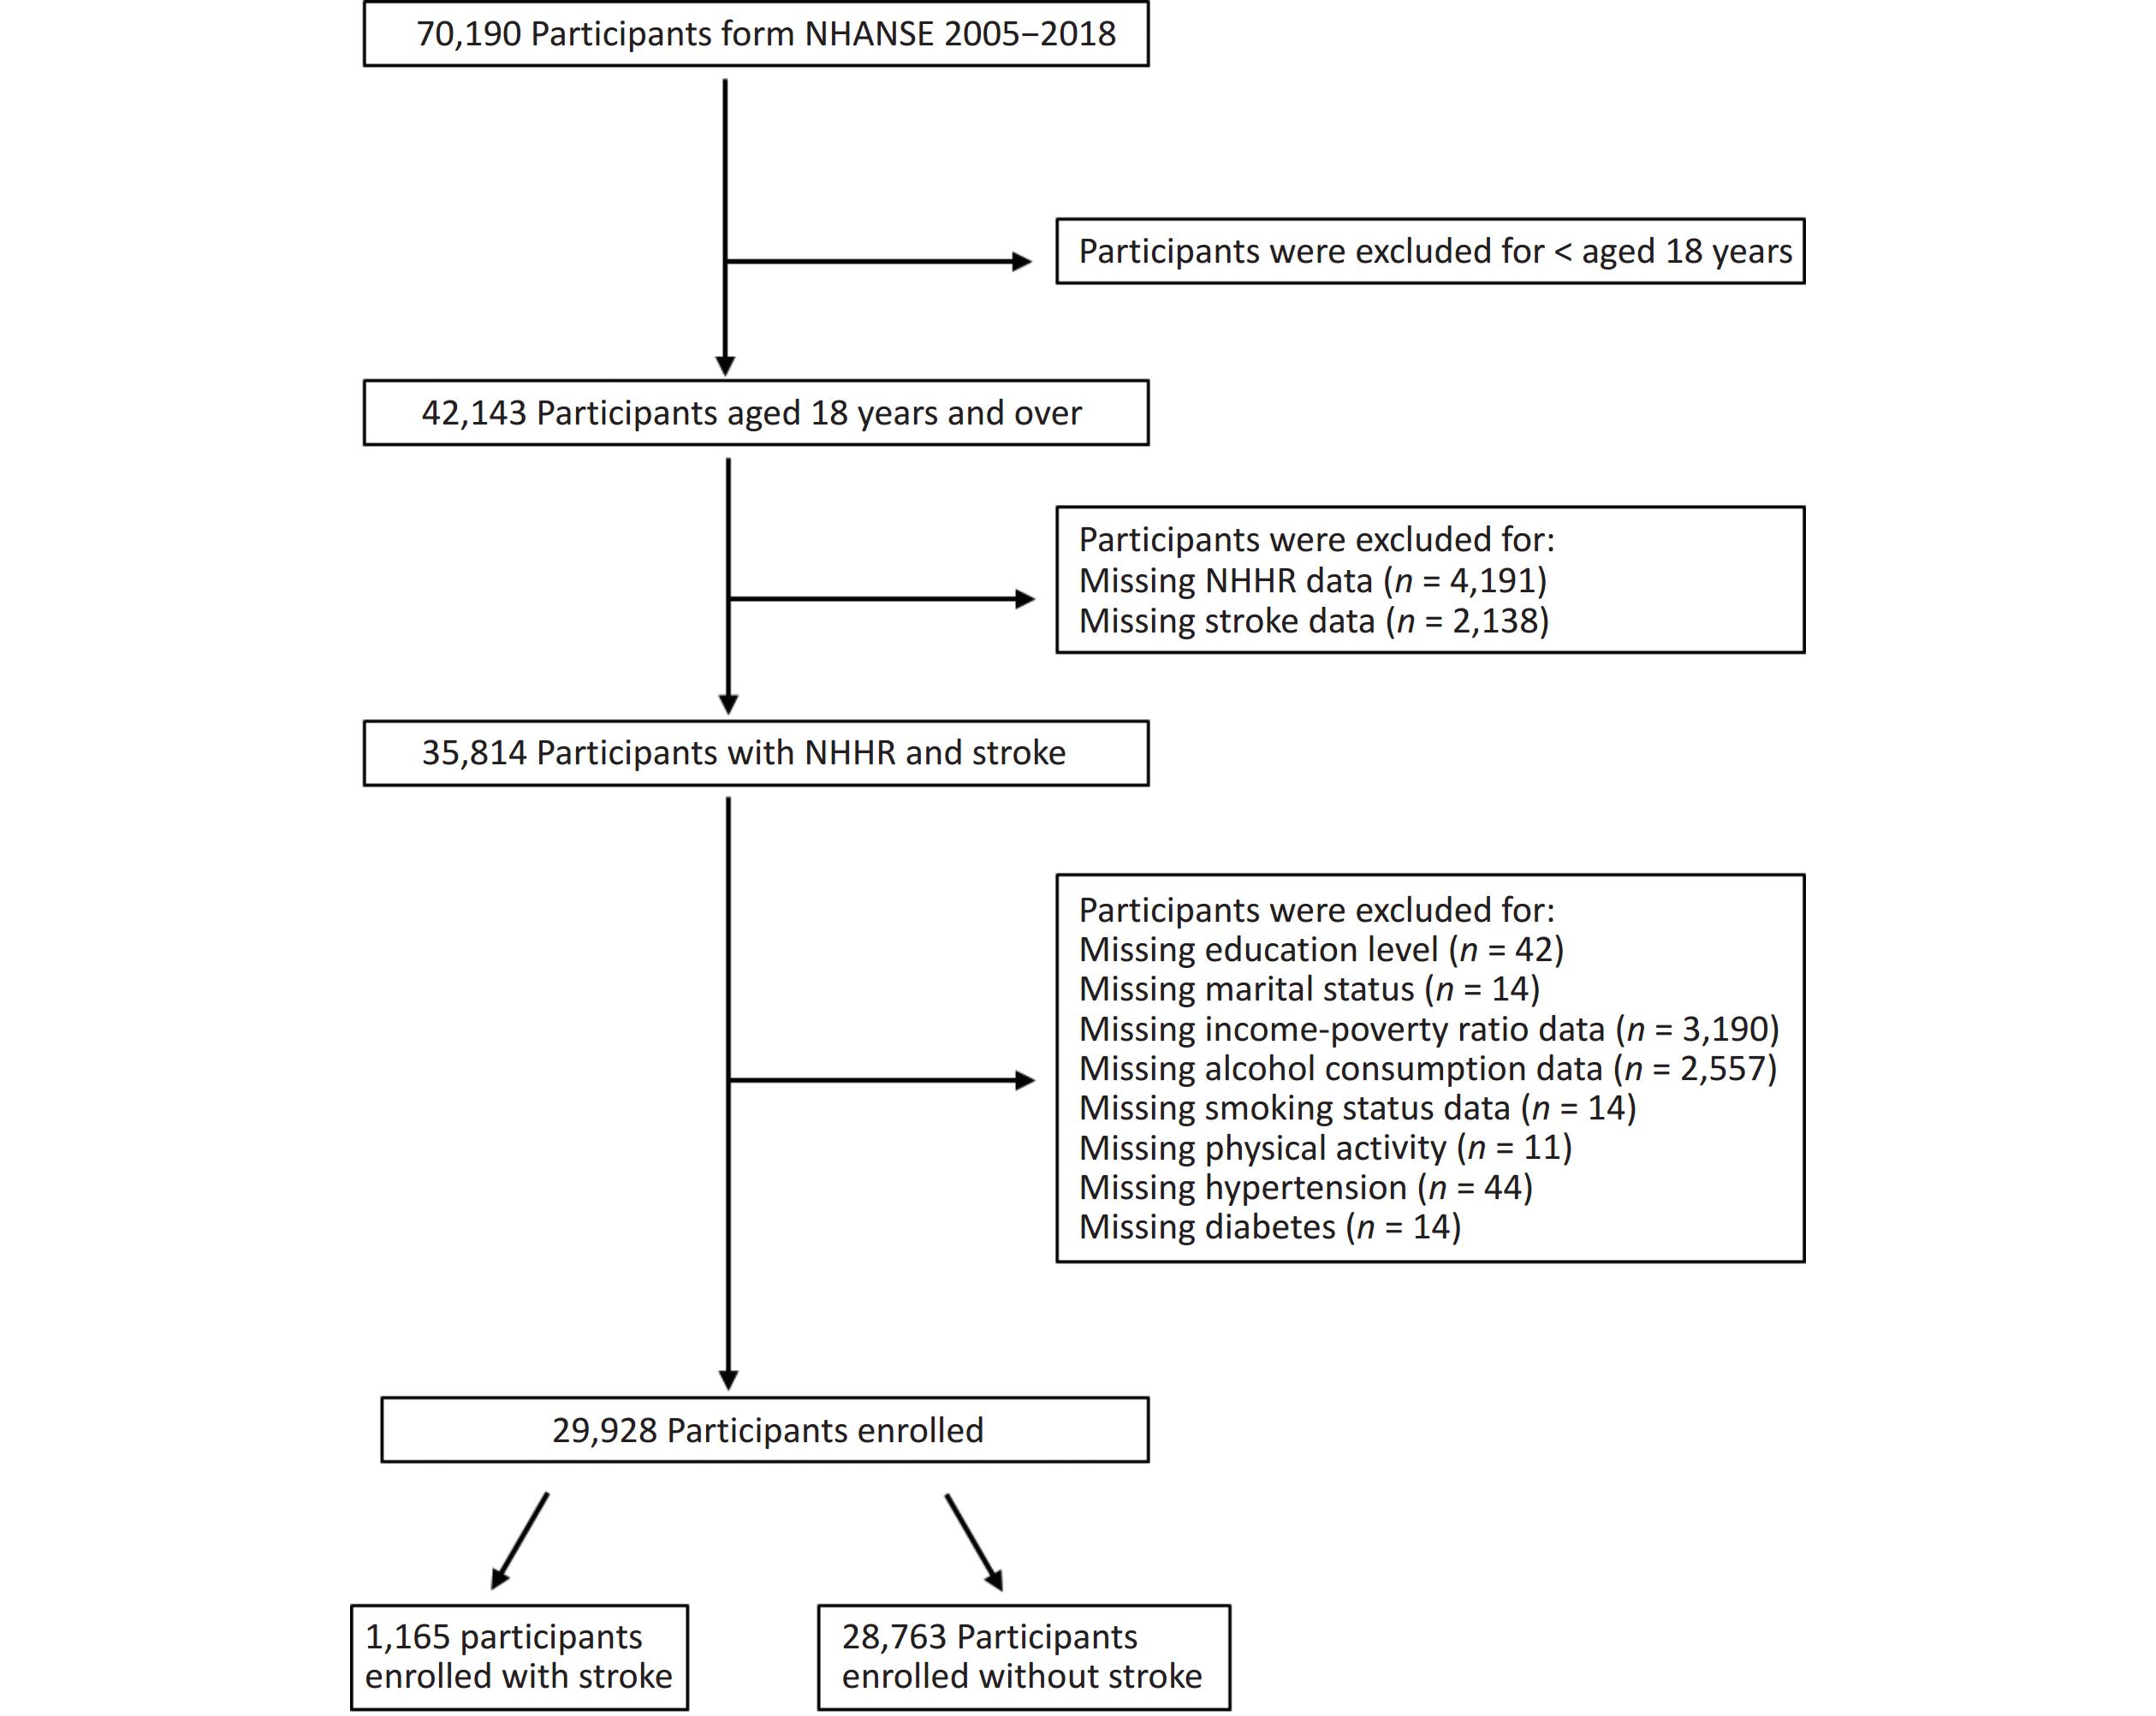
Between 2005 and 2018, 70,190 individuals participated in NHANES. As the steps of the complex sample design take precedence over the inclusion and exclusion criteria of the subjects, we conducted a weighted logistic regression. In the continuous model, the goodness of fit results showed that Model 3 (R2 = 19.87%) has a better predictive ability than the other models and NHHR was found to be positively correlated with stroke (OR 1.11, 95% CI: 1.03–1.20, P = 0.011) in the model 3 (data not shown). After applying the exclusion criteria, the sample size decreased to 29,928. The following exclusion criteria were used to identify the final participants: 1) younger than 18 years; 2) missing data on stroke diagnosis or NHHR calculation; and 3) missing data on covariates, including education level, marital status, income-poverty ratio, alcohol consumption, smoking status, physical activity, hypertension and diabetes. Figure 1 shows a flowchart of the screening process.
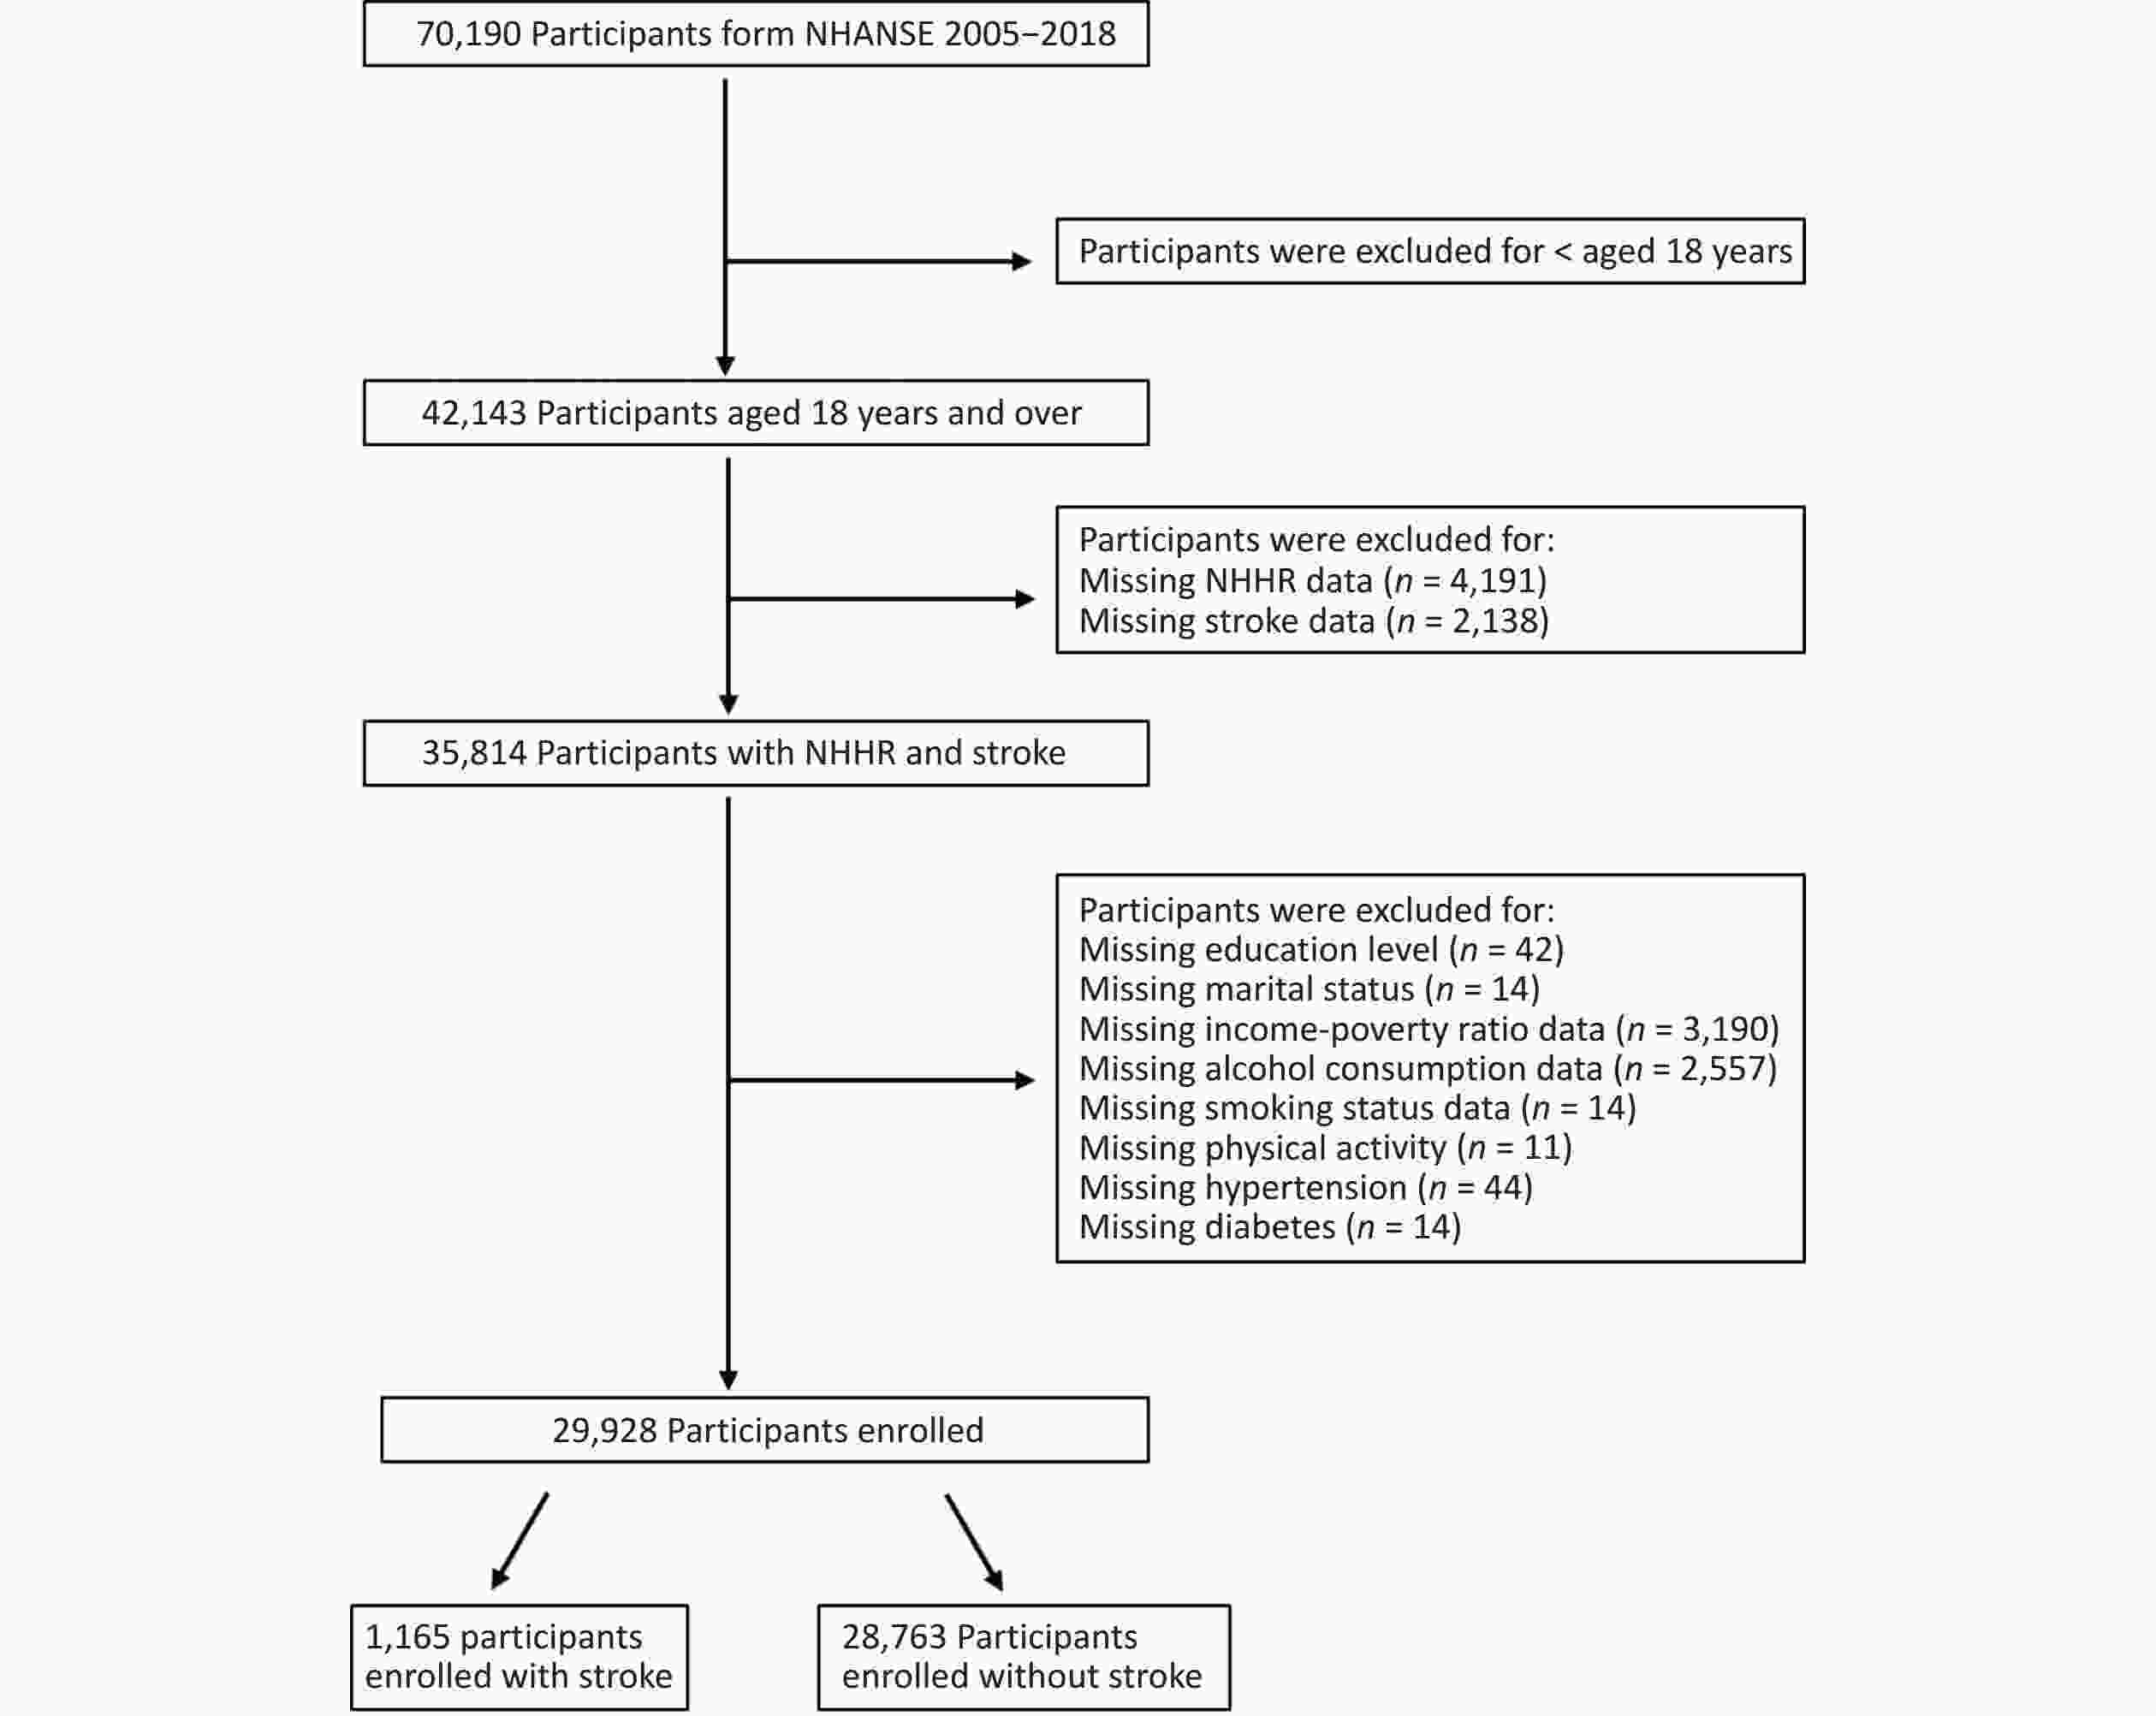
Figure 1. Flowchart of study participants included in our study.
-
The NHANES uses complex sampling techniques, such as multi-stage probability cluster design, to obtain nationally representative samples. In this design, the selection of samples is not random, but follows certain probabilities and rules. Therefore, sampling weights and sample design variables must be considered and used in the analysis to ensure that the results truly reflect the characteristics of the American population. The following is a detailed description of the method. First, the sampling weight is a key factor in NHANES data analysis. Because the sample was obtained through a complex sampling design, the population represented by each individual in the sample was different. Sampling weights were used to measure the diversity, which reflects the importance of each individual sample in the population. Second, the results were adjusted to reflect the demographic characteristics of the American population. When using the NHANES data for analysis, the influence of sampling weights and sample design variables must be considered. By applying a sampling weight to each observation and appropriately adjusting the results according to the sample design variables, the analysis results truly reflect the characteristics of the entire American population.
-
The data source for the NHHR calculations is derived from laboratory data in NHANES called ‘HDL.Doc’ which provides HDL-C data and ‘TCHOL.Doc’, which provides total cholesterol data. NHHR data were obtained using the formula of total cholesterol minus HDL-C, and then divided by HDL-C.
-
Stroke was identified through self-reported diagnoses, provided by participants during face-to-face interviews. Specifically, those who responded affirmatively to the question, “Has a physician or health professional ever diagnosed you with a stroke?” were classified as having experienced a stroke. It is noteworthy that the reliance on self-reported measures may introduce recall bias, potentially affecting data interpretation. Furthermore, while the NHANES database does not provide information on the specific stroke type, the higher prevalence and closer association of ischemic stroke with chronic low-grade inflammatory status suggest that the majority of stroke cases in this study were likely instances of ischemic stroke[22,23].
-
To explore the relationship between the NHHR and stroke, several covariates were selected for adjustment, including demographic data, lifestyle habits, and health status.
The demographic data included age, gender, race, educational level, marital status, and income level. Income levels were categorized into three levels (< 1.3, 1.3–3.5, > 3.5) according to the family income-to-poverty ratio[24]. Lifestyle behaviors included physical activity, alcohol use and smoking status. Physical activity was defined as at least 10 continuous minutes of activities of moderate or vigorous intensity, outside of work or transportation. Physically inactive status was defined as < 10 min of the above activities. Alcohol consumption was judged by “Had at least 12 alcohol drinks/1 year?” and were categorized as no (participants had < 12 alcoholic drinks during the past 12 months) or yes (participants had at least 12 alcoholic drinks during the past 12 months). Smoking status was determined by “Have you smoked at least 100 cigarettes in your entire life?” and were categorized as no (smoking < 100 cigarettes in their lifetime) or yes (smoking at least 100 cigarettes in their lifetime).
Health status involved measuring hypertension and diabetes, which could be obtained directly from questionnaires. A history of hypertension was defined as a self-reported diagnosis by a physician. A history of diabetes was defined as a self-reported diagnosis by a physician or current insulin use.
-
To ensure representativeness of the sample within the population, the analysis was weighted using appropriate sample weights according to the official NHANES website. The sample weight was calculated using the following formula: 14-year sample weight =1/7 × WTMEC2YR.
The association between NHHR and stroke was investigated using multivariate logistic regression model. The odds ratios (OR) and 95% confidence interval (CI) were calculated. Both continuous and categorical models were used. No covariates were adjusted for in Model 1. Model 2 was adjusted for age, gender, race, marital status, income-poverty ratio, and educational level. Model 3 was adjusted for physical activity, smoking status, alcohol consumption, diabetes-mellitus and hypertension. Furthermore, the possible dose-response association between NHHR and stroke was examined using the restricted cubic spline model (RCS).
Subgroup analyses were performed to investigate the consistency of results. The subgroup factors included age (18–40 years, 40–60 years and 60–85 years), gender, marital status, race, education level, income-poverty ratio, smoking status, alcohol consumption, physical activity, history of hypertension, and history of diabetes. Age categorization was defined by tertiles of continuous data.
Sensitivity analyses were performed to assess the robustness of the results. First, according to the restricted cubic spline model (RCS) curve, we selected 2.67 as the cutoff value for the NHHR and transformed it into a binary variable. Second, participants with hypercholesteremia (non-HDL-C ≥ 160 mg/dL) were excluded[25].
All data analyses were performed using DecisionLinnc1.0 software[26,27]. DecisionLinnc1.0 is a platform that integrates multiple programming language environments and enables data processing and data analysis through a visual interface. Categorical variables are expressed as percentages, and continuous variables were first tested for normality. Data following anormal distribution are represented by mean ± standard Deviation, while data not following a normal distribution are often described by the median and interquartile range to depict the central tendency and dispersion. Weighted logistic regression was employed across the three distinct models to examine the relationship between stroke and NHHR. Model 1 was not adjusted for covariates. In Model 2, adjustments were made for demographic factors including age, gender, race, marital status, income-poverty ratio, and education level. Model 3 was further adjusted for physical activity, smoking status, alcohol consumption, diabetes, and hypertension based on Model 2. Subgroup analyses were also conducted. Furthermore, the RCS was utilized to explore potential non-linear relationships between the NLR and T2DMrisk. Statistically significance was set at P < 0.05.
-
The participants’ characteristics are listed in Table 1. Among the 29,928 included participants, 3.89% of them were diagnosed with stroke. The median age of participants was 47 years and 48.85% were male. For the non-stroke and stroke groups, the median NHHR values were 2.57 and 2.67, respectively (P < 0.05). There were significant differences in baseline characteristics, including age, race, education level, marital status, income-poverty ratio, physical activity, alcohol consumption, smoking status, history of hypertension, history of diabetes and HDL-C between participants with or without stroke.
Table 1. Characteristics of participants
Variable Overall (n = 29,928) Non-stroke (n = 28,763) Stroke (n = 1,165) P value Age (years) 47 (20−85) 46 (20−85) 67 (20−85) < 0.001 Gender 0.009 Female 15,191 (51.15%) 14,604 (50.99%) 587 (56.56%) Male 14,737 (48.85%) 14,159 (49.01%) 578 (43.44%) Race < 0.001 Non-Hispanic Black 6,123 (10.27%) 5,814 (10.17%) 309 (13.74%) Non-Hispanic White 13,420 (69.51%) 12,812 (69.45%) 608 (71.72%) Mexican American 4,578 (8.05%) 4,472 (8.16%) 106 (4.42%) Other Hispanic 2,707 (5.08%) 2,641 (5.15) 66 (2.84) Other Race 3,100 (7.08) 3,024 (7.07) 76 (7.29) Education level < 0.001 Less Than 9th Grade 2,882 (4.85) 2,715 (4.72) 167 (9.27) 9−11th Grade 4,151 (10.22) 3,932 (10.06) 219 (15.67) High School Grad/GED 6,900 (23.24) 6,576 (23.02) 324 (31.04) Some College 8,990 (31.75) 8,683 (31.92) 307 (25.93) College Graduate 7,005 (29.94) 6,857 (30.29) 148 (18.09) Marital status 0.003 Married/Living with partner 11,925 (35.89) 11,367 (35.72) 558 (41.63) Unmarried 18,003 (64.11) 17,396 (64.28) 607 (58.37) Income-poverty ratio < 0.001 < 1.3 9,236 (20.62) 8,777 (20.30) 459 (31.39) 1.3−3.5 11,404 (35.92) 10,902 (35.63) 502 (45.85) > 3.5 9,288 (43.46) 9,084 (44.07) 204 (22.76) Physical activity < 0.001 Inactive 16,578 (50.02) 15,780 (54.86) 798 (66.69) Active 13,350 (49.51) 12,983 (49.98) 367 (33.31) Smoking status < 0.001 Yes 13,581 (45.25) 12,866 (44.83) 715 (59.38) No 16,347 (54.75) 15,897 (55.17) 450 (40.62) Alcohol consumption 0.001 Yes 22,225 (79.58) 21,411 (79.80) 814 (72.07) No 7,703 (20.42) 7,352 (20.20) 351 (27.93) Hypertension < 0.001 Yes 10,821 (32.11) 9,920 (30.83) 901 (75.43) No 19,107 (67.89) 18,843 (69.17) 264 (24.57) Diabetes < 0.001 Yes 3,857 (9.57) 3,463 (8.94) 394 (30.95) No 26,071 (90.43) 25,300 (91.06) 771 (69.05) TC (mg/dL) 137 (23−754) 137 (23−754) 128 (42−397) < 0.001 HDL−C (mg/dL) 51 (6−226) 51 (6−226) 49 (11−156) 0.006 NHHR 2.66 (0.28−27) 2.57 (0.51−13.85) 2.67 (0.28−27) 0.011 Note. TC, total cholesterol; HDL-C, high-density lipoprotein cholesterol; NHHR, nonhigh-density lipoprotein cholesterol to high-density lipoprotein cholesterol ratio. -
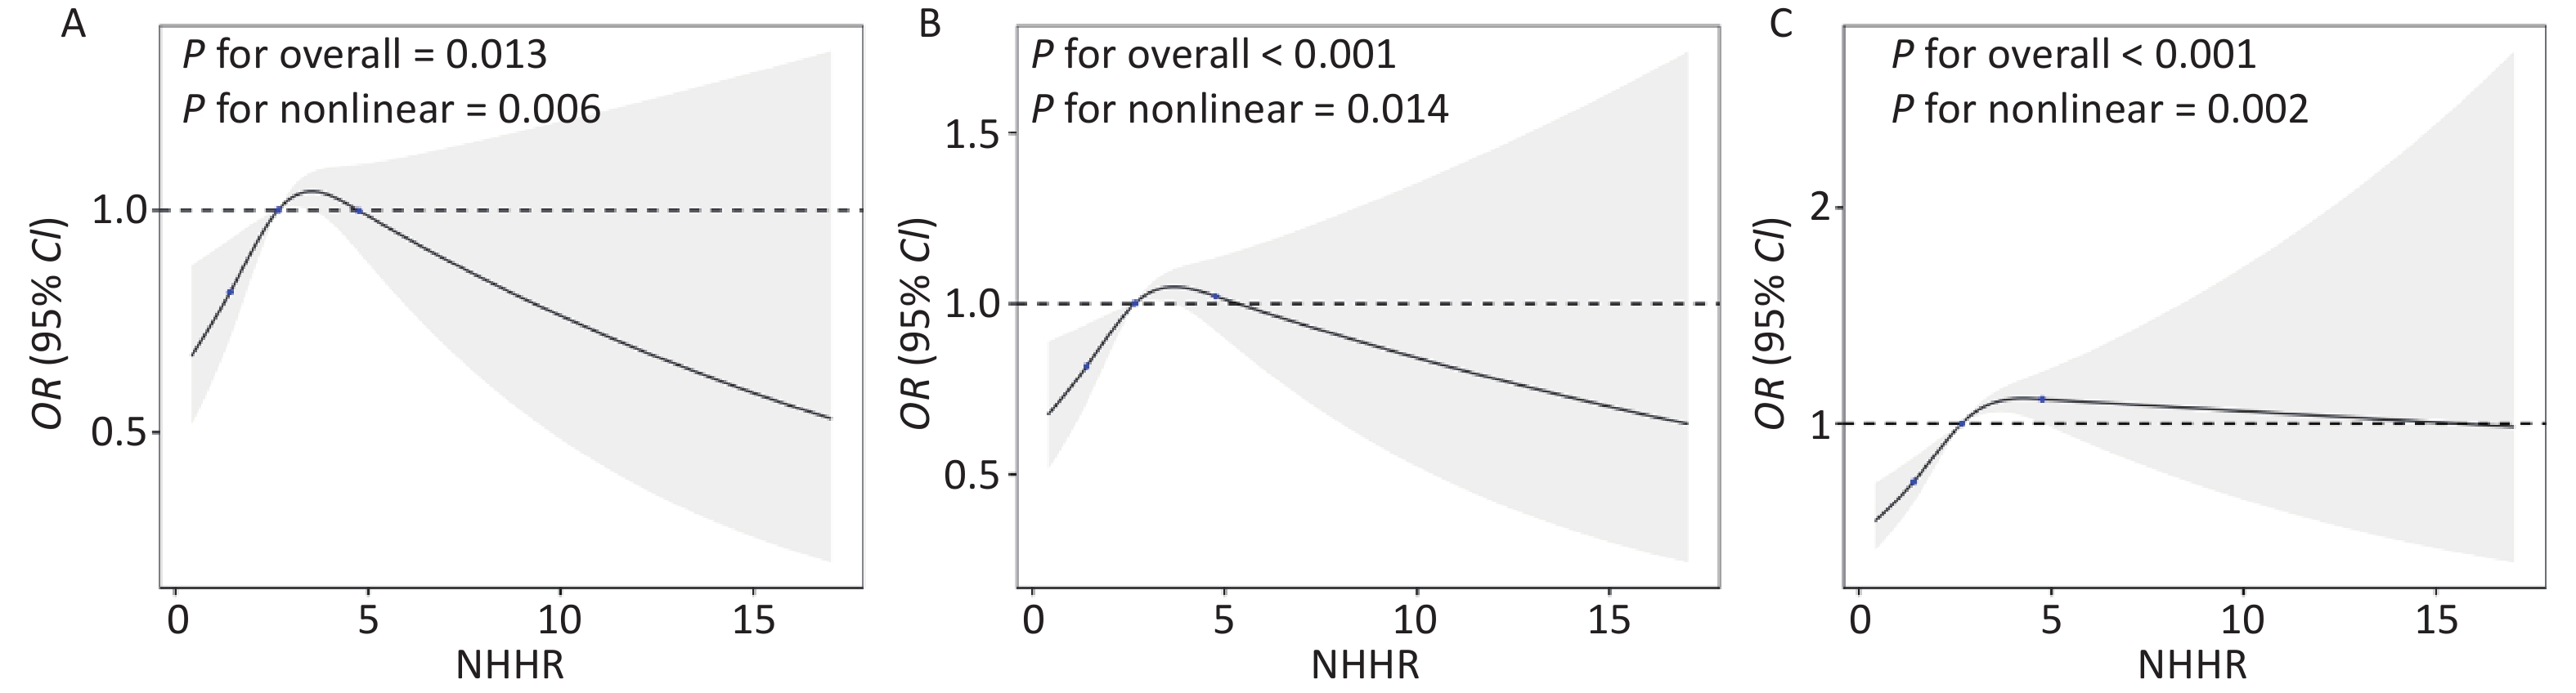
The association between the NHHR and stroke is shown in Table 2. In the continuous model, the goodness of fit results showed that Model 3 (R2 = 17.74%) has a better predictive ability than the other models and NHHR was found to be positively correlated with stroke (OR 1.24, 95% CI: 1.03–1.50, P = 0.026) in the model 3. In the most adjusted categorical model, compared with the lowest reference quartile, participants in the second, third, and fourth quartiles had an OR of 1.35 (95% CI 1.08–1.69), 1.83 (95% CI 1.42–2.36), and 2.04 (95% CI 1.50–2.79) for risk of stroke, with a significant trend (P < 0.001). The RCS model confirmed this positive correlation (P non-linearity = 0.002) (Figure 2).
Table 2. Association between NHHR and stroke among American adults in NHANES 2005–2018
Outcomes Continuous models Categorical model OR P value R2* (%) Q1 Q2 Q3 Q4 Ptrend Model 1 1.15 (1.05−1.26) 0.003 0.13 1 (Ref.) 1.20 (0.91−1.57) 1.40 (0.97−2.02) 1.29 (0.76−2.20) 0.018 Model 2 1.11 (1.02−1.22) 0.019 13.69 1 (Ref.) 1.44 (1.15−1.81) 1.85 (1.44−2.39) 1.93 (1.43−2.61) < 0.001 Model 3 1.24 (1.03−1.50) 0.026 17.74 1 (Ref.) 1.35 (1.08−1.69) 1.83 (1.42−2.36) 2.04 (1.50−2.79) < 0.001 Note. Model 1 did not adjust for any potential confounders; Model 2 adjusted for demographic factors including age, gender, race, marital status, income−poverty ratio, and education level; Model 3 further adjusted for physical activity, smoking status, alcohol consumption, diabetes, and hypertension based on Model 2. *Goodness−of−fit results. The goodness of fit results showed that Model 3 (R2 = 17.46%) has a better predictive ability than the other models. 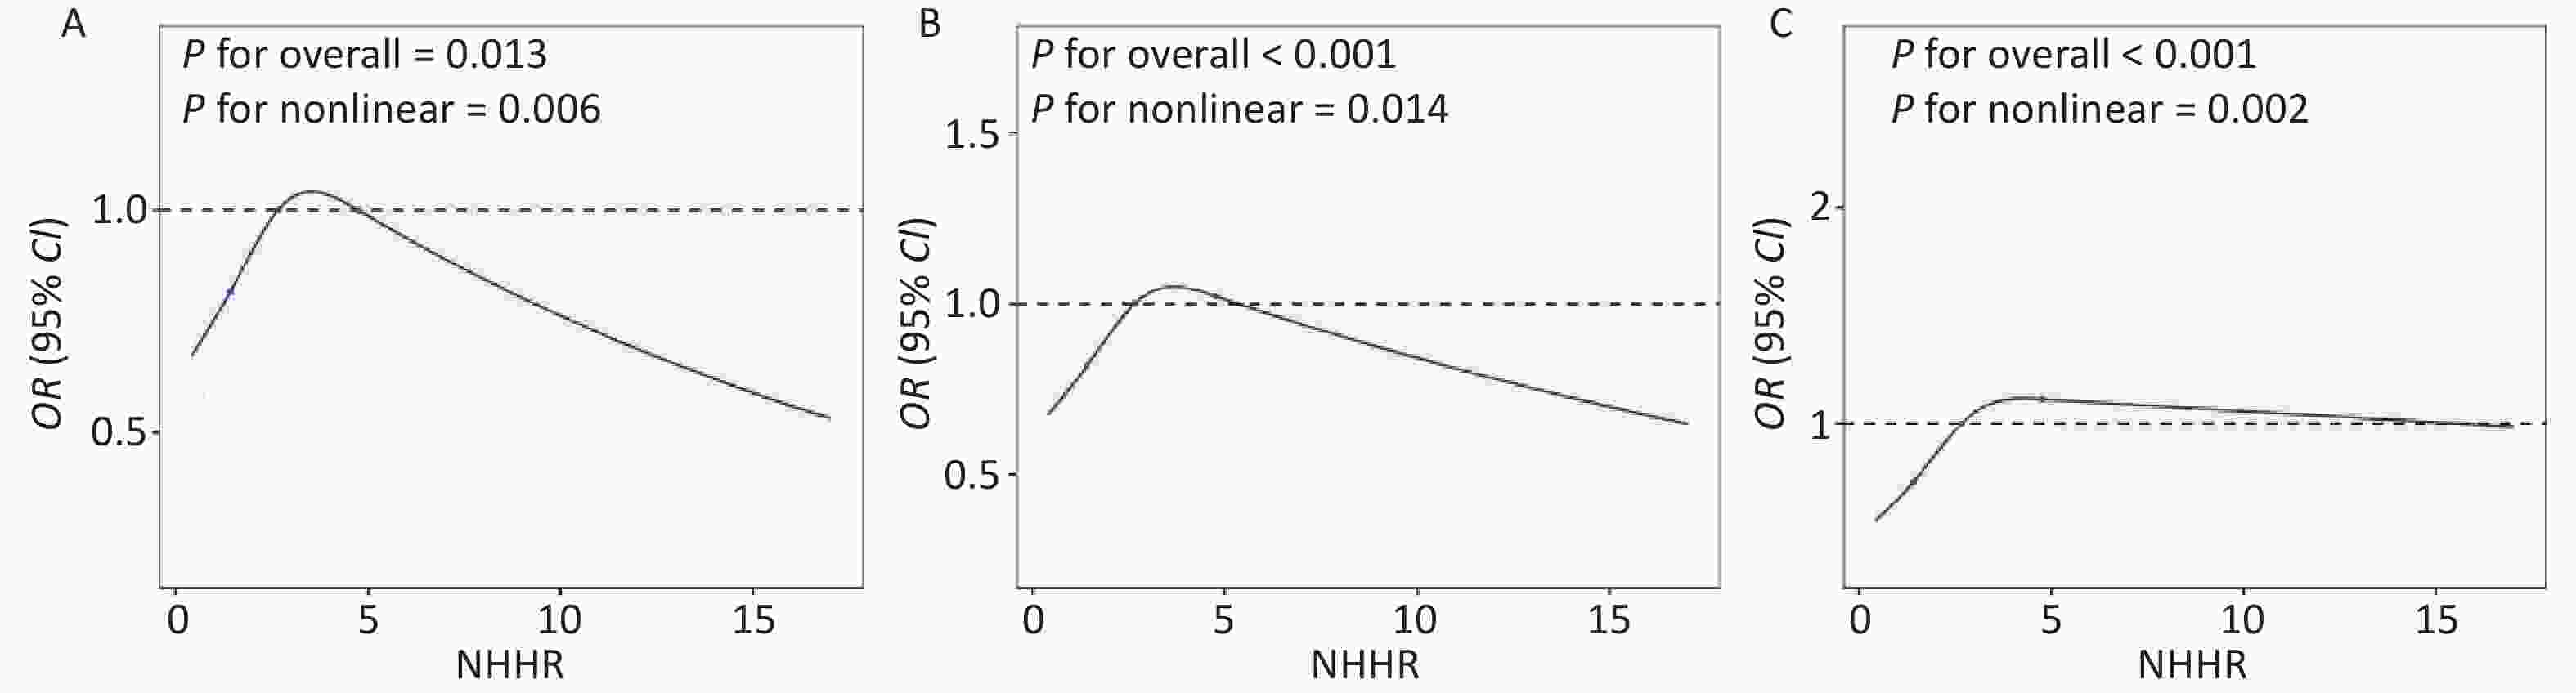
Figure 2. The restricted cubic spline curve was used to model the relationship between NHHR and the risk of stroke among all participants. (A) Not adjusted for any covariates; (B) Adjusted for age, gender, race, marital status, income-poverty ratio, and education level; (C) Further adjusted for physical activity, smoking status, alcohol consumption, diabetes, and hypertension.
-
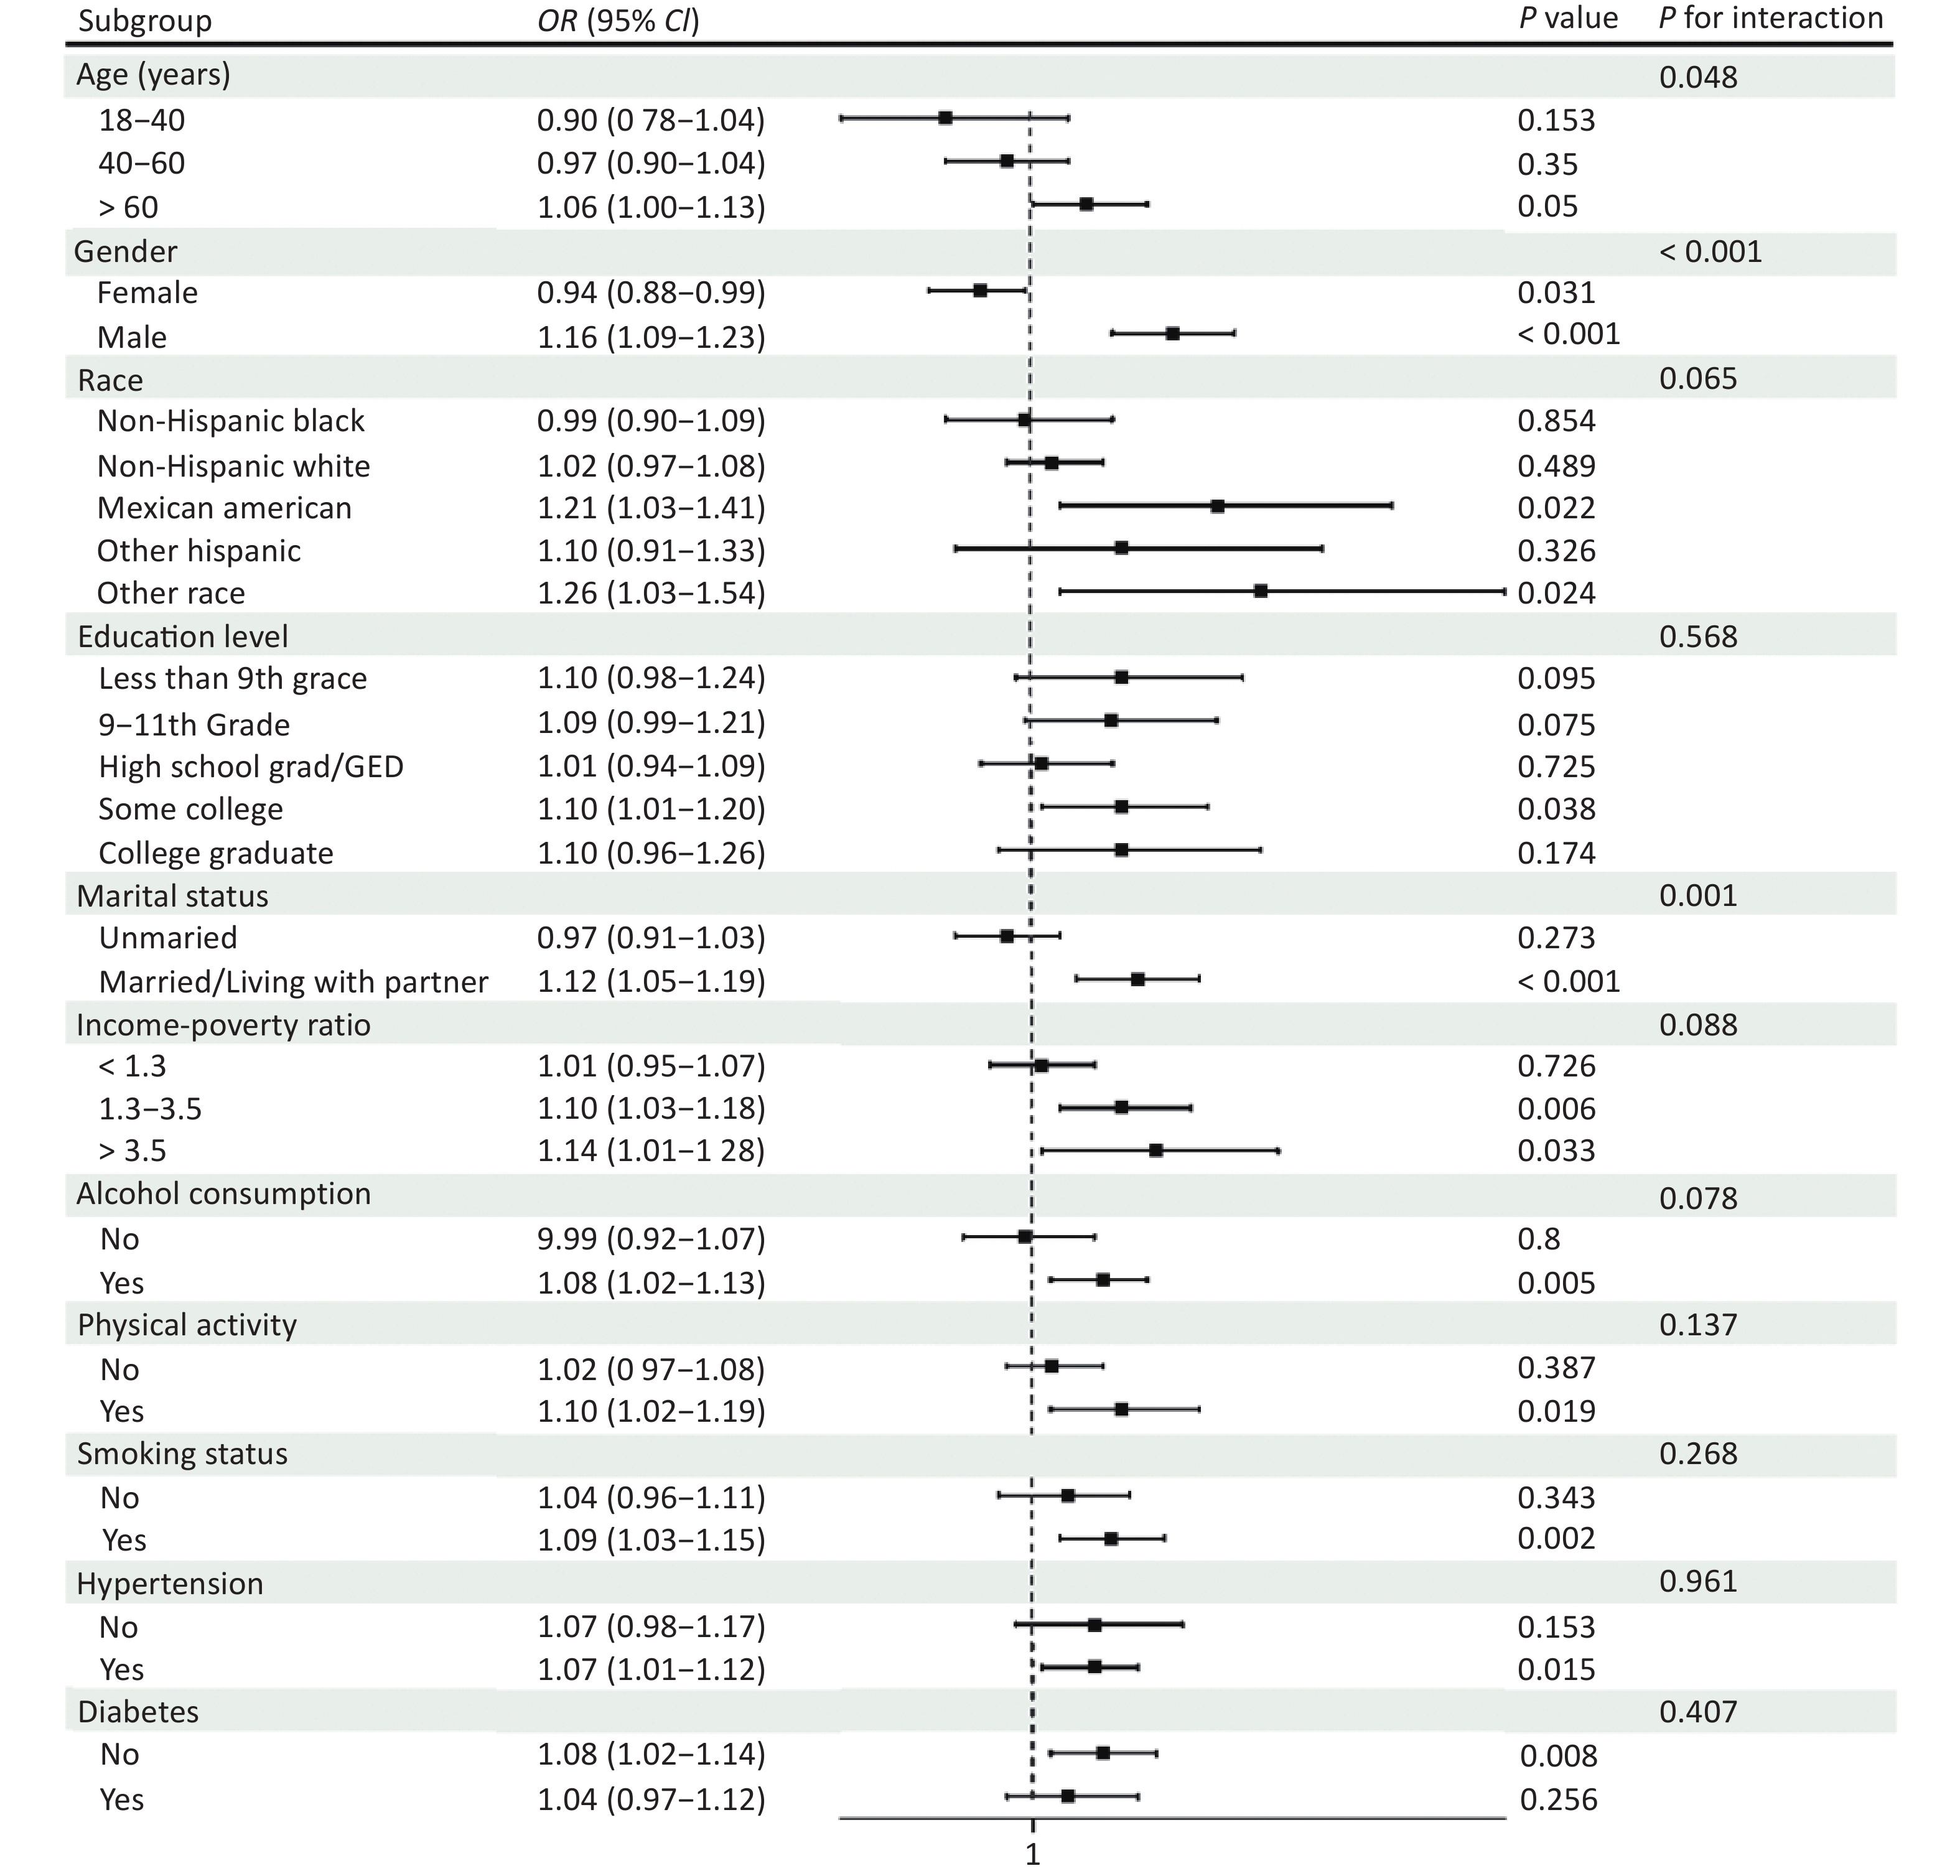
The findings of the subgroup analyses are shown in Figure 3. There were significant interactions between age, gender, race, marital status and NHHR (P for interaction < 0.05). However, this association was not supported by a subgroup analysis stratified by education level, income-poverty ratio, physical activity, smoking status, alcohol consumption, history of hypertension, and history of diabetes.
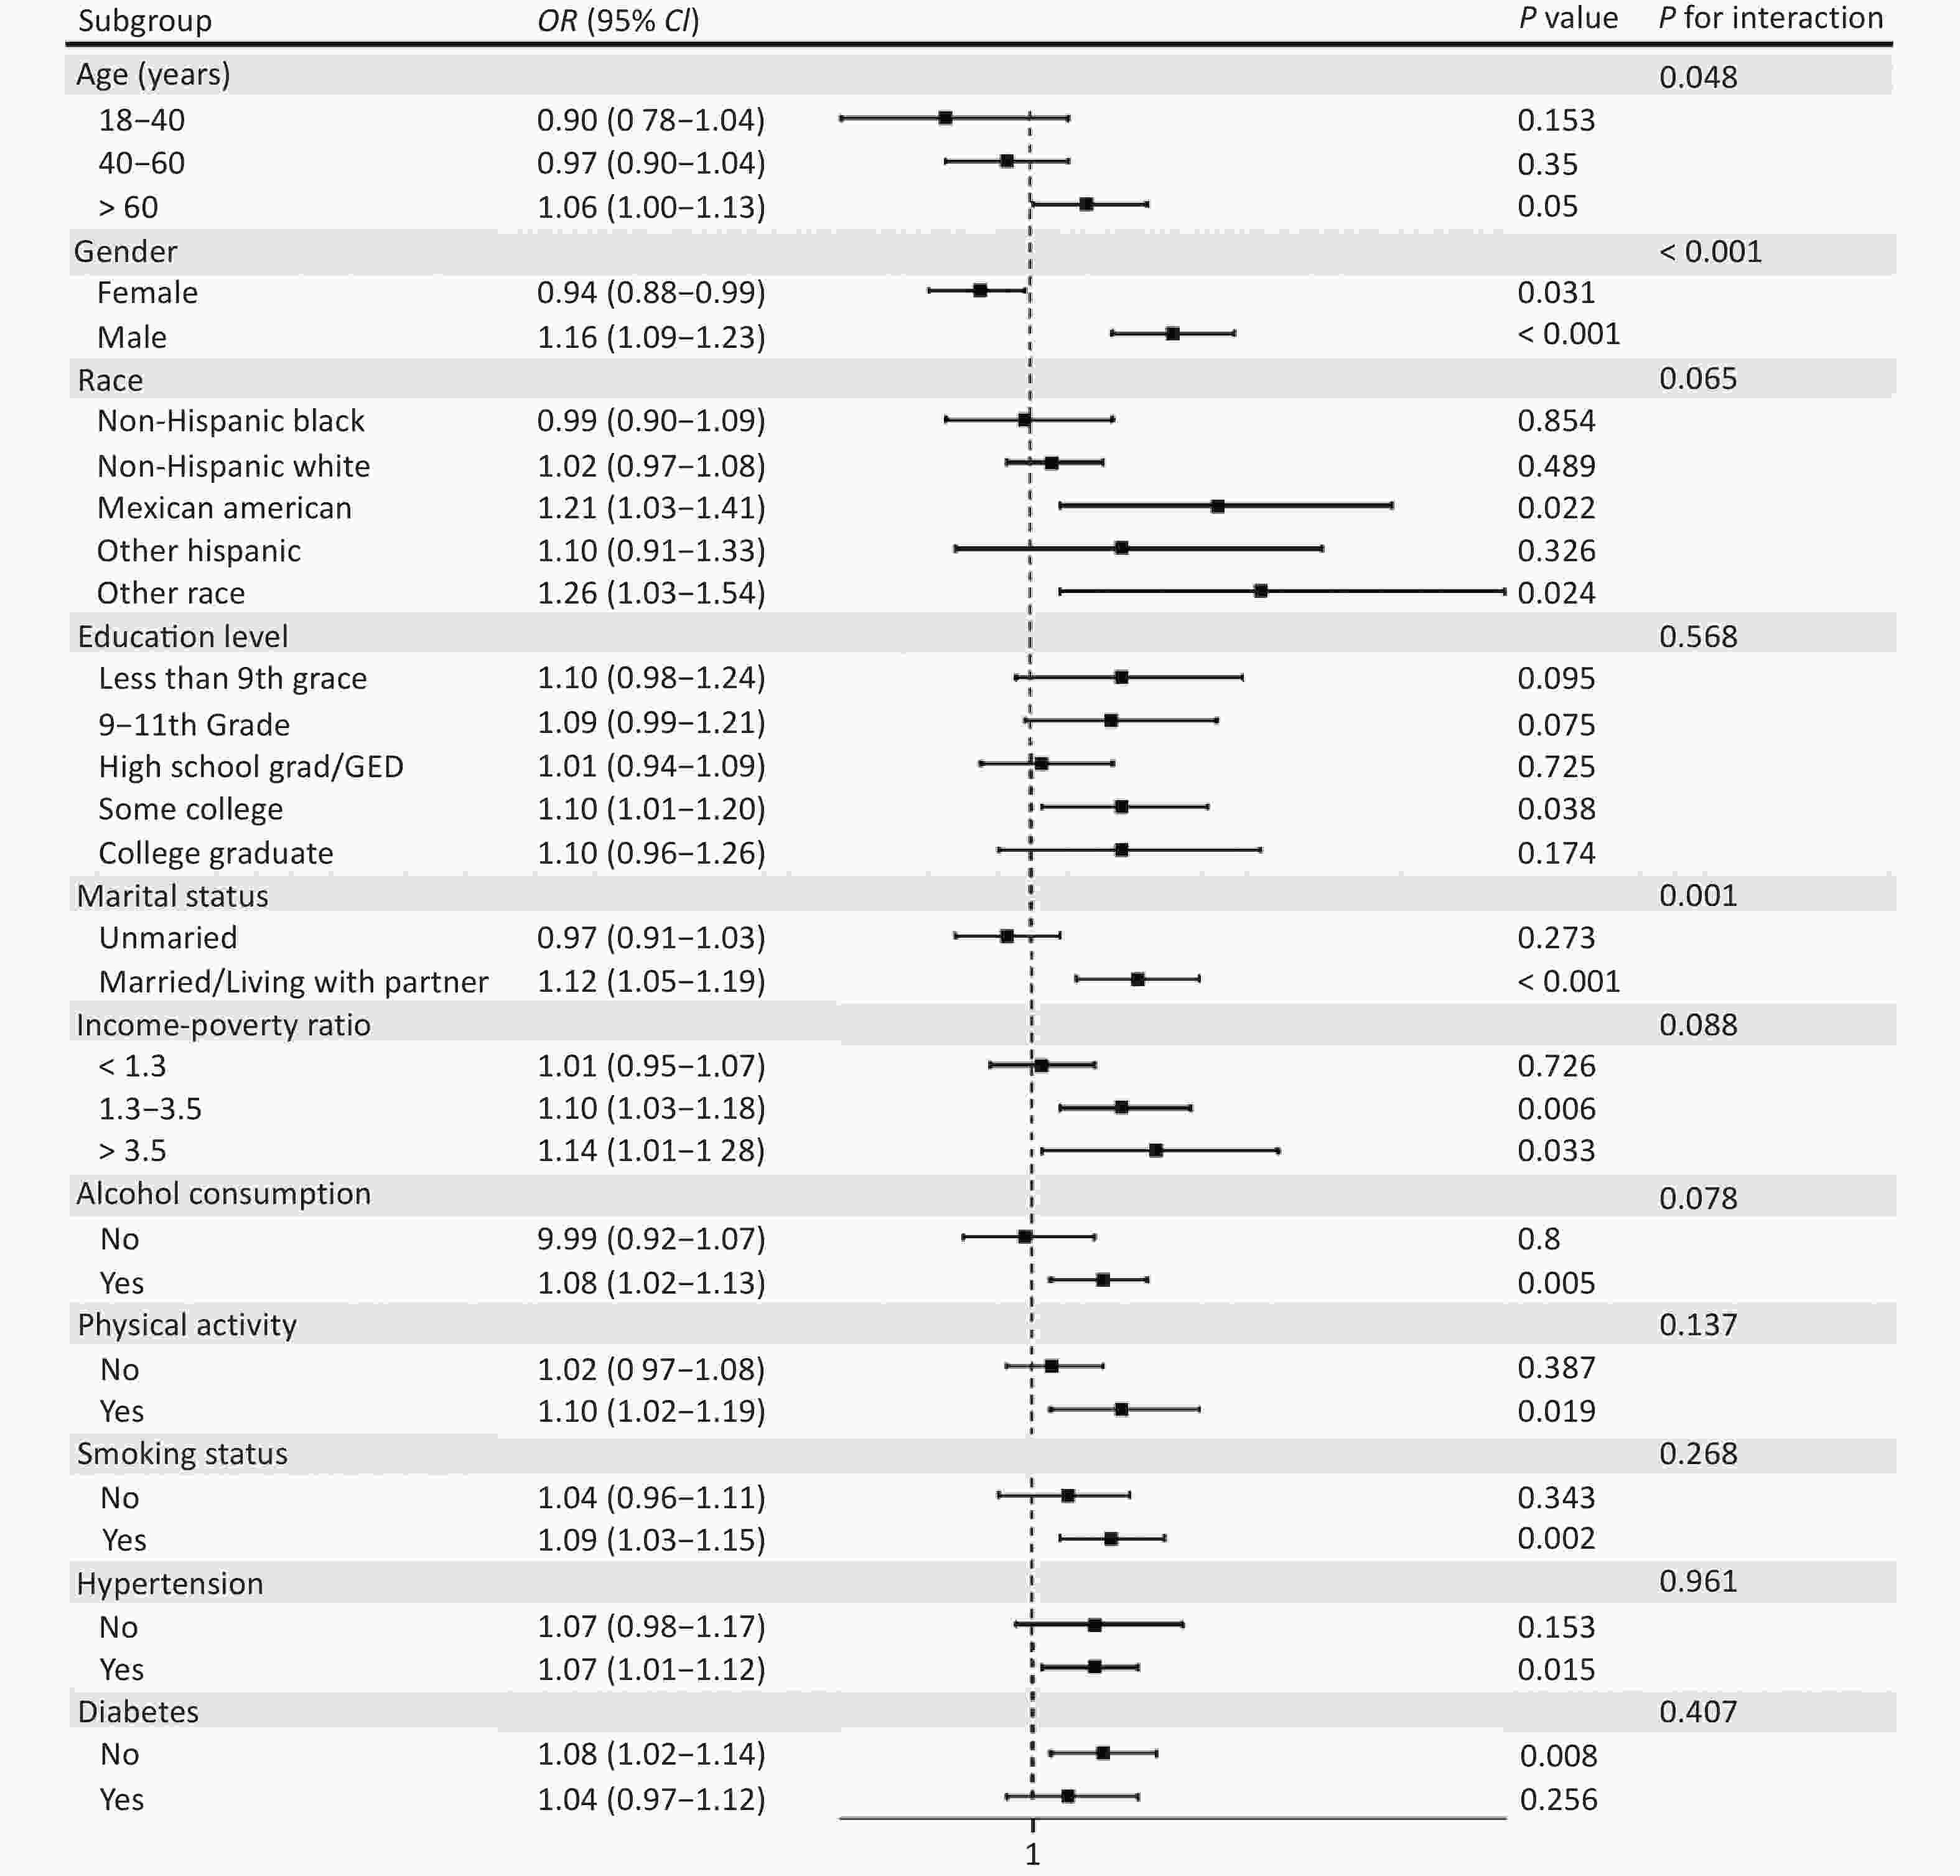
Figure 3. Subgroup analysis of the association between NHHR and stroke. Subgroup of age: 18 ≤ age < 40; 40 ≤ age ≤ 60; > 60.
The results of the sensitivity analyses are presented in Table 3. After excluding participants with hypercholesteremia, the association between NHHR and stroke risk was not significant in the fully adjusted categorical model (P > 0.05). As dyslipidemia is associated with an increased risk of stroke[12], participants with hypercholesteremia may be more prone to stroke, which may explain this inconsistent result. Besides, as a binary variable, NHHR was still significantly associated with an increased risk of stroke (OR 1.24, 95% CI 1.02–1.50, P = 0.026) in the fully adjusted model.
Table 3. Sensitivity analyses
Sensitivity analyses OR (95% CI) P value P for trend Excluding participants with hypercholesteremia 0.91 Q1 1 (Ref.) Q2 1.27 (0.97−1.67) 0.08 Q3 1.15 (0.88−1.50) 0.31 Q4 1.04 (0.80−1.36) 0.77 NHHR ≤ 2.67 1 (Ref.) > 2.67 1.24 (1.02−1.50) 0.026 Note. Adjusted for age, gender, race, marital status, income−poverty ratio, education level, physical activity, smoking status, alcohol consumption, diabetes, and hypertension. -
In this cross-sectional study using NHANES data, we observed a significant association between the NHHR and stroke risk among adults in the USA. These findings suggest that the NHHR may be a useful predictive marker for stroke risk.
The pathophysiological rationale behind this association can be linked to the role of lipoproteins in atherosclerosis[28,29]. Non-HDL cholesterol includes all atherogenic apolipoprotein B-containing lipoproteins and has been found in several studies to be more strongly associated with cardiovascular risk than LDL cholesterol alone[30,31]. Conversely, HDL cholesterol plays a protective role in atherosclerosis by facilitating the removal of cholesterol from the body[32,33]. Thus, a higher NHHR represents a higher number of atherogenic particles relative to protective ones, which could potentially lead to a higher incidence of atherosclerotic events such as stroke.
Our findings are consistent with those of previous studies that documented a strong association between lipid profiles and stroke risk [34,35]. This corroborated evidence comes from a diverse range of studies, encompassing both epidemiological investigations and clinical trials, which have identified atherogenic lipids and lipoproteins as important modifiable risk factors for stroke[36-38]. For example, increased low-density lipoprotein cholesterol (LDL-C), total cholesterol, and triglyceride levels, along with decreased high-density lipoprotein cholesterol (HDL-C) levels have all been linked to increased stroke incidence.
Nonetheless, our study highlights a potentially more potent prognostic marker, the NHHR. This ratio captures the balance between atherogenic, or bad cholesterol (non-HDL-C), and the protective, or good cholesterol (HDL-C) levels. We may obtain more thorough knowledge of the body’s total cholesterol metabolism by examining the ratio of these two forms of cholesterol. Although specific lipid indicators are important for assessing the risk of stroke, separate assessments may not account for the combined impact of protective and atherogenic lipoproteins on the pathogenicity of cholesterol metabolism. Therefore, it is possible to speculate that the NHHR provides a more comprehensive evaluation and may be a better predictor of stroke risk than the individual lipid markers.
This study has several advantages. First, our research findings have a considerable degree of generalizability owing to the participation of a diverse, nationally representative sample of American people. We may reliably generalize these findings to a broader scale by incorporating a wide cross-section of the population, and we suggest that the tendencies found would hold true in American adult communities that are comparable to these. Second, our work was far more rigorous because we followed NHANES standards for data collection and analysis. These techniques are well known for their accuracy in gathering health data and have been carefully crafted. By implementing these standardized techniques, bias and mistakes can be reduced, thereby strengthening dependability
Our study has limitations that should be considered when interpreting the results. As this was a cross-sectional study, we could not establish a causal relationship between the NHHR and stroke. In addition, the data on stroke diagnosis came from patients’ self-reports, which are prone to recall bias. Furthermore, the NHANES did not include institutionalized or hospitalized individuals, which may have limited the representativeness of our study. There may also be residual confounding factors from unmeasured or inadequately measured factors. Nonetheless, its important to note that, while the NHHR seems promising based on our data, further research is required to thoroughly assess its practical applicability, considering other variables that might influence these cholesterol types and thus the NHHR. This supports the validation of NHHR as a potentially more effective predictor of stroke risk.
doi: 10.3967/bes2025.001
Association between Non-high-density Lipoprotein Cholesterol to High-density Lipoprotein Cholesterol Ratio (NHHR) and Stroke among Adults in the USA: A Cross-Sectional NHANES Study
-
Abstract:
Objective The relationship between non-high-density lipoprotein (NHDL) cholesterol to high-density lipoprotein cholesterol (HDL-C) ratio (NHHR) and stoke remains unknown. This study aimed to evaluate the association between the adult NHHR and stroke occurrence in the United States of America (USA). Methods To clarify the relationship between the NHHR and stroke risk, this study used a multivariable logistic regression model and a restricted cubic spline (RCS) model to investigate the association between the NHHR and stroke, and data from the National Health and Nutrition Examination Survey (NHANES) from 2005 to 2018. Subgroup and sensitivity analyses were conducted to test the robustness of the results. Results This study included 29,928 adult participants, of which 1,165 participants had a history of stroke. Logistic regression analysis of variables demonstrated a positive association between NHHR and stroke (OR 1.24, 95% CI: 1.03–1.50, P = 0.026). Compared with the lowest reference group of NHHR, participants in the second, third, and fourth quartile had a significantly increased risk of stroke after full adjustments (OR: 1.35, 95% CI: 1.08–1.69) (OR: 1.83, 95% CI: 1.42–2.36) (OR: 2.04, 95% CI: 1.50–2.79). In the total population, a nonlinear dose-response relationship was observed between the NHHR and stroke risk (P non-linearity = 0.002). This association remained significant in several subgroup analyses. Further investigation of the NHHR may enhance our understanding of stroke prevention and treatment. Conclusion Our findings suggest a positive correlation between the NHHR and an increased prevalence of stroke, potentially serving as a novel predictive factor for stroke. Timely intervention and management of the NHHR may effectively mitigate stroke occurrence. Prospective studies are required to validate this association and further explore the underlying biological mechanisms. -
Key words:
- NHHR /
- Stroke /
- NHANES /
- Cross-sectional study
The authors declare no competing interests.
The NHANES are public database. Ethical approval was obtained for all patients in the database. Users can download the relevant data for research and publication purposes.
注释:1) Authors’ Contributions: 2) Competing Interests: 3) Ethics Approval and Consent to Participate: -
Figure 2. The restricted cubic spline curve was used to model the relationship between NHHR and the risk of stroke among all participants. (A) Not adjusted for any covariates; (B) Adjusted for age, gender, race, marital status, income-poverty ratio, and education level; (C) Further adjusted for physical activity, smoking status, alcohol consumption, diabetes, and hypertension.
Figure 3. Subgroup analysis of the association between NHHR and stroke. Subgroup of age: 18 ≤ age < 40; 40 ≤ age ≤ 60; > 60.
Table 1. Characteristics of participants
Variable Overall (n = 29,928) Non-stroke (n = 28,763) Stroke (n = 1,165) P value Age (years) 47 (20−85) 46 (20−85) 67 (20−85) < 0.001 Gender 0.009 Female 15,191 (51.15%) 14,604 (50.99%) 587 (56.56%) Male 14,737 (48.85%) 14,159 (49.01%) 578 (43.44%) Race < 0.001 Non-Hispanic Black 6,123 (10.27%) 5,814 (10.17%) 309 (13.74%) Non-Hispanic White 13,420 (69.51%) 12,812 (69.45%) 608 (71.72%) Mexican American 4,578 (8.05%) 4,472 (8.16%) 106 (4.42%) Other Hispanic 2,707 (5.08%) 2,641 (5.15) 66 (2.84) Other Race 3,100 (7.08) 3,024 (7.07) 76 (7.29) Education level < 0.001 Less Than 9th Grade 2,882 (4.85) 2,715 (4.72) 167 (9.27) 9−11th Grade 4,151 (10.22) 3,932 (10.06) 219 (15.67) High School Grad/GED 6,900 (23.24) 6,576 (23.02) 324 (31.04) Some College 8,990 (31.75) 8,683 (31.92) 307 (25.93) College Graduate 7,005 (29.94) 6,857 (30.29) 148 (18.09) Marital status 0.003 Married/Living with partner 11,925 (35.89) 11,367 (35.72) 558 (41.63) Unmarried 18,003 (64.11) 17,396 (64.28) 607 (58.37) Income-poverty ratio < 0.001 < 1.3 9,236 (20.62) 8,777 (20.30) 459 (31.39) 1.3−3.5 11,404 (35.92) 10,902 (35.63) 502 (45.85) > 3.5 9,288 (43.46) 9,084 (44.07) 204 (22.76) Physical activity < 0.001 Inactive 16,578 (50.02) 15,780 (54.86) 798 (66.69) Active 13,350 (49.51) 12,983 (49.98) 367 (33.31) Smoking status < 0.001 Yes 13,581 (45.25) 12,866 (44.83) 715 (59.38) No 16,347 (54.75) 15,897 (55.17) 450 (40.62) Alcohol consumption 0.001 Yes 22,225 (79.58) 21,411 (79.80) 814 (72.07) No 7,703 (20.42) 7,352 (20.20) 351 (27.93) Hypertension < 0.001 Yes 10,821 (32.11) 9,920 (30.83) 901 (75.43) No 19,107 (67.89) 18,843 (69.17) 264 (24.57) Diabetes < 0.001 Yes 3,857 (9.57) 3,463 (8.94) 394 (30.95) No 26,071 (90.43) 25,300 (91.06) 771 (69.05) TC (mg/dL) 137 (23−754) 137 (23−754) 128 (42−397) < 0.001 HDL−C (mg/dL) 51 (6−226) 51 (6−226) 49 (11−156) 0.006 NHHR 2.66 (0.28−27) 2.57 (0.51−13.85) 2.67 (0.28−27) 0.011 Note. TC, total cholesterol; HDL-C, high-density lipoprotein cholesterol; NHHR, nonhigh-density lipoprotein cholesterol to high-density lipoprotein cholesterol ratio.  下载: 导出CSV
Table 2. Association between NHHR and stroke among American adults in NHANES 2005–2018
Outcomes Continuous models Categorical model OR P value R2* (%) Q1 Q2 Q3 Q4 Ptrend Model 1 1.15 (1.05−1.26) 0.003 0.13 1 (Ref.) 1.20 (0.91−1.57) 1.40 (0.97−2.02) 1.29 (0.76−2.20) 0.018 Model 2 1.11 (1.02−1.22) 0.019 13.69 1 (Ref.) 1.44 (1.15−1.81) 1.85 (1.44−2.39) 1.93 (1.43−2.61) < 0.001 Model 3 1.24 (1.03−1.50) 0.026 17.74 1 (Ref.) 1.35 (1.08−1.69) 1.83 (1.42−2.36) 2.04 (1.50−2.79) < 0.001 Note. Model 1 did not adjust for any potential confounders; Model 2 adjusted for demographic factors including age, gender, race, marital status, income−poverty ratio, and education level; Model 3 further adjusted for physical activity, smoking status, alcohol consumption, diabetes, and hypertension based on Model 2. *Goodness−of−fit results. The goodness of fit results showed that Model 3 (R2 = 17.46%) has a better predictive ability than the other models.
下载: 导出CSV
Table 3. Sensitivity analyses
Sensitivity analyses OR (95% CI) P value P for trend Excluding participants with hypercholesteremia 0.91 Q1 1 (Ref.) Q2 1.27 (0.97−1.67) 0.08 Q3 1.15 (0.88−1.50) 0.31 Q4 1.04 (0.80−1.36) 0.77 NHHR ≤ 2.67 1 (Ref.) > 2.67 1.24 (1.02−1.50) 0.026 Note. Adjusted for age, gender, race, marital status, income−poverty ratio, education level, physical activity, smoking status, alcohol consumption, diabetes, and hypertension.
下载: 导出CSV
-
[1] Thayabaranathan T, Kim J, Cadilhac DA, et al. Global stroke statistics 2022. Int J Stroke, 2022; 17, 946−56. doi: 10.1177/17474930221123175 [2] Tsao CW, Aday AW, Almarzooq ZI, et al. Heart disease and stroke statistics—2023 update: a report from the american heart association. Circulation, 2023; 147, e93−e621. [3] Tan SML, Ong SH, Yeo TT, et al. Ischemic and hemorrhagic strokes in young adults: comparison of functional outcomes and return to work after stroke. Clin Neurol Neurosurg, 2023; 233, 107964. doi: 10.1016/j.clineuro.2023.107964 [4] Mohr JP, Albers GW, Amarenco P, et al. American heart association prevention conference. IV. Prevention and rehabilitation of stroke. Etiology of stroke. Stroke, 1997; 28, 1501−6. doi: 10.1161/01.STR.28.7.1501 [5] Meschia JF, Bushnell C, Boden-Albala B, et al. Guidelines for the primary prevention of stroke: a statement for healthcare professionals from the American Heart Association/American Stroke Association. Stroke, 2014; 45, 3754−832. doi: 10.1161/STR.0000000000000046 [6] Qi WW, Ma J, Guan TJ, et al. Risk factors for incident stroke and its subtypes in China: a prospective study. J Am Heart Assoc, 2020; 9, e016352. doi: 10.1161/JAHA.120.016352 [7] Migdady I, Russman A, Buletko AB. Atrial fibrillation and ischemic stroke: a clinical review. Semin Neurol, 2021; 41, 348−64. doi: 10.1055/s-0041-1726332 [8] Lee SH. Symptoms and signs of hemorrhagic stroke. In: Lee SH. Stroke Revisited: Hemorrhagic Stroke. Springer. 2018, 103-8. [9] Campbell BCV, De Silva DA, Macleod MR, et al. Ischaemic stroke. Nat Rev Dis Primers, 2019; 5, 70. doi: 10.1038/s41572-019-0118-8 [10] Zhang K, Loong SSE, Yuen LZH, et al. Genetics in ischemic stroke: current perspectives and future directions. J Cardiovasc Dev Dis, 2023; 10, 495. [11] Wazir M, Olanrewaju OA, Yahya M, et al. Lipid disorders and cardiovascular risk: a comprehensive analysis of current perspectives. Cureus, 2023; 15, e51395. [12] Alloubani A, Nimer R, Samara R. Relationship between hyperlipidemia, cardiovascular disease and stroke: a systematic review. Curr Cardiol Rev, 2021; 17, e051121189015. [13] Lin WH, Luo SY, Li W, et al. Association between the non-HDL-cholesterol to HDL- cholesterol ratio and abdominal aortic aneurysm from a Chinese screening program. Lipids Health Dis, 2023; 22, 187. doi: 10.1186/s12944-023-01939-4 [14] Wang K, Shan SS, Zheng HB, et al. Non-HDL-cholesterol to HDL-cholesterol ratio is a better predictor of new-onset non-alcoholic fatty liver disease than non-HDL-cholesterol: a cohort study. Lipids Health Dis, 2018; 17, 196. doi: 10.1186/s12944-018-0848-8 [15] Chiu H, Wu PY, Huang JC, et al. There is a U shaped association between non high density lipoprotein cholesterol with overall and cardiovascular mortality in chronic kidney disease stage 3-5. Sci Rep, 2020; 10, 12749. doi: 10.1038/s41598-020-69794-2 [16] Zuo PY, Chen XL, Liu YW, et al. Non-HDL-cholesterol to HDL-cholesterol ratio as an independent risk factor for the development of chronic kidney disease. Nutr Metab Cardiovasc Dis, 2015; 25, 582−7. doi: 10.1016/j.numecd.2015.03.003 [17] Flores-Guerrero JL, Been RA, Shalaurova I, et al. Triglyceride/HDL cholesterol ratio and lipoprotein insulin resistance score: associations with subclinical atherosclerosis and incident cardiovascular disease. Clin Chim Acta, 2024; 553, 117737. doi: 10.1016/j.cca.2023.117737 [18] Hou KG, Song WP, He J, et al. The association between non-high-density lipoprotein cholesterol to high-density lipoprotein cholesterol ratio (NHHR) and prevalence of periodontitis among US adults: a cross-sectional NHANES study. Sci Rep, 2024; 14, 5558. doi: 10.1038/s41598-024-56276-y [19] Qing GW, Deng WP, Zhou YX, et al. The association between non-high-density lipoprotein cholesterol to high-density lipoprotein cholesterol ratio (NHHR) and suicidal ideation in adults: a population-based study in the United States. Lipids Health Dis, 2024; 23, 17. doi: 10.1186/s12944-024-02012-4 [20] Hong HJ, He YJ, Gong ZQ, et al. The association between non-high-density lipoprotein cholesterol to high-density lipoprotein cholesterol ratio (NHHR) and kidney stones: a cross-sectional study. Lipids Health Dis, 2024; 23, 102. doi: 10.1186/s12944-024-02089-x [21] Qi XY, Wang SJ, Huang QW, et al. The association between non-high-density lipoprotein cholesterol to high-density lipoprotein cholesterol ratio (NHHR) and risk of depression among US adults: a cross-sectional NHANES study. J Affect Disord, 2024; 344, 451−7. doi: 10.1016/j.jad.2023.10.064 [22] Micha R, Peñalvo JL, Cudhea F, et al. Association between dietary factors and mortality from heart disease, stroke, and type 2 diabetes in the United States. JAMA, 2017; 317, 912−24. doi: 10.1001/jama.2017.0947 [23] Yan SY, Sha S, Li SJ, et al. Association between hypertension and stroke in US adults in the National Health and Nutrition Examination Surveys (NHANES) 2007 to 2018. Postgrad Med, 2023; 135, 187−94. doi: 10.1080/00325481.2022.2138470 [24] Jiang SL, Sun MJ, Zhou XY, et al. Association between blood manganese levels and depressive symptoms among US adults: a nationally representative cross-sectional study. J Affect Disord, 2023; 333, 65−71. doi: 10.1016/j.jad.2023.04.032 [25] Civeira F, Arca M, Cenarro A, et al. A mechanism-based operational definition and classification of hypercholesterolemia. J Clin Lipidol, 2022; 16, 813−21. doi: 10.1016/j.jacl.2022.09.006 [26] Chen HL, Wu CW, Cao L, et al. The association between the neutrophil-to-lymphocyte ratio and type 2 diabetes mellitus: a cross-sectional study. BMC Endocr Disord, 2024; 24, 107. doi: 10.1186/s12902-024-01637-x [27] Team DC. DecisionLinnc. 1.0. https://www.statsape.com/, 2023. [28] Lu YZ, Cui XL, Zhang L, et al. The functional role of lipoproteins in atherosclerosis: novel directions for diagnosis and targeting therapy. Aging Dis, 2022; 13, 491−520. doi: 10.14336/AD.2021.0929 [29] Rehberger Likozar A, Zavrtanik M, Šebeštjen M Lipoprotein(a) in atherosclerosis: from pathophysiology to clinical relevance and treatment options. Ann Med, 2020; 52, 162-77. [30] Behbodikhah J, Ahmed S, Elyasi A, et al. Apolipoprotein B and Cardiovascular disease: biomarker and potential therapeutic target. Metabolites, 2021; 11, 690. doi: 10.3390/metabo11100690 [31] Johannesen CDL, Langsted A, Nordestgaard BG, et al. Excess apolipoprotein b and cardiovascular risk in women and men. J Am Coll Cardiol, 2024; 83, 2262−73. [32] Parhofer KG. Increasing HDL-cholesterol and prevention of atherosclerosis: a critical perspective. Atheroscler Suppl, 2015; 18, 109−11. doi: 10.1016/j.atherosclerosissup.2015.02.020 [33] Ouimet M, Barrett TJ, Fisher EA. HDL and reverse cholesterol transport: basic mechanisms and their roles in vascular health and disease. Circ Res, 2019; 124, 1505−18. doi: 10.1161/CIRCRESAHA.119.312617 [34] Gong XX, Chen LW, Song B, et al. Associations of lipid profiles with the risk of ischemic and hemorrhagic stroke: a systematic review and meta-analysis of prospective cohort studies. Front Cardiovasc Med, 2022; 9, 893248. doi: 10.3389/fcvm.2022.893248 [35] Liu YT, Jin XL, Fu KL, et al. Non-traditional lipid profiles and the risk of stroke: a systematic review and meta-analysis. Nutr Metab Cardiovasc Dis, 2023; 33, 698−714. doi: 10.1016/j.numecd.2023.01.003 [36] Holmes MV, Millwood IY, Kartsonaki C, et al. Lipids, lipoproteins, and metabolites and risk of myocardial infarction and stroke. J Am Coll Cardiol, 2018; 71, 620−32. doi: 10.1016/j.jacc.2017.12.006 [37] Pedro-Botet J, Senti M, Nogues X, et al. Lipoprotein and apolipoprotein profile in men with ischemic stroke. Role of lipoprotein(a), triglyceride-rich lipoproteins, and apolipoprotein E polymorphism. Stroke, 1992; 23, 1556−62. doi: 10.1161/01.STR.23.11.1556 [38] Oravec S, Krivošíková Z, Krivošík M, et al. Lipoprotein profile in patients who survive a stroke. Neuro Endocrinol Lett, 2011; 32, 496−501. -

 点击查看大图
计量
- 文章访问数: 9900
- HTML全文浏览量: 4810
- PDF下载量: 144
- 被引次数: 0

 Quick Links