

 下载:
下载:

-
Type 1 diabetes mellitus (T1DM) is a metabolic disease characterized by chronic hyperglycemia, which usually affects children and adolescents. T1DM, which is caused due to insulin insufficiency, is induced by the destruction of pancreatic beta-cells[1]. Globally, T1DM is considered an epidemic and a major threat to public health. In 2017, the International Diabetes Federation (IDF) estimated that approximately 1.1 million children and adolescents had T1DM and that 425 million individuals aged between 20 and 79 years had diabetes worldwide[2].
Good glycemic control is important to prevent the exacerbation of complications related to T1DM[3]. However, the control of hyperglycemia is rarely achieved[4]. Chronic hyperglycemia in diabetes can induce several metabolic signaling pathways, including glucose oxidation pathway, polyol pathway, and biosynthetic pathway of advanced glycation end products (AGEs)[5]. The complications of diabetes are usually developed over time due to the dysfunction and failure of different systems, especially the heart, eyes, kidneys, nerves, and blood vessels[6]. The pathways triggered by hyperglycemia promote the production of reactive oxygen species (ROS) and decrease the levels of antioxidants. These metabolic changes result in microvascular and macrovascular complications in patients with diabetes, which are mainly caused due to the redox imbalance[7,8]. Patients with T1DM exhibit increased plasma and urinary levels of oxidation reaction products, such as lipid peroxidation products and protein carbonylation[9,10].
As oxidative stress and diabetes are correlated[11], several alternative treatments have been investigated to support the conventional disease treatment, such as the use of antioxidant compounds[12-14] and phytotherapeutics or plant extracts[15-18]. Silymarin (SMN) is reported to exhibit antioxidant and anti-inflammatory properties[19-21].
SMN is a natural extract obtained from the fruits and seeds of Silybum marianum, which is popularly known as milk thistle. SMN comprises seven flavonolignans (silybin A, silybin B, isosilybin A, isosilybin B, silychristin, isosilychristin, and silydianin) and the flavonoid taxifolin[22]. SMN is reported to exert hepatoprotective activity and antioxidant effects by inhibiting free radical production during the metabolism of toxic substances[23].
Thus, the antioxidant properties of SMN can be potentially therapeutic for various diseases. This study aimed to evaluate the effect of SMN on the modulation of hepatic and pancreatic redox status and the regulation of metabolism in the alloxan-induced type 1 diabetic rat model.
-
Alloxan (2,4,5,6-tetraoxypyrimidine; 5,6-dioxyuracil) and SMN (#S0292) were purchased from Sigma-Aldrich® (St. Louis, MO, USA). The kits for estimating the levels of triacylglycerol (TAG), creatinine, urea, and glucose were purchased from LABTEST® (Lagoa Santa, MG, Brazil).
-
Thirty-four albino female Fischer rats aged approximately 8-week-old with an average weight of 180 g were procured from the Experimental Nutrition Laboratory of the Nutrition School of Ouro Preto Federal University. The experimental procedure was approved by the Animal Use Ethics Committee (CEUA) from University Federal de Ouro Preto (protocol No. 6474200418). The rats were housed in cages with controlled temperature, luminosity, and humidity. The animals received water and food ad libitum. The rats were then divided into the following four groups: vehicle control group, received 1 mL vehicle (carboxymethylcellulose); diabetic group, received 1 mL of vehicle; DS50 group, received 50 mg/kg body weight/d of SMN; and DS100 group, received 100 mg/kg body weight/d of SMN. After the induction of diabetes was confirmed, SMN solubilized in carboxymethylcellulose was administered by orogastric gavage for 30 consecutive days.
At the end of the experimental period, the animals were anesthetized by Isoforine® (Cristália, Itapira, SP, Brazil) inhalation and euthanized. The blood samples were collected to obtain serum, which was used to perform biochemical analyses. The liver and pancreas were collected and stored at −80 °C to evaluate the activity of the antioxidant enzymes superoxide dismutase (SOD) and catalase (CAT), and the oxidative damage marker carbonylated protein (PC). Additionally, the pancreas sample was stored in 4% formalin solution for histological and immunohistochemical analyses (Supplementary Figure S1, www.besjournal.com).
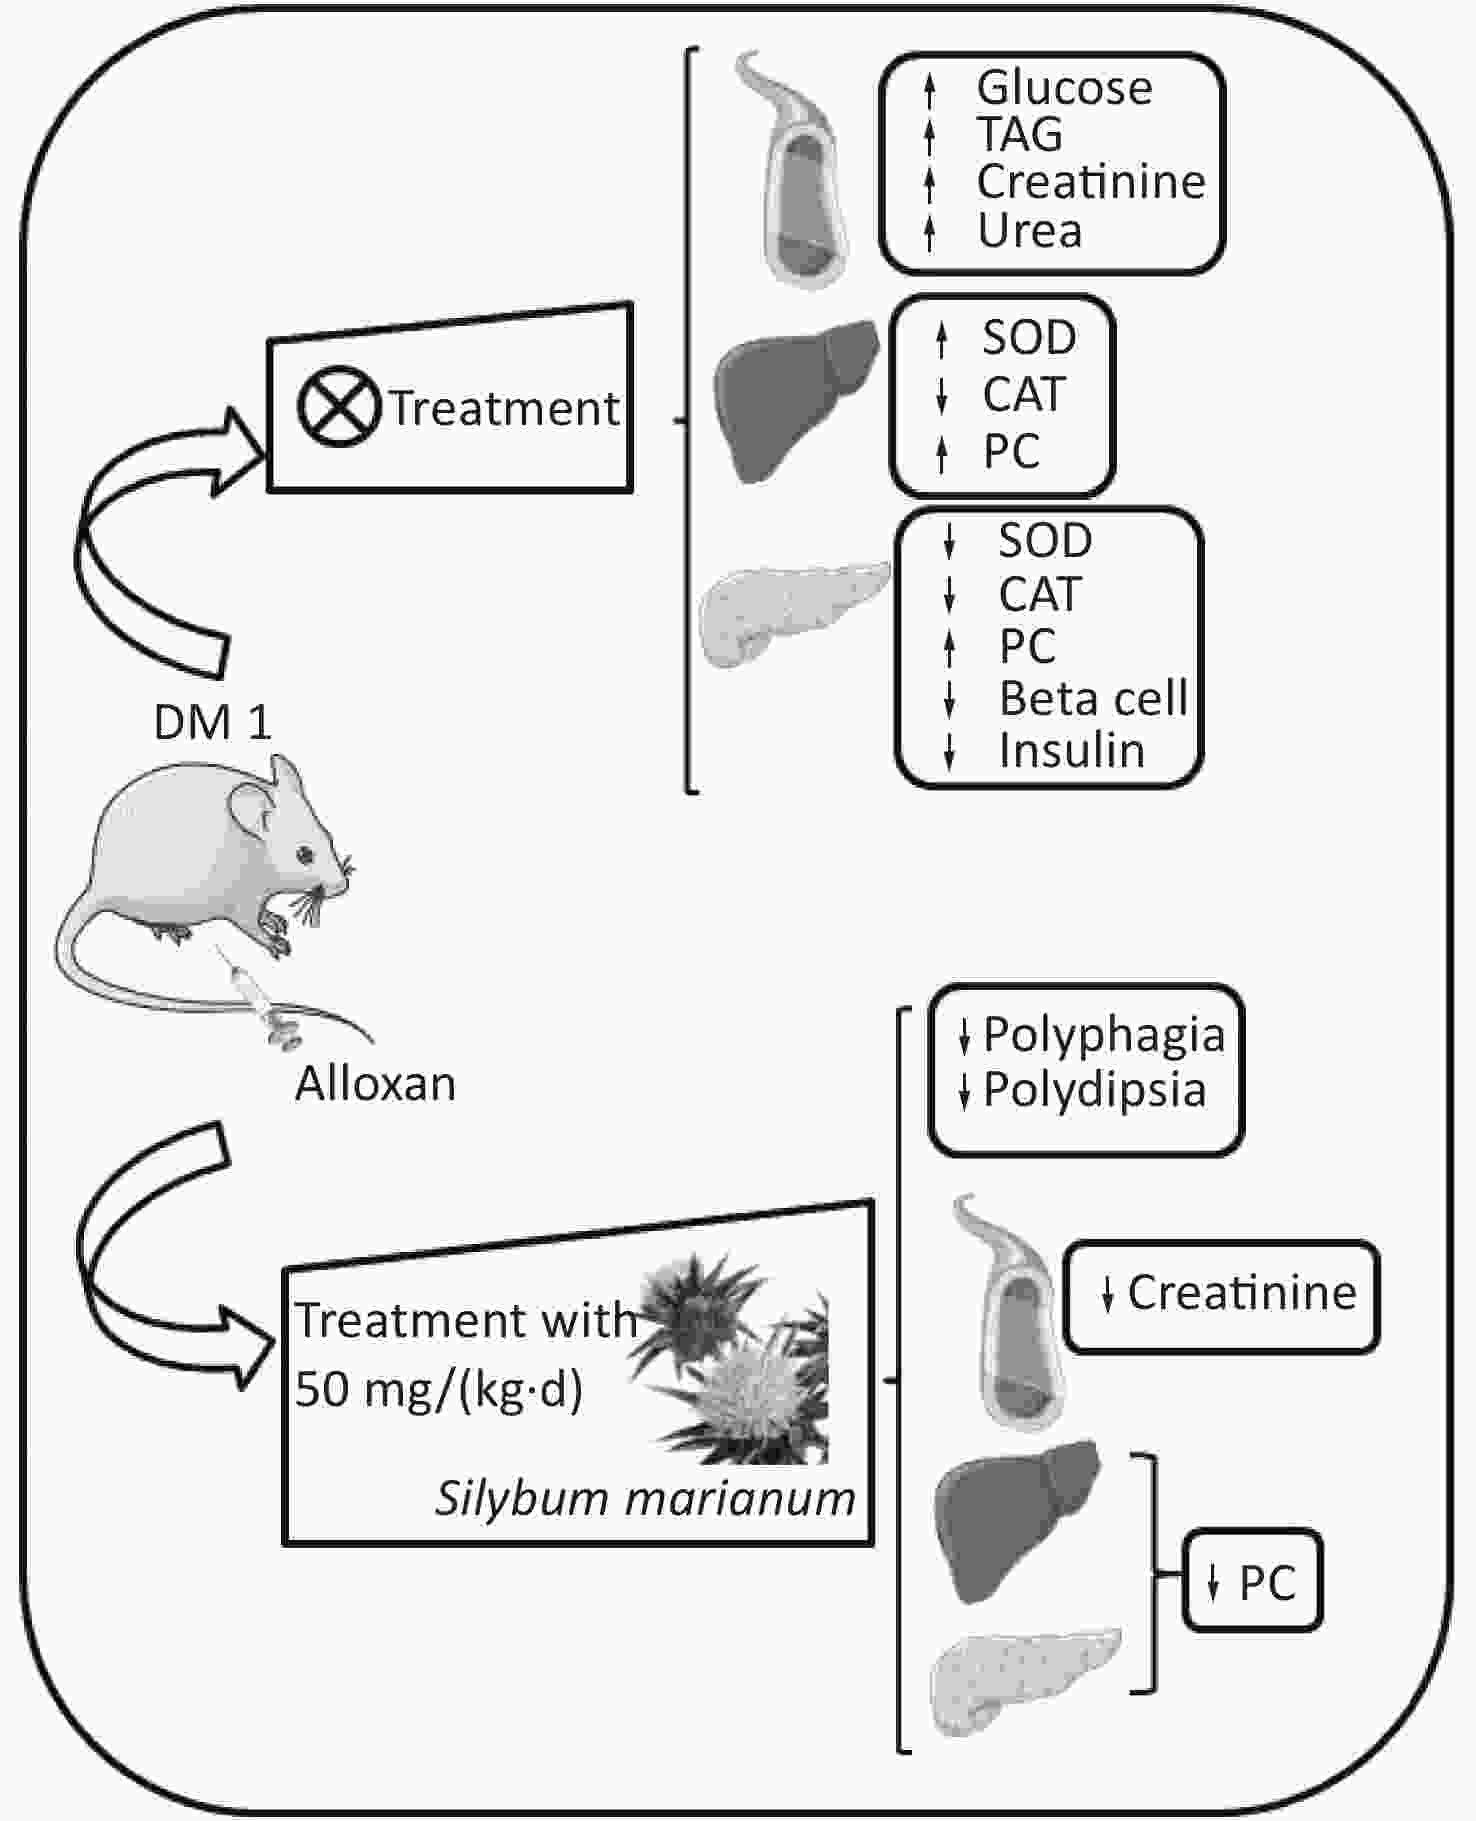
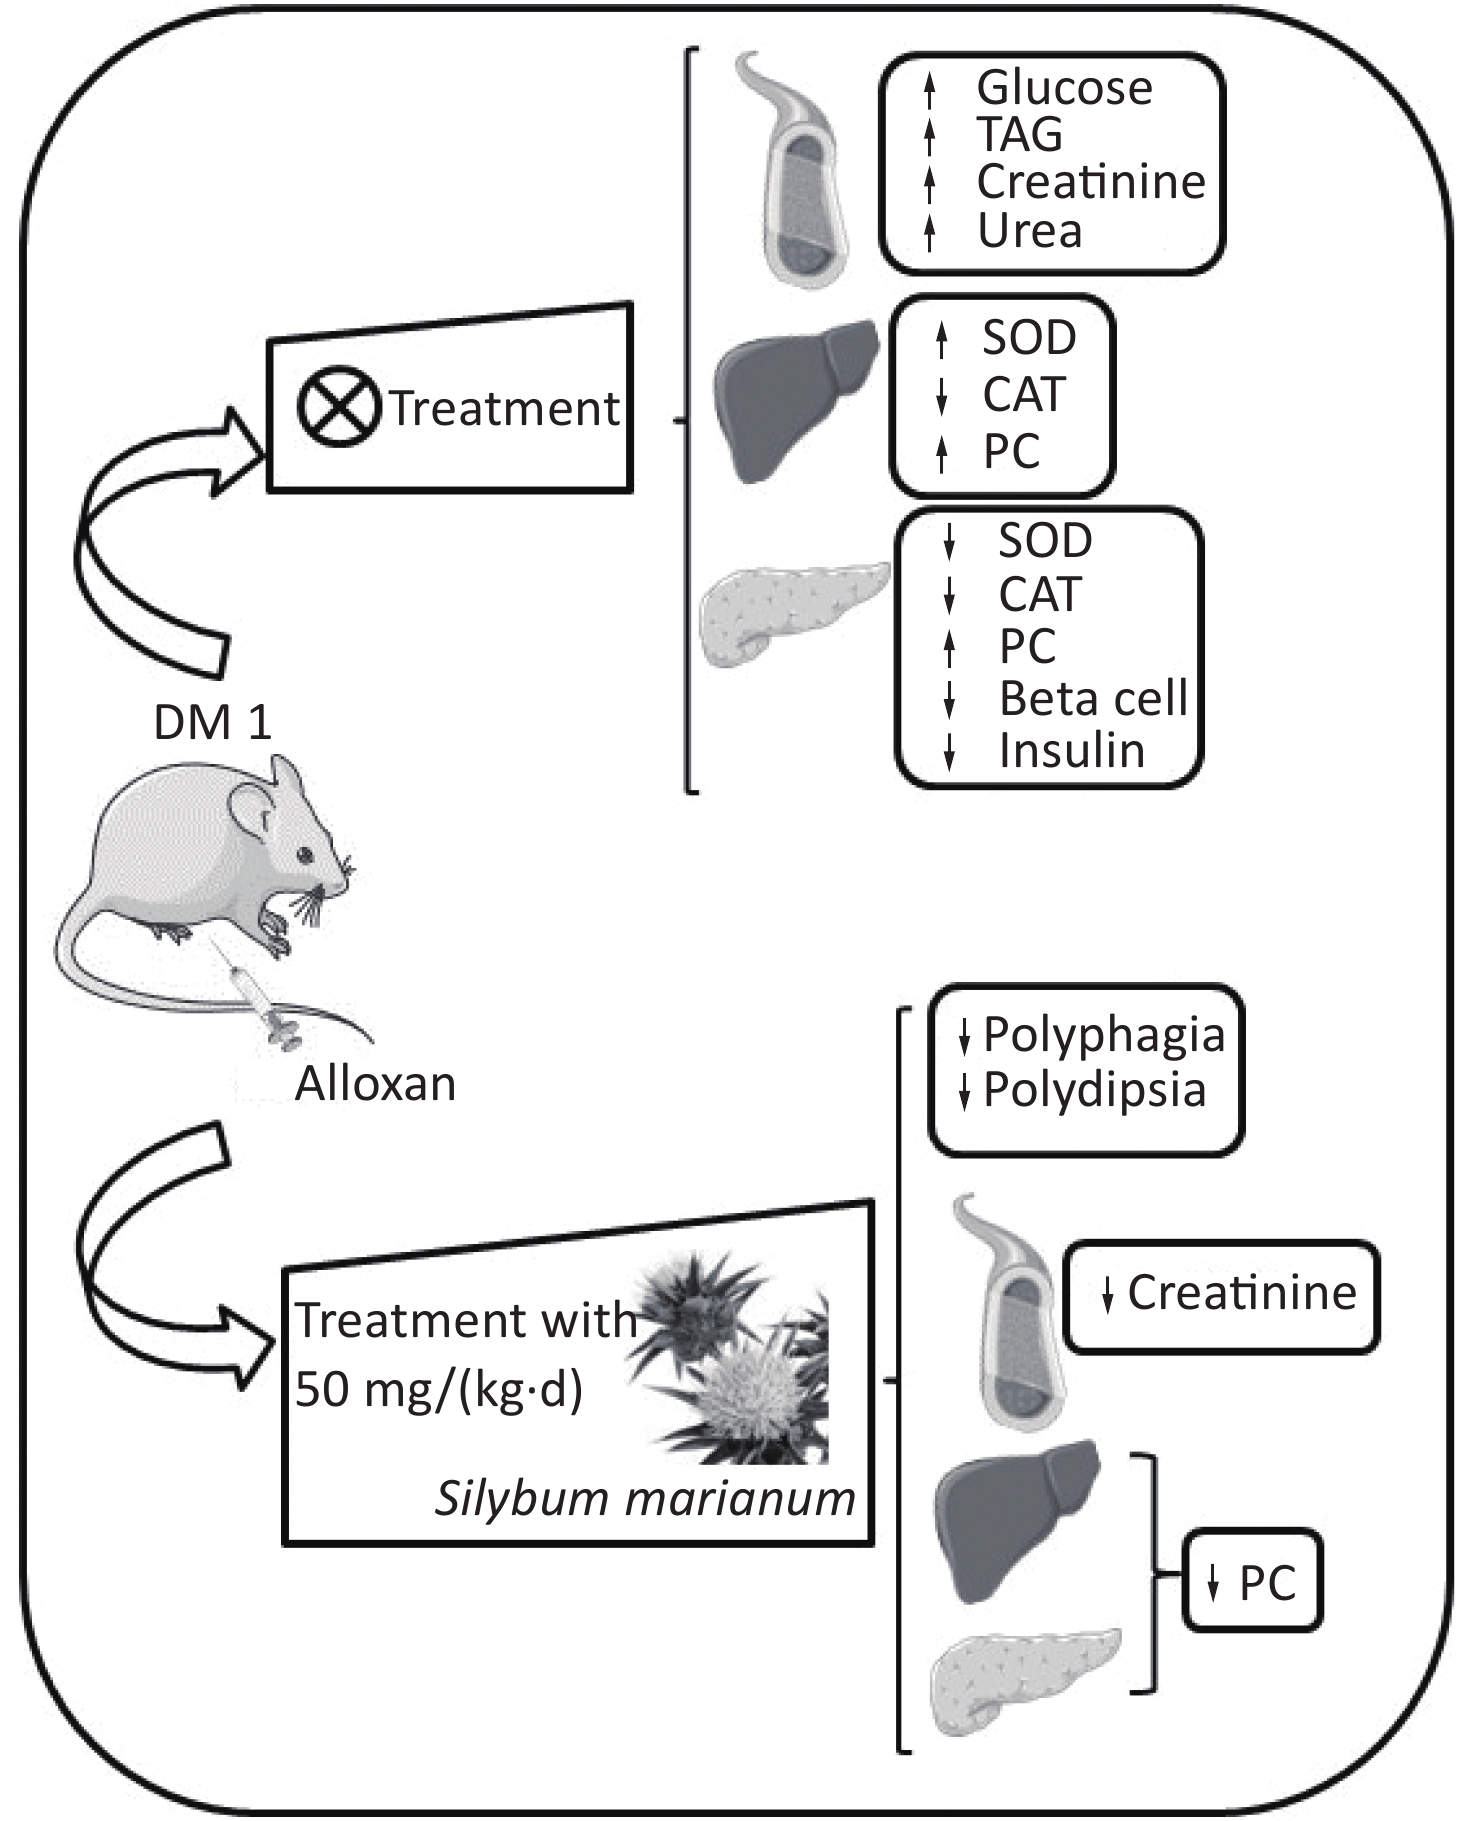
Figure S1. Graphical abstract. SMN treatment reduced polyphagia, polydipsia, enhanced serum creatinine levels, and enhanced hepatic and pancreatic PC levels at both treatment doses in the alloxan-induced type 1 diabetic rat model. ↑, increased; ↓, decreased; TAG, triacylglycerol; PC, carbonylated protein; SMN, silymarin
-
The rats were intraperitoneally injected with alloxan (135 mg/kg body weight) dissolved in 0.2 mL of 0.9% NaCl to induce diabetes. The control animals were intraperitoneally injected with 0.9% NaCl. At day 3 post-alloxan administration, the induction of diabetes was confirmed by analyzing the blood glucose levels. The animals with blood glucose levels above 300 mg/dL (16 mmol/L) were considered diabetic[24,25].
-
The blood samples were collected for biochemical analysis. The serum levels of glucose, TAG, creatinine, and urea were measured using the respective commercial laboratory kits from LABTEST® (Lagoa Santa, MG, Brazil).
-
To determine the activities of SOD and CAT, 100 mg of tissue was homogenized in phosphate buffer (pH 7.2). The indirect SOD activity assay was performed following the methods of Marklund and Marklund [26]. The principle of this assay is based on the competition between SOD and superoxide radical, which is formed due to the self-oxidation of pyrogallol, to reduce 3-[4,5-dimethylthiazol-2-yl]-2, 5-diphenyltetrazolium bromide (MTT) to formazan crystals. The principle of CAT activity assay is based on the ability of CAT to convert hydrogen peroxide (H2O2) into water and molecular oxygen[27].
-
The levels of PC were measured using 2,4-dinitrophenylhydrazine (DNPH), following the methods of Levine et al.[28]. PC reacts with carbonyl groups to generate the corresponding hydrazine that can be spectrophotometrically analyzed. For dosage correction, the protein level was measured by the Lowry method[29].
-
The pancreatic tissue sections were fixed in 4% buffered formalin. The sections were dehydrated in a graded series of alcohol and embedded in paraffin. Subsequently, the samples were sectioned into 4-μm thick sections. The sections were stained with hematoxylin and eosin (H&E). The insulin levels were quantified by immunohistochemical analysis using the primary anti-insulin antibody [# I2018, Sigma-Aldrich® (St. Louis, Mo.)]. The slides were imaged under a light microscope. The total number of islet cells and the insulin immune-positive area were analyzed using ImageJ® (National Institutes of Health, NIH).
-
The normality of the data was analyzed by the Kolmogorov–Smirnov test. The data are expressed as the mean ± standard error of the mean (SEM) or median and interquartile range. The data were analyzed by one-way analysis of variance (ANOVA), followed by Bonferroni post-hoc test for multiple comparisons. All statistical analyses were performed in GraphPad Prism 6.0® for Windows (GraphPad, San Diego, CA, USA). The differences were considered statistically significant when the P-value was less than 0.05.
-
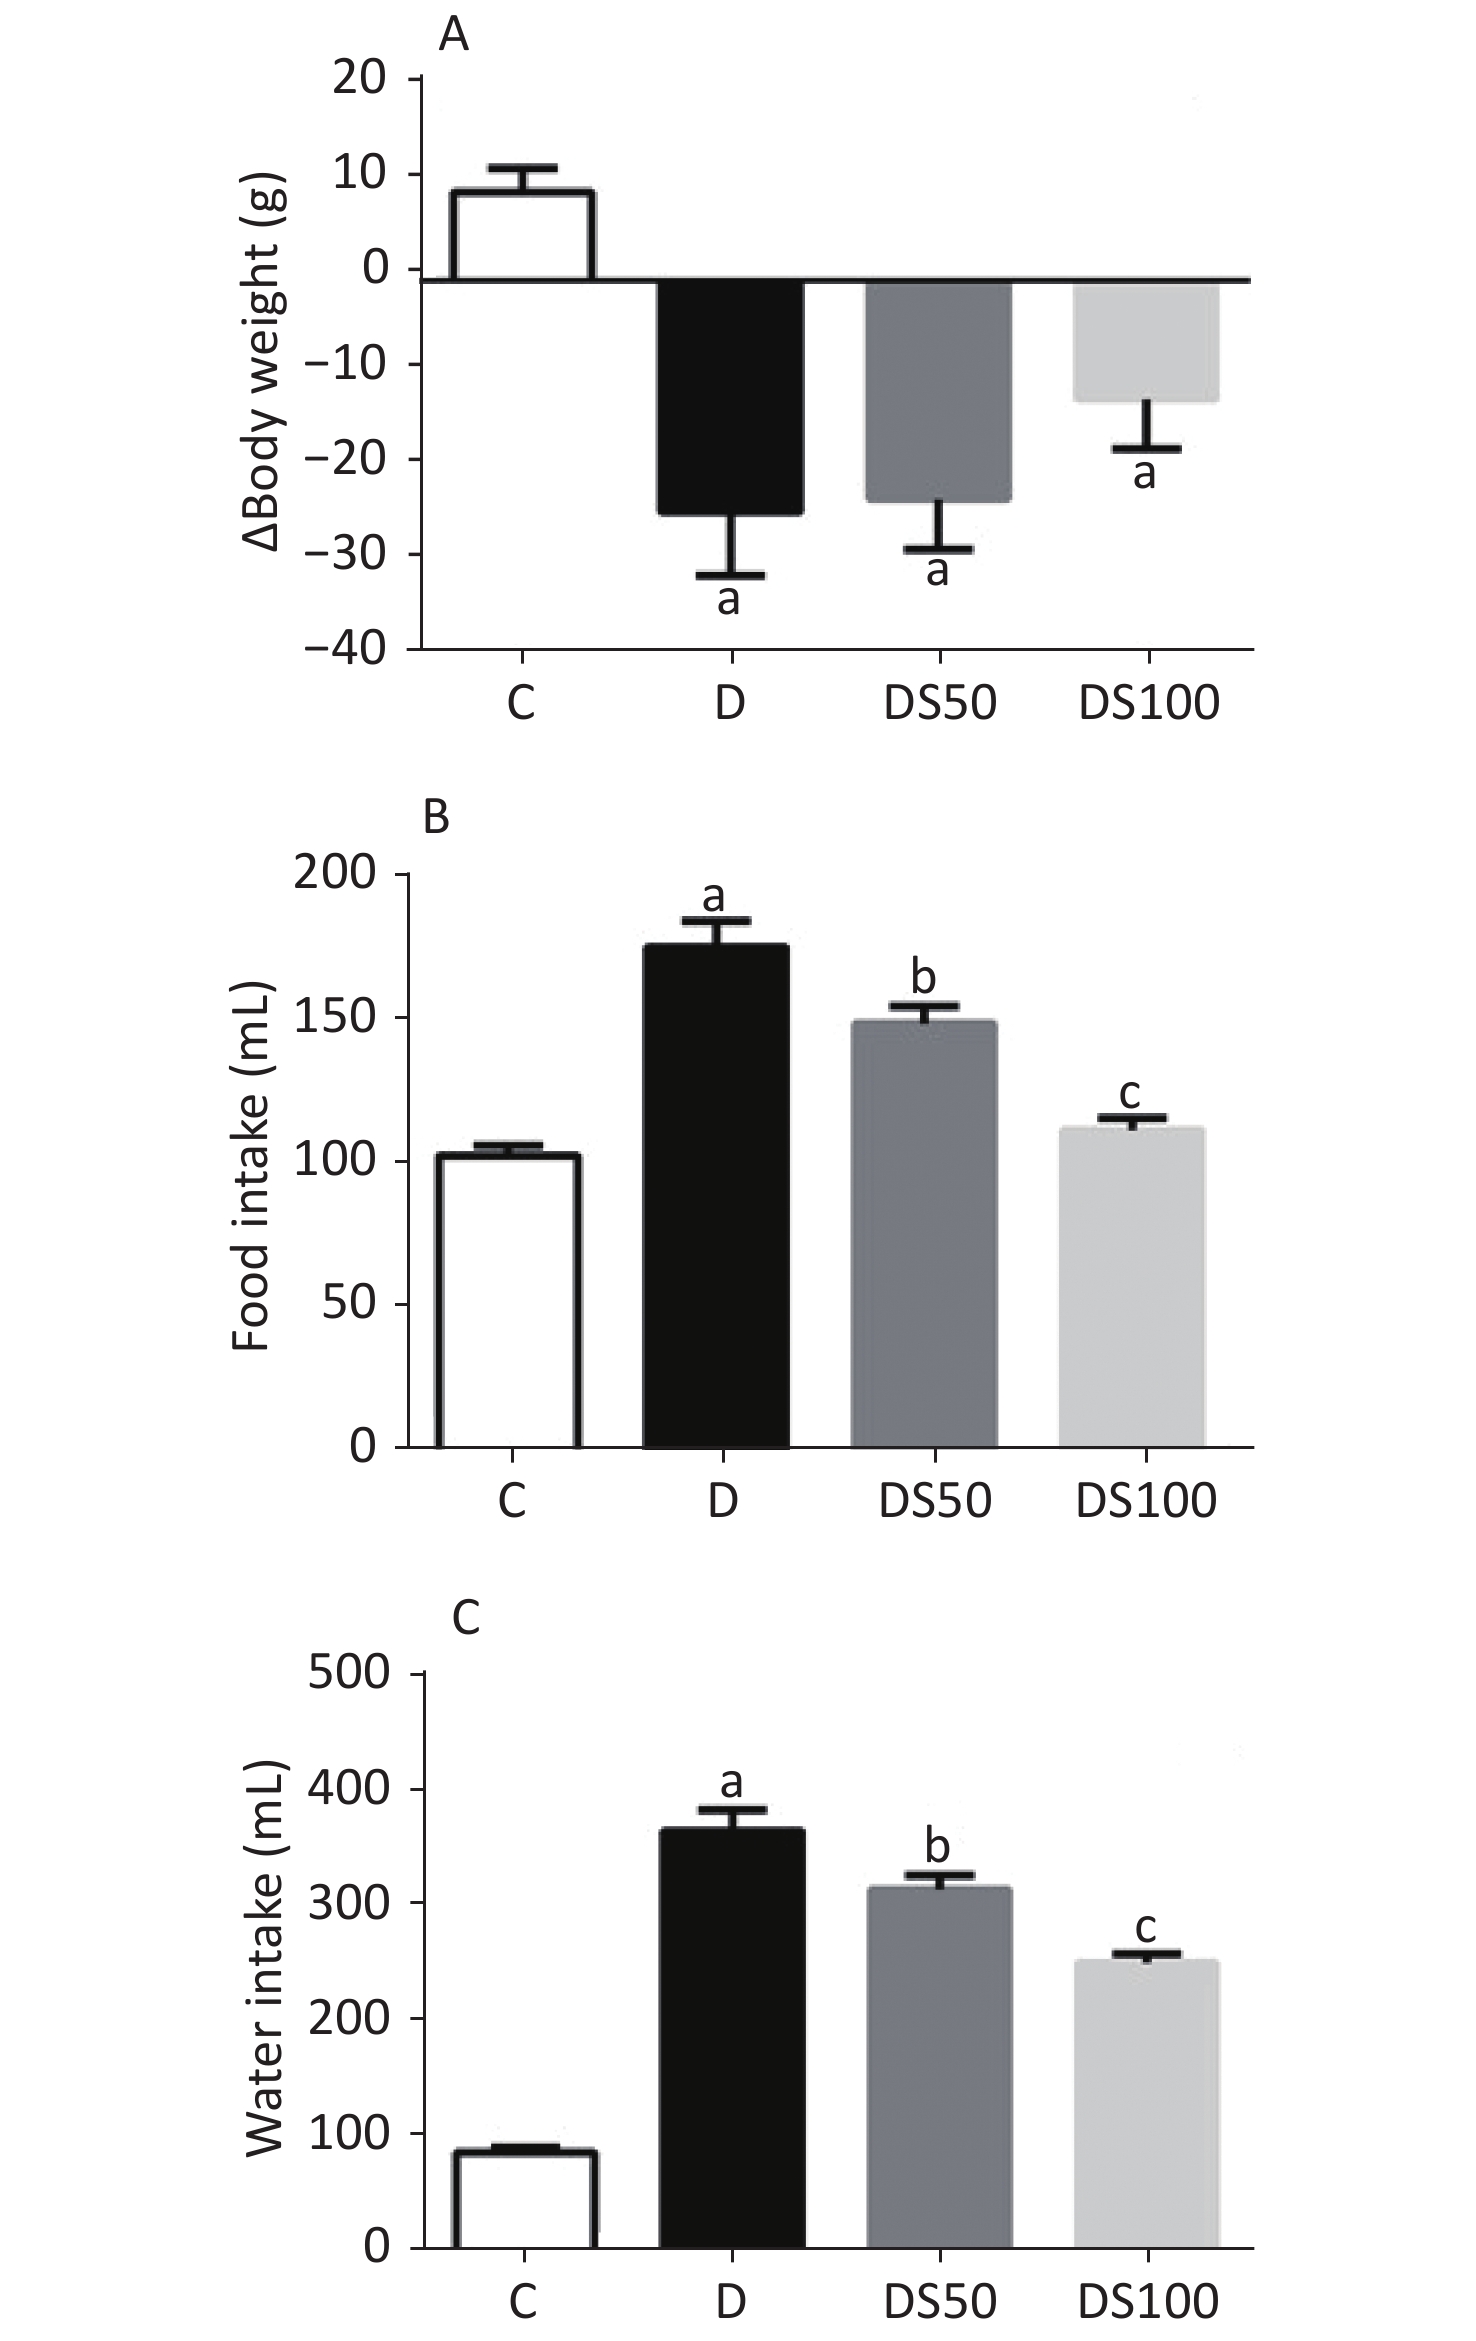
The characteristic symptoms of T1DM are bodyweight loss, polyphagia, and polydipsia. As shown in Figure 1, these symptoms were observed in the diabetic, DS50, and DS100 groups. The diabetic, DS50, and DS100 groups exhibited a higher bodyweight loss than the vehicle control group (Figure 1A). The DS100 group exhibited the lowest loss of bodyweight among the diabetic groups although there was no significant difference in the bodyweight loss between these groups (P > 0.05). As shown in Figures 1B and 1C, the diabetic, DS50, and DS100 groups exhibited a significant increase in food and water intake when compared to the vehicle control group. Compared to the diabetic group, the DS50 and DS100 groups exhibited a decrease in the food and water intake. The food intake of DS100 group was similar to that of vehicle control group (Figure 1B) (P > 0.05).
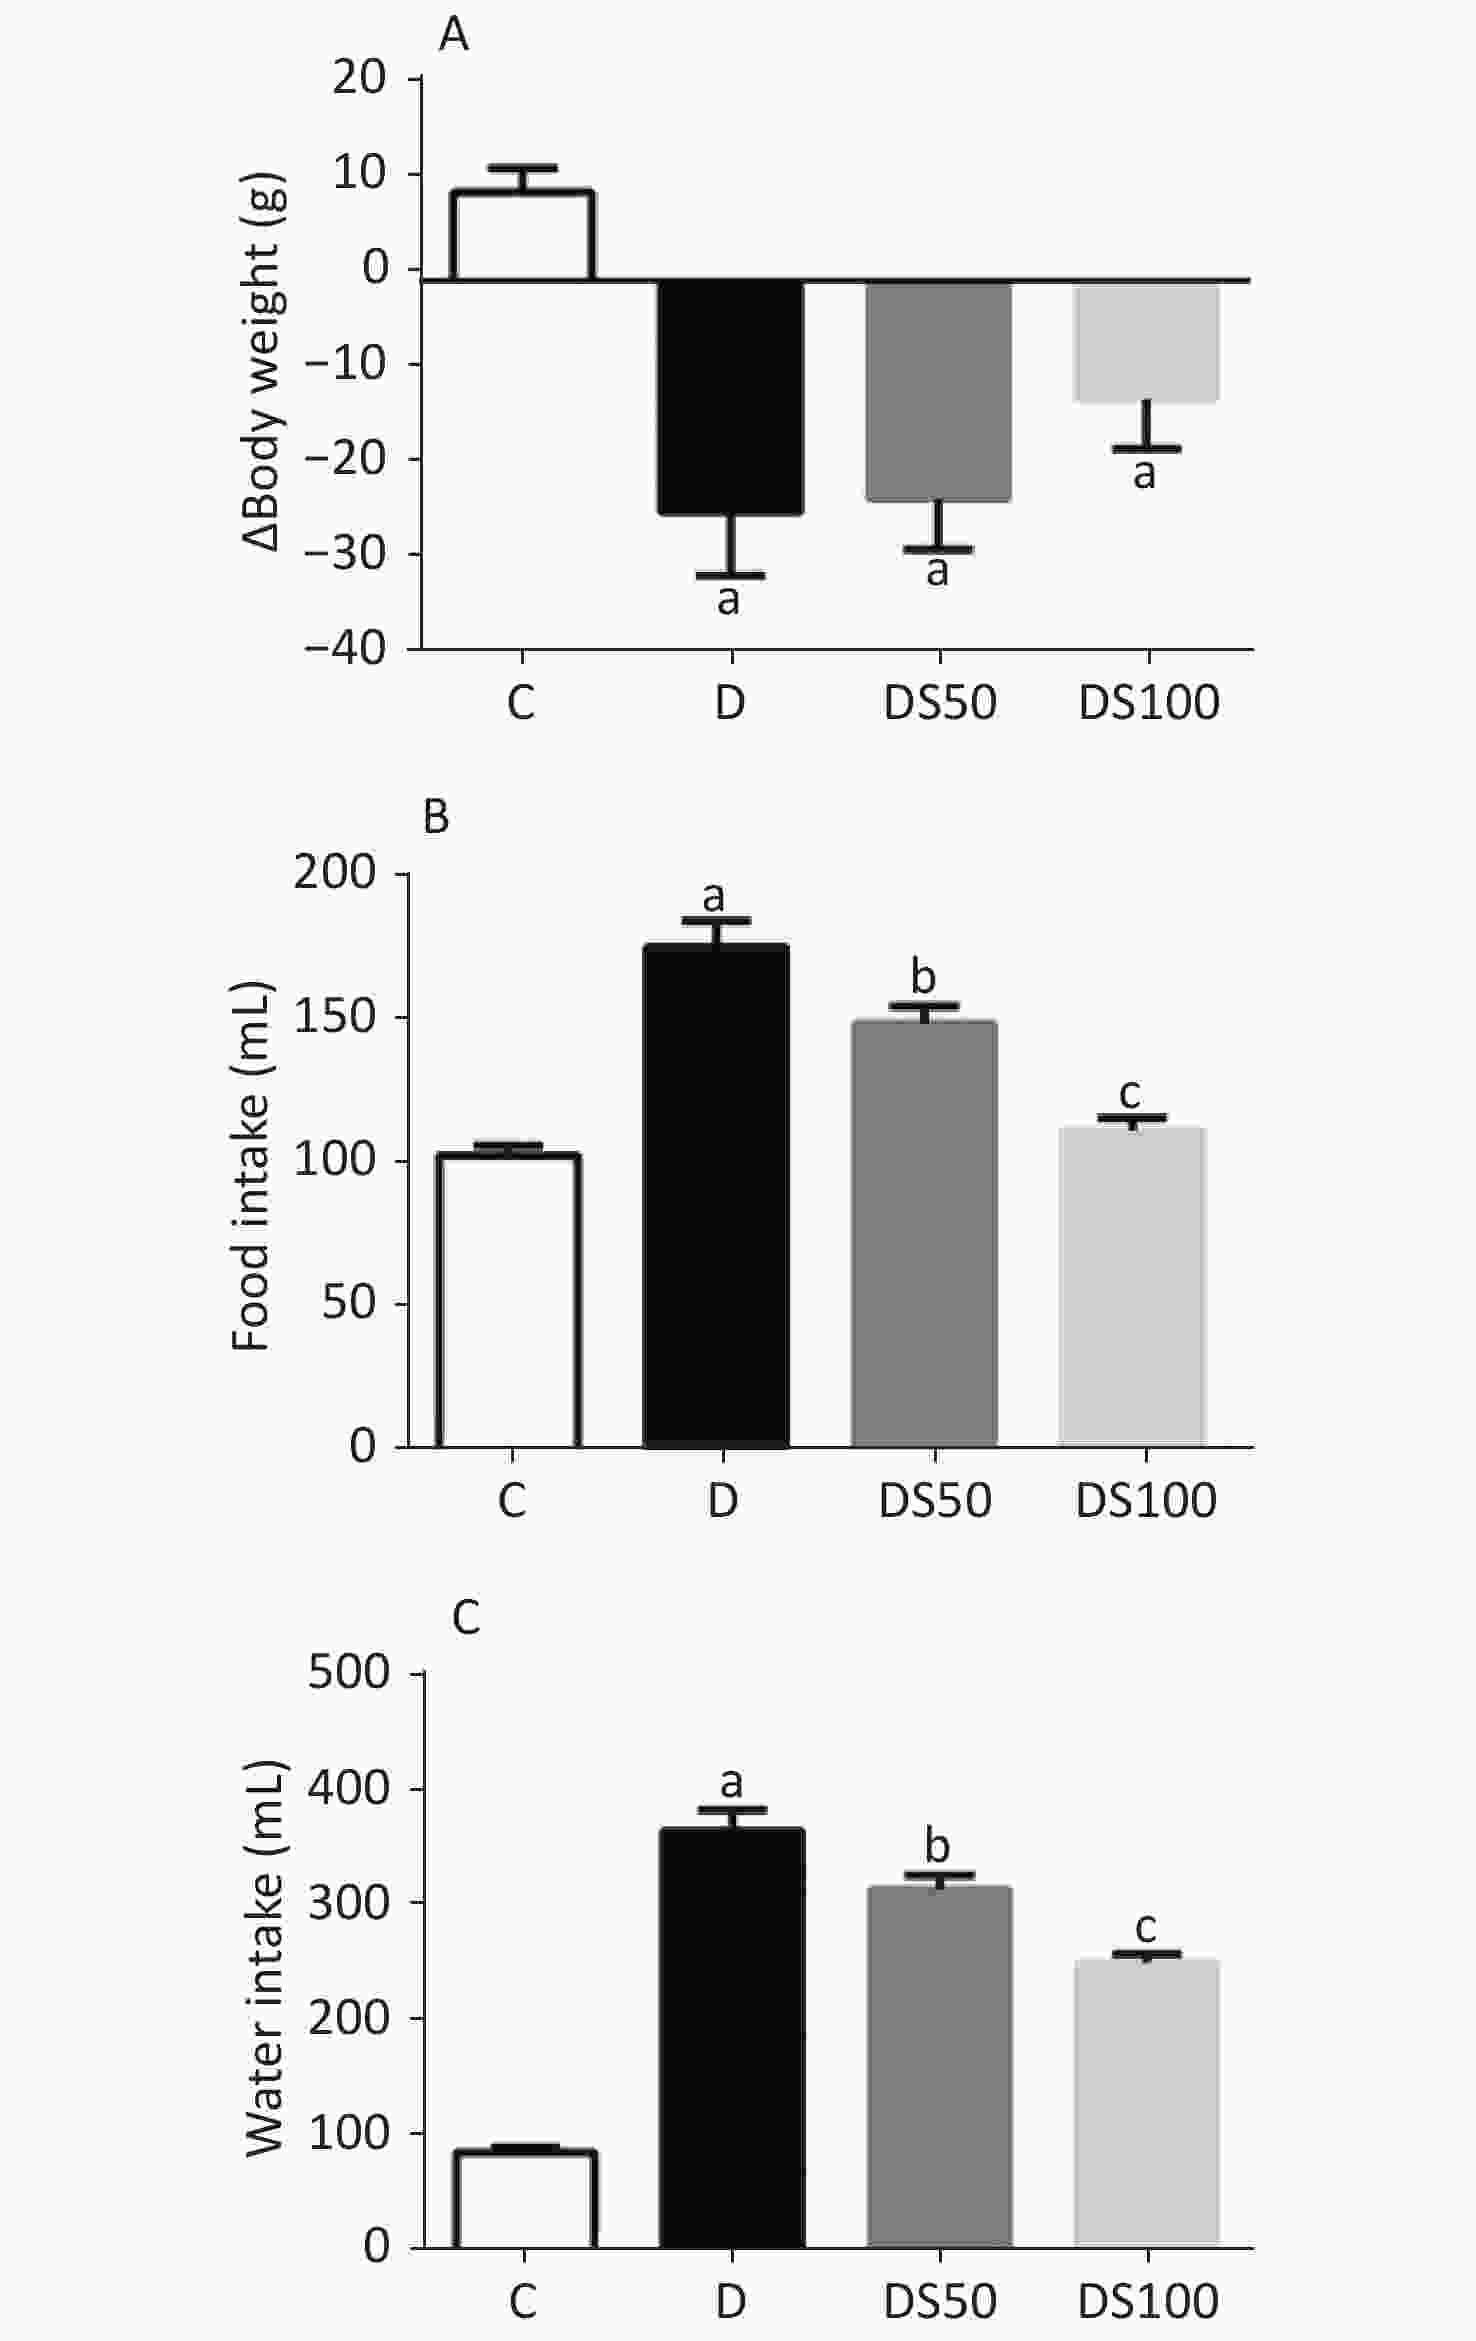
Figure 1. Silymarin (SMN) attenuates polyphagia and polydipsia. (A) The difference between final and initial bodyweights of different groups (in grams) [a indicates significance for the following comparisons: C vs. D (P = 0.0007), C vs. DS50 (P = 0.0006), and C vs. DS100 (P = 0.0443)]. (B) The food intake (in grams) by different groups [a indicates significance for C vs. D (P < 0.0001); b indicates significance for the following comparisons: D vs. DS50 (P = 0.0173); c indicates significance for D vs. DS100 (P = 0.0001)]. (C) The water intake (in milliliters) by different groups [a indicates significance for C vs. D (P < 0.0001); b indicates significance for D vs. DS50 (P = 0.0161); c indicates significance for the following comparisons: D vs. DS100 (P = 0.0001) and C vs. DS100 (P > 0.9999)]. The data are expressed as mean ± standard error of mean. The data are analyzed by one-way analysis of variance (ANOVA), followed by the Bonferroni post-hoc test. Different letters indicate statistical differences.
-
The serum levels of glucose, TAG, urea, and creatinine in the diabetic, DS50, and DS100 groups were higher than those in the vehicle control group (Table 1). The DS50 group exhibited significantly lower creatinine levels than the diabetic group.
Table 1. Silymarin (SMN) improves kidney function
Experimental groups C D DS50 DS100 Glucose (mg/dL) 150.0 ± 8.75 540.90 ± 40.78 a 492.50 ± 27.39 a 567.10 ± 44.06 a Triacylglycerol (mg/dL) 71.61 ± 6.69 141.30 ± 22.87 a 152.10 ± 9.20 a 185.50 ± 21.88 a Urea (mg/dL) 37.20 ± 0.63 134.0 ± 8.63 a 137.0 ± 6.40 a 140.0 ± 6.97 a Creatinine (mg/dL) 0.42 ± (0.36−0.59) 0.95 ± (0.70−1.28) a 0.60 ± (0.35−0.73) b 0.64 ± (0.34−0.79) a Note. C, vehicle control group (untreated); D, diabetic group (alloxan-treated); DS50, group treated with alloxan + 50 mg/kg bodyweight/d of SMN; DS100, treated with alloxan + (100 mg/kg bodyweight/d of SMN). In glucose levels, a indicates significance with the following comparisons: C vs. D (P < 0.0001), C vs. DS50 (P < 0.0001), and C vs. DS100 (P < 0.0001). In triacylglycerol levels, a indicates significance for the following comparisons: C vs. D (P = 0.0427), C vs. DS50 (P = 0.0050), and C vs. DS100 (P = 0.0005). In urea levels, a indicates significance for the following comparisons: C vs. D (P < 0.0001), C vs. DS50 (P < 0.0001), and C vs. DS100 (P < 0.0001). In creatinine levels, a indicates significance for the following comparisons: C vs. D (P = 0.0087), D vs. DS100 (P = 0.0999), and C vs. DS100 (P = 0.8132), while b indicates significance for the following comparisons: D vs. DS50 (P = 0.0476) and C vs. DS50 (P = 0.7758). The data are expressed as mean ± standard error of mean (for the levels of glucose, TAG, and urea) or as median and interquartile range (for creatinine levels). The data were analyzed by one-way analysis of variance (ANOVA), followed by the Bonferroni post-hoc test. Different letters indicate statistical differences (P < 0.05). -
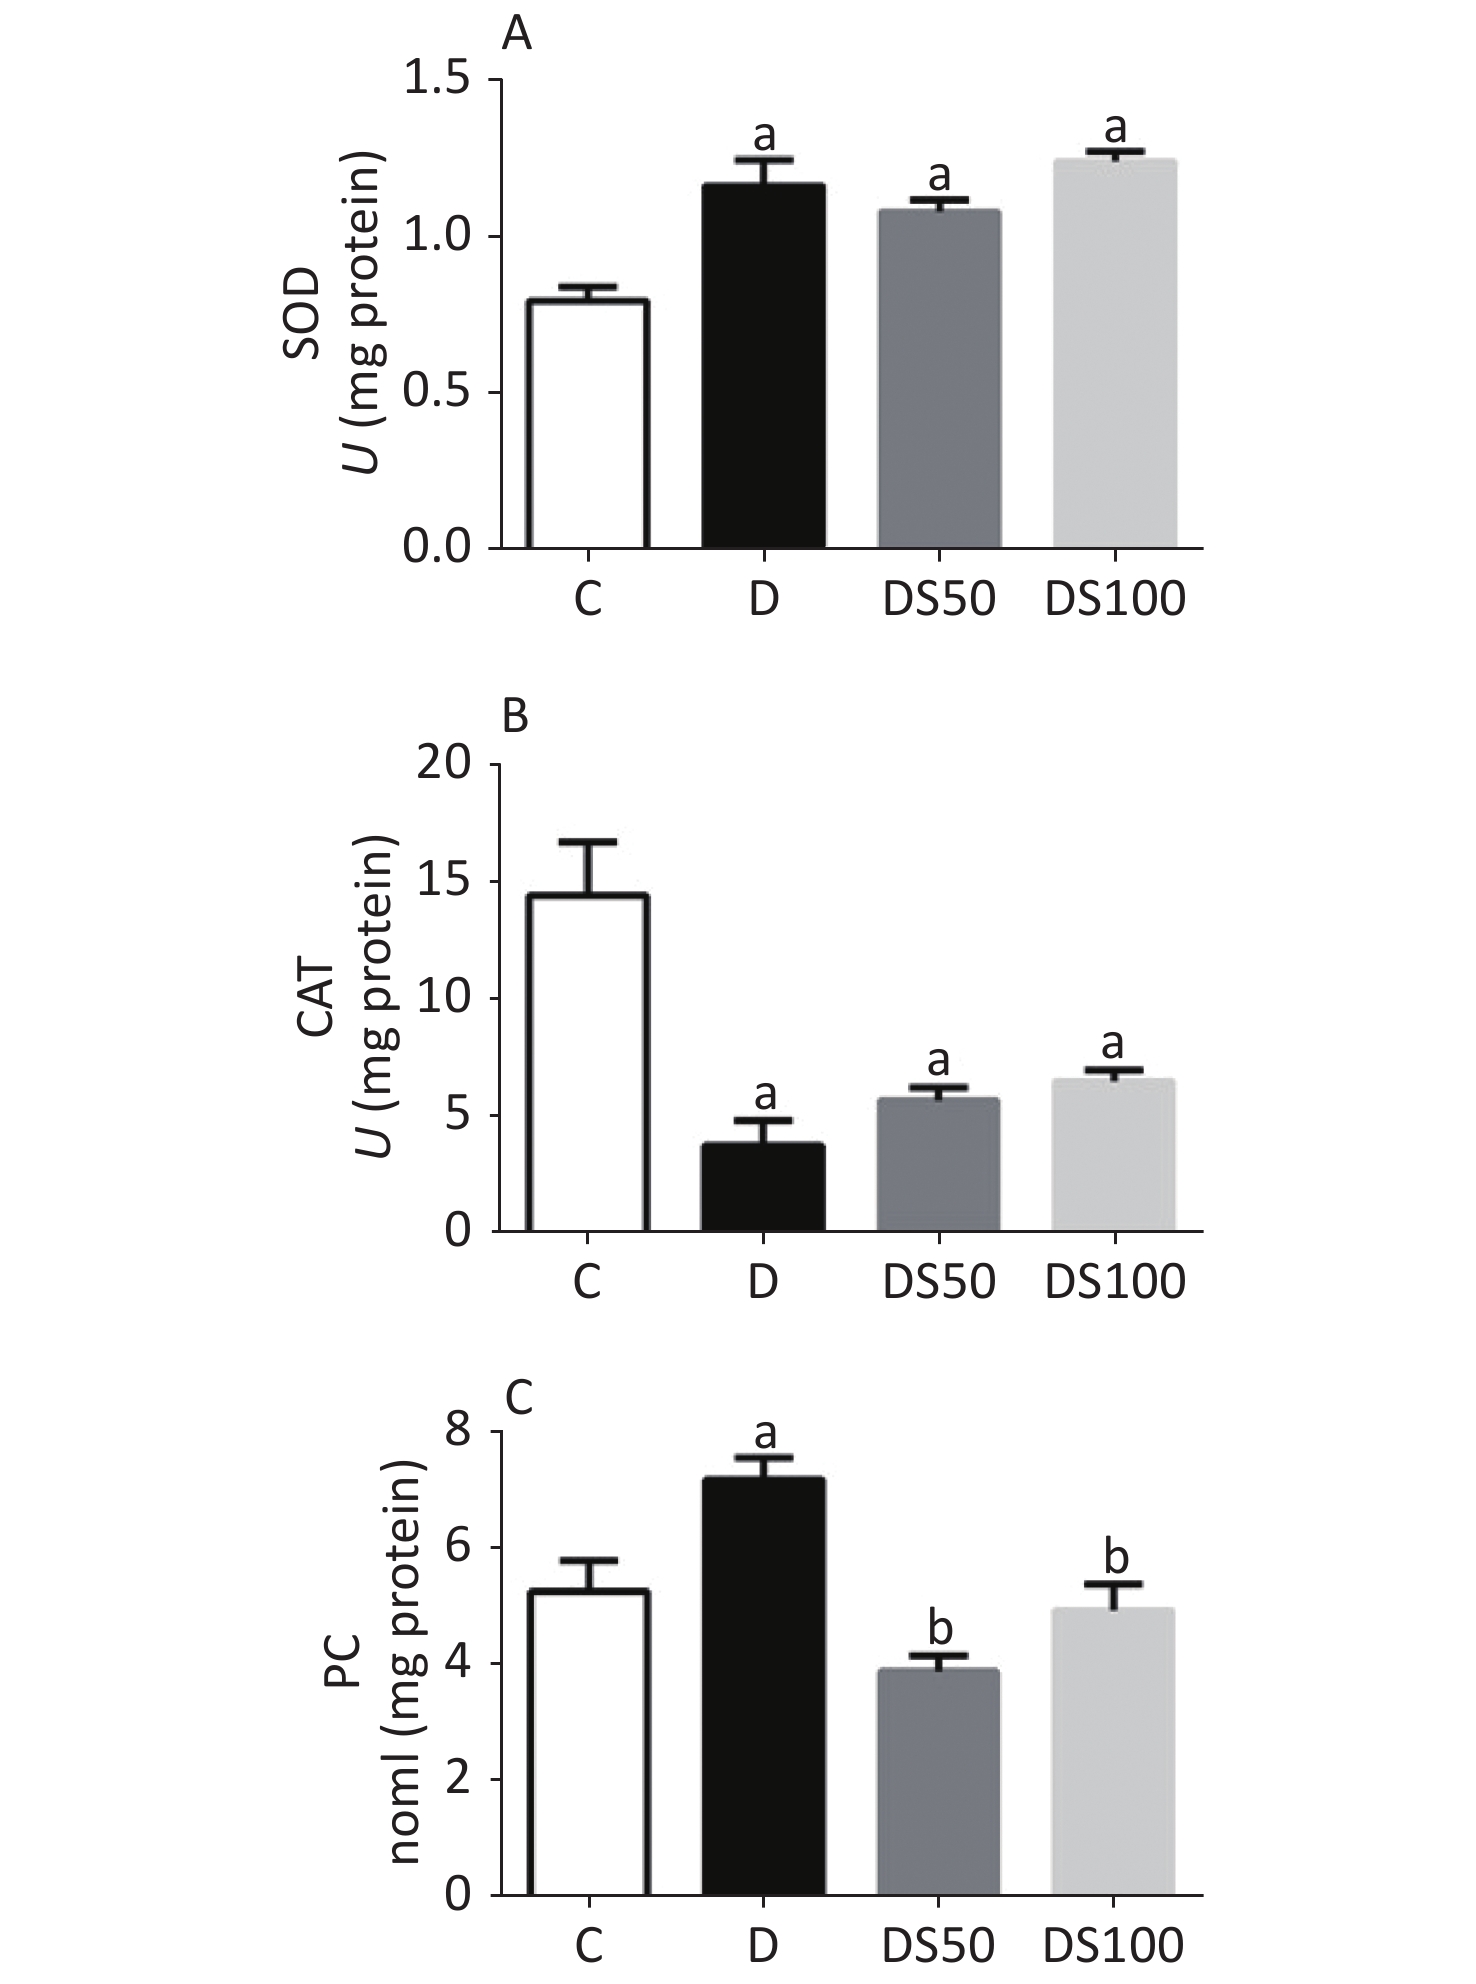
As shown in Figure 2A, the diabetic, DS50, and DS100 groups exhibited a significantly higher hepatic SOD activity than the vehicle control group. The diabetic, DS50, and DS100 groups exhibited a significant decrease in the hepatic CAT activity when compared to the vehicle control group (Figure 2B). The diabetic group exhibited a significant increase in the hepatic concentration of PC when compared to the vehicle control, DS50, and DS100 groups (Figure 2C). The DS50 and DS100 groups exhibited lower levels of hepatic PC than the diabetic group.
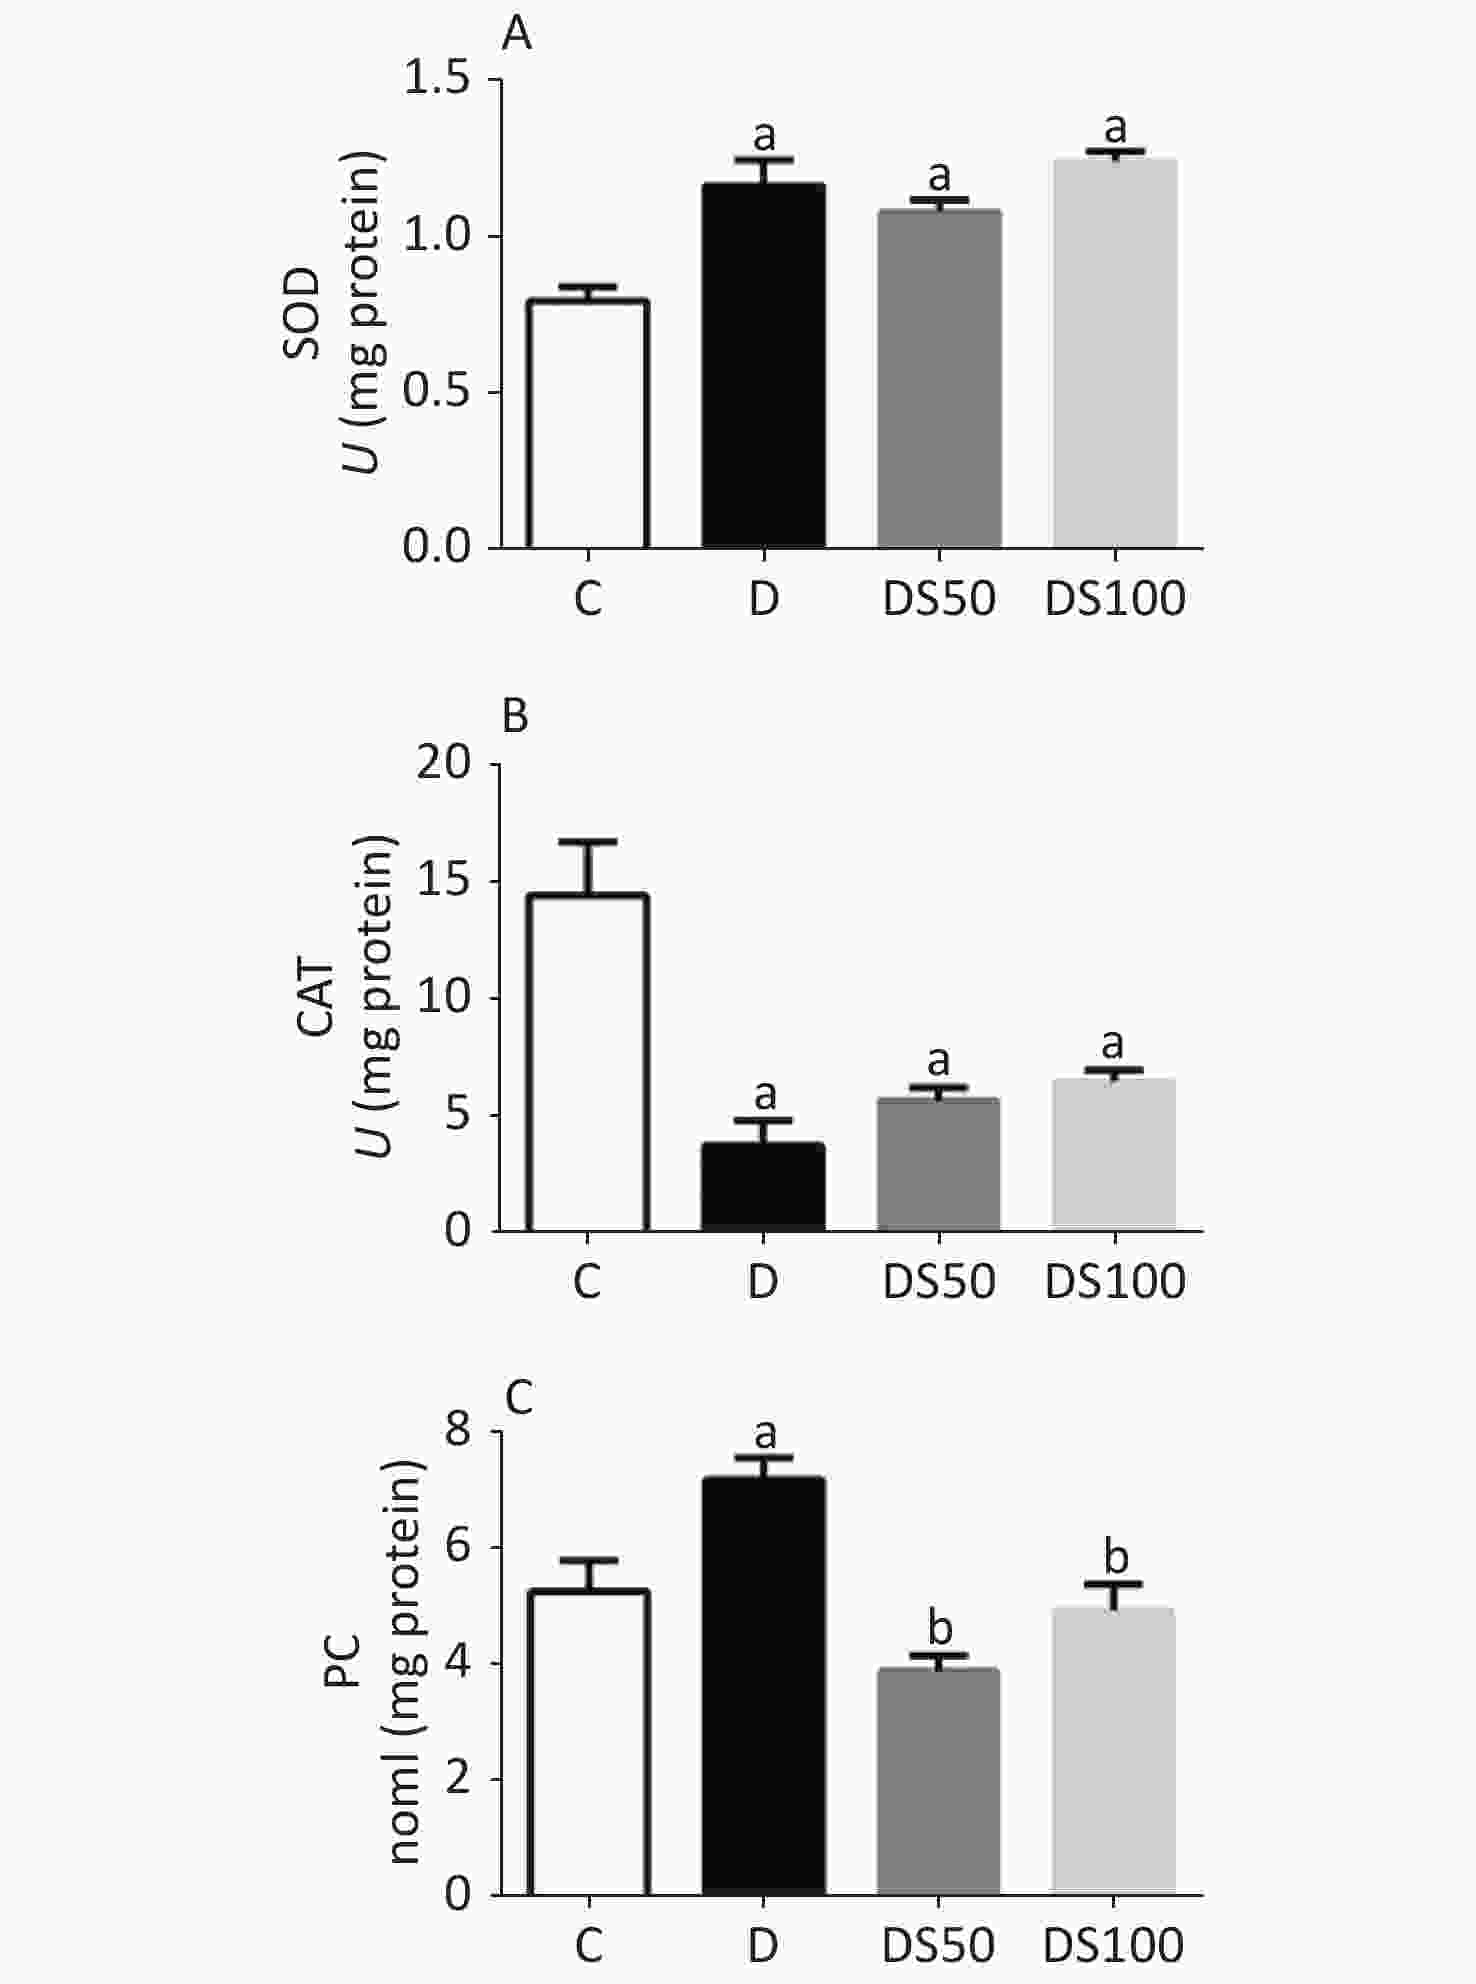
Figure 2. Silymarin (SMN) alleviates oxidative damage to proteins in the liver tissue. (A) The hepatic superoxide dismutase (SOD) activity in different groups [a indicates significance for the following comparisons: C vs. D (P = 0.0002), C vs. DS50 (P = 0.0007), and C vs. DS100 (P < 0.0001)]. (B) The hepatic catalase (CAT) activity in different groups [a indicates significance for the following comparisons: C vs. D (P < 0.0001), C vs. DS50 (P = 0.0007), and C vs. DS100 (P = 0.0019)]. (C) The hepatic carbonylated protein (PC) level in different groups [a indicates significance for the following comparisons: C vs. D (P = 0.0177), while b indicates significance for following comparisons: D vs. DS50 (P < 0.0001), D vs. DS100 (P = 0.0028), C vs. DS50 (P = 0.1389), and C vs. DS100 (P > 0.9999)]. C, vehicle control group (untreated); D, diabetic group (alloxan-treated); DS50, group treated with alloxan + 50 mg/kg bodyweight/d of SMN; DS100, group treated with alloxan + 100 mg/kg bodyweight/d of SMN. The data are expressed as mean ± standard error of mean. The data are analyzed by one-way analysis of variance (ANOVA), followed by the Bonferroni post-hoc test. Different letters indicate statistical differences (P < 0.05).
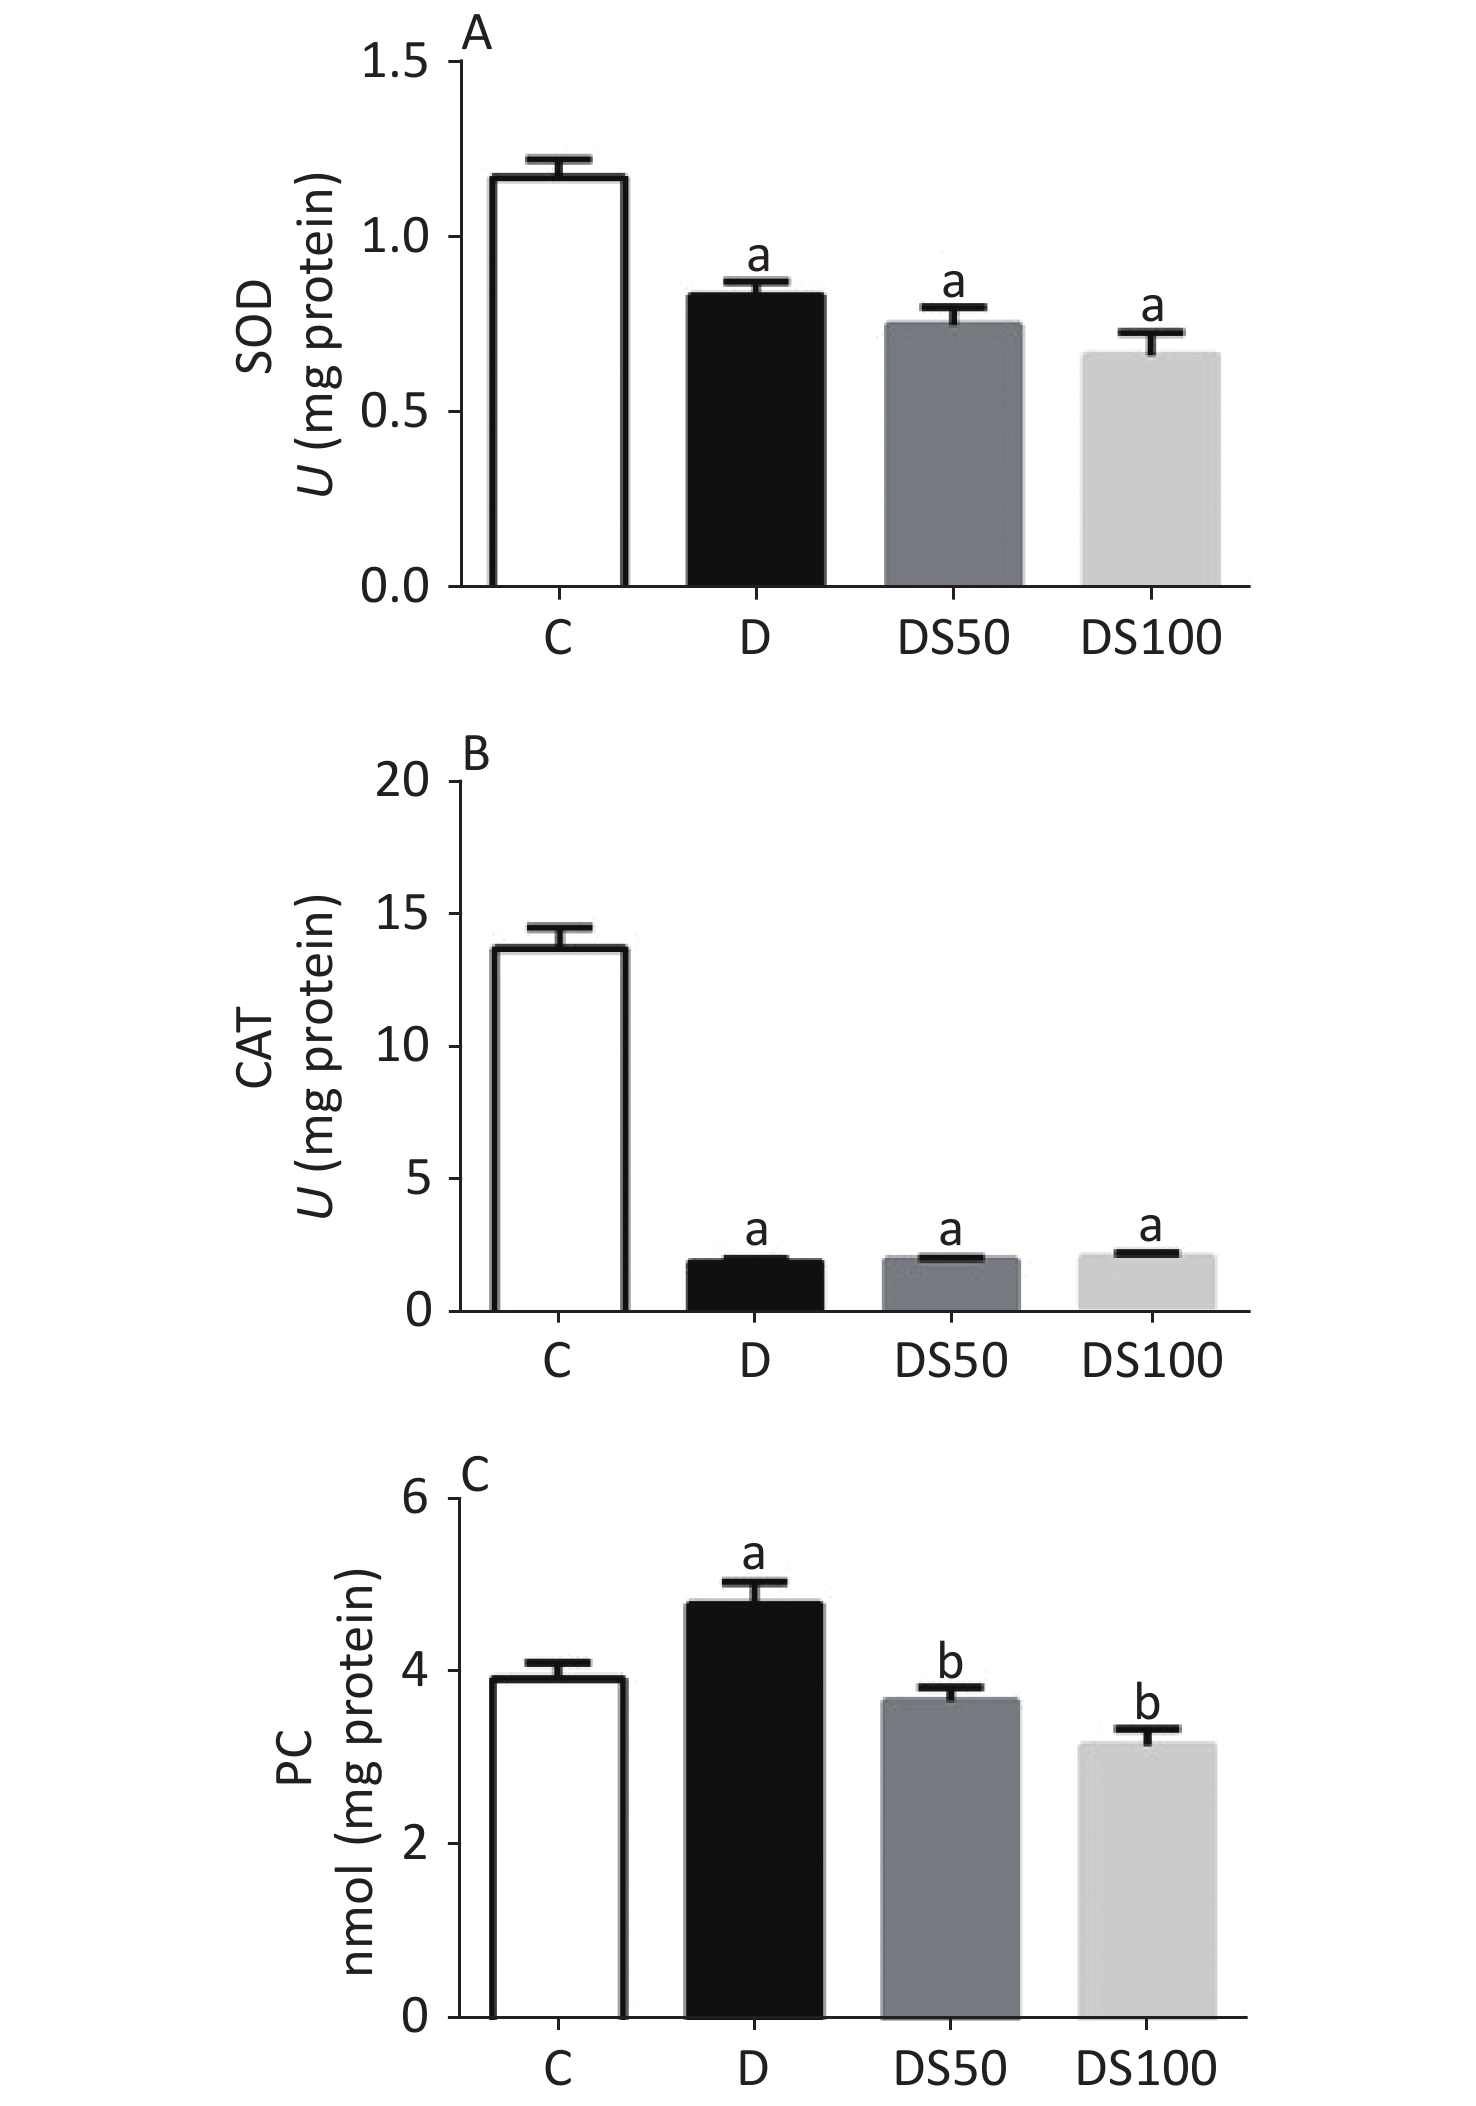
The effect of SMN on pancreatic redox status markers is shown in Figure 3. Compared to the vehicle control group, the pancreatic SOD activity was decreased in the diabetic, DS50, and DS100 groups (Figure 3A). Similarly, the diabetic, DS50, and DS100 groups exhibited a decreased pancreatic CAT activity when compared to the vehicle control group (Figure 3B). The pancreatic levels of PC in the diabetic group were higher than those in the vehicle control group (Figure 3C). The DS50 and DS100 groups exhibited lower pancreatic levels of PC than the diabetic group.
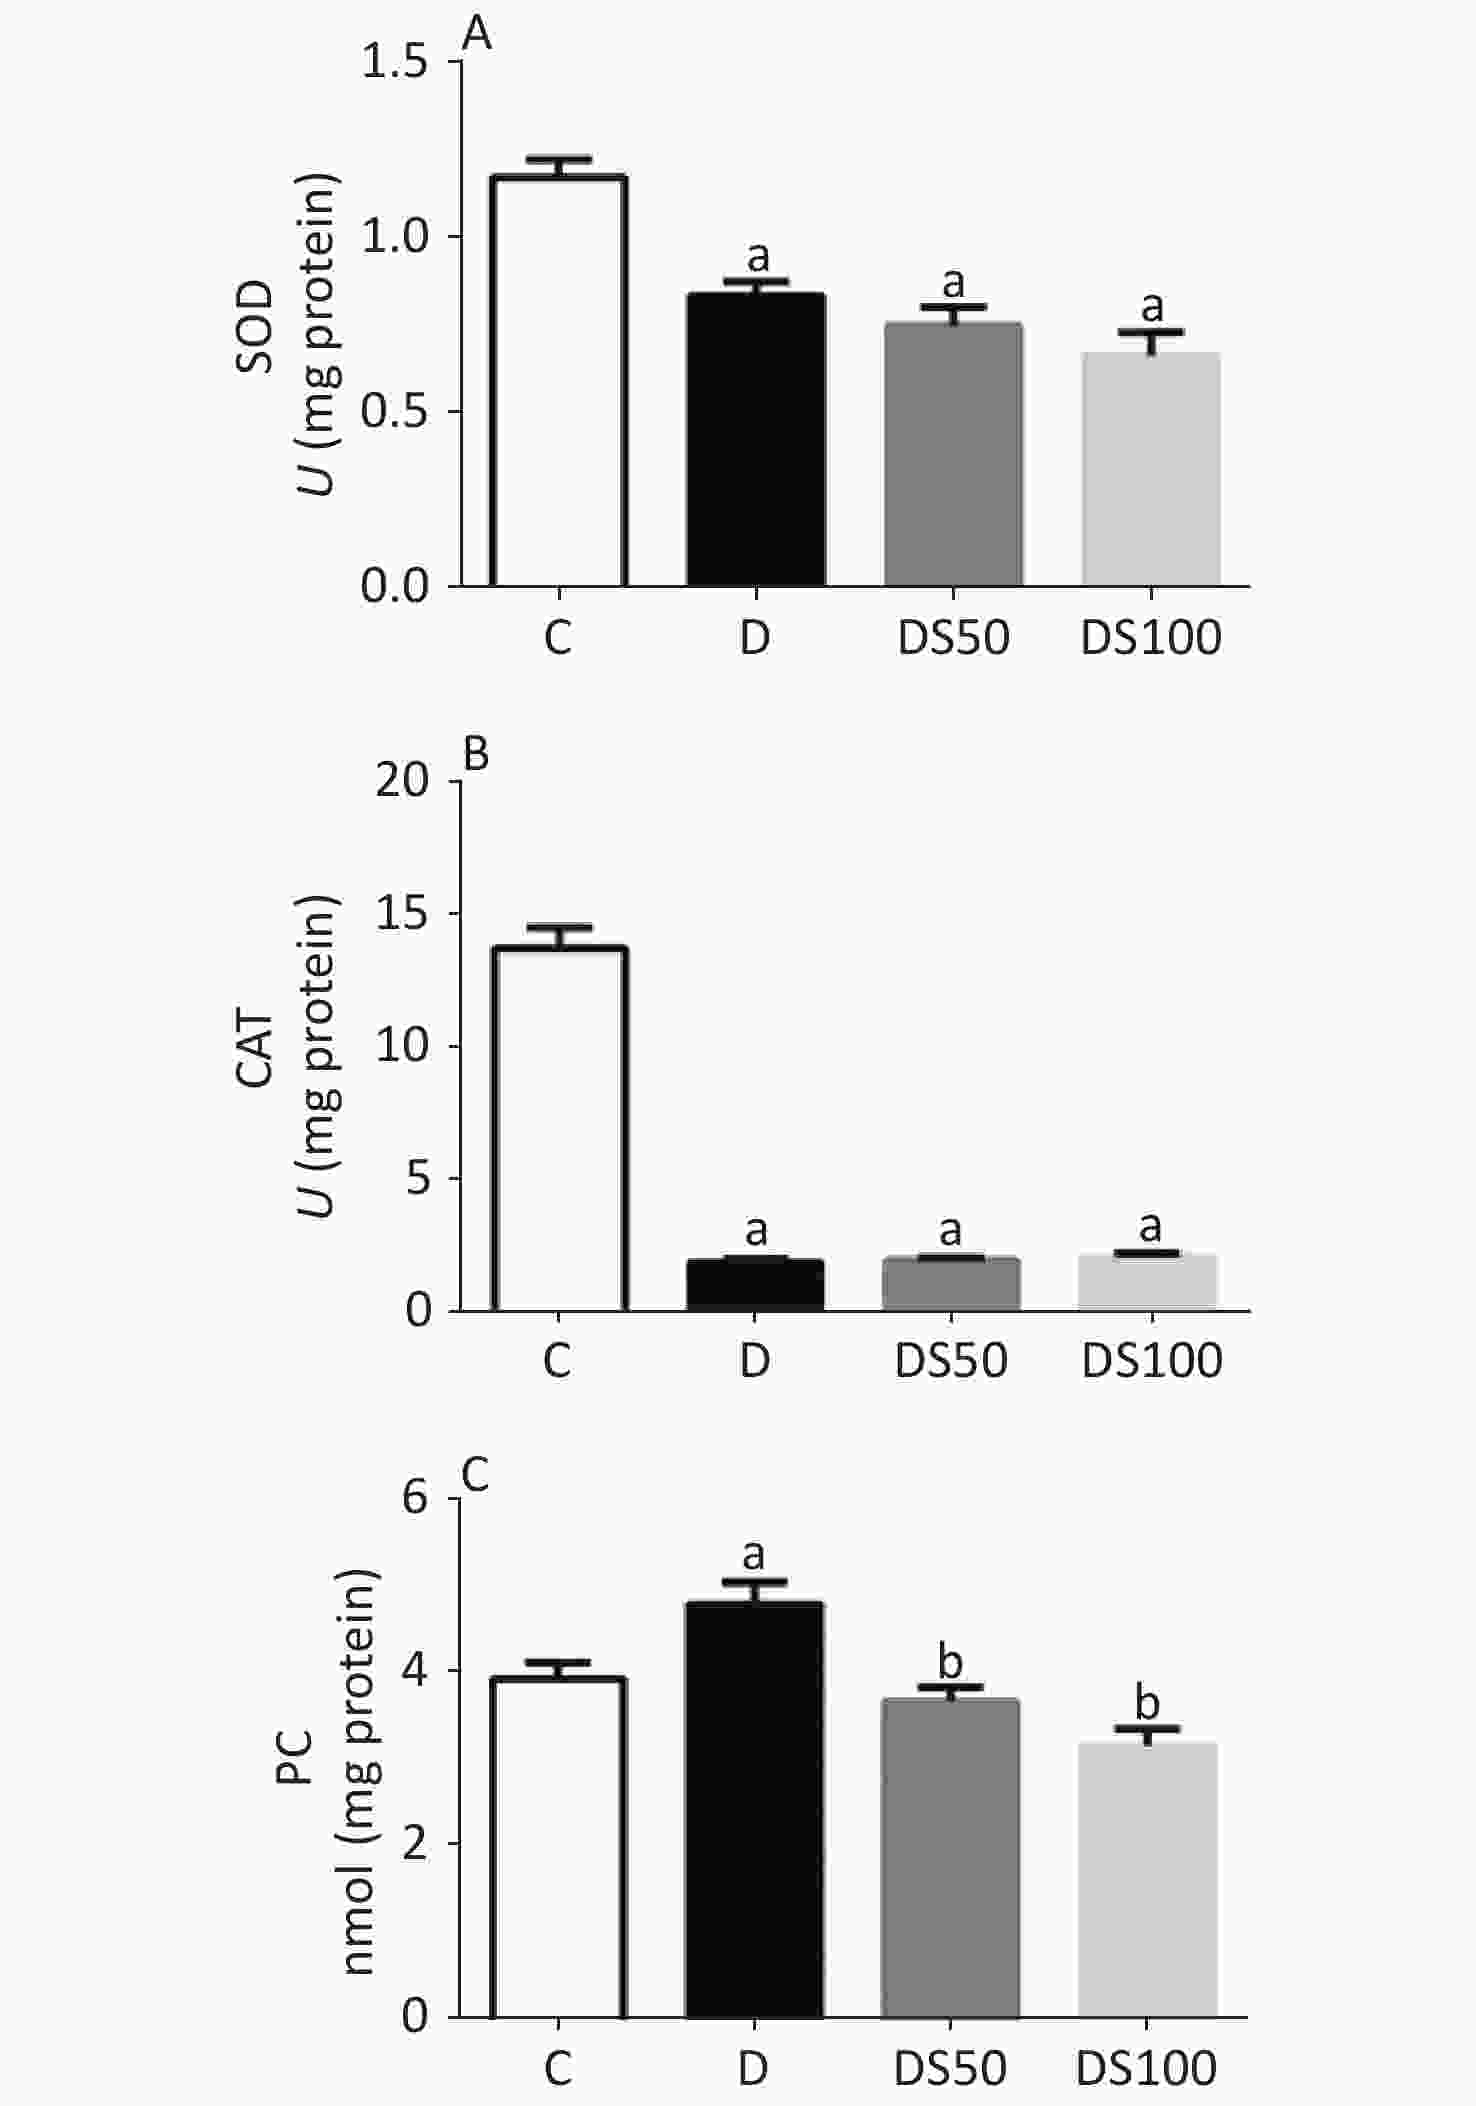
Figure 3. Silymarin (SMN) alleviates oxidative damage to proteins in the pancreatic tissue. (A) The pancreatic superoxide dismutase (SOD) activity in different groups (a indicates significance for the following comparisons: C vs. D (P = 0.0021), C vs. DS50 (P < 0.0001), and C vs. DS100 (P < 0.0001)). (B) The pancreatic catalase (CAT) activity in different groups [a indicates significance for the following comparisons: C vs. D (P < 0.0001), C vs. DS50 (P < 0.0001), and C vs. DS100 (P < 0.0001)]. (C) The pancreatic carbonylated protein (PC) level in different groups [a indicates significance for the following comparisons: C vs. D (P = 0.0415); b, D vs. DS50 (P = 0.0023), D vs. DS100 (P = 0.0001), C vs. DS50 (P = 0.7969), and C vs. DS100 (P = 0.0943)]. C, vehicle control group (untreated); D, diabetic group (alloxan-treated); DS50, group treated with alloxan + 50 mg/kg bodyweight/d of SMN; DS100, group treated with alloxan + 100 mg/kg bodyweight/d of SMN. The data are expressed as mean ± standard error of mean. The data were analyzed by one-way analysis of variance (ANOVA), followed by the Bonferroni post-hoc test. Different letters indicate statistical differences (P < 0.05).
-
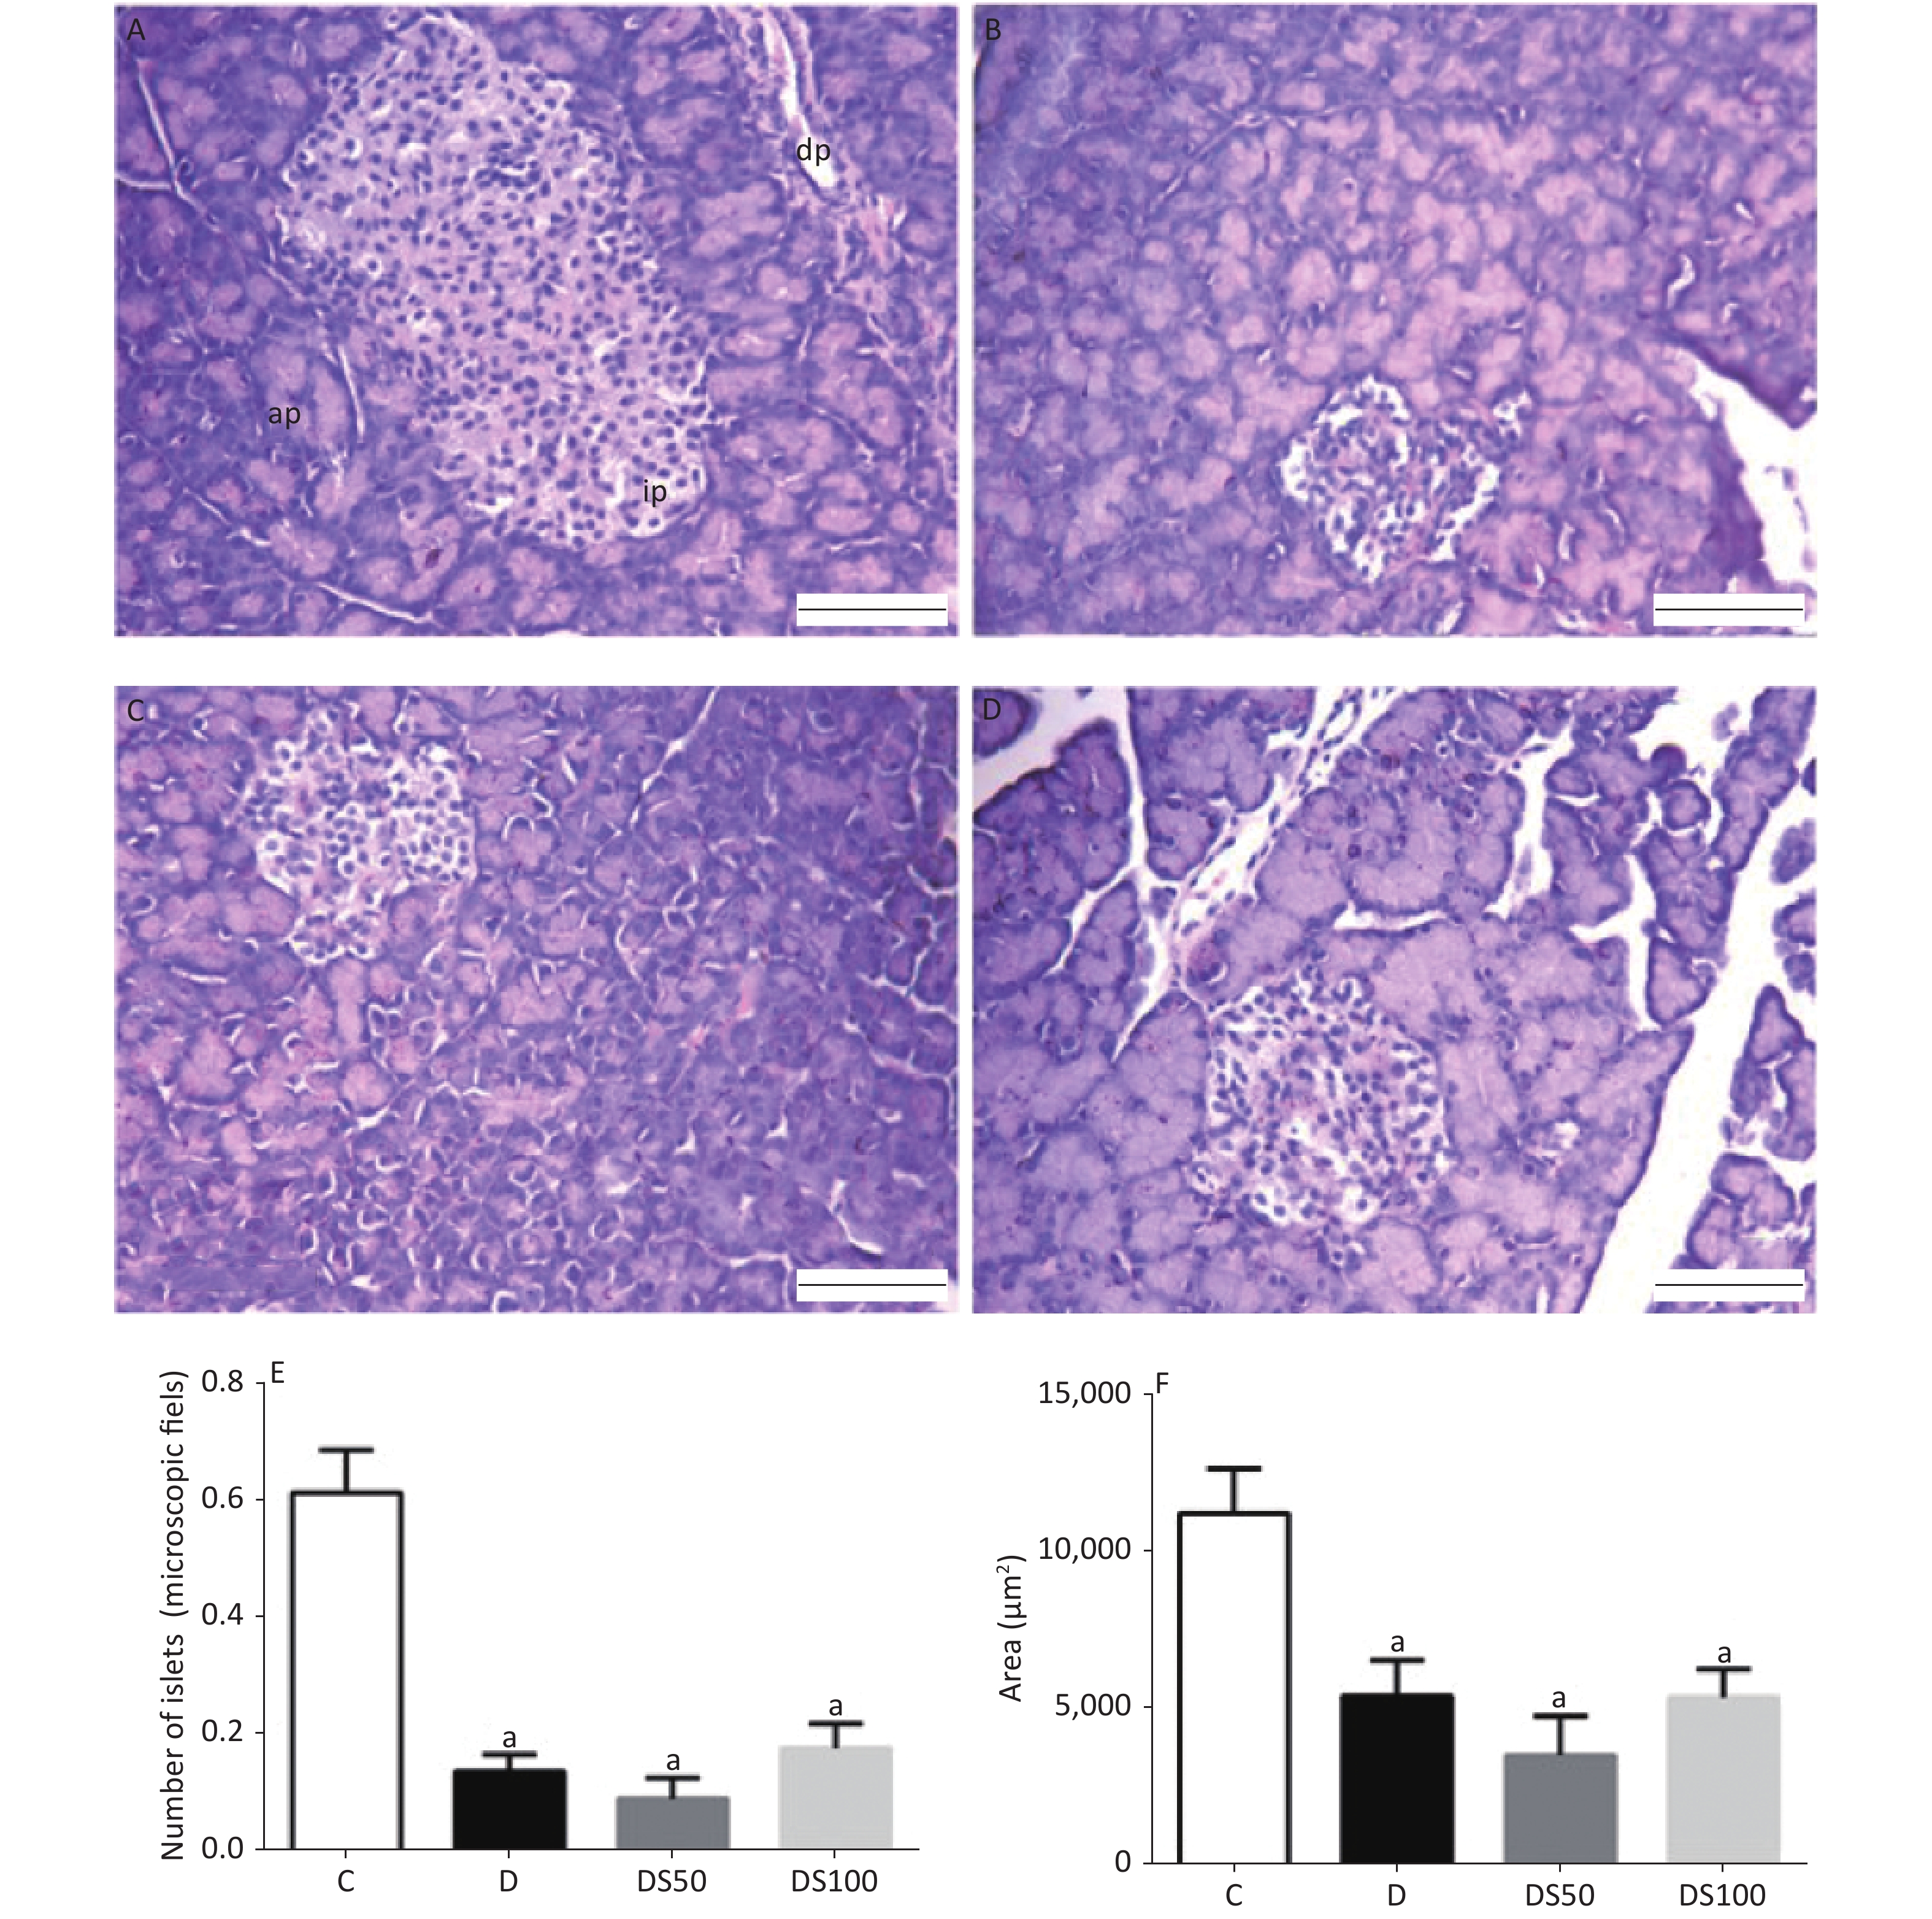
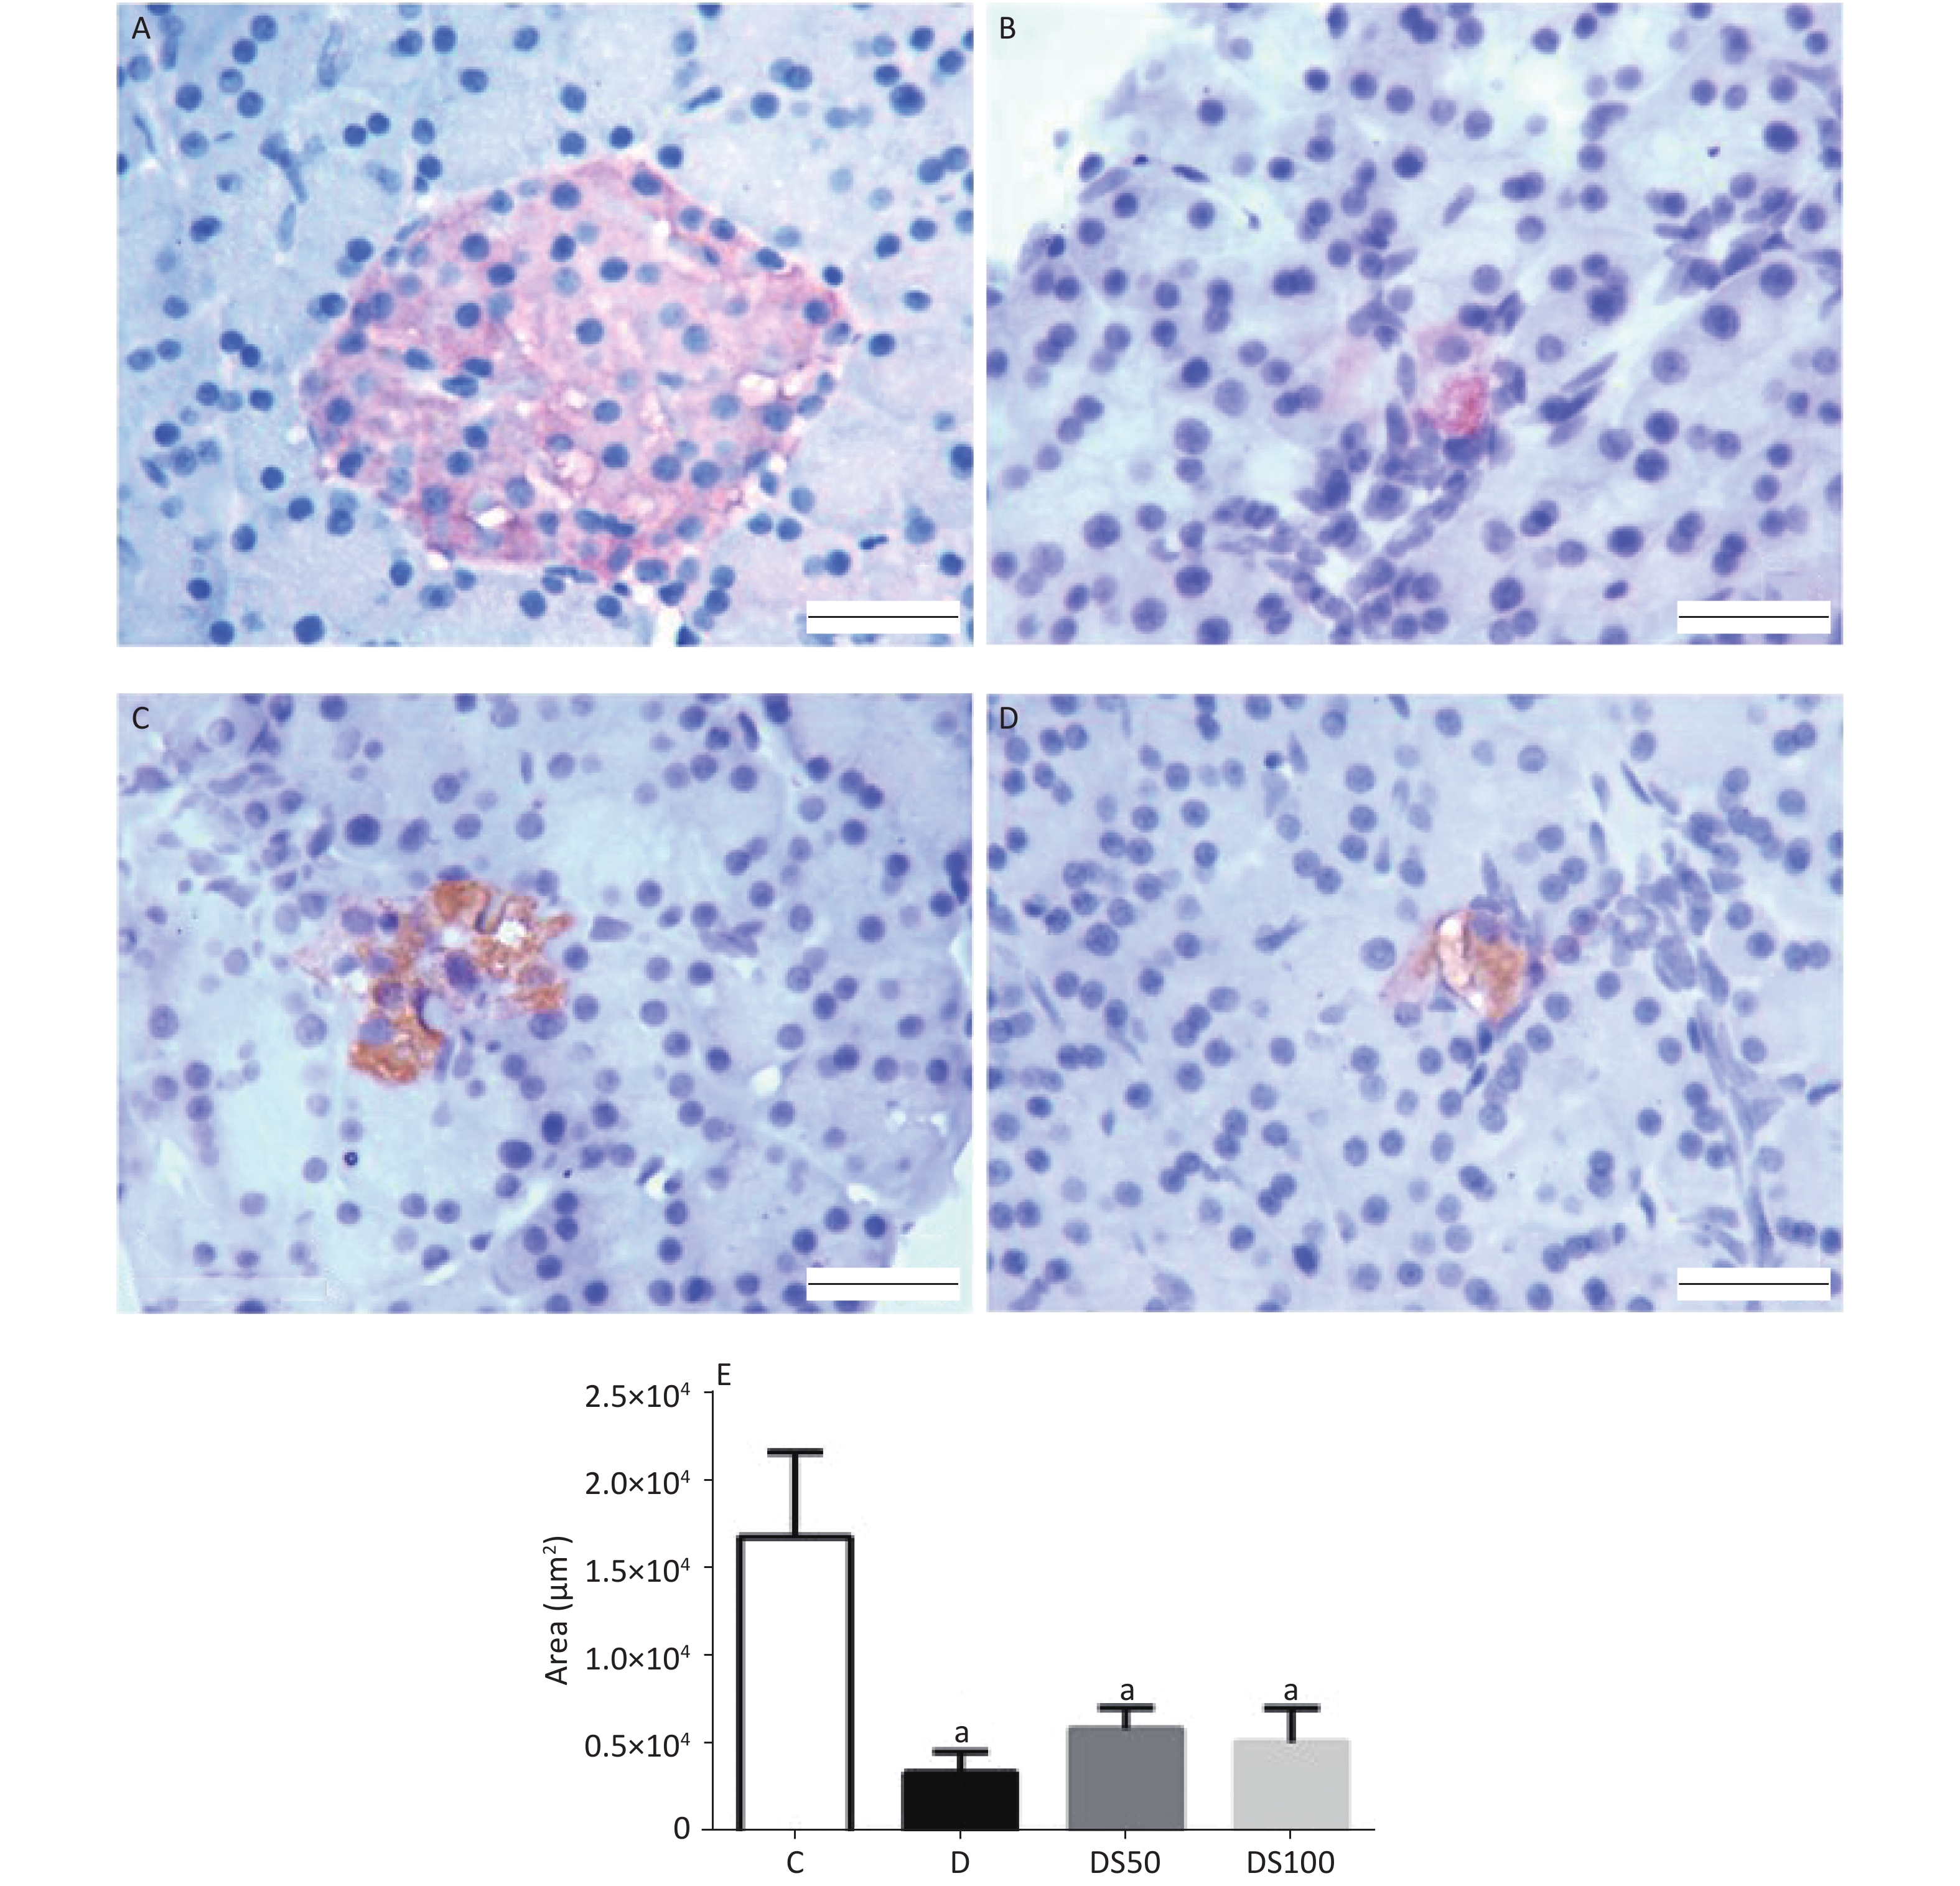
Figure 4A-D present the histopathological evaluation of representative H&E-stained pancreatic tissues by light microscopy. There were no significant differences in the histological features of the pancreatic tissue among the experimental groups (P > 0.05). The number (Figure 4E) and area (Figure 4F) of the pancreatic islets in the diabetic, DS50, and DS100 groups were significantly lower than those in the vehicle control group.
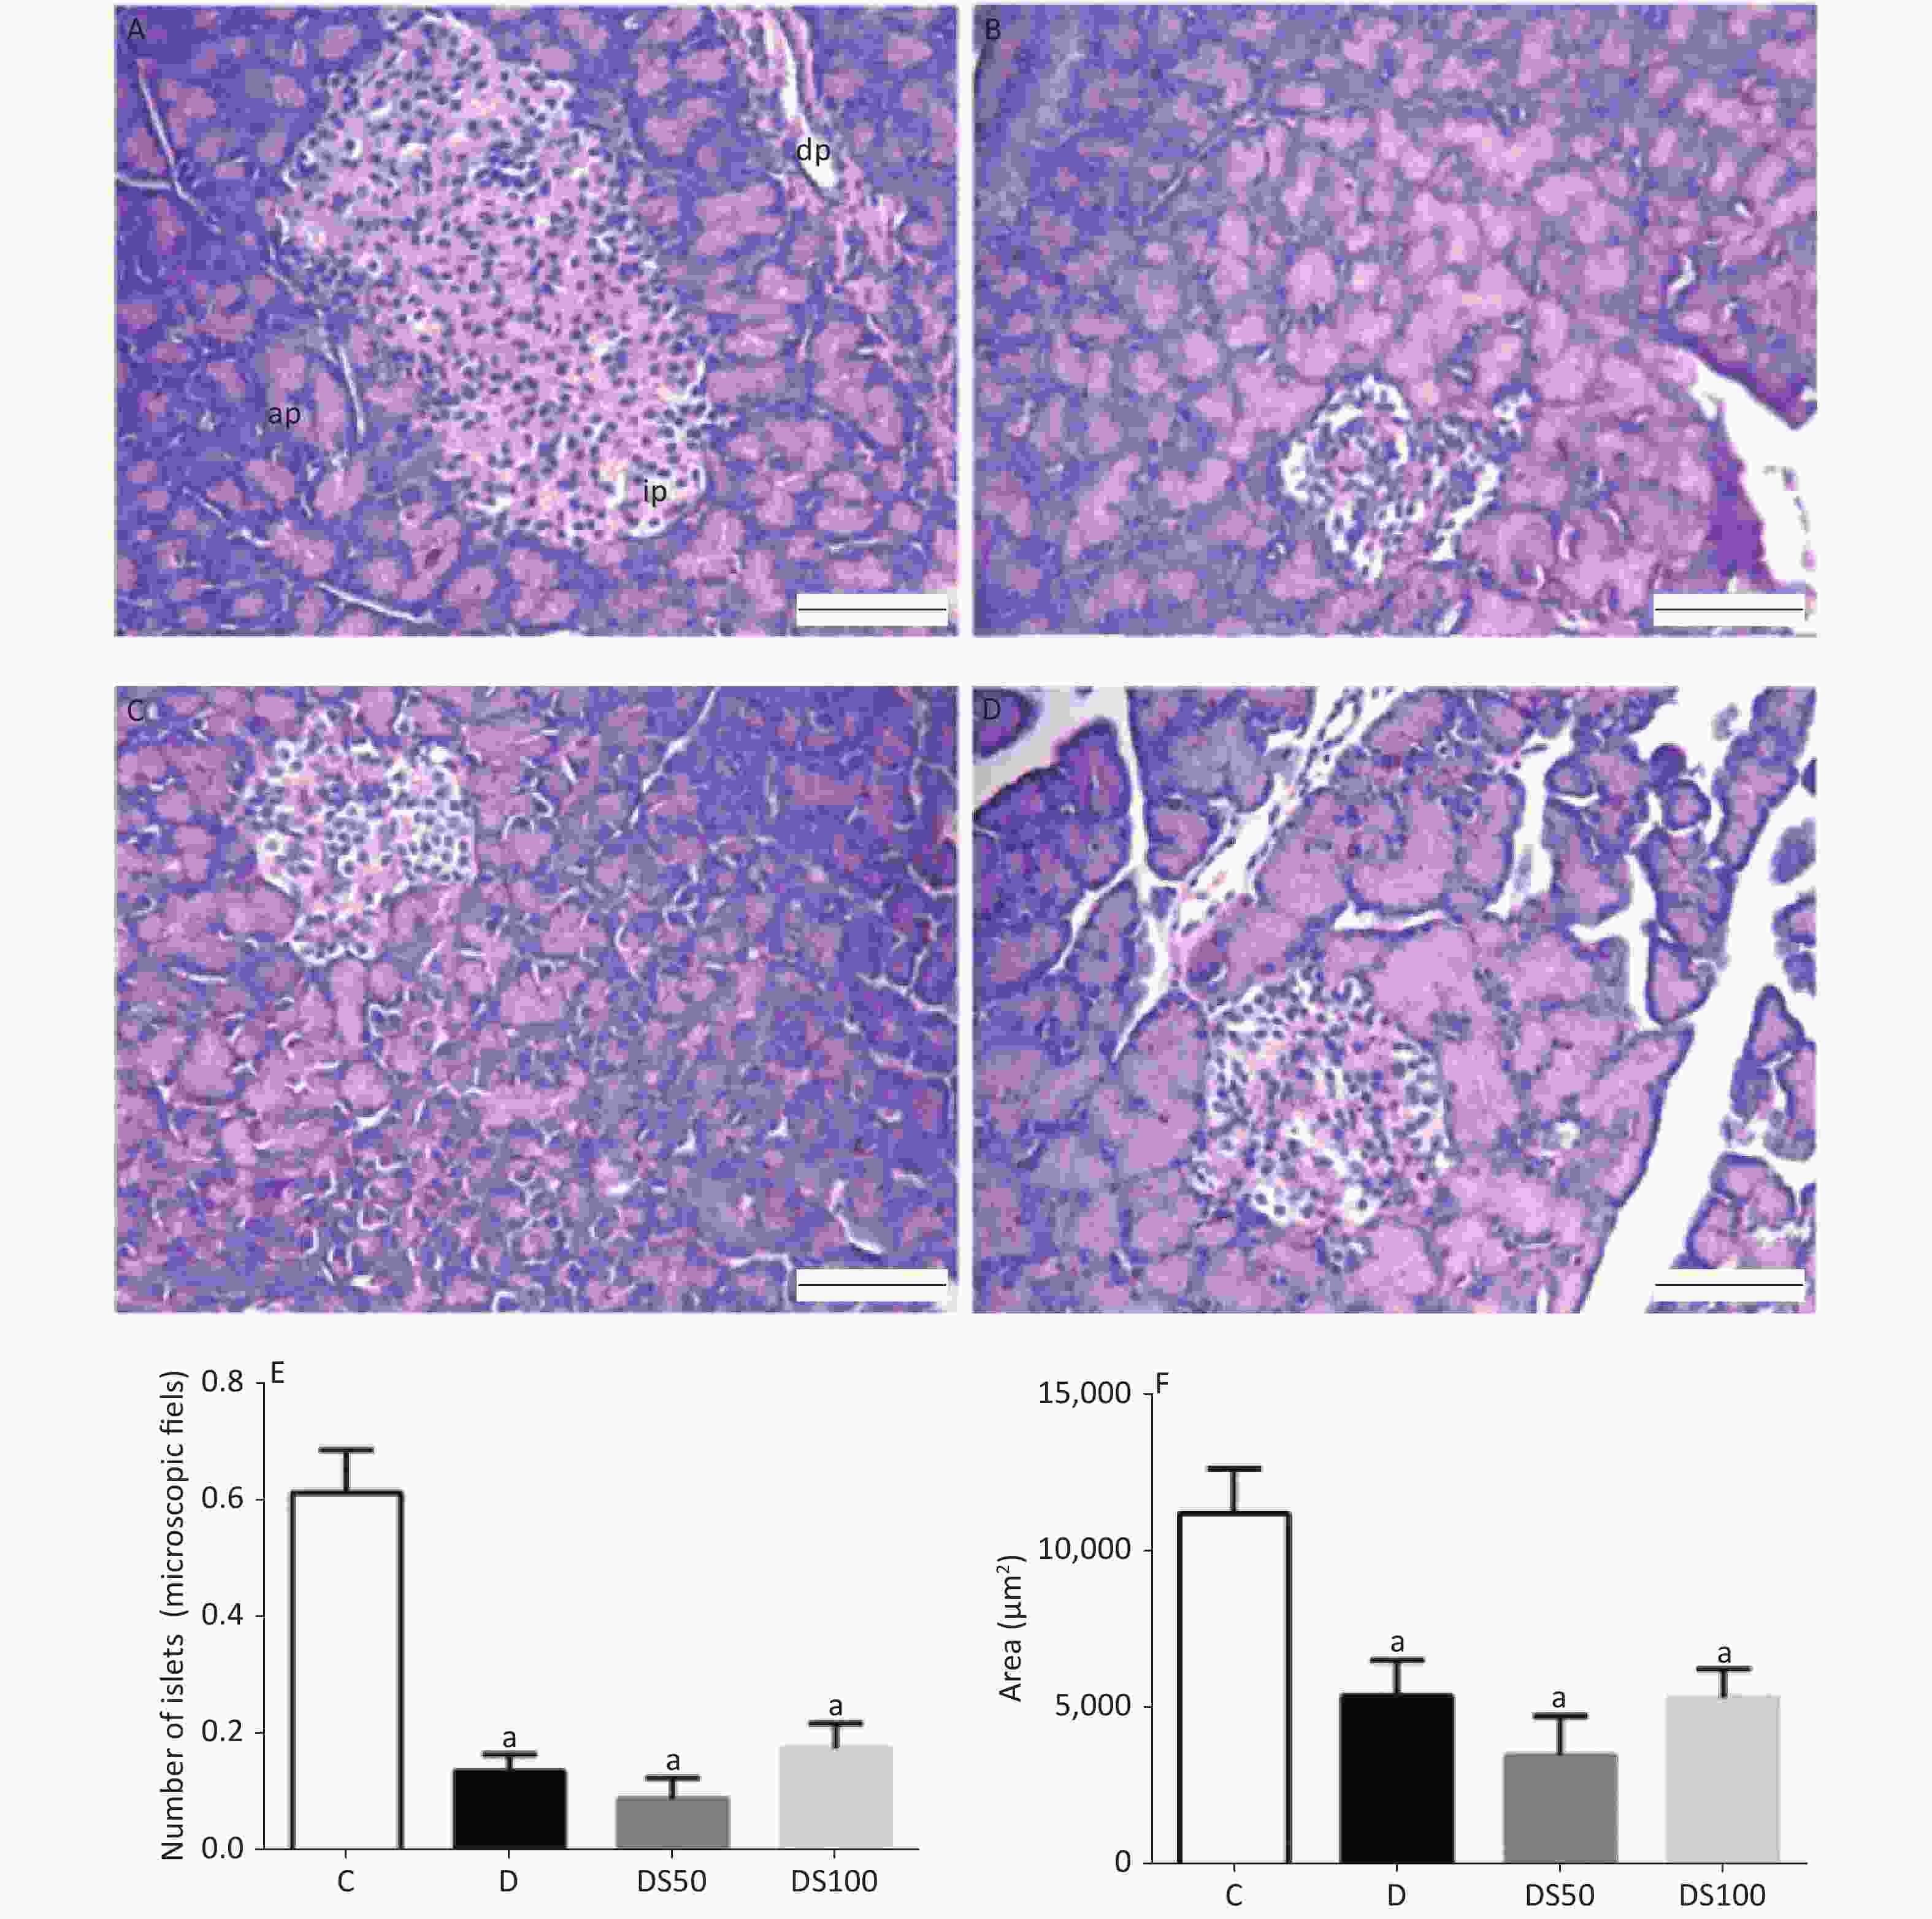
Figure 4. Silymarin (SMN) does not increase the number or area of beta pancreatic islets. Representative photomicrographs of paraffinized sections of experimental and control pancreas tissues stained with hematoxylin and eosin. Control group (A) with normal pancreatic islet architecture. Diabetic (B), DS50 (C), and DS100 (D) groups exhibiting decreased areas of pancreatic islets. In the photomicrographs, pi indicates pancreatic islet, pd indicates pancreatic duct, and pa indicates pancreatic acinus. Scale bar: 100 µm. The graphs of morphometric analysis of (E) number of pancreatic islets [a indicates significance for the following comparisons: C vs. D (P < 0.001), C vs. DS50 (P < 0.001), and C vs. DS100 (P < 0.001)] and (F) area of beta pancreatic islets [a indicates significance for the following comparisons: C vs. D (P = 0.019), C vs. DS50 (P < 0.001), and C vs. DS100 (P = 0.014)]. The data were expressed as mean ± standard error of mean. The data were analyzed by one-way analysis of variance (ANOVA), followed by Bonferroni post-hoc test. Different letters indicate significant differences (P < 0.05).
The insulin immune-positive area in the histological sections of pancreatic islets from the experimental groups is shown in Figure 5. The diabetic, DS50, and DS100 groups exhibited a significantly lower area of pancreatic islets than the vehicle control group (Figure 5E).
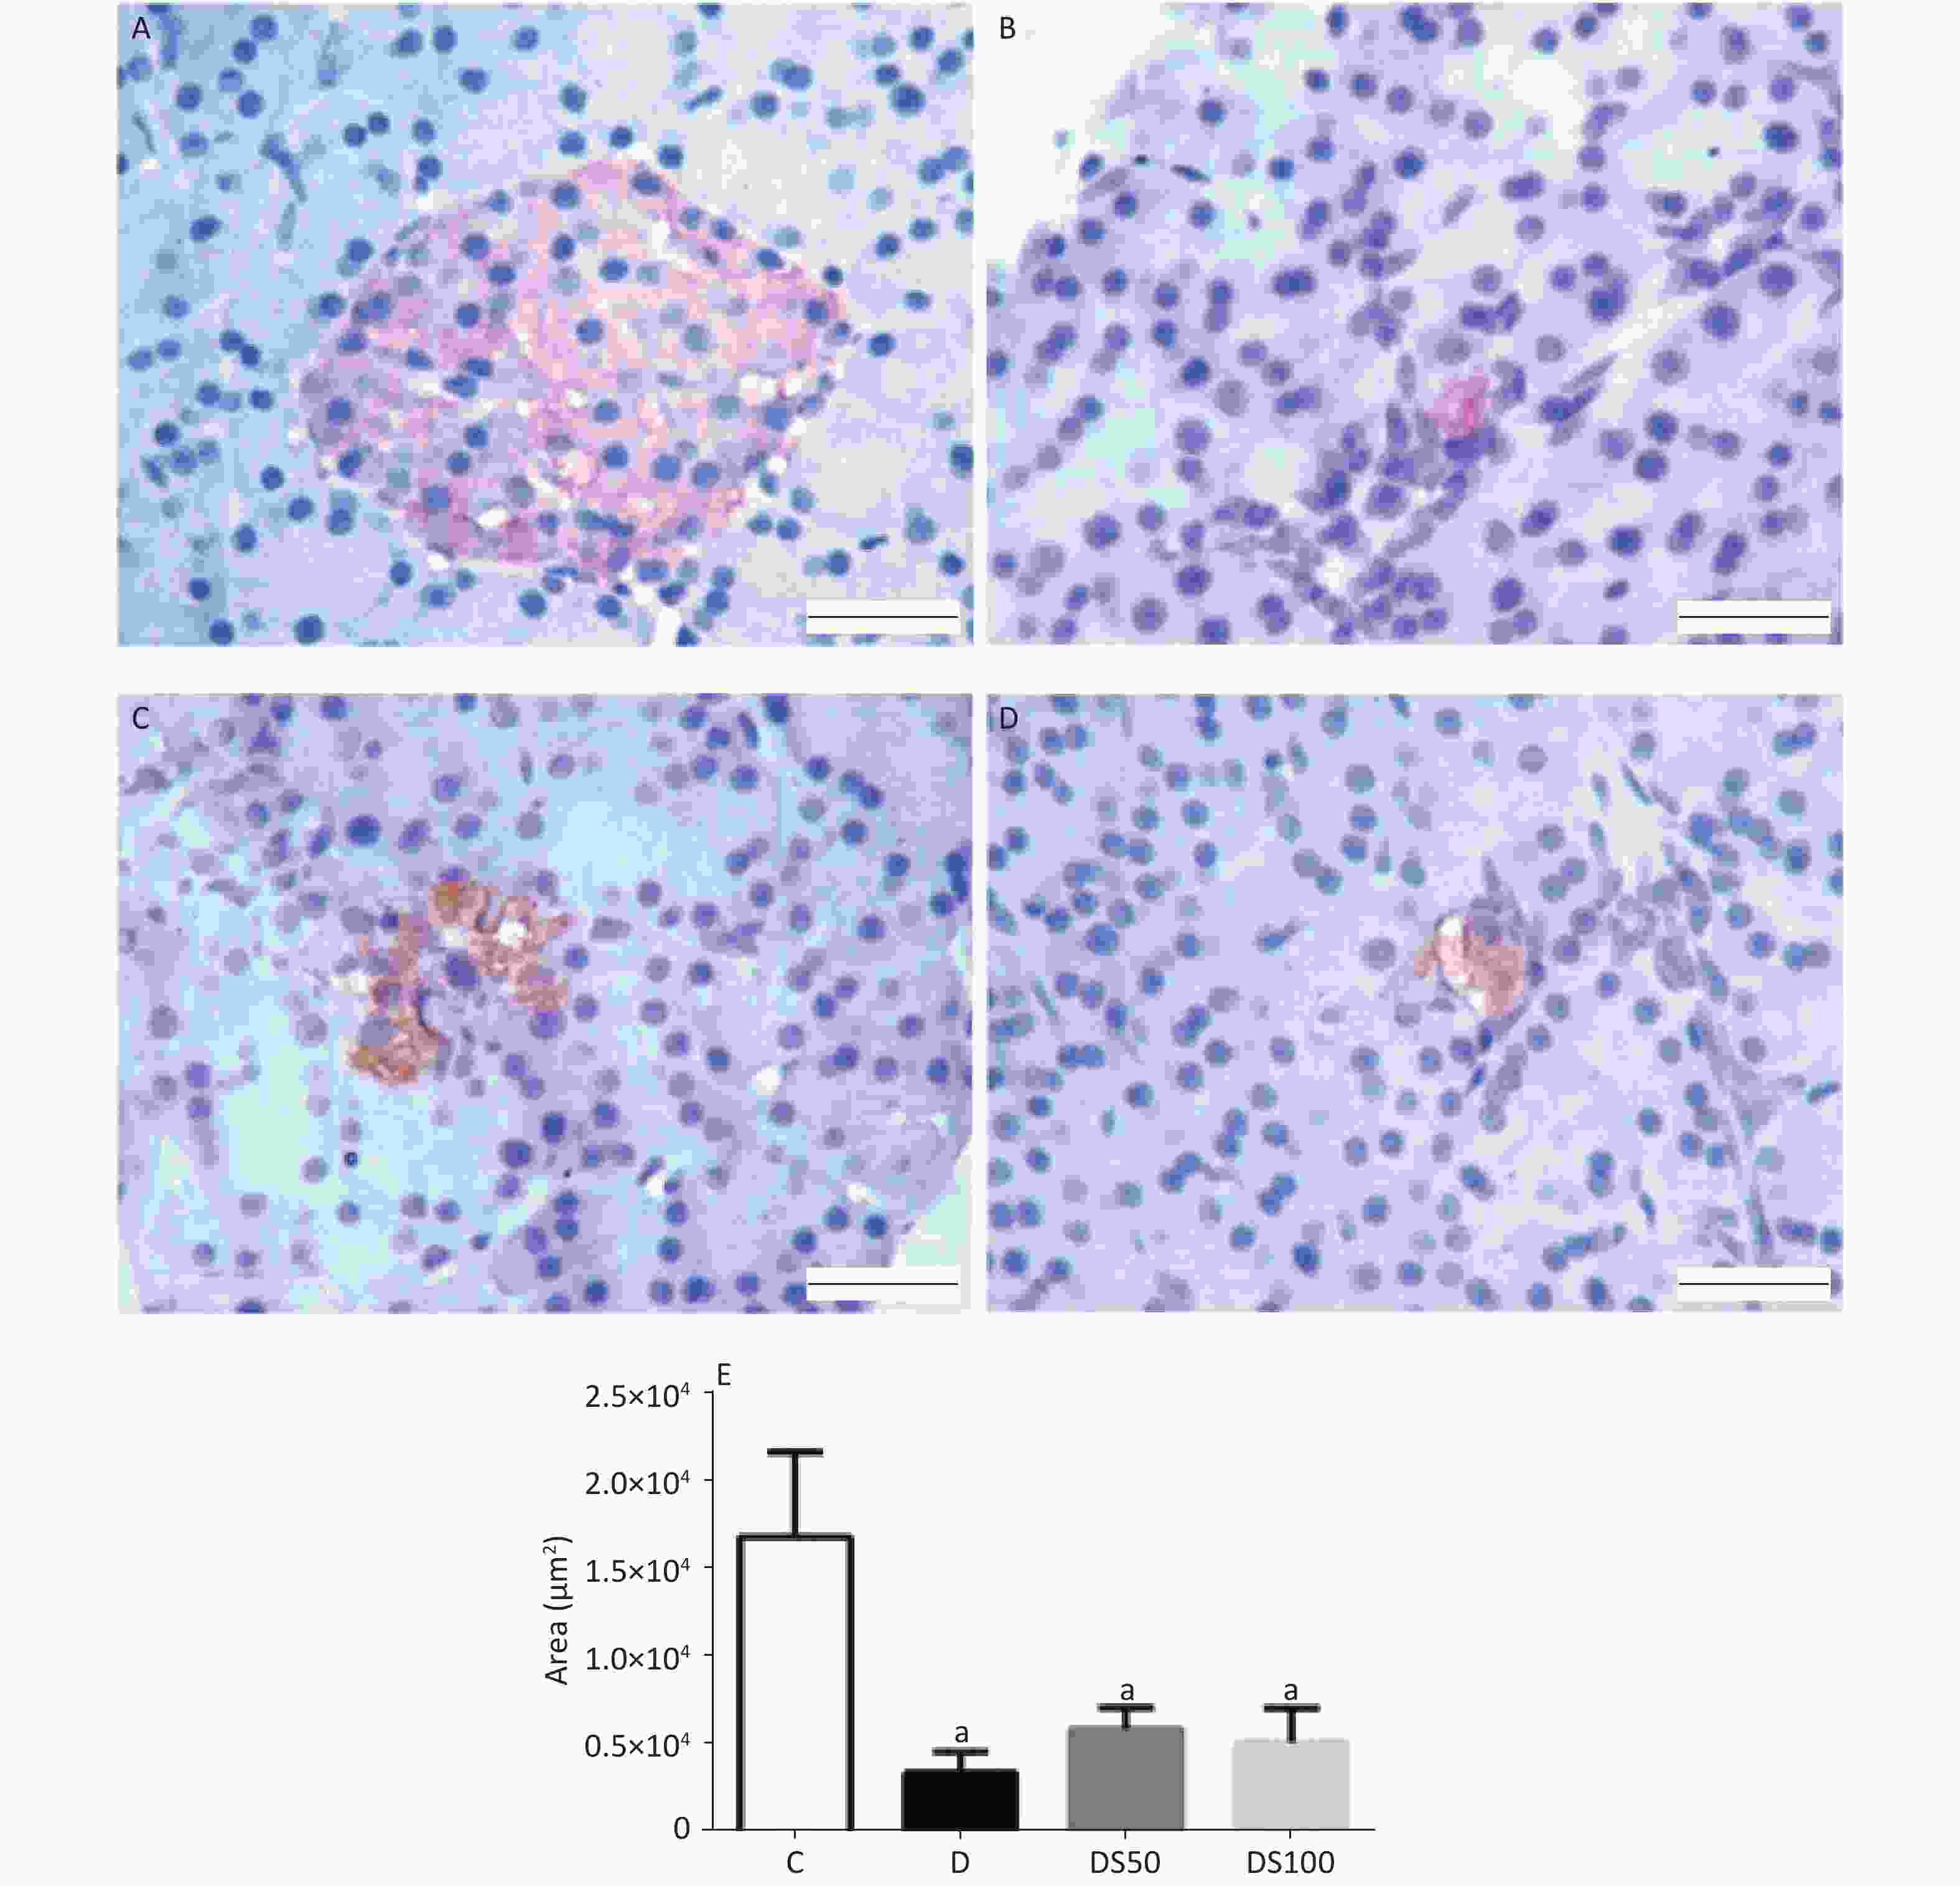
Figure 5. Silymarin (SMN) does not increase insulin biosynthesis in pancreatic islets. Representative photomicrographs of paraffinized pancreatic sections from control and experimental animals subjected to immunohistochemical analysis using the anti-insulin antibody (1:1000). The control group (A) exhibited normal immunolabeling of insulin in the pancreatic islets. The diabetic (B), DS50 (C), and DS100 (D) groups exhibited low immunolabeling of insulin. Scale bar: 100 µm. (E) The graphs of morphometric analysis of the immune-positive insulin area in pancreatic islets [a indicates significance for the following comparisons: C vs. D (P = 0.0065), C vs. DS50 (P = 0.022), and C vs. DS100 (P = 0.013)]. The data are expressed as mean ± standard error of mean. The data were analyzed by one-way analysis of variance (ANOVA), followed by Bonferroni post-hoc test. Different letters indicate significant differences (P < 0.05).
-
In this study, treatment with SMN attenuated redox imbalance and improved renal function in diabetic animals, in addition to minimizing symptoms of polyphagia and polydipsia. In short, SMN reduced hepatic and pancreatic protein damage, creatinine levels, and decreased food and water intake. However, treatment with SMN did not improve beta-cell function or decrease hyperglycemia in diabetic animals.
Several studies have investigated the role of medicinal plants exhibiting antioxidant properties have attempted to minimize oxidative stress and diabetic complications[30,31]. SMN, which exhibits antioxidant properties, can be a potential candidate to alleviate oxidative stress and metabolic abnormalities observed in diabetes[32].
Sustained hyperglycemia is reported to promote ROS generation in patients with diabetes and is closely related to the development of microvascular and macrovascular complications[7,33,34]. The alloxan-induced diabetic model exhibits increased ROS levels, which result in redox imbalance[35]. Treatment with alloxan results in hyperglycemia, hypertriglyceridemia, and impaired renal function in diabetic animals (Table 1), which leads to metabolic changes that manifest through bodyweight loss and increased food and water intake (Table 1).
The weight loss observed in diabetic animals can be due to polyuria and dehydration, as well as hyperglycemia, which enhance muscle protein catabolism[36] and TAG mobilization in the adipose tissue. In this study, the diabetic group, which exhibited high bodyweight loss, had increased blood glucose levels and serum TAG levels. This indicates enhanced mobilization of TAG in the adipose tissue. Additionally, the diabetic group exhibited increased urea levels, which may indicate increased protein catabolism (Table 1), and high dehydration as evidenced by increased water intake (Figure 1). Treatment with SMN prevented the loss of bodyweight, likely due to its ability to decrease the daily urine volume, which led to less dehydration and consequently less water intake (Figure 1), as opposed to being caused by the reduction in blood glucose since animals treated with both doses of SMN did not reduce blood glucose (Figure 1A). These results are with those of Malekinejad et al. (2012) who reported that SMN prevented diabetes-induced bodyweight loss by decreasing daily urine volume without affecting the blood glucose level in diabetic animals[36].
Glycosuria is known to induce osmotic diuresis and dehydration, which predispose the animals to acute renal failure and consequently enhanced creatinine levels[37,38]. In this study, treatment with SMN did not decrease the serum urea levels. However, treatment with SMN mitigated the alloxan-induced enhanced creatinine levels. Tuorkey, et al.[39] also assessed the serum creatinine levels in an experimental type 2 diabetes model and demonstrated that treatment with SMN (120 mg/kg bodyweight/d) for 10 d decreased the creatinine levels.yweight/d) for 10 d decreased the creatinine levels.
The liver, an organ involved in central metabolism, is the site of oxidation and detoxification processes during the early stages of many diseases, including diabetes[40]. The results of this study demonstrated that diabetic rats were associated with an imbalance in the activities of hepatic SOD and CAT (Figure 2A and 2B), which resulted in increased hepatic PC levels (Figure 2C). Oxidative damage is reported to stimulate the expression of antioxidant enzymes to minimize redox imbalance. In the liver of diabetic mice, hyperglycemia may increase antioxidant enzyme expression but impairs the activities of these enzymes, which facilitates ROS-mediated tissue damage[41].
In this study, the diabetic animals exhibited decreased hepatic CAT activity and increased hepatic SOD activity. The partial or complete inactivation of antioxidant enzymes may be caused by the glycation of some target enzymes, such as CAT[42]. Patche et al[40]. observed that unlike CAT activity, hepatic Mn-SOD or SOD2 activity was not affected by the glycation process. Thus, the liver of diabetic mice exhibited high SOD2 activity. The increased levels of SOD observed in this study may due to an adaptive response of the liver to oxidative stress[43]. SOD is one of the first antioxidant defense enzymes activated in response to oxidative stress, while the liver is involved in xenobiotic metabolism[23]. Although the increase in SOD activity was not accompanied by increased CAT activity, treatment with SMN decreased protein damage at both treatment doses. SMN may inhibit protein damage through a mechanism independent of SOD and CAT activities. Malekinejad et al[36]. demonstrated that treating diabetic rats with SMN (50 mg/kg bodyweight) for 28 d reduced hepatic oxidative stress as evidenced by the reduced levels of malondialdehyde and increased levels of glutathione peroxidase (GPx). The mechanisms involved in increasing GPx levels may also be involved in SMN-mediated protection against protein damage[22]. Vargas-Mendoza et al[22]. described the hepatoprotective effects of SMN, which include maintaining the hepatocyte membrane integrity and preventing the entry of toxic or xenobiotic substances. The phenolic nature of SMN enables it to donate electrons to stabilize free radicals and ROS and increase the intracellular reduced glutathione (GSH) content to prevent membrane lipoperoxidation[23].
The pancreas and pancreatic beta cells are among the most metabolically active organs and cells in the human body and are highly dependent on oxidative metabolism for ATP synthesis[44]. Although the pancreas is associated with high metabolic activity and ROS production through mitochondrial respiration[45], the pancreas exhibit lower expression levels of antioxidant enzymes than other tissues[46,47].
In this study, the pancreatic tissues of diabetic, DS50, and DS100 groups exhibited decreased SOD and CAT (Figure 3 A and 3B) activities. However, increased protein damage was observed only in the diabetic group (Figure 3C). There was no significant difference in the activities of SOD and CAT between the DS50 and DS100 groups. Additionally, there was no significant difference in the therapeutic efficacies of 50 and 100 mg/kg of SM. This indicated that the pharmacological effect of SMN may have plateaued (highest response achievable) at the dose of 50 mg/kg. Previous studies have reported that the response to drug concentrations can be complex and is often non-linear[48].
In the liver tissue, treatment with SMN at both doses decreased the PC levels by a mechanism independent of SOD and CAT activities. This mechanism may be dependent on the glutathione redox cycle. Frenkel et al[49]. demonstrated that N-acetyl-1-cysteine (NAC) administration induced an increase in the GSH levels in the pancreas of diabetic mice without altering the activity of other antioxidant enzymes, which decreased pancreatic oxidative stress.
The pancreatic beta cells are essential for maintaining glucose homeostasis by producing insulin in response to elevated blood glucose levels[50]. In this study, the diabetic, DS50, and DS100 groups exhibited a significant reduction in the number and area of beta pancreatic islets (Figure 4). This was consistent with decreased insulin biosynthesis (Figure 5) and persistent hyperglycemia after the treatment period. Treatment with SMN effectively reduced hepatic and pancreatic stress even under hyperglycemic conditions. Although some studies have demonstrated the anti-hyperglycemic effect of flavonoids[51-53], the findings are controversial. The dose and duration of treatments may contribute to the controversial results of the protective effects of flavonoids[36]. Thus, the doses of SMN used in this study were effective in reducing hepatic and pancreatic damage without affecting the glucose levels and pancreatic insulin production.
-
SMN improved polyphagia and polydipsia, renal function, and protected the liver and pancreas against protein damage without affecting the blood glucose levels in diabetic animals. SMN treatment was initiated after the destruction of pancreatic beta cells by alloxan, which may have masked the beneficial effect of SMN. Future studies must evaluate the effect of SMN on the glutathione redox cycle.
-
The authors declare no conflicts of interest.
-
This work was supported by Fundação de Amparo à Pesquisa do Estado de Minas Gerais (FAPEMIG), Conselho Nacional de Desenvolvimento Científico e Tecnológico (CNPq), Coordenação de Aperfeiçoamento de Pessoal de Nivel Superior (CAPES), and Universidade Federal de Ouro Preto (UFOP), Brazil. Costa D.C was supported by CNPq with the Fellowship of Research Productivity. We would like to thank Editage (www.editage.com) for English language editing.
doi: 10.3967/bes2020.090
Silymarin Attenuates Hepatic and Pancreatic Redox Imbalance Independent of Glycemic Regulation in the Alloxan-induced Diabetic Rat Model
-
Abstract:
Objective To evaluate the efficiency of silymarin (SMN) in modulating metabolic parameters and redox status in rats with type 1 diabetes mellitus (T1DM). Methods Diabetes was induced by intraperitoneal injection of alloxan. The diabetic rats were administered with SMN at doses of 50 and 100 mg/kg body weight/d for 30 consecutive days. The rats were divided into the following four groups: vehicle control, diabetic (alloxan-treated), DS50 (alloxan + 50 mg/kg body weight/d of SMN), and DS100 (alloxan + 100 mg/kg body weight/d of SMN) groups. The bodyweight and food and water intake were evaluated. After 30 d, the animals were euthanized and the blood was collected for measuring the serum levels of glucose, triacylglycerol (TAG), urea, and creatinine. The liver and pancreas were collected for measuring the activities of superoxide dismutase (SOD) and catalase (CAT), and the levels of carbonylated protein (PC). The pancreas sample was also used for histological analysis. Results SMN reduced hepatic (P < 0.001) and pancreatic (P < 0.001) protein damage and creatinine levels (P = 0.0141) in addition to decreasing food (P < 0.001) and water intake (P < 0.001). However, treatment with SMN did not improve beta-cell function or decrease blood glucose levels in diabetic rats. Conclusion SMN improved polyphagia and polydipsia, renal function, and protected the liver and pancreas against protein damage without affecting hyperglycemia in diabetic animals. -
Key words:
- Silymarin /
- Silybum marianum /
- Type 1 diabetes /
- Oxidative stress
-
S1. Graphical abstract. SMN treatment reduced polyphagia, polydipsia, enhanced serum creatinine levels, and enhanced hepatic and pancreatic PC levels at both treatment doses in the alloxan-induced type 1 diabetic rat model. ↑, increased; ↓, decreased; TAG, triacylglycerol; PC, carbonylated protein; SMN, silymarin
Figure 1. Silymarin (SMN) attenuates polyphagia and polydipsia. (A) The difference between final and initial bodyweights of different groups (in grams) [a indicates significance for the following comparisons: C vs. D (P = 0.0007), C vs. DS50 (P = 0.0006), and C vs. DS100 (P = 0.0443)]. (B) The food intake (in grams) by different groups [a indicates significance for C vs. D (P < 0.0001); b indicates significance for the following comparisons: D vs. DS50 (P = 0.0173); c indicates significance for D vs. DS100 (P = 0.0001)]. (C) The water intake (in milliliters) by different groups [a indicates significance for C vs. D (P < 0.0001); b indicates significance for D vs. DS50 (P = 0.0161); c indicates significance for the following comparisons: D vs. DS100 (P = 0.0001) and C vs. DS100 (P > 0.9999)]. The data are expressed as mean ± standard error of mean. The data are analyzed by one-way analysis of variance (ANOVA), followed by the Bonferroni post-hoc test. Different letters indicate statistical differences.
Figure 2. Silymarin (SMN) alleviates oxidative damage to proteins in the liver tissue. (A) The hepatic superoxide dismutase (SOD) activity in different groups [a indicates significance for the following comparisons: C vs. D (P = 0.0002), C vs. DS50 (P = 0.0007), and C vs. DS100 (P < 0.0001)]. (B) The hepatic catalase (CAT) activity in different groups [a indicates significance for the following comparisons: C vs. D (P < 0.0001), C vs. DS50 (P = 0.0007), and C vs. DS100 (P = 0.0019)]. (C) The hepatic carbonylated protein (PC) level in different groups [a indicates significance for the following comparisons: C vs. D (P = 0.0177), while b indicates significance for following comparisons: D vs. DS50 (P < 0.0001), D vs. DS100 (P = 0.0028), C vs. DS50 (P = 0.1389), and C vs. DS100 (P > 0.9999)]. C, vehicle control group (untreated); D, diabetic group (alloxan-treated); DS50, group treated with alloxan + 50 mg/kg bodyweight/d of SMN; DS100, group treated with alloxan + 100 mg/kg bodyweight/d of SMN. The data are expressed as mean ± standard error of mean. The data are analyzed by one-way analysis of variance (ANOVA), followed by the Bonferroni post-hoc test. Different letters indicate statistical differences (P < 0.05).
Figure 3. Silymarin (SMN) alleviates oxidative damage to proteins in the pancreatic tissue. (A) The pancreatic superoxide dismutase (SOD) activity in different groups (a indicates significance for the following comparisons: C vs. D (P = 0.0021), C vs. DS50 (P < 0.0001), and C vs. DS100 (P < 0.0001)). (B) The pancreatic catalase (CAT) activity in different groups [a indicates significance for the following comparisons: C vs. D (P < 0.0001), C vs. DS50 (P < 0.0001), and C vs. DS100 (P < 0.0001)]. (C) The pancreatic carbonylated protein (PC) level in different groups [a indicates significance for the following comparisons: C vs. D (P = 0.0415); b, D vs. DS50 (P = 0.0023), D vs. DS100 (P = 0.0001), C vs. DS50 (P = 0.7969), and C vs. DS100 (P = 0.0943)]. C, vehicle control group (untreated); D, diabetic group (alloxan-treated); DS50, group treated with alloxan + 50 mg/kg bodyweight/d of SMN; DS100, group treated with alloxan + 100 mg/kg bodyweight/d of SMN. The data are expressed as mean ± standard error of mean. The data were analyzed by one-way analysis of variance (ANOVA), followed by the Bonferroni post-hoc test. Different letters indicate statistical differences (P < 0.05).
Figure 4. Silymarin (SMN) does not increase the number or area of beta pancreatic islets. Representative photomicrographs of paraffinized sections of experimental and control pancreas tissues stained with hematoxylin and eosin. Control group (A) with normal pancreatic islet architecture. Diabetic (B), DS50 (C), and DS100 (D) groups exhibiting decreased areas of pancreatic islets. In the photomicrographs, pi indicates pancreatic islet, pd indicates pancreatic duct, and pa indicates pancreatic acinus. Scale bar: 100 µm. The graphs of morphometric analysis of (E) number of pancreatic islets [a indicates significance for the following comparisons: C vs. D (P < 0.001), C vs. DS50 (P < 0.001), and C vs. DS100 (P < 0.001)] and (F) area of beta pancreatic islets [a indicates significance for the following comparisons: C vs. D (P = 0.019), C vs. DS50 (P < 0.001), and C vs. DS100 (P = 0.014)]. The data were expressed as mean ± standard error of mean. The data were analyzed by one-way analysis of variance (ANOVA), followed by Bonferroni post-hoc test. Different letters indicate significant differences (P < 0.05).
Figure 5. Silymarin (SMN) does not increase insulin biosynthesis in pancreatic islets. Representative photomicrographs of paraffinized pancreatic sections from control and experimental animals subjected to immunohistochemical analysis using the anti-insulin antibody (1:1000). The control group (A) exhibited normal immunolabeling of insulin in the pancreatic islets. The diabetic (B), DS50 (C), and DS100 (D) groups exhibited low immunolabeling of insulin. Scale bar: 100 µm. (E) The graphs of morphometric analysis of the immune-positive insulin area in pancreatic islets [a indicates significance for the following comparisons: C vs. D (P = 0.0065), C vs. DS50 (P = 0.022), and C vs. DS100 (P = 0.013)]. The data are expressed as mean ± standard error of mean. The data were analyzed by one-way analysis of variance (ANOVA), followed by Bonferroni post-hoc test. Different letters indicate significant differences (P < 0.05).
Table 1. Silymarin (SMN) improves kidney function
Experimental groups C D DS50 DS100 Glucose (mg/dL) 150.0 ± 8.75 540.90 ± 40.78 a 492.50 ± 27.39 a 567.10 ± 44.06 a Triacylglycerol (mg/dL) 71.61 ± 6.69 141.30 ± 22.87 a 152.10 ± 9.20 a 185.50 ± 21.88 a Urea (mg/dL) 37.20 ± 0.63 134.0 ± 8.63 a 137.0 ± 6.40 a 140.0 ± 6.97 a Creatinine (mg/dL) 0.42 ± (0.36−0.59) 0.95 ± (0.70−1.28) a 0.60 ± (0.35−0.73) b 0.64 ± (0.34−0.79) a Note. C, vehicle control group (untreated); D, diabetic group (alloxan-treated); DS50, group treated with alloxan + 50 mg/kg bodyweight/d of SMN; DS100, treated with alloxan + (100 mg/kg bodyweight/d of SMN). In glucose levels, a indicates significance with the following comparisons: C vs. D (P < 0.0001), C vs. DS50 (P < 0.0001), and C vs. DS100 (P < 0.0001). In triacylglycerol levels, a indicates significance for the following comparisons: C vs. D (P = 0.0427), C vs. DS50 (P = 0.0050), and C vs. DS100 (P = 0.0005). In urea levels, a indicates significance for the following comparisons: C vs. D (P < 0.0001), C vs. DS50 (P < 0.0001), and C vs. DS100 (P < 0.0001). In creatinine levels, a indicates significance for the following comparisons: C vs. D (P = 0.0087), D vs. DS100 (P = 0.0999), and C vs. DS100 (P = 0.8132), while b indicates significance for the following comparisons: D vs. DS50 (P = 0.0476) and C vs. DS50 (P = 0.7758). The data are expressed as mean ± standard error of mean (for the levels of glucose, TAG, and urea) or as median and interquartile range (for creatinine levels). The data were analyzed by one-way analysis of variance (ANOVA), followed by the Bonferroni post-hoc test. Different letters indicate statistical differences (P < 0.05).  下载: 导出CSV
-
[1] A DA. Diagnosis and classification of diabetes mellitus, ADA clinical practice recommendations. Diabetes Care, 2013; 36, S67−74. doi: 10.2337/dc13-S067 [2] International Diabetes Federation.Intergrated data file, Eighth edition 2017. 2017, 46. [3] Nathan DM, Genuth S, Lachin J, et al. The effect of intensive treatment of diabetes on the development and progression of long-term complications in insulin-dependent diabetes mellitus. N Engl J Med, 1993; 329, 977−86. doi: 10.1056/NEJM199309303291401 [4] Wright LA, Hirsch IB. Non‐insulin treatments for type 1 diabetes: critical appraisal of the available evidence and insight into future directions. Diabet Med, 2019; 36, 665−78. doi: 10.1111/dme.13941 [5] Amorim RG, Guedes G da S, Vasconcelos SM de L, et al. Kidney disease in diabetes mellitus: cross-linking between hyperglycemia, redox imbalance and inflammation. Arq Bras Cardiol, 2019; 112, 577−87. [6] Queiroz PC de, Aguiar DC, Pinheiro, et al. Prevalence of micro and macrovasculars complications and the risk factors in patients with diabetes mellitus and metabolic syndrome. Rev Bras Clin Med, 2011; 9, 254−8. [7] Volpe CMO, Delfino PHV, Anjos PMF, et al. Morte celular, espécies reativas de oxigênio (ROS) e complicações diabéticas. Cell Death Dis, 2018; 9, 1−29. doi: 10.1038/s41419-017-0012-9 [8] Maiese K. New insights for oxidative stress and diabetes mellitus. Vol. 2015, Oxidative Medicine and Cellular Longevity. Hindawi Limited; 2015. [9] Taniyama Y, Griendling KK. Reactive oxygen species in the vasculature: molecular and cellular mechanisms. Hypertension, 2003; 42, 1075−81. doi: 10.1161/01.HYP.0000100443.09293.4F [10] Baynes JW. Role of oxidative stress in development of complications in diabetes. Diabetes, 1991; 40, 405−12. [11] Darmaun D, Smith SD, Sweeten S, et al. Poorly controlled type 1 diabetes is associated with altered glutathione homeostasis in adolescents: Apparent resistance to N -acetylcysteine supplementation. Pediatr Diabetes, 2008; 9, 577−82. doi: 10.1111/j.1399-5448.2008.00436.x [12] Araujo CM, Lúcio KDP, Silva ME, et al. Morus nigra leaf extract improves glycemic response and redox profile in the liver of diabetic rats. Food Funct, 2015; 6, 3490−9. doi: 10.1039/C5FO00474H [13] Rossoni Jr JV, Araújo GR, Pádua BDC, et al. Annatto extract and β-carotene enhances antioxidant status and regulate gene expression in neutrophils of diabetic rats. Free Radic Res, 2012; 46, 329−38. doi: 10.3109/10715762.2012.656100 [14] Ghasemi H, Einollahi B, Kheiripour N, et al. Protective effects of curcumin on diabetic nephropathy via attenuation of kidney injury molecule 1 (KIM-1) and neutrophil gelatinase-associated lipocalin (NGAL) expression and alleviation of oxidative stress in rats with type 1 diabetes. Iran J Basic Med Sci, 2019; 22, 376−83. [15] Dallaqua B, Damasceno DC. Comprovação do efeito antioxidante de plantas medicinais utilizadas no tratamento do Diabetes mellitus em animais: artigo de atualização. Rev Bras Pl Med, 2011; 13, 367−73. [16] Babu NR. Studies on the evaluation of antidiabetic and antioxidant activities using some selected medicinal plants. Int J Herb Med, 2016; 4, 21−4. doi: 10.22271/flora.2016.v4.i3.05 [17] Hadi A, Pourmasoumi M, Mohammadi H, et al. The effects of silymarin supplementation on metabolic status and oxidative stress in patients with type 2 diabetes mellitus: a systematic review and meta-analysis of clinical trials. Complement Ther Med, 2018; 41, 311−9. doi: 10.1016/j.ctim.2018.08.010 [18] Stolf AM, Campos Cardoso C, Morais H de, et al. Effects of silymarin on angiogenesis and oxidative stress in streptozotocin-induced diabetes in mice. Biomed Pharmacother, 2018; 108, 232−43. doi: 10.1016/j.biopha.2018.09.042 [19] Gazak R, Walterova D, Kren V. Silybin and silymarin - new and emerging applications in medicine. Curr Med Chem, 2007; 14, 315−38. doi: 10.2174/092986707779941159 [20] Gharagozloo M, Jafari S, Esmaeil N, et al. Immunosuppressive effect of silymarin on mitogen-activated protein kinase signalling pathway: The impact on T cell proliferation and cytokine production. Basic Clin Pharmacol Toxicol, 2013; 113, 209−14. doi: 10.1111/bcpt.12088 [21] Surai PF. Silymarin as a natural antioxidant: an overview of the current evidence and perspectives. Antioxidants, 2015; 4, 204−47. doi: 10.3390/antiox4010204 [22] Vargas-Mendoza N, Madrigal-Santillán E, Morales-González Á, et al. Hepatoprotective effect of silymarin. World J Hepatol, 2014; 6, 144−9. doi: 10.4254/wjh.v6.i3.144 [23] Karimi G, Vahabzadeh M, Lari P, et al. Silymarin, a promising pharmacological agent for treatment of diseases. Iran J Basic Med Sci, 2011; 14, 308−17. [24] Miranda PH de A, Monteiro OM, Rossoni Jr J V, et al. Vildagliptin induces beta-cell neogenesis and improves the lipid profile in a later phase of type 1 diabetes. Curr Pharm Biotechnol, 2015; 16, 60−5. doi: 10.2174/1389201015666141113124341 [25] Miranda PH de A, Lacerda KCD, Araújo CM, et al. Oral formulation of DPP-4 inhibitor plus Quercetin improves metabolic homeostasis in type 1 diabetic rats. Sci Rep, 2018; 8, 1−12. doi: 10.1038/s41598-017-17765-5 [26] Marklund S, Marklund G. Involvement of superoxide anion radical in the autooxidation of pyrogallol and a convenient assay for superoxide dismutase. Eur J Biochem, 1974; 47, 469−74. doi: 10.1111/j.1432-1033.1974.tb03714.x [27] Aebi H. Catalase in vitro. Methods Enzymol, 1984; 105, 106−21. [28] Levine RL, Williams JA, Stadtman EP, et al. Carbonyl assays for determination of oxidatively modified proteins. Methods Enzymol, 1994; 233, 346−57. doi: 10.1016/S0076-6879(94)33040-9 [29] Lowry OH, Rosebrough NJ, Farr AL, et al. Protein measurement with the Folin phenol reagent. J Biol Chem, 1951; 193, 265−75. [30] Kumar S, Pandey AK. Chemistry and Biological Activities of Flavonoids: An Overview. Sci World J, 2013; 2013, 1−16. [31] Falleh H, Ksouri R, Chaieb K, et al. Phenolic composition of Cynara cardunculus L. organs, and their biological activities. Comptes Rendus - Biol, 2008; 331, 372−9. doi: 10.1016/j.crvi.2008.02.008 [32] Stolf AM, Cardoso CC, Acco A. Effects of silymarin on diabetes mellitus complications: a review. Phyther Res, 2017; 9, 9. [33] Ceriello A, Testa R, Genovese S. Clinical implications of oxidative stress and potential role of natural antioxidants in diabetic vascular complications. Nutr Metab Cardiovasc Dis, 2016; 26, 285−92. doi: 10.1016/j.numecd.2016.01.006 [34] Ferreira ALA, Matsubara LS. Radicais livres: conceitos, doenças relacionadas, sistema de defesa e estresse oxidativo. Rev Assoc Med Bras. março de 1997; 43, 61–8. [35] Lenzen S. The mechanisms of alloxan- and streptozotocin-induced diabetes. Diabetologia. fevereiro de 2008; 51, 216–26. [36] Malekinejad H, Rezabakhsh A, Rahmani F, et al. Silymarin regulates the cytochrome P450 3A2 and glutathione peroxides in the liver of streptozotocin-induced diabetic rats. Phytomedicine, 2012; 19, 583−90. doi: 10.1016/j.phymed.2012.02.009 [37] Vessal G, Akmali M, Najafi P, et al. Silymarin and milk thistle extract may prevent the progression of diabetic nephropathy in streptozotocin-induced diabetic rats. Ren Fail, 2010; 32, 733−9. doi: 10.3109/0886022X.2010.486488 [38] Patel SS, Shah RS, Goyal RK. Antihyperglycemic, antihyperlipidemic and antioxidant effects of Dihar, a polyherbal ayurvedic formulation in streptozotocin induced diabetic rats. Indian J Exp Biol, 2009; 47, 564−70. [39] Tuorkey MJ, El-Desouki NI, Kamel R. Cytoprotective effect of silymarin against diabetes-induced cardiomyocyte apoptosis in diabetic rats. Biomed Environ Sci, 2015; 28, 36−43. [40] Patche J, Girard D, Catan A, et al. Diabetes-induced hepatic oxidative stress: a new pathogenic role for glycated albumin. Free Radic Biol Med, 2017; 102, 133−48. doi: 10.1016/j.freeradbiomed.2016.11.026 [41] Friguet B. Oxidized protein degradation and repair in ageing and oxidative stress. FEBS Lett, 2006; 580, 2910−6. doi: 10.1016/j.febslet.2006.03.028 [42] Bakala H, Hamelin M, Mary J, et al. Catalase, a target of glycation damage in rat liver mitochondria with aging. Biochim Biophys Acta - Mol Basis Dis, 2012; 1822, 1527−34. doi: 10.1016/j.bbadis.2012.05.016 [43] Ataihire JU, Nwangwa EK, Igweh JC. Modulations in anti-oxidant activities of selected gastro-intestinal tissues in alloxan-induced, silymarin treated diabetic wistar rats. Open J Gastroenterol, 2019; 09, 73−90. doi: 10.4236/ojgas.2019.95010 [44] Sekine N, Cirulli V, Regazzi R, et al. Low lactate dehydrogenase and high mitochondrial glycerol phosphate dehydrogenase in pancreatic β-cells. Potential role in nutrient sensing. J Biol Chem, 1994; 269, 4895−902. [45] Leloup C, Tourrel-Cuzin C, Magnan C, et al. Mitochondrial reactive oxygen species are obligatory signals for glucose-induced insulin secretion. Diabetes, 2009; 58, 673−81. doi: 10.2337/db07-1056 [46] Lenzen S, Drinkgern J, Tiedge M. Low antioxidant enzyme gene expression in pancreatic islets compared with various other mouse tissues. Free Radic Biol Med, 1996; 20, 463−6. doi: 10.1016/0891-5849(96)02051-5 [47] Lenzen S. Oxidative stress: The vulnerable β-cell. Biochem Soc Trans. junho de 2008; 36, 343–7. [48] Yordanov P, Stelling J. Steady-state differential dose response in biological systems. Biophys J, 2018; 114, 723−36. doi: 10.1016/j.bpj.2017.11.3780 [49] Frenkel LA, Ozenfeld H, Rozenberg K, et al. N-acetyl-l-cysteine supplement in early life or adulthood reduces progression of diabetes in nonobese diabetic mice. Curr Dev Nutr, 2018; 3, 1−11. [50] Wang J, Wang H. Oxidative stress in pancreatic beta cell regeneration. Oxid Med Cell Longev, 2017; 2017, 1−9. [51] El-far YM, Zakaria M, Mahmoud MG, et al. A newly developed silymarin nanoformulation as a potential antidiabetic agent in experimental diabetes. Futur Med Ltd, 2016; 11, 2581−602. [52] Soto C, Mena R, Luna J, et al. Silymarin induces recovery of pancreatic function after alloxan damage in rats. Life Sci, 2004; 75, 2167−80. doi: 10.1016/j.lfs.2004.04.019 [53] Amniattalab A, Malekinejad H, Rezabakhsh A. Silymarin: a novel natural agent to restore defective pancreatic β cells in streptozotocin (STZ) -induced diabetic rats. Iran J Pharm Res, 2015; 15, 493−500. -

 点击查看大图
计量
- 文章访问数: 1963
- HTML全文浏览量: 844
- PDF下载量: 111
- 被引次数: 0

 Quick Links