

 下载:
下载:


-
Tuberculosis (TB) remains a global threat to human health disproportionately affecting the poor and vulnerable populations. China ranked second in the global TB burden in 2020[1,2]. The Xinjiang Autonomous Region has one of the most serious TB epidemics in China[3], especially in the southern region of Xinjiang[4]. Among the provinces wherein TB prevalence surveys were conducted after 2010, its prevalence in Xinjiang (430/100,000) was the highest[5]. Of the reported cases in Xinjiang, 70% were from the southern region[6] with Kashgar being one of the most densely distributed regions[7].
In high-burden areas, transmission severely exacerbates the TB epidemic[8]. In addition, high burden regions are plagued by the transmission of drug-resistant (DR) strains[9]. In the past, it was thought that DR-TB was caused by the development of resistance during antituberculosis treatment (acquired resistance); however, recent studies have shown that the direct transmission of DR strains between individuals (transmitted resistance) is also significant[10,11]. Transmission dynamics are heterogeneous in different regions[12], and understanding local transmission patterns can help to develop effective prevention and control strategies. For example, in San Francisco, molecular epidemiological studies began after 1990 to identify clustered strains, high-risk groups for recent transmission (HIV-infected people and African Americans), and transmission sites (hospitals and bars). Targeted control measures were implemented, thereby resulting in a significant decrease in the incidence of TB (from 51.2/100,000 in 1992 to 29.8/100,000 in 1997)[13-16].
The complex socioeconomic and ethnic composition of Xinjiang highlights the need to study TB transmission and drug resistance in this region. Therefore, we analyzed the whole-genome sequences of 1,668 clinical strains from the region in 2020 to reveal drug resistance characteristics, identify risk factors for recent transmission, and infer the proportion of transmitted drug resistance. This will provide necessary information on the TB situation in the region to assist in control activities to suppress the disease.
-
Kashgar Prefecture is located southwest Xinjiang, bordering Tajikistan, Afghanistan, and Pakistan, and is close to North India. The prefecture is divided into 11 counties and one county-level city. TB is diagnosed and treated at designated medical institutions (People’s Hospitals in each county and the TB dispensary in the county-level city). According to the Chinese National guidelines[17], each patient who visited the hospital, underwent smear microscopy and sputum culture. Culture-positive strains were transported uniformly to the TB dispensary of Kashgar Prefecture for strain preservation, and the Chinese Center for Disease Control and Prevention collected patient strains from the dispensary in 2020. Demographic and clinical information of patients with TB were submitted to the National TB Reporting System. Unfavorable outcomes included treatment failure, death, and lack of follow-up.
-
Genomic DNA was extracted using the cetyltrimethylammonium bromide (CTAB) method[18]. A 150 bp fragment length library was constructed for each sample, and sequencing was performed on an Illumina Novaseq6000 platform (Illumina Inc. San Diego, CA, USA), using a paired-end strategy. We used a suite of validated software for SNP calling[19,20]. Each SNP was supported by at least five reads, with at least one read in each sequencing direction. Strains with a sequencing depth below 20× or a mapping coverage of less than 95% were also excluded.
Whole-genome sequencing has been proposed as the ultimate molecular diagnostic test for detecting all molecular determinants of resistance[21]; therefore, we used whole-genome sequencing (WGS) to detect drug resistance in strains. The drug resistance profiles were predicted based on known drug resistance-conferring mutations[22] for 14 anti-TB drugs. Pairwise SNP distances were calculated based on fixed mutations (frequency ≥ 75%)[23,24]. Strains were grouped into genomic clusters based on the criterion that the maximum pairwise distance between at least two strains should be 12 or fewer single nucleotide polymorphisms (SNPs). Single SNPs related to drug resistance mechanisms were excluded when calculating pairwise distances.
Lineages of each strain were identified as described by Coll et al.[25]. Phylogenetic trees were constructed using MEGA X[26] with the maximum likelihood method. The trees were visualized using an Interactive Tree of Life (https://itol.embl.de/).
-
Transmitted resistance included both resistant strains from recent transmissions and resistant strains isolated from new cases. Resistant strains of recent transmission were screened from drug-resistant strains in genomic clusters using the location of DR mutations on the phylogenetic tree: first, mutations that were inherited from an inferred common ancestor indicated recent transmission, whereas mutations on terminal tips were independently acquired[27]. Second, for clustered DR strains, as long as one resistance mutation was caused by recent transmission, the strain was considered to be resistant because of recent transmission (if all resistant mutations were acquired independently, the strain was not considered to be resistant because of recent transmission). This allowed the exclusion of strains that had independently acquired resistance mutations after recent transmission, as opposed to simply determining whether the DR strains were clustered[28]. For resistant strains that were not clustered, or clustered but not resistant because of recent transmission, transmitted resistance was considered if the strain was from a new case[23,28]. When calculating the proportion of transmitted resistance, strains that could not be identified owing to a lack of information on treatment history were excluded.
-
Categorical data were described as proportions (%). For categorical data, differences between groups were tested using the chi-square test or corrected chi-square test. Fisher's exact probability test was used when conditions of the chi-square test were not met. The Kruskal–Wallis test was used to compare the three groups of continuous non-normal data. Bonferroni-adjusted alpha levels were used for two-by-two comparisons. Risk factors were analyzed using univariate and multivariate logistic regression. Factors with a P-value less than 0.2 in the univariate regression were entered into the multivariate analysis. Patients with missing demographic and clinical information were excluded from the logistic analyses. All tests were two-sided, and statistical significance at 95% confidence level was defined as P < 0.05. All statistical analyses were performed using SPSS V25.0 (IBM Corp., Armonk, NY, USA). The geographical distribution of culture-positive TB cases was mapped using ArcGIS (version 10.8.1). Spatial aggregation was analyzed using kernel density estimation methods with Gaussian smoothing.
-
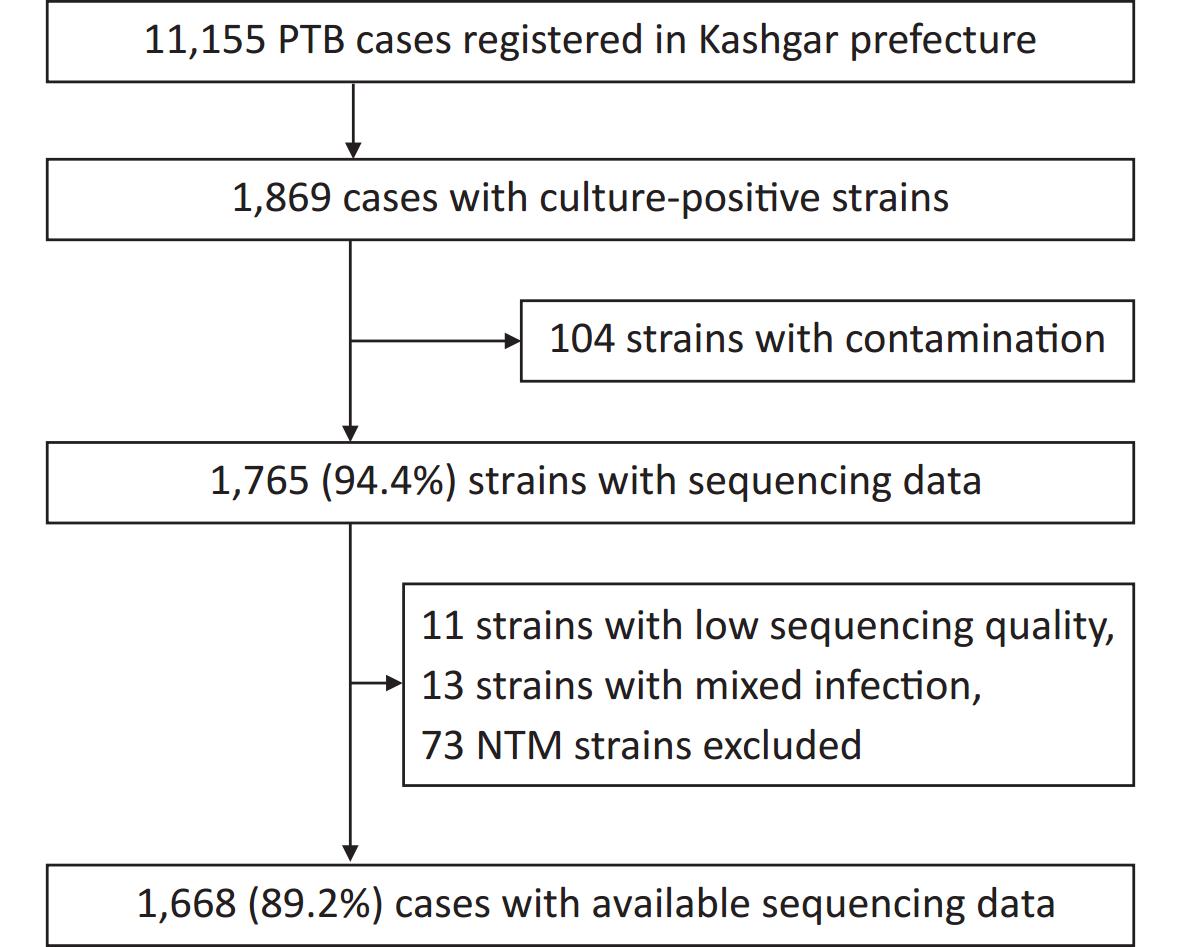
A total of 11,155 patients with pulmonary TB were reported from January 1 to December 31, 2020, of which 1,869 were culture-positive. Of the 1,869 patients, 201 were excluded because of infection with non-tuberculosis mycobacteria (NTM), contaminated strains, or ineligible whole-genome sequences, leaving 1,668 patients (Figure 1). For the 1,630 patients with demographic and clinical information (such information was lacking for the remaining 38 patients), the median age was 62 years (interquartile range, 42–71 years). Half of the patients (50.0%, 815/1,630) were male and the majority (81.7%, 1,331/1,630) were farmers (Table 1).
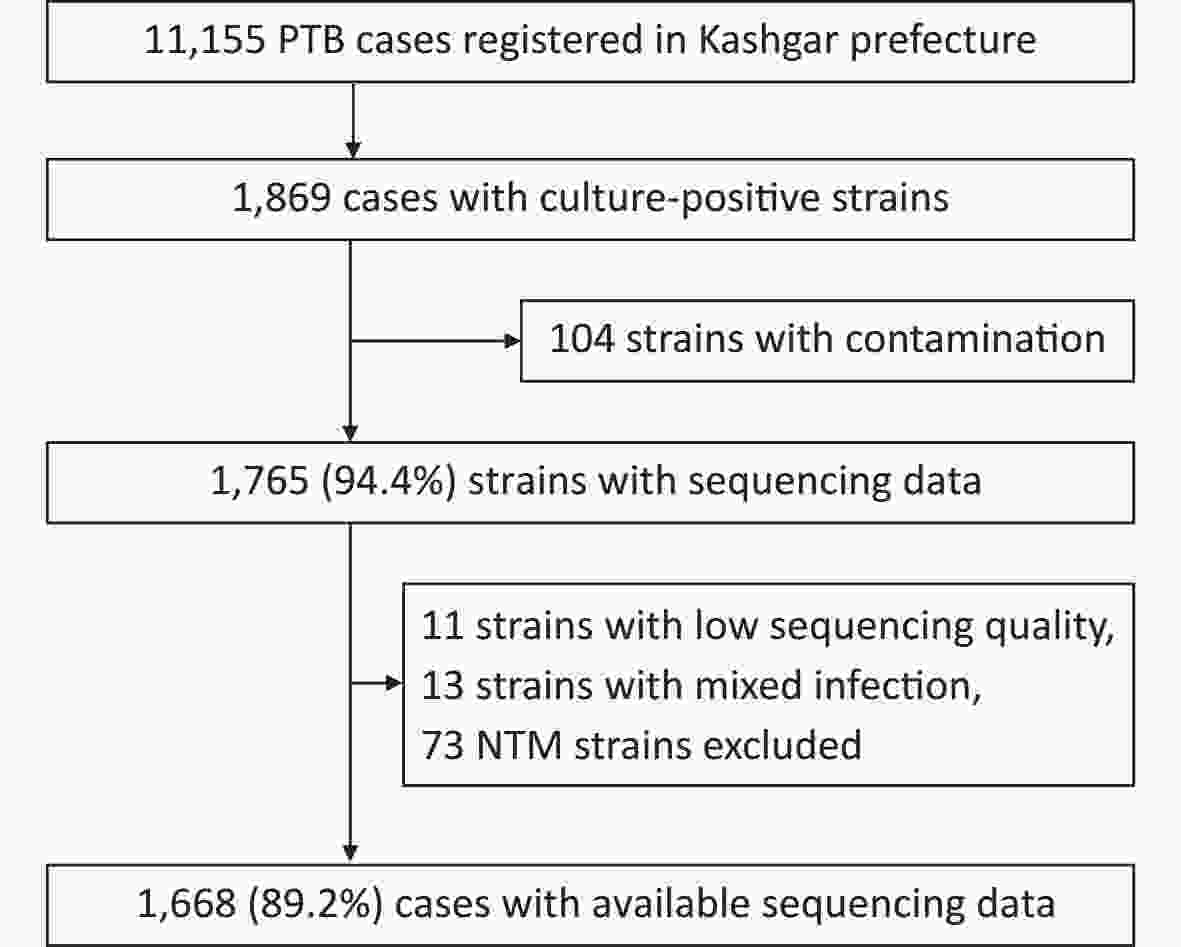
Figure 1. Patient enrollment and study flowchart. NTM, non-tuberculosis mycobacteria; PTB, pulmonary TB.
Table 1. Demographic and clinical information of patients included in the study (n, %)
Variables Total New cases Previously treated cases χ2 P value Demographic factors Sex 0.535 0.464 Female 815 (50.0) 651 (50.5) 164 (48.2) Male 815 (50.0) 639 (49.5) 176 (51.8) Age (years) 40.268 < 0.001 0– 332 (20.4) 291 (22.6) 41 (12.0) 36– 175 (10.7) 152 (11.8) 23 (6.8) 51– 431 (26.4) 346 (26.8) 85 (25.0) ≥ 66 692 (42.5) 501 (38.8) 191 (56.2) Ethnic group 1.237 0.266 Uighur 1,593 (97.7) 1,258 (97.5) 335 (98.5) Others 37 (2.3) 32 (2.5) 5 (1.5) Occupation 6.463 0.091 Farmers or pastoralists 1,331 (81.7) 1,040 (80.6) 291 (85.6) Housekeeping or unemployed 184 (11.3) 151 (11.7) 33 (9.7) Students 54 (3.3) 49 (3.8) 5 (1.5) Others 61 (3.7) 50 (3.9) 11 (3.2) Clinical factors Smear 0.321 0.571 Negative 1,128 (69.2) 897 (69.5) 231 (67.9) Positive 502 (30.8) 393 (30.5) 109 (32.1) HIV 0.177 0.674 Negative 1,560 (95.7) 1,236 (95.8) 324 (95.3) Unknown 70 (4.3) 54 (4.2) 16 (4.7) Patient source 2.948 0.229 Health check or proactive screening 1,008 (61.8) 796 (61.7) 212 (62.4) Referrals 392 (24.0) 303 (23.5) 89 (26.2) Direct consultation 230 (14.1) 191 (14.8) 39 (11.5) Treatment outcome 12.266 < 0.001 Unfavorable outcomes 94 (5.8) 61 (4.7) 33 (9.7) Others 1,536 (94.2) 1,229 (95.3) 307 (90.3) Total delay (weeks) 13.865 0.003 < 4 672 (41.2) 533 (41.3) 139 (40.9) 4– 439 (26.9) 362 (28.1) 77 (22.6) 8– 337 (20.7) 269 (20.9) 68 (20.0) ≥ 12 182 (11.2) 126 (9.8) 56 (16.5) Note. For demographic and clinical factors, N = 1,630. The proportion of previously treated cases in Kashgar was 20.9% (340/1,630). Compared with new cases, previously treated cases tended to be older than 65 years (38.8% of new cases vs. 56.2% of previously treated cases, P < 0.001). In addition, they were associated with a total delay (period from symptom onset to treatment initiation) of > 12 weeks (9.8% vs. 16.5%, P = 0.003) and unfavorable treatment outcomes (4.7% vs. 9.7%, P < 0.001) (Table 1).
-
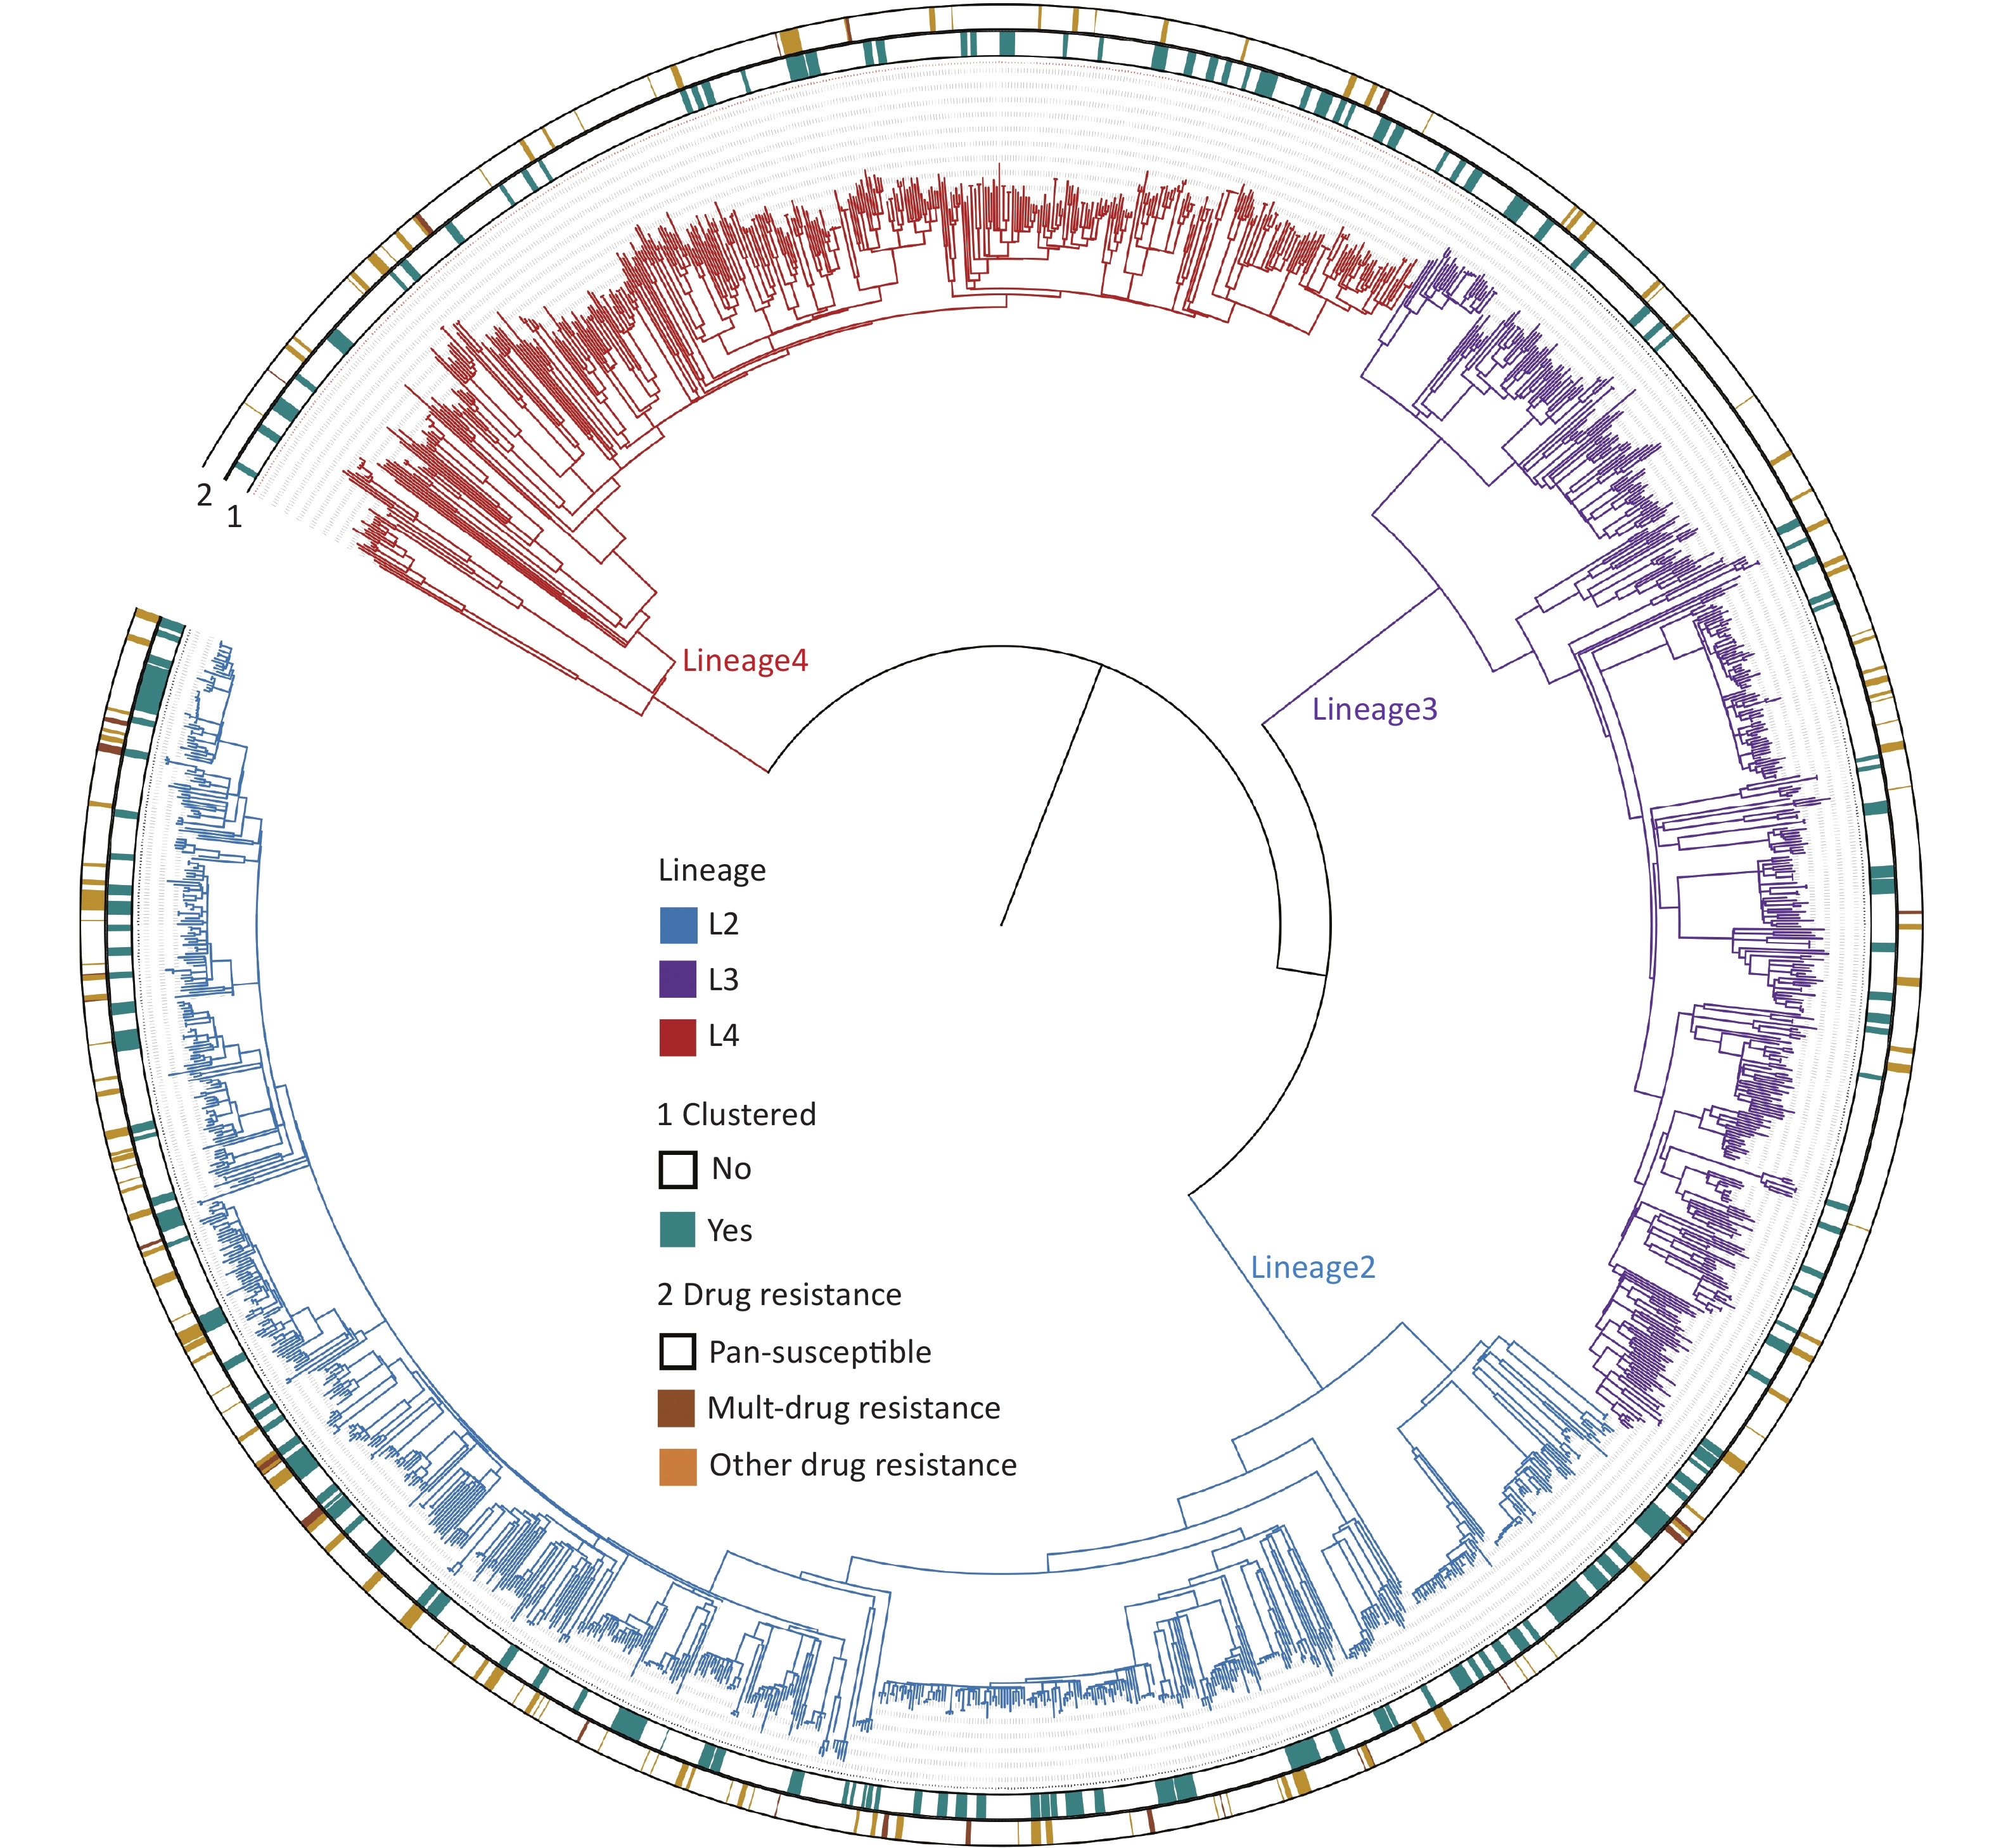
The whole genomes of 1,668 Mycobacterium tuberculosis (MTB) strains isolated from patients were sequenced with an average depth of 215.6 × (23.5× – 476×) and a coverage of 98.6% (97.8%–99.2%). Based on the phylogenetic analysis, these isolates were grouped into three lineages: 46.0% (768/1,668) belonged to lineage 2 (All were Beijing strains), 27.5% (458/1,668) belonged to lineage 3, and 26.5% (442/1,668) belonged to lineage 4 (Figure 2).
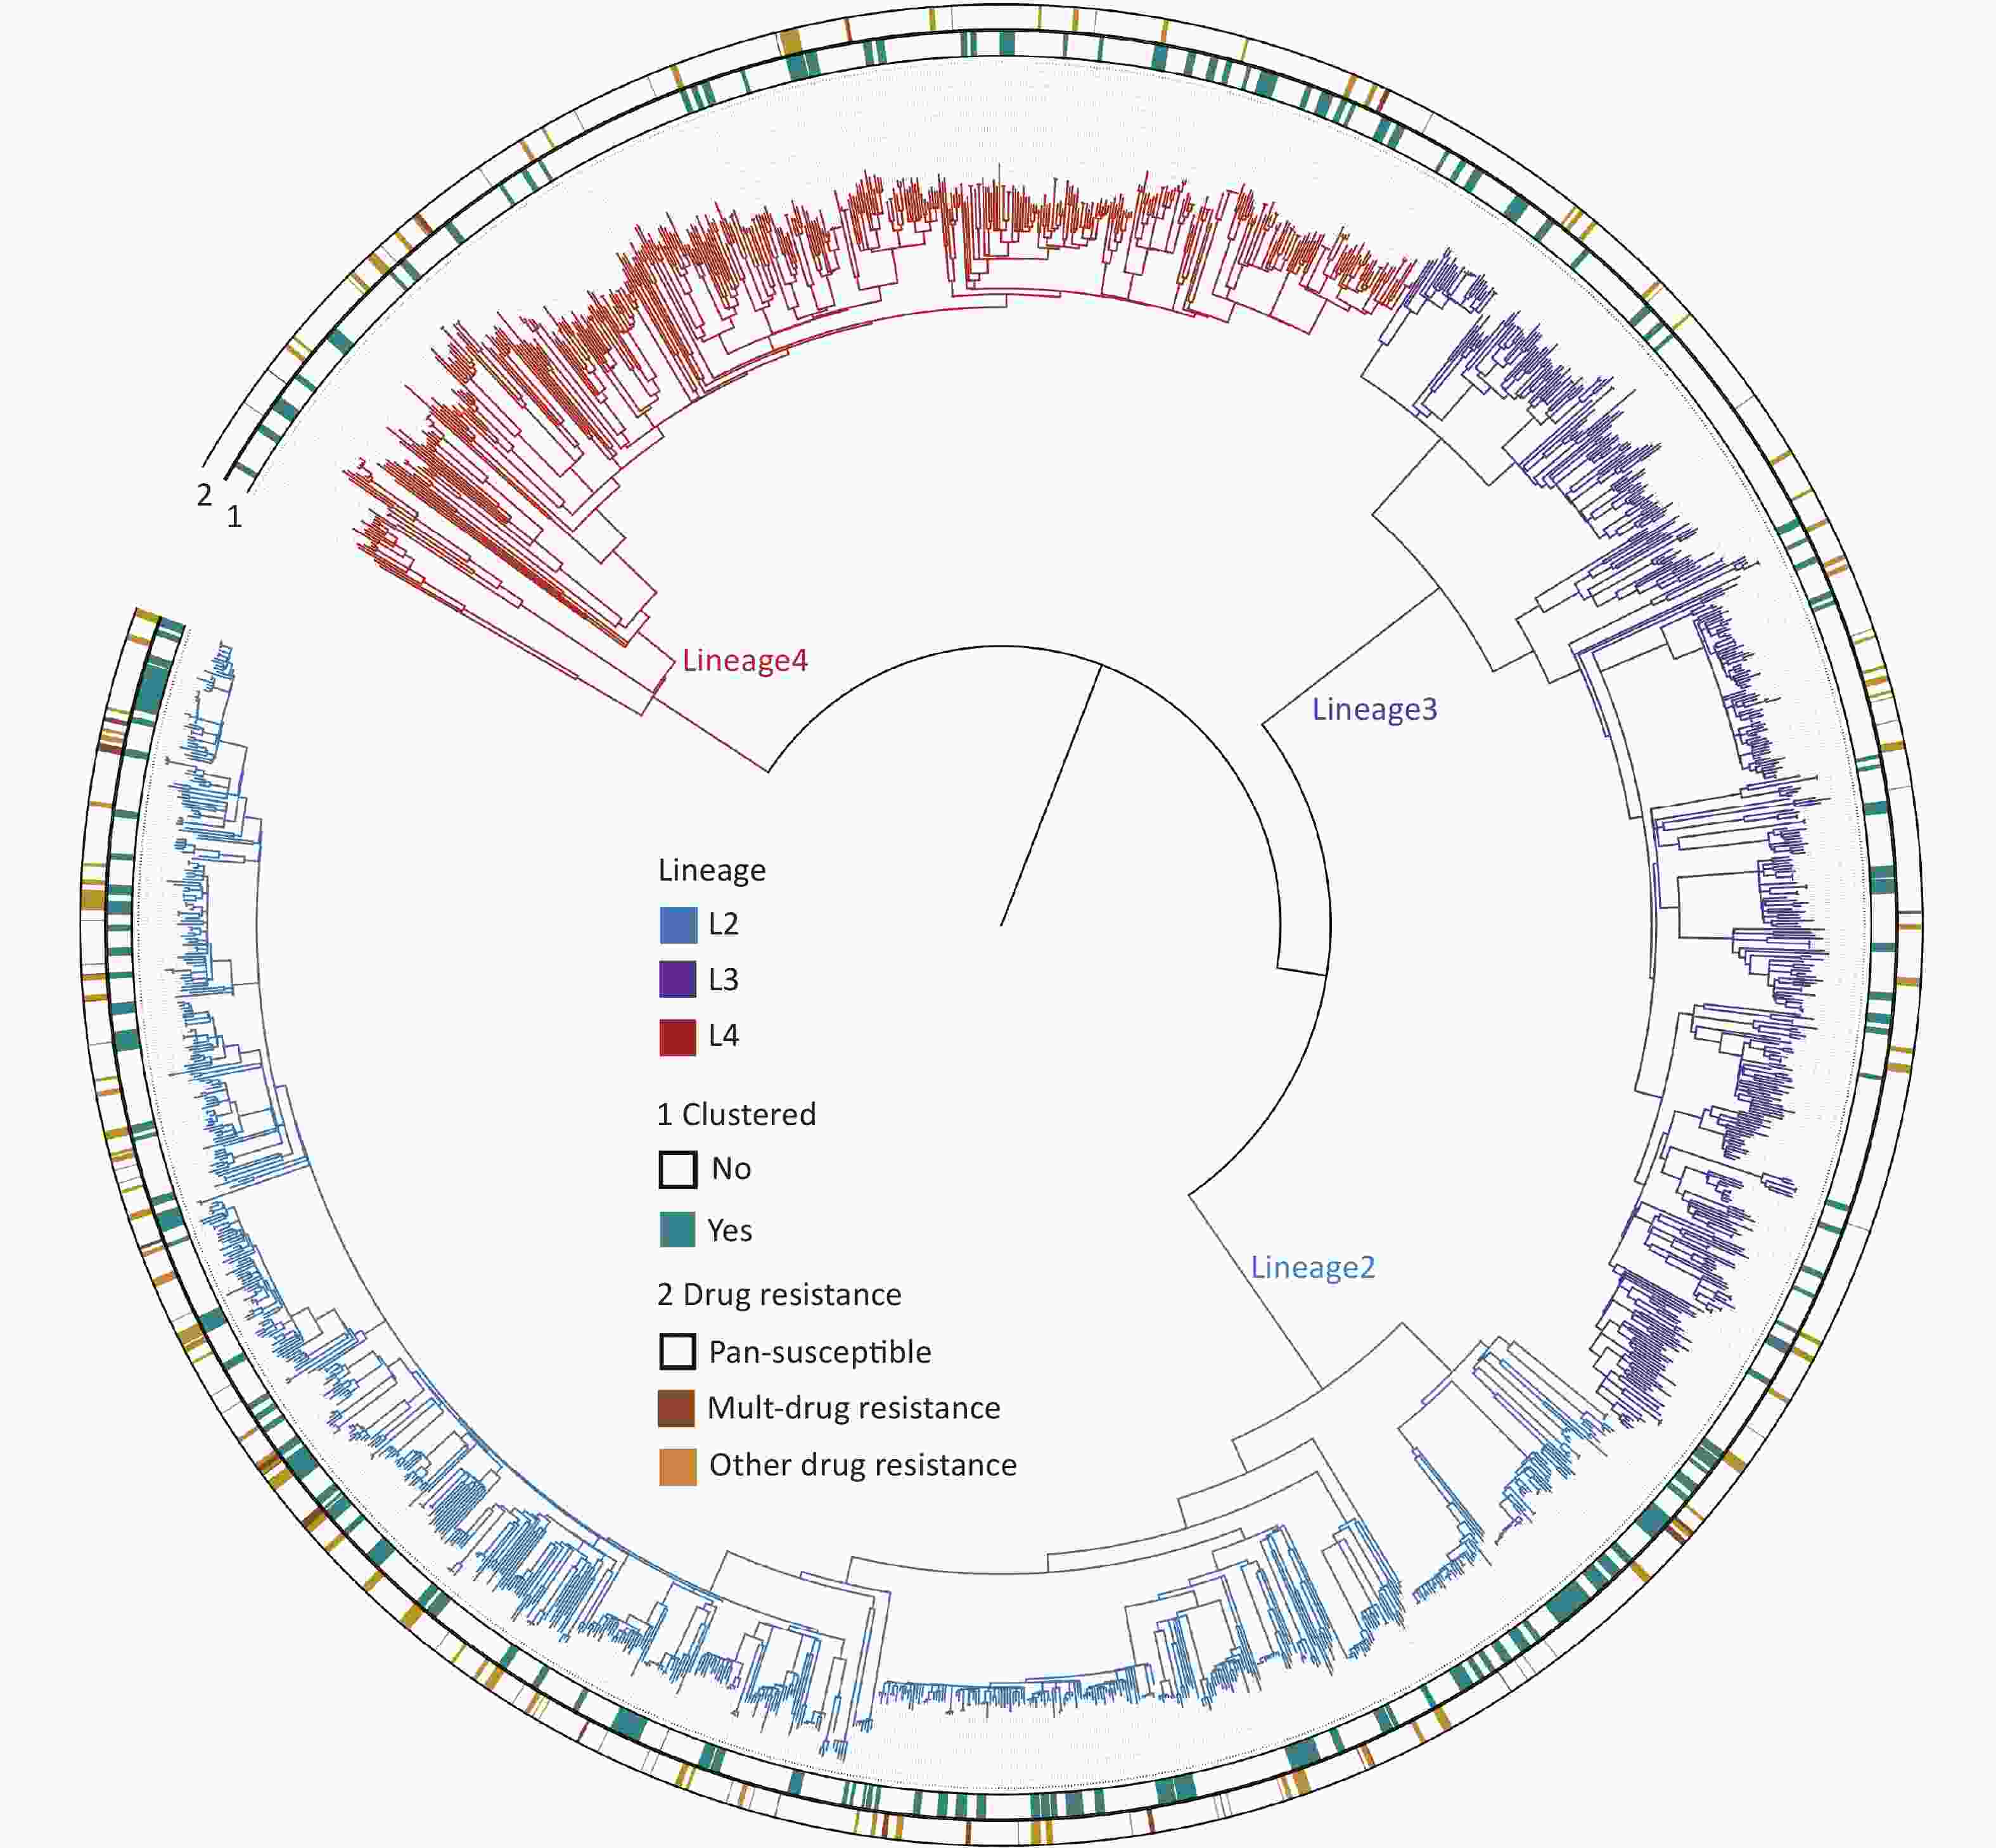
Figure 2. The phylogenetic tree of 1,668 MTB strains isolated in Kashgar. The different colors on the branches indicate different lineages. The inner circle (marked with 1) indicates genomic clustered strains. The outside circle (marked with 2) indicates the drug resistance pattern.
Analysis of the genome sequences for drug resistance-conferring mutations showed that 13.4% (223/1,668) of the strains were resistant to at least one of the 13 drugs (Table 2). Thirty resistance profiles were identified, with the highest proportion of cases being resistant to only one drug (8.2%, 136/1,668). (Supplementary Table S1, available in www.besjournal.com). The drug with the highest single-drug resistance rate was isoniazid (7.4%, 124/1,668). Streptomycin ranked second (6.0%, 100/1,668). The third was rifampicin (3.3%, 55/1,668). The rate of rifampicin resistance was 1.8% (23/1,290) in the new cases and 9.4% (32/340) in the previously treated cases. The multidrug resistance rate was 0.8% (10/1,290) in newly diagnosed cases and 6.2% (21/340) in previously treated cases.
Table 2. Drug resistance rates predicted using whole-genome sequencing (n, %)
Drug resistance mutation types Total New case Previously treated cases Unknown χ2 P value First-line drugs Isoniazid 124 (7.4) 78 (6.0) 42 (12.4) 4 (10.5) 15.692 < 0.001 Rifampin 55 (3.3) 23 (1.8) 32 (9.4) 0 (0.0) 48.032 < 0.001 Ethambutol 15 (0.9) 7 (0.5) 8 (2.4) 0 (0.0) 7.788 0.005 Pyrazinamide 7 (0.4) 6 (0.5) 0 (0.0) 1 (2.6) 1.587 0.208 Streptomycin 100 (6.0) 71 (5.5) 28 (8.2) 1 (2.6) 3.519 0.061 Second-line drugs Fluoroquinolones 12 (0.7) 8 (0.6) 4 (1.2) 0 (0.0) 0.505 0.477 Ethionamide 25 (1.5) 18 (1.4) 6 (1.8) 1 (2.6) 0.253 0.615 Kanamycin 4 (0.2) 2 (0.2) 2 (0.6) 0 (0.0) Fisher 0.194 Amikacin 4 (0.2) 2 (0.2) 2 (0.6) 0 (0.0) 1.662 0.197 Capreomycin 4 (0.2) 2 (0.2) 2 (0.6) 0 (0.0) Fisher 0.194 Para-aminosalisylic acid 3 (0.2) 1 (0.1) 2 (0.6) 0 (0.0) Fisher 0.112 New and repurposed drugs Bedaquiline 1 (0.1) 1 (0.1) 0 (0.0) 0 (0.0) Fisher 1.000 Clofazimine 1 (0.1) 1 (0.1) 0 (0.0) 0 (0.0) Fisher 1.000 Linezolid 0 (0.0) 0 (0.0) 0 (0.0) 0 (0.0) NA NA Multi-drug resistant 31 (1.9) 10 (0.8) 21 (6.2) 0 (0.0) 31.3731 < 0.001 Pan-susceptible 1,445 (86.6) 1,137 (88.1) 275 (80.9) 33 (86.8) 12.232 < 0.001 Note. Chi-square values and P values are the results of statistical tests of drug resistance rates between new and previously treated cases. DR mutations were more frequently detected in lineage 2 (18.6%, 143/768) than in lineages 3 (8.7%, 40/458) and 4 (9.0%, 40/442; χ2 = 33.899, P < 0.001). Resistance rates were not statistically different between lineages 3 and 4 (Supplementary Table S2, available in www.besjournal.com).
Table S2. Drug resistance rates between three lineages (n, %)
Drug resistance type lineage3 lineage4 lineage2 χ2 P value Any drug resistance 40 (8.7)a 40 (9.0)b 143 (18.6)ab 33.899 < 0.001 First line drugs Isoniazid 29 (6.3)a 21 (4.8)b 74 (9.6)ab 10.840 0.004 Rifampin 6 (1.3)a 12 (2.7)b 37 (4.8)ab 11.710 0.003 Ethambutol 3 (0.7) 1 (0.2) 11 (1.4) Fisher 0.092 Pyrazinamide 1 (0.2) 1 (0.2) 5 (0.7) Fisher 0.495 Streptomycin 6 (1.3)a 10 (2.3)b 84 (10.9)ab 62.053 < 0.001 Second line drugs Fluoroquinolones 2 (0.4) 4 (0.9) 6 (0.8) Fisher 0.708 Ethionamide 5 (1.1) 8 (1.8) 12 (1.6) 0.825 0.683 Note. aMeans statistically significant between lineage3 and lineage; bMeans statistically significant between lineage4 and lineage2. No statistical difference in the resistance rates of lineage3 and lineage4. Amikacin, kanamycin, capreomycin, bedaquiline, clofazimine, and linezolid were excluded because the number of drug-resistant strains is too low. -
The clustering rate is used in epidemiological studies on TB to indicate recent transmission levels. All the strains formed 164 genomic clusters (each cluster contains 2 to 13 strains). The clustering rate was 25.9% (432/1,668). To screen for factors associated with clustered cases, differences in demographic, clinical, and bacteriological factors were compared between the clustered and non-clustered cases (Table 3). The proportion of previously treated cases among the clustered cases was not significantly different from that among the non-clustered cases, suggesting that previously treated cases were not at an increased risk of TB transmission. The clustering rate of lineage 2 (33.4%, 257/768) was significantly higher than those of lineages 3 (16.4%, 75/458) and 4 (22.6%, 100/442; χ2 = 47.013, P < 0.001). No statistical differences were observed in the clustering rates between lineages 3 and 4. Notably, the clustering rate of the DR mutant strains was significantly higher (32.7%, 73/223) than that of the susceptible strains (24.8%, 346/1,412; χ2 = 6.268, P = 0.012).
Table 3. Demographic, clinical, and bacteriological characteristics of genomic-clustered ornon-clustered cases
Variables Total Non-clustered Clustered χ2 P value Demographic factors Sex 28.429 < 0.001 Female 815 (50.0) 653 (53.9) 162 (38.8) Male 815 (50.0) 559 (46.1) 256 (61.2) Age (years) 102.420 < 0.001 0– 70 (4.3) 37 (3.1) 33 (7.9) 21– 262 (16.1) 148 (12.2) 114 (27.3) 36– 175 (10.7) 111 (9.2) 64 (15.3) ≥ 51 1,123 (68.9) 916 (75.6) 207 (49.5) Occupation 22.578 < 0.001 Farmers 1,331 (81.7) 1,011 (83.4) 320 (76.6) Housekeeping or unemployed 184 (11.3) 130 (10.7) 54 (12.9) Students 54 (3.3) 26 (2.1) 28 (6.7) Others 61 (3.7) 45 (3.7) 16 (3.8) Clinical factors TB history 0.093 0.760 New cases 1,290 (79.1) 957 (79.0) 333 (79.7) Previously treated cases 340 (20.9) 255 (21.0) 85 (20.3) Smear 6.200 0.013 Negative 1,128 (69.2) 859 (70.9) 269 (64.4) Positive 502 (30.8) 353 (29.1) 149 (35.6) Patient source 8.663 0.013 Health check or proactive screening 1,008 (61.8) 769 (63.4) 239 (57.2) Referrals 392 (24.0) 289 (23.8) 103 (24.6) Direct consultation 230 (14.1) 154 (12.7) 76 (18.2) HIV 1.283 0.257 Negative 1,560 (95.7) 1,164 (96.0) 396 (94.7) Positve 70 (4.3) 48 (4.0) 22 (5.3) Total delay (weeks) 0.189 0.979 < 4 672 (41.2) 500 (41.3) 172 (41.1) 4– 439 (26.9) 327 (27.0) 112 (26.8) 8– 337 (20.7) 248 (20.5) 89 (21.3) ≥ 12 182 (11.2) 137 (11.3) 45 (10.8) Bacteriological factors Genotype 47.013 < 0.001 Lineage3 458 (27.5) 383 (31.0) 75 (17.4) Lineage4 442 (26.5) 342 (27.7) 100 (23.1) Lineage2 (Beijing genotype) 768 (46.0) 511 (41.3) 257 (59.5) Drug resistance pattern 6.268 0.012 Susceptible 1,445 (86.6) 1,086 (87.9) 359 (83.1) Drug resistant 223 (13.4) 150 (12.1) 73 (16.9) Note. Bacteriological factors, N = 1,668. The demographic and clinical factors were as follows: N = 1,630. The screened factors were then substituted into the logistic models. Multivariate logistic regression analysis determined the following risk factors for recent transmission (Table 4): the risk of clustering was 1.760 times higher in men than in women [95% confidence interval (CI): 1.370–2.260]. It was more common for patients younger than 35 years to be in clusters than for those older than 36 years [adjusted odds ratio (aOR) = 2.230; 95% CI: 1.677–2.966]. Among the various occupations, the risk of clustering was higher for those engaged in housekeeping or the unemployed (aOR = 1.565, 95% CI: 1.076–2.275) and was highest for students (aOR = 1.887, 95% CI: 1.025–3.474). Beijing strains had a 1.681 (95% CI: 1.323–2.136) increase in the risk of forming genomic clusters compared to the other lineages. Drug resistant strains had a higher risk of forming genomic clusters than susceptible strains (aOR = 1.414, 95% CI: 1.023–1.954).
Table 4. Univariate and multivariate logistic analysis of factors associated with genomic-clustered cases
Variables Univariate analysis Multivariate analysis cOR (95% CI) P value aOR (95% CI) P value Sex Male 1.846 (1.471–2.316) < 0.001 1.760 (1.370–2.260) < 0.001 Female Reference Age, years 0–35 3.011 (2.334–3.884) < 0.001 2.230 (1.677–2.966) < 0.001 ≥ 36 Reference Occupation Students 3.385 (1.957–5 .853) < 0.001 1.887 (1.025–3.474) 0.041 Housekeeping or employed 1.305 (0.929–1.835) 0.125 1.565 (1.076–2.275) 0.019 Others Reference Smear Positive 1.348 (1.065–1.706) 0.013 1.166 (0.908 –1.497) 0.230 Negative Reference Patient source Direct consultation 1.480 (1.110–1.974) 0.008 1.218 (0.895–1.659) 0.210 Others Reference Genotype Beijing genotype 2.112 (1.684–2.649) < 0.001 1.681 (1.323–2.136) < 0.001 Non-Beijing genotype Reference Drug resistance pattern Drug resistant 1.519 (1.117–2.066) 0.008 1.414 (1.023–1.954) 0.036 Pan-susceptible Reference Note. cOR, crude odds ratio. aOR, adjusted odds ratio. CI, confidence interval. Kernel density maps were plotted to understand the spatial aggregation of the clustered cases. There were nine spatially concentrated areas (hotspots) of clustered patients, seven of which were also hotspots for nonclustered patients. The remaining two hotspots for clustered patients, one in Bachu County and one at the border between Payzawat and Shule counties, were not hotspots for non-clustered patients.
-
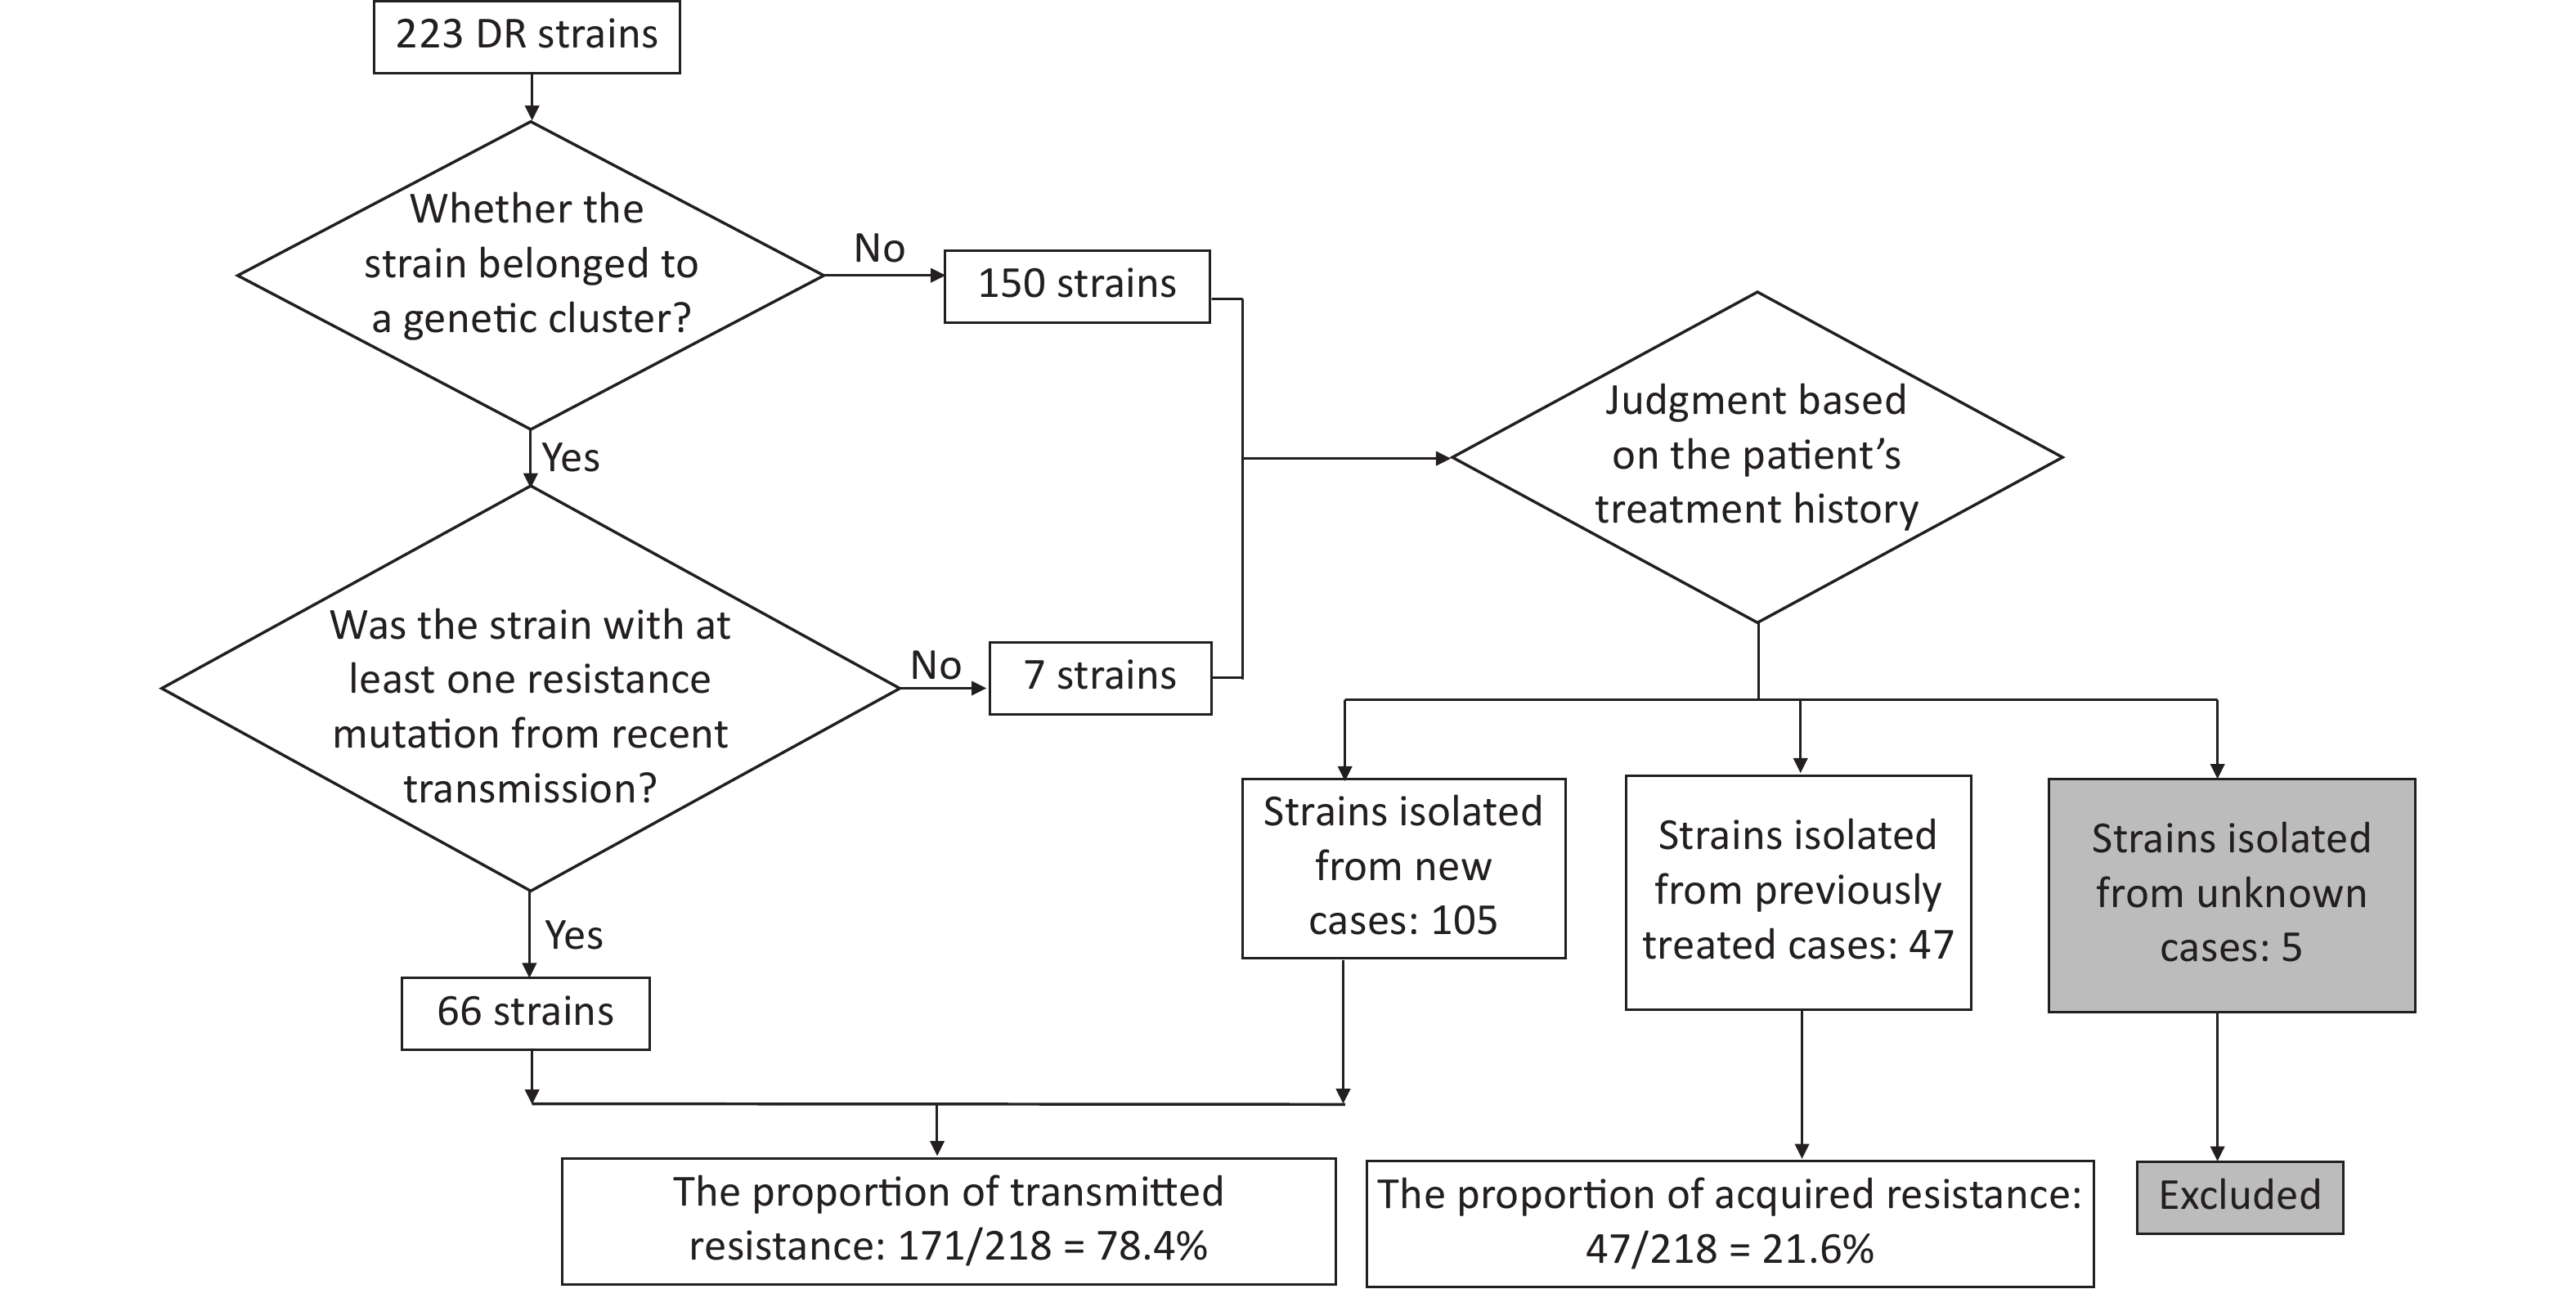
Resistant strains have a higher risk of clustering; therefore, they may have primarily been caused by transmission. To test this hypothesis, we quantified transmitted resistance based on the recent transmission of resistance mutations and the treatment history of the patients. Of the 73 clustered resistant strains, 66 had at least one resistance mutation from recent transmission. Mutations in the remaining seven strains were acquired independently. These seven strains, as well as 150 non-clustered strains, were uniformly judged based on the patient’s treatment history. We identified 105 strains isolated from new cases, 47 strains isolated from previously treated cases, and 5 strains isolated from cases with missing information on treatment history (these five strains were excluded from the calculation of proportions, thus the denominator was 218). Resistant strains from previously treated cases may have acquired resistance during the course of treatment, whereas resistant strains from new cases usually indicate direct transmission. Therefore, we inferred that the total proportion of transmitted resistance was 78.4% (171/218) (Figure 3). The percentage of resistance transmitted to all anti-TB drugs was higher than 50% (Table 5).
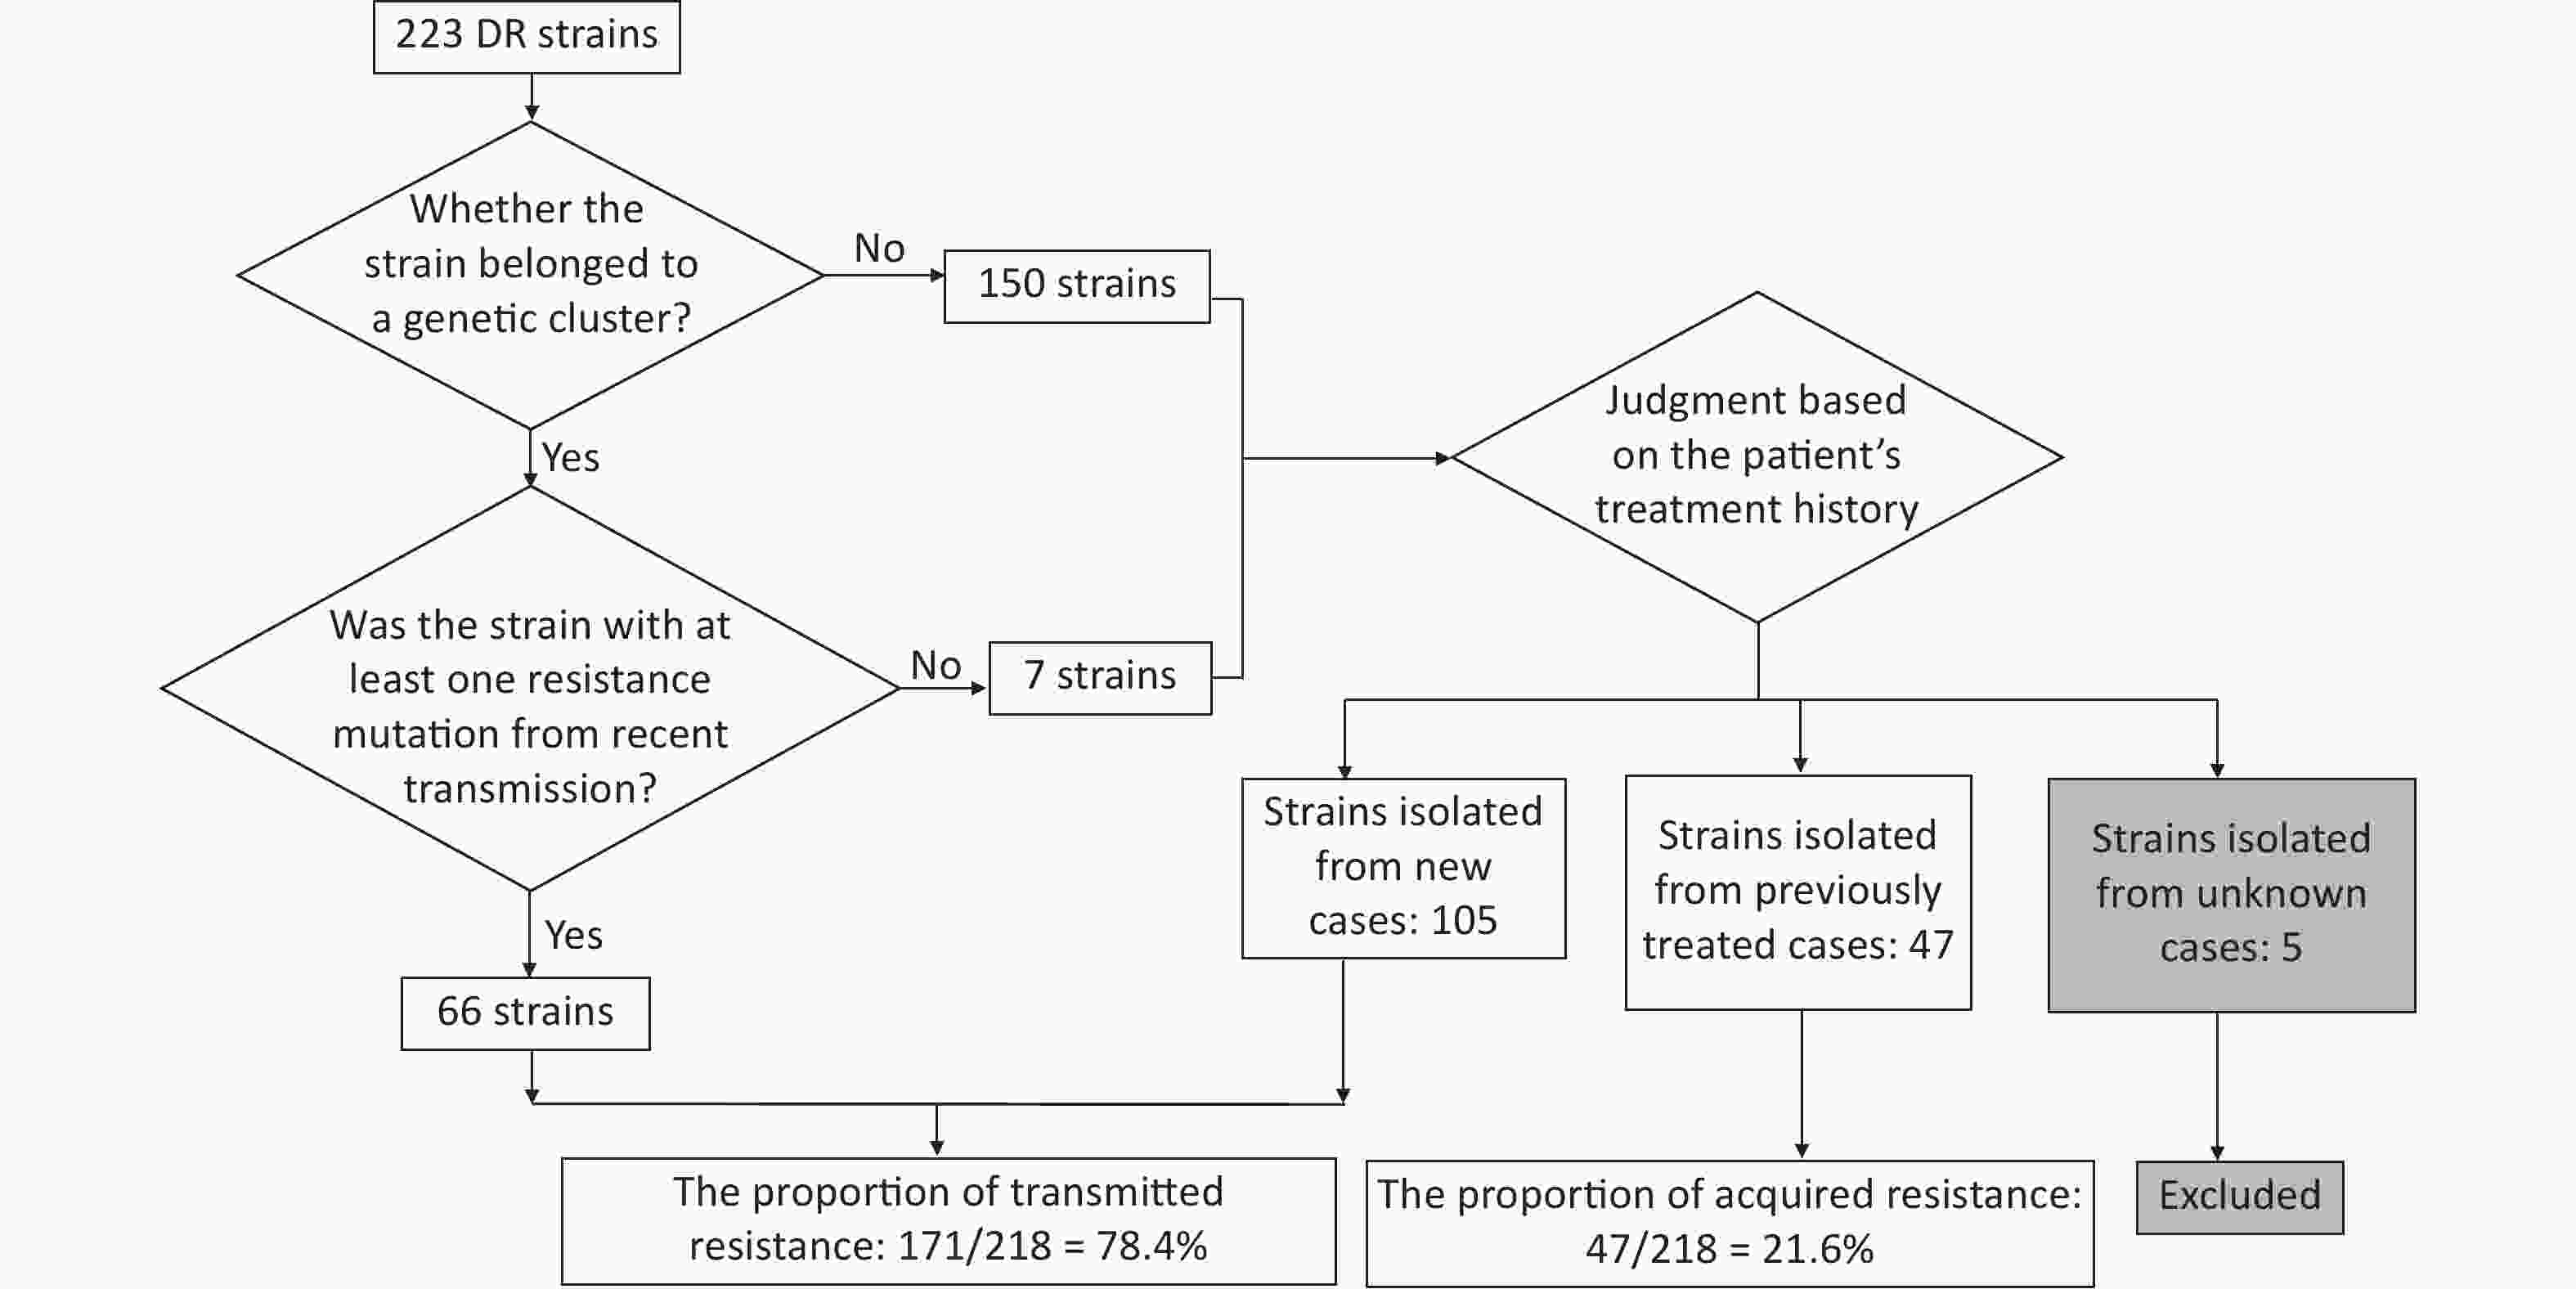
Figure 3. Flowchart for calculating transmitted resistance. Unknown cases mean the cases with missing information on treatment history.
Table 5. Interpreted proportion of transmitted drug resistance
DRM type No. (%) of transmitted resistance No. of DRMs caused by recent transmission No. of DRMs not confirmed by recent transmission DRMs in New cases DRMs in Previously
treated casesDRMs in unknown cases Any drug resistance (N = 223) 171 (78.4) 66 105 47 5 Isoniazid (N = 124) 86 (71.7) 29 57 34 4 Rifampicin (N = 55) 32 (58.2) 13 19 23 0 Streptomycin (N = 100) 78 (78.8) 36 42 21 1 Ethambutol (N = 15) 9 (60.0) 3 6 6 0 Pyrazinamide (N = 7) 6 (100) 0 6 0 1 Fluoroquinolones (N = 12) 10 (83.3) 6 4 2 0 Ethionamide (N = 25) 19 (76.0) 8 11 5 1 Note. DRM, drug-resistant mutations. Kanamycin (N = 4), capreomycin (N = 4), amikacin (N = 4), para-aminosalicylic acid (N = 3), bedaquiline (N = 1), and clofazimine (N = 1) were excluded because of the low number of drug-resistant mutant strains. -
To the best of our knowledge, this is the first systematic population-based study conducted in Kashgar. We found that the proportion of previously treated cases in Kashgar (20.9%; 340/1,630) was almost twice as high as that reported in the latest national TB epidemiological survey (11.8%)[29]. The rates of rifampicin resistance in new and previously treated cases were 1.8% and 9.4%, respectively, and the rates of multidrug resistance were 0.8% and 6.2% in the two categories, respectively. The clustering rate was 25.9%, indicating that the prefecture should be aware of the recent transmission of TB. Bacteriological factors (drug-resistant and Beijing strains) and demographic factors (sex, age, and occupation) were associated with recent transmission. The spatial analysis identified seven areas as hotspots shared by both clustered and non-clustered patients, suggesting a denser population distribution in these areas; two areas were hotspots for clustered patients only, thereby suggesting that these areas may be at a high risk for recent transmission. Transmitted drug resistance was 78.4%, suggesting that transmitted resistance is a more significant cause of drug resistance than acquired resistance in Kashgar.
Based on the information on the included cases, we found a high proportion of previously treated cases, which is a major public health concern. A survey of the treatment outcomes of new smear-positive cases in Kashgar between 2016 and 2018 showed a cure rate of 77%[30], which is below the WHO target of at least an 85% cure rate set in 2005[31]. This low cure rate may explain the high proportion of previously treated patients. Patients with TB in the prefecture are mainly located in rural areas and have low awareness of TB control information and hazards. Therefore, they are prone to discontinue treatment on their own after the initial symptoms have subsided[30]. This finding suggests that Kashgar should strengthen the management of patient treatment processes to improve outcomes.
According to the WGS-based drug susceptibility results, we found that the rates of rifampicin resistance in Kashgar (1.8% in new cases and 9.4% in previously treated cases) were lower than those reported in China and globally. The results of the 2018 National Drug Resistance Surveillance published in November 2022 showed that the rates of rifampicin resistance were 5.08% in new cases and 23.31% in previously treated cases, which were more than twice as high as in Kashgar[32]. WHO published the global estimates of rifampicin-resistant TB as 3%–4% in new cases and 18%–21% in previously treated cases, which were also higher than those in Kashgar[1]. In addition, the resistance rates of the strains in Kashgar to isoniazid, ethambutol, streptomycin, and fluoroquinolones were all lower than those reported in the 2018 National Drug Resistance Surveillance. This suggests that the Kashgar Prefecture in China has low rates of drug resistance.
Based on the genetic distance between the strains, we found that the clustering rate obtained from a one-year sample was 25.9%. As the majority of patients with recent transmission develop active TB within two years of infection[33,34], two years is an ideal time to collect samples. The short sample collection time in this study missed some clustered patients; therefore, the actual clustering rate in Kashgar was > 25.9%. To understand the relative levels of recent transmission in Kashgar, we selected recently published population-based WGS studies for comparison. The clustering rate in Kashgar may be higher than that in low-burden countries; for example, 15.9% from a six-year study in Oxfordshire, UK[35], and lower than that in some high-burden countries in Africa; for example, 66% in Karonga District, Malawi, calculated using strains from three consecutive years[36]. The clustering rate in Kashgar was relatively high when compared to that in Han-dominated sites within China. For example, a one-year study in Guizhou (southwest China) calculated a clustering rate of 13.1%[37], which is lower than that in Kashgar. A 10-year study in Shanghai (eastern China) obtained a clustering rate of 27.25%, which was only 1.35% higher than that reported by Kashgar[38]. A three-year sample from Shenzhen (southern China) yielded a clustering rate of 12.2%[39]. Therefore, we consider that Kashgar is among the regions with a more severe recent transmission within China and that recent transmission should be a local public concern. One possible reason for this is that Kashgar is predominantly Uyghur, whereas studies in North America have found that ethnic minorities are at a higher risk of recent transmission than the dominant ethnic group[40,41]. Another possible reason is that the lack of transportation in Kashgar leads to a longer total delay (time interval between the onset of symptoms and the start of treatment) in patients, which exacerbates the transmission of TB; for example, the proportion of patients with a total delay of more than 8 weeks was 10.8% in Shenzhen when compared to 31.9% in Kashgar[24]. In addition, since 2013, the prefecture has intensified its efforts to alleviate poverty and develop labor-intensive production workshops in rural areas to increase farmers’ incomes, providing more opportunities for people to congregate, thus facilitating the transmission of TB.
Based on the analysis of risk factors for clustering, we found that the DR strains were more likely to be transmitted than the susceptible strains in Kashgar. Since the transmission of strains is influenced not only by bacteriological factors, but also by host and social environmental factors, there is no uniform conclusion as to whether the risk of transmission of DR strains is higher than that of the susceptible strains. If only bacteriological factors are considered, DR mutations can result in fitness costs in the form of slower growth rates[42]. Thus, the prevailing view was that DR strains were less transmissible; however, this could not explain why DR strains are widely prevalent. Later studies found that the contacts of patients with DR have a higher risk of infection[43], which may have been caused by the higher number of MTB cells in the aerosol produced when patients with DR cough[44,45]. Animal models show significantly higher bacterial loads in the airways after infection with MDR strains, suggesting that DR strains may have a transmission advantage over susceptible strains[46]. These results suggest that bacterial-host interactions also influence the transmission of strains. In addition, the level of healthcare and capacity of the public health system are also drivers of strain transmission[47]. Therefore, the role of socio-environmental factors cannot be disregarded. Perhaps, because of this, DR strains were less likely to spread than susceptible strains in areas where TB is effectively controlled[48,49]. In high-burden countries such as China, DR strains were found to be at a higher risk of transmission than susceptible strains[23,50]. Recent studies have suggested that among the various influencing factors, bacteriological factors play a relatively minor role in transmission, whereas socio-environmental factors play a greater role[20]. Our results provide information for an in-depth analysis of the transmission patterns of DR strains and suggest that the social environment in Kashgar should be improved to suppress the spread of DR strains.
Although it has been suggested that smear-positive patients are more likely to transmit TB, a positive smear result was not a high-risk factor for recent transmission in our study. This may be due to the low sensitivity of smears, resulting in the high proportion of “false” smear-negative patients and thus masking the transmission advantage of smear-positive patients[50]. The smear-positive rate for culture-positive patients in Kashgar was only 30.8%, when compared to 76% in a similar study in Malawi[36].
Consistent with a previous study in China, Beijing strains favored transmission[50]. A study in South Africa observed an expansion of Beijing strains from almost none to 33% in 40 years[51]. These results indicate that the Beijing strains have a transmission advantage. Previous studies have shown that Beijing strains are more virulent[52,53] and are better adapted to the host immune system, such as by evading BCG-induced immune protection[54] or favoring a secondary Th1 response that is less protective of the host[55]. These features may accelerate the progression from infection to disease[50], allowing the strain to exhibit a transmission advantage. Although the proportion of lineage 3 in this region is relatively high in China, the transmission advantage of lineage 3 is not evident. The same conclusion was obtained in another area, with a ratio of lineage 3 close to that of Kashgar[56]. We speculate that the high proportion of lineage 3 in Kashgar may be due to the presence of the ancient Silk Road[19]. Moreover, the prefecture is adjacent to Pakistan and North India, where the frequency of lineage 3 strains is high[57].
We found that students accounted for only 3.3% of all patients, but had a higher risk of cluster formation than other occupations. A previous study suggested that this was due to diagnostic delays[24]. Students worry about interrupting their studies because of illness or a sense of shame. Another possible reason is that this population receives extra attention from the disease prevention and control departments. Following the diagnosis of TB in a student, their classmates are also screened[23], leading to a more timely detection of students who develop TB via recent transmission.
This study has several limitations. First, the short duration of the study meant that some genomic clusters may have been missed, resulting in an underestimation of recent transmission levels, and the proportion of transmitted drug resistance. The novel coronavirus pandemic has added a heavier burden to local primary care institutions and created a major obstacle to our continuous collection of strains; therefore, we have only been able to collect a one-year sample. Secondly, the culture positivity rate in this region needs to be improved. The high laboratory equipment and technical requirements for MTB culture have led to its implementation being less than optimal in developing regions with a high TB burden like Kashgar[58]. We cannot deny that culture-negative patients are also a part of the transmission chain. Finally, the lack of epidemiological survey data in this study, such as household contact tracing, makes it difficult to analyze the populations and sites at high risk of transmission in detail.
In conclusion, control of TB transmission should be strengthened in the prefecture to reduce the prevalence of drug resistance. Continuation of WGS-based TB surveillance and epidemiological surveys in the region will help provide greater insight into the causes of the high TB burden in Kashgar.
-
Table S1. Drug resistance profiles of 1,668 patients predicted by whole genome sequencing
Type of resistance No. (%) Total New case Retreated cases cases Unknown Resistance to single drug only 136 (8.15) 110 (8.53) 33 (9.71) 3 (7.89) RIF 21 (1.26) 12 (0.93) 9 (2.65) 0 (0.00) INH 53 (3.18) 37 (2.87) 14 (4.12) 2 (5.26) EMB 1 (0.06) 0 (0.00) 1 (0.29) 0 (0.00) PZA 5 (0.30) 4 (0.31) 0 (0.00) 1 (2.63) SM 46 (2.76) 49 (3.80) 7 (2.06) 0 (0.00) FQs 10 (0.60) 8 (0.62) 2 (0.59) 0 (0.00) Multi-drug resistant (MDR) 31 (1.86) 10 (0.78) 21 (6.18) 0 (0.00) INH+RIF+FQs 1 (0.06) 0 (0.00) 1 (0.29) 0 (0.00) INH+RIF 8 (0.48) 3 (0.23) 5 (1.47) 0 (0.00) INH+RIF+EMB 3 (0.18) 2 (0.16) 1 (0.29) 0 (0.00) INH+RIF+SM 5 (0.30) 0 (0.00) 5 (1.47) 0 (0.00) INH+RIF+ETH 1 (0.06) 1 (0.08) 0 (0.00) 0 (0.00) INH+RIF+SM+FQs 1 (0.06) 0 (0.00) 1 (0.29) 0 (0.00) INH+RIF+PZA+SM 1 (0.06) 1 (0.08) 0 (0.00) 0 (0.00) INH+RIF+EMB+SM 7 (0.42) 2 (0.16) 5 (1.47) 0 (0.00) INH+RIF+SM+PAS 1 (0.06) 0 (0.00) 1 (0.29) 0 (0.00) INH+RIF+SM+ETH 1 (0.06) 0 (0.00) 1 (0.29) 0 (0.00) INH+RIF+EMB+PZA+ETH 1 (0.06) 1 (0.08) 0 (0.00) 0 (0.00) INH+RIF+SM+KAN+AMI+CAP 1 (0.06) 0 (0.00) 1 (0.29) 0 (0.00) Resistance to two drugs (except MDR) 35 (2.10) 25 (1.94) 8 (2.35) 2 (5.26) RIF+SM 2 (0.12) 1 (0.08) 1 (0.29) 0 (0.00) RIF+EMB 1 (0.06) 0 (0.00) 1 (0.29) 0 (0.00) INH+ETH 16 (0.96) 12 (0.93) 3 (0.88) 1 (2.63) INH+SM 13 (0.78) 10 (0.78) 2 (0.59) 1 (2.63) INH+EMB 1 (0.06) 1 (0.08) 0 (0.00) 0 (0.00) SM+PAS 1 (0.06) 0 (0.00) 1 (0.29) 0 (0.00) BDQ+CFZ 1 (0.06) 1 (0.08) 0 (0.00) 0 (0.00) Resistance to three or more drugs 11 (0.66) 8 (0.62) 3 (0.88) 0 (0.00) INH+EMB+SM 1 (0.06) 1 (0.08) 0 (0.00) 0 (0.00) INH+SM+ETH 6 (0.36) 4 (0.31) 2 (0.59) 0 (0.00) INH+SM+PAS 1 (0.06) 1 (0.08) 0 (0.00) 0 (0.00) SM+KAN+AMI+CAP 1 (0.06) 0 (0.00) 1 (0.29) 0 (0.00) INH+SM+KAN+AMI+CAP 2 (0.12) 2 (0.16) 0 (0.00) 0 (0.00) Pan drug susceptible 1,445 (86.6) 1,137 (88.1) 275 (80.9) 33 (86.8) Note. INH, isoniazid; RIF, rifampicin; PZA, pyrazinamide; EMB, ethambutol; SM, streptomycin; FQs, fluoroquinolones; ETH, ethionamide; KAN, kanamycin; AMI, amikacin; CAP, capreomycin; BDQ, bedaquiline; CFZ, clofazimine.
doi: 10.3967/bes2023.116
Inferring Mycobacterium Tuberculosis Drug Resistance and Transmission using Whole-genome Sequencing in a High TB-burden Setting in China
-
Abstract:
Objective China is among the 30 countries with a high burden of tuberculosis (TB) worldwide, and TB remains a public health concern. Kashgar Prefecture in the southern Xinjiang Autonomous Region is considered as one of the highest TB burden regions in China. However, molecular epidemiological studies of Kashgar are lacking. Methods A population-based retrospective study was conducted using whole-genome sequencing (WGS) to determine the characteristics of drug resistance and the transmission patterns. Results A total of 1,668 isolates collected in 2020 were classified into lineages 2 (46.0%), 3 (27.5%), and 4 (26.5%). The drug resistance rates revealed by WGS showed that the top three drugs in terms of the resistance rate were isoniazid (7.4%, 124/1,668), streptomycin (6.0%, 100/1,668), and rifampicin (3.3%, 55/1,668). The rate of rifampicin resistance was 1.8% (23/1,290) in the new cases and 9.4% (32/340) in the previously treated cases. Known resistance mutations were detected more frequently in lineage 2 strains than in lineage 3 or 4 strains, respectively: 18.6% vs. 8.7 or 9%, P < 0.001. The estimated proportion of recent transmissions was 25.9% (432/1,668). Multivariate logistic analyses indicated that sex, age, occupation, lineage, and drug resistance were the risk factors for recent transmission. Despite the low rate of drug resistance, drug-resistant strains had a higher risk of recent transmission than the susceptible strains (adjusted odds ratio, 1.414; 95% CI, 1.023–1.954; P = 0.036). Among all patients with drug-resistant tuberculosis (DR-TB), 78.4% (171/218) were attributed to the transmission of DR-TB strains. Conclusion Our results suggest that drug-resistant strains are more transmissible than susceptible strains and that transmission is the major driving force of the current DR-TB epidemic in Kashgar. -
Key words:
- Mycobacterium tuberculosis /
- Whole-genome sequencing (WGS) /
- Transmission /
- Drug resistance /
- Xinjiang
This study was approved by the Ethics Committee of the Tuberculosis Dispensary of the Kashgar Prefecture and with the informed consent of the subjects.
FAN Yu Feng, CHEN Yi Wang, and LIU Dong Xin contributed to data analysis. LIU Dong Xin, OU Xi Chao, MAO Qi Zhi, YANG Ting Ting, HE Wen Cong, ZHAO Bing, WANG Xi Jiang, LIU Zhen Jiang, ABULIMITI Maiweilanjiang, and AI-HEMUTI Maimaitiaili collected the surveyed data. FAN Yu Feng wrote the first draft of the manuscript. CHEN Yi Wang and YANG Ting Ting proofread the manuscript draft. GAO Qian and ZHAO Yan Lin revised and improved the manuscript. All the authors have read and agreed to the published version of the manuscript.
注释:1) CONFLICTS OF INTEREST: 2) ETHICS APPROVAL: 3) AUTHOR CONTRIBUTIONS: -
Figure 1. Patient enrollment and study flowchart. NTM, non-tuberculosis mycobacteria; PTB, pulmonary TB.
Figure 2. The phylogenetic tree of 1,668 MTB strains isolated in Kashgar. The different colors on the branches indicate different lineages. The inner circle (marked with 1) indicates genomic clustered strains. The outside circle (marked with 2) indicates the drug resistance pattern.
Figure 3. Flowchart for calculating transmitted resistance. Unknown cases mean the cases with missing information on treatment history.
Table 1. Demographic and clinical information of patients included in the study (n, %)
Variables Total New cases Previously treated cases χ2 P value Demographic factors Sex 0.535 0.464 Female 815 (50.0) 651 (50.5) 164 (48.2) Male 815 (50.0) 639 (49.5) 176 (51.8) Age (years) 40.268 < 0.001 0– 332 (20.4) 291 (22.6) 41 (12.0) 36– 175 (10.7) 152 (11.8) 23 (6.8) 51– 431 (26.4) 346 (26.8) 85 (25.0) ≥ 66 692 (42.5) 501 (38.8) 191 (56.2) Ethnic group 1.237 0.266 Uighur 1,593 (97.7) 1,258 (97.5) 335 (98.5) Others 37 (2.3) 32 (2.5) 5 (1.5) Occupation 6.463 0.091 Farmers or pastoralists 1,331 (81.7) 1,040 (80.6) 291 (85.6) Housekeeping or unemployed 184 (11.3) 151 (11.7) 33 (9.7) Students 54 (3.3) 49 (3.8) 5 (1.5) Others 61 (3.7) 50 (3.9) 11 (3.2) Clinical factors Smear 0.321 0.571 Negative 1,128 (69.2) 897 (69.5) 231 (67.9) Positive 502 (30.8) 393 (30.5) 109 (32.1) HIV 0.177 0.674 Negative 1,560 (95.7) 1,236 (95.8) 324 (95.3) Unknown 70 (4.3) 54 (4.2) 16 (4.7) Patient source 2.948 0.229 Health check or proactive screening 1,008 (61.8) 796 (61.7) 212 (62.4) Referrals 392 (24.0) 303 (23.5) 89 (26.2) Direct consultation 230 (14.1) 191 (14.8) 39 (11.5) Treatment outcome 12.266 < 0.001 Unfavorable outcomes 94 (5.8) 61 (4.7) 33 (9.7) Others 1,536 (94.2) 1,229 (95.3) 307 (90.3) Total delay (weeks) 13.865 0.003 < 4 672 (41.2) 533 (41.3) 139 (40.9) 4– 439 (26.9) 362 (28.1) 77 (22.6) 8– 337 (20.7) 269 (20.9) 68 (20.0) ≥ 12 182 (11.2) 126 (9.8) 56 (16.5) Note. For demographic and clinical factors, N = 1,630.  下载: 导出CSV
Table 2. Drug resistance rates predicted using whole-genome sequencing (n, %)
Drug resistance mutation types Total New case Previously treated cases Unknown χ2 P value First-line drugs Isoniazid 124 (7.4) 78 (6.0) 42 (12.4) 4 (10.5) 15.692 < 0.001 Rifampin 55 (3.3) 23 (1.8) 32 (9.4) 0 (0.0) 48.032 < 0.001 Ethambutol 15 (0.9) 7 (0.5) 8 (2.4) 0 (0.0) 7.788 0.005 Pyrazinamide 7 (0.4) 6 (0.5) 0 (0.0) 1 (2.6) 1.587 0.208 Streptomycin 100 (6.0) 71 (5.5) 28 (8.2) 1 (2.6) 3.519 0.061 Second-line drugs Fluoroquinolones 12 (0.7) 8 (0.6) 4 (1.2) 0 (0.0) 0.505 0.477 Ethionamide 25 (1.5) 18 (1.4) 6 (1.8) 1 (2.6) 0.253 0.615 Kanamycin 4 (0.2) 2 (0.2) 2 (0.6) 0 (0.0) Fisher 0.194 Amikacin 4 (0.2) 2 (0.2) 2 (0.6) 0 (0.0) 1.662 0.197 Capreomycin 4 (0.2) 2 (0.2) 2 (0.6) 0 (0.0) Fisher 0.194 Para-aminosalisylic acid 3 (0.2) 1 (0.1) 2 (0.6) 0 (0.0) Fisher 0.112 New and repurposed drugs Bedaquiline 1 (0.1) 1 (0.1) 0 (0.0) 0 (0.0) Fisher 1.000 Clofazimine 1 (0.1) 1 (0.1) 0 (0.0) 0 (0.0) Fisher 1.000 Linezolid 0 (0.0) 0 (0.0) 0 (0.0) 0 (0.0) NA NA Multi-drug resistant 31 (1.9) 10 (0.8) 21 (6.2) 0 (0.0) 31.3731 < 0.001 Pan-susceptible 1,445 (86.6) 1,137 (88.1) 275 (80.9) 33 (86.8) 12.232 < 0.001 Note. Chi-square values and P values are the results of statistical tests of drug resistance rates between new and previously treated cases.
下载: 导出CSV
S2. Drug resistance rates between three lineages (n, %)
Drug resistance type lineage3 lineage4 lineage2 χ2 P value Any drug resistance 40 (8.7)a 40 (9.0)b 143 (18.6)ab 33.899 < 0.001 First line drugs Isoniazid 29 (6.3)a 21 (4.8)b 74 (9.6)ab 10.840 0.004 Rifampin 6 (1.3)a 12 (2.7)b 37 (4.8)ab 11.710 0.003 Ethambutol 3 (0.7) 1 (0.2) 11 (1.4) Fisher 0.092 Pyrazinamide 1 (0.2) 1 (0.2) 5 (0.7) Fisher 0.495 Streptomycin 6 (1.3)a 10 (2.3)b 84 (10.9)ab 62.053 < 0.001 Second line drugs Fluoroquinolones 2 (0.4) 4 (0.9) 6 (0.8) Fisher 0.708 Ethionamide 5 (1.1) 8 (1.8) 12 (1.6) 0.825 0.683 Note. aMeans statistically significant between lineage3 and lineage; bMeans statistically significant between lineage4 and lineage2. No statistical difference in the resistance rates of lineage3 and lineage4. Amikacin, kanamycin, capreomycin, bedaquiline, clofazimine, and linezolid were excluded because the number of drug-resistant strains is too low.
下载: 导出CSV
Table 3. Demographic, clinical, and bacteriological characteristics of genomic-clustered ornon-clustered cases
Variables Total Non-clustered Clustered χ2 P value Demographic factors Sex 28.429 < 0.001 Female 815 (50.0) 653 (53.9) 162 (38.8) Male 815 (50.0) 559 (46.1) 256 (61.2) Age (years) 102.420 < 0.001 0– 70 (4.3) 37 (3.1) 33 (7.9) 21– 262 (16.1) 148 (12.2) 114 (27.3) 36– 175 (10.7) 111 (9.2) 64 (15.3) ≥ 51 1,123 (68.9) 916 (75.6) 207 (49.5) Occupation 22.578 < 0.001 Farmers 1,331 (81.7) 1,011 (83.4) 320 (76.6) Housekeeping or unemployed 184 (11.3) 130 (10.7) 54 (12.9) Students 54 (3.3) 26 (2.1) 28 (6.7) Others 61 (3.7) 45 (3.7) 16 (3.8) Clinical factors TB history 0.093 0.760 New cases 1,290 (79.1) 957 (79.0) 333 (79.7) Previously treated cases 340 (20.9) 255 (21.0) 85 (20.3) Smear 6.200 0.013 Negative 1,128 (69.2) 859 (70.9) 269 (64.4) Positive 502 (30.8) 353 (29.1) 149 (35.6) Patient source 8.663 0.013 Health check or proactive screening 1,008 (61.8) 769 (63.4) 239 (57.2) Referrals 392 (24.0) 289 (23.8) 103 (24.6) Direct consultation 230 (14.1) 154 (12.7) 76 (18.2) HIV 1.283 0.257 Negative 1,560 (95.7) 1,164 (96.0) 396 (94.7) Positve 70 (4.3) 48 (4.0) 22 (5.3) Total delay (weeks) 0.189 0.979 < 4 672 (41.2) 500 (41.3) 172 (41.1) 4– 439 (26.9) 327 (27.0) 112 (26.8) 8– 337 (20.7) 248 (20.5) 89 (21.3) ≥ 12 182 (11.2) 137 (11.3) 45 (10.8) Bacteriological factors Genotype 47.013 < 0.001 Lineage3 458 (27.5) 383 (31.0) 75 (17.4) Lineage4 442 (26.5) 342 (27.7) 100 (23.1) Lineage2 (Beijing genotype) 768 (46.0) 511 (41.3) 257 (59.5) Drug resistance pattern 6.268 0.012 Susceptible 1,445 (86.6) 1,086 (87.9) 359 (83.1) Drug resistant 223 (13.4) 150 (12.1) 73 (16.9) Note. Bacteriological factors, N = 1,668. The demographic and clinical factors were as follows: N = 1,630.
下载: 导出CSV
Table 4. Univariate and multivariate logistic analysis of factors associated with genomic-clustered cases
Variables Univariate analysis Multivariate analysis cOR (95% CI) P value aOR (95% CI) P value Sex Male 1.846 (1.471–2.316) < 0.001 1.760 (1.370–2.260) < 0.001 Female Reference Age, years 0–35 3.011 (2.334–3.884) < 0.001 2.230 (1.677–2.966) < 0.001 ≥ 36 Reference Occupation Students 3.385 (1.957–5 .853) < 0.001 1.887 (1.025–3.474) 0.041 Housekeeping or employed 1.305 (0.929–1.835) 0.125 1.565 (1.076–2.275) 0.019 Others Reference Smear Positive 1.348 (1.065–1.706) 0.013 1.166 (0.908 –1.497) 0.230 Negative Reference Patient source Direct consultation 1.480 (1.110–1.974) 0.008 1.218 (0.895–1.659) 0.210 Others Reference Genotype Beijing genotype 2.112 (1.684–2.649) < 0.001 1.681 (1.323–2.136) < 0.001 Non-Beijing genotype Reference Drug resistance pattern Drug resistant 1.519 (1.117–2.066) 0.008 1.414 (1.023–1.954) 0.036 Pan-susceptible Reference Note. cOR, crude odds ratio. aOR, adjusted odds ratio. CI, confidence interval.
下载: 导出CSV
Table 5. Interpreted proportion of transmitted drug resistance
DRM type No. (%) of transmitted resistance No. of DRMs caused by recent transmission No. of DRMs not confirmed by recent transmission DRMs in New cases DRMs in Previously
treated casesDRMs in unknown cases Any drug resistance (N = 223) 171 (78.4) 66 105 47 5 Isoniazid (N = 124) 86 (71.7) 29 57 34 4 Rifampicin (N = 55) 32 (58.2) 13 19 23 0 Streptomycin (N = 100) 78 (78.8) 36 42 21 1 Ethambutol (N = 15) 9 (60.0) 3 6 6 0 Pyrazinamide (N = 7) 6 (100) 0 6 0 1 Fluoroquinolones (N = 12) 10 (83.3) 6 4 2 0 Ethionamide (N = 25) 19 (76.0) 8 11 5 1 Note. DRM, drug-resistant mutations. Kanamycin (N = 4), capreomycin (N = 4), amikacin (N = 4), para-aminosalicylic acid (N = 3), bedaquiline (N = 1), and clofazimine (N = 1) were excluded because of the low number of drug-resistant mutant strains.
下载: 导出CSV
S1. Drug resistance profiles of 1,668 patients predicted by whole genome sequencing
Type of resistance No. (%) Total New case Retreated cases cases Unknown Resistance to single drug only 136 (8.15) 110 (8.53) 33 (9.71) 3 (7.89) RIF 21 (1.26) 12 (0.93) 9 (2.65) 0 (0.00) INH 53 (3.18) 37 (2.87) 14 (4.12) 2 (5.26) EMB 1 (0.06) 0 (0.00) 1 (0.29) 0 (0.00) PZA 5 (0.30) 4 (0.31) 0 (0.00) 1 (2.63) SM 46 (2.76) 49 (3.80) 7 (2.06) 0 (0.00) FQs 10 (0.60) 8 (0.62) 2 (0.59) 0 (0.00) Multi-drug resistant (MDR) 31 (1.86) 10 (0.78) 21 (6.18) 0 (0.00) INH+RIF+FQs 1 (0.06) 0 (0.00) 1 (0.29) 0 (0.00) INH+RIF 8 (0.48) 3 (0.23) 5 (1.47) 0 (0.00) INH+RIF+EMB 3 (0.18) 2 (0.16) 1 (0.29) 0 (0.00) INH+RIF+SM 5 (0.30) 0 (0.00) 5 (1.47) 0 (0.00) INH+RIF+ETH 1 (0.06) 1 (0.08) 0 (0.00) 0 (0.00) INH+RIF+SM+FQs 1 (0.06) 0 (0.00) 1 (0.29) 0 (0.00) INH+RIF+PZA+SM 1 (0.06) 1 (0.08) 0 (0.00) 0 (0.00) INH+RIF+EMB+SM 7 (0.42) 2 (0.16) 5 (1.47) 0 (0.00) INH+RIF+SM+PAS 1 (0.06) 0 (0.00) 1 (0.29) 0 (0.00) INH+RIF+SM+ETH 1 (0.06) 0 (0.00) 1 (0.29) 0 (0.00) INH+RIF+EMB+PZA+ETH 1 (0.06) 1 (0.08) 0 (0.00) 0 (0.00) INH+RIF+SM+KAN+AMI+CAP 1 (0.06) 0 (0.00) 1 (0.29) 0 (0.00) Resistance to two drugs (except MDR) 35 (2.10) 25 (1.94) 8 (2.35) 2 (5.26) RIF+SM 2 (0.12) 1 (0.08) 1 (0.29) 0 (0.00) RIF+EMB 1 (0.06) 0 (0.00) 1 (0.29) 0 (0.00) INH+ETH 16 (0.96) 12 (0.93) 3 (0.88) 1 (2.63) INH+SM 13 (0.78) 10 (0.78) 2 (0.59) 1 (2.63) INH+EMB 1 (0.06) 1 (0.08) 0 (0.00) 0 (0.00) SM+PAS 1 (0.06) 0 (0.00) 1 (0.29) 0 (0.00) BDQ+CFZ 1 (0.06) 1 (0.08) 0 (0.00) 0 (0.00) Resistance to three or more drugs 11 (0.66) 8 (0.62) 3 (0.88) 0 (0.00) INH+EMB+SM 1 (0.06) 1 (0.08) 0 (0.00) 0 (0.00) INH+SM+ETH 6 (0.36) 4 (0.31) 2 (0.59) 0 (0.00) INH+SM+PAS 1 (0.06) 1 (0.08) 0 (0.00) 0 (0.00) SM+KAN+AMI+CAP 1 (0.06) 0 (0.00) 1 (0.29) 0 (0.00) INH+SM+KAN+AMI+CAP 2 (0.12) 2 (0.16) 0 (0.00) 0 (0.00) Pan drug susceptible 1,445 (86.6) 1,137 (88.1) 275 (80.9) 33 (86.8) Note. INH, isoniazid; RIF, rifampicin; PZA, pyrazinamide; EMB, ethambutol; SM, streptomycin; FQs, fluoroquinolones; ETH, ethionamide; KAN, kanamycin; AMI, amikacin; CAP, capreomycin; BDQ, bedaquiline; CFZ, clofazimine.
下载: 导出CSV
-
[1] WHO. Global tuberculosis report 2021. WHO. 2021. [2] Dong Z, Yao HY, Yu SC, et al. Changes in notified incidence of pulmonary tuberculosis in China, 2005-2020. Biomed Environ Sci, 2023; 36, 117−26. [3] Li XX, Wang LX, Zhang H, et al. Spatial variations of pulmonary tuberculosis prevalence co-impacted by socio-economic and geographic factors in People's Republic of China, 2010. BMC Public Health, 2014; 14, 257. doi: 10.1186/1471-2458-14-257 [4] Wubuli A, Xue F, Jiang DB, et al. Socio-demographic predictors and distribution of pulmonary tuberculosis (TB) in Xinjiang, China: a spatial analysis. PLoS One, 2015; 10, e0144010. doi: 10.1371/journal.pone.0144010 [5] Mijiti P, Li YH, Xue F, et al. Prevalence of pulmonary tuberculosis in western China in 2010–11: a population-based, cross-sectional survey. Lancet Global Health, 2016; 4, e485−94. doi: 10.1016/S2214-109X(16)30074-2 [6] He XY, Cao MQ, Mahapatra T, et al. Burden of tuberculosis in Xinjiang between 2011 and 2015: A surveillance data-based study. PLoS One, 2017; 12, e0187592. doi: 10.1371/journal.pone.0187592 [7] Liu MY, Li QH, Zhang YJ, et al. Spatial and temporal clustering analysis of tuberculosis in the mainland of China at the prefecture level, 2005-2015. Infect Dis Poverty, 2018; 7, 106. doi: 10.1186/s40249-018-0490-8 [8] Yates TA, Khan PY, Knight GM, et al. The transmission of Mycobacterium tuberculosis in high burden settings. Lancet Infect Dis, 2016; 16, 227−38. doi: 10.1016/S1473-3099(15)00499-5 [9] Shah NS, Auld SC, Brust JCM, et al. Transmission of extensively drug-resistant tuberculosis in south Africa. N Engl J Med, 2017; 376, 243−53. doi: 10.1056/NEJMoa1604544 [10] Kendall EA, Fofana MO, Dowdy DW. Burden of transmitted multidrug resistance in epidemics of tuberculosis: a transmission modelling analysis. Lancet Respir Med, 2015; 3, 963−72. doi: 10.1016/S2213-2600(15)00458-0 [11] Koch A, Cox H. Preventing drug-resistant tuberculosis transmission. Lancet Infect Dis, 2020; 20, 157−8. doi: 10.1016/S1473-3099(19)30613-9 [12] Cancino-Muñoz I, López MG, Torres-Puente M, et al. Population-based sequencing of Mycobacterium tuberculosis reveals how current population dynamics are shaped by past epidemics. eLife, 2022; 11, e76605. doi: 10.7554/eLife.76605 [13] Small PM, Hopewell PC, Singh SP, et al. The epidemiology of tuberculosis in San Francisco. A population-based study using conventional and molecular methods. N Engl J Med, 1994; 330, 1703−9. doi: 10.1056/NEJM199406163302402 [14] Kato-Maeda M, Small PM. How molecular epidemiology has changed what we know about tuberculosis. West J Med, 2000; 172, 256−9. doi: 10.1136/ewjm.172.4.256 [15] Frieden TR, Sherman LF, Maw KL, et al. A multi-institutional outbreak of highly drug-resistant tuberculosis: epidemiology and clinical outcomes. JAMA, 1996; 276, 1229−35. doi: 10.1001/jama.1996.03540150031027 [16] Tabet SR, Goldbaum GM, Hooton TM, et al. Restriction fragment length polymorphism analysis detecting a community-based tuberculosis outbreak among persons infected with human immunodeficiency virus. J Infect Dis, 1994; 169, 189−92. doi: 10.1093/infdis/169.1.189 [17] The Ministry of Health,China Center for Disease Control and Prevention. Guidelines for the implementation of China's tuberculosis control program. Beijing: China Peking Union Medical College Press, 2008. (In Chinese) [18] Schiebelhut LM, Abboud SS, Gómez Daglio LE, et al. A comparison of DNA extraction methods for high-throughput DNA analyses. Mol Ecol Resour, 2017; 17, 721−9. [19] Liu QY, Ma AJ, Wei LH, et al. China's tuberculosis epidemic stems from historical expansion of four strains of Mycobacterium tuberculosis. Nat Ecol Evol, 2018; 2, 1982−92. doi: 10.1038/s41559-018-0680-6 [20] Chen YW, Liu QY, Takiff HE, et al. Comprehensive genomic analysis of Mycobacterium tuberculosis reveals limited impact of high-fitness genotypes on MDR-TB transmission. J Infect, 2022; 85, 49−56. doi: 10.1016/j.jinf.2022.05.012 [21] Liu CF, Song YM, He P, et al. Evaluation of multidrug resistant loop-mediated isothermal amplification assay for detecting the drug resistance of Mycobacterium tuberculosis. Biomed Environ Sci, 2021; 34, 616−22. [22] Yang TT, Gan MY, Liu QY, et al. SAM-TB: a whole genome sequencing data analysis website for detection of Mycobacterium tuberculosis drug resistance and transmission. Brief Bioinform, 2022; 23, bbac030. doi: 10.1093/bib/bbac030 [23] Li M, Guo MC, Peng Y, et al. High proportion of tuberculosis transmission among social contacts in rural China: a 12-year prospective population-based genomic epidemiological study. Emerg Microbes Infect, 2022; 11, 2102−11. doi: 10.1080/22221751.2022.2112912 [24] Jiang Q, Liu QY, Ji LC, et al. Citywide transmission of multidrug-resistant tuberculosis under China's rapid urbanization: a retrospective population-based genomic spatial epidemiological study. Clin Infect Dis, 2020; 71, 142−51. doi: 10.1093/cid/ciz790 [25] Coll F, McNerney R, Guerra-Assunção JA, et al. A robust SNP barcode for typing Mycobacterium tuberculosis complex strains. Nat Commun, 2014; 5, 4812. doi: 10.1038/ncomms5812 [26] Kumar S, Stecher G, Li M, et al. MEGA X: Molecular evolutionary genetics analysis across computing platforms. Mol Biol Evol, 2018; 35, 1547−9. doi: 10.1093/molbev/msy096 [27] Casali N, Nikolayevskyy V, Balabanova Y, et al. Evolution and transmission of drug-resistant tuberculosis in a Russian population. Nat Genet, 2014; 46, 279−86. doi: 10.1038/ng.2878 [28] Yang CG, Luo T, Shen X, et al. Transmission of multidrug-resistant Mycobacterium tuberculosis in Shanghai, China: a retrospective observational study using whole-genome sequencing and epidemiological investigation. Lancet Infect Dis, 2017; 17, 275−84. doi: 10.1016/S1473-3099(16)30418-2 [29] Technical Guidance Group of the Fifth National TB Epidemiological Survey, The Office of the Fifth National TB Epidemiological Survey. The fifth national tuberculosis epidemiological survey in 2010. Chin J Antituberc, 2012; 34, 485−508. (In Chinese) [30] Maiweilanjiang·Abulimiti, Diermulati·Tusun, Liu ZJ, et al. Analysis on the therapeutic effect and influencing factors of initial treated smear-positive pulmonary tuberculosis patients in Kashgar Prefecture from 2016 to 2018. Chin J Antituberc, 2021; 43, 391−7. (In Chinese) [31] Raviglione MC, Uplekar MW. WHO's new stop TB strategy. Lancet, 2006; 367, 952−5. doi: 10.1016/S0140-6736(06)68392-X [32] Wang SF, Zhou Y, Ou XC, et al. Prevalence of drug resistant tuberculosis in China: data from national drug resistant tuberculosis survey in 2018. Chin J Antituberc, 2022; 44, 1141−7. (In Chinese) [33] Colangeli R, Gupta A, Vinhas SA, et al. Mycobacterium tuberculosis progresses through two phases of latent infection in humans. Nat Commun, 2020; 11, 4870. doi: 10.1038/s41467-020-18699-9 [34] Behr MA, Edelstein PH, Ramakrishnan L. Revisiting the timetable of tuberculosis. BMJ, 2018; 362, k2738. [35] Walker TM, Lalor MK, Broda A, et al. Assessment of Mycobacterium tuberculosis transmission in Oxfordshire, UK, 2007-12, with whole pathogen genome sequences: an observational study. Lancet Respir Med, 2014; 2, 285−92. doi: 10.1016/S2213-2600(14)70027-X [36] Guerra-Assunção JA, Crampin AC, Houben RMGJ, et al. Large-scale whole genome sequencing of M. tuberculosis provides insights into transmission in a high prevalence area. eLife, 2015; 4, e05166. doi: 10.7554/eLife.05166 [37] Liu M, Xu P, Liao XW, et al. Molecular epidemiology and drug-resistance of tuberculosis in Luodian revealed by whole genome sequencing. Infect Genet Evol, 2021; 93, 104979. doi: 10.1016/j.meegid.2021.104979 [38] Wang M, Zhang YY, Huang C, et al. A whole-genome sequencing-based study to delineate the risk and characteristics of tuberculosis transmission in an insular population over 10 years in Shanghai. Front Microbiol, 2021; 12, 768659. [39] Yang TT, Wang YX, Liu QY, et al. A population-based genomic epidemiological study of the source of tuberculosis infections in an emerging city: Shenzhen, China. Lancet Reg Health West Pac, 2021; 8, 100106. doi: 10.1016/j.lanwpc.2021.100106 [40] Nava-Aguilera E, Andersson N, Harris E, et al. Risk factors associated with recent transmission of tuberculosis: systematic review and meta-analysis. Int J Tuberc Lung Dis, 2009; 13, 17−26. [41] Yuen CM, Kammerer JS, Marks K, et al. Recent transmission of tuberculosis - United States, 2011-2014. PLoS One, 2016; 11, e0153728. doi: 10.1371/journal.pone.0153728 [42] Melnyk AH, Wong A, Kassen R. The fitness costs of antibiotic resistance mutations. Evol Appl, 2015; 8, 273−83. doi: 10.1111/eva.12196 [43] Becerra MC, Huang CC, Lecca L, et al. Transmissibility and potential for disease progression of drug resistant Mycobacterium tuberculosis: prospective cohort study. BMJ, 2019; 367, l5894. [44] Theron G, Limberis J, Venter R, et al. Bacterial and host determinants of cough aerosol culture positivity in patients with drug-resistant versus drug-susceptible tuberculosis. Nat Med, 2020; 26, 1435−43. doi: 10.1038/s41591-020-0940-2 [45] Jones-López EC, Namugga O, Mumbowa F, et al. Cough aerosols of Mycobacterium tuberculosis predict new infection. a household contact study. Am J Respir Crit Care Med, 2013; 187, 1007−15. doi: 10.1164/rccm.201208-1422OC [46] Yang EZ, Yang R, Guo M, et al. Multidrug-resistant tuberculosis (MDR-TB) strain infection in macaques results in high bacilli burdens in airways, driving broad innate/adaptive immune responses. Emerg Microbes Infect, 2018; 7, 1−12. [47] Mathema B, Andrews JR, Cohen T, et al. Drivers of tuberculosis transmission. J Infect Dis, 2017; 216, S644−53. doi: 10.1093/infdis/jix354 [48] van Soolingen D, Borgdorff MW, de Haas PEW, et al. Molecular epidemiology of tuberculosis in the Netherlands: a nationwide study from 1993 through 1997. J Infect Dis, 1999; 180, 726−36. doi: 10.1086/314930 [49] Burgos M, DeRiemer K, Small PM, et al. Effect of drug resistance on the generation of secondary cases of tuberculosis. J Infect Dis, 2003; 188, 1878−84. doi: 10.1086/379895 [50] Yang CG, Shen X, Peng Y, et al. Transmission of Mycobacterium tuberculosis in China: a population-based molecular epidemiologic study. Clin Infect Dis, 2015; 61, 219−27. doi: 10.1093/cid/civ255 [51] Cowley D, Govender D, February B, et al. Recent and rapid emergence of W-Beijing strains of Mycobacterium tuberculosis in Cape Town, South Africa. Clin Infect Dis, 2008; 47, 1252−9. doi: 10.1086/592575 [52] Niemann S, Merker M, Kohl T, et al. Impact of genetic diversity on the biology of Mycobacterium tuberculosis complex strains. Microbiol Spectr, 2016; 4. [53] Tsenova L, Ellison E, Harbacheuski R, et al. Virulence of selected Mycobacterium tuberculosis clinical isolates in the rabbit model of meningitis is dependent on phenolic glycolipid produced by the bacilli. J Infect Dis, 2005; 192, 98−106. doi: 10.1086/430614 [54] Parwati I, van Crevel R, van Soolingen D. Possible underlying mechanisms for successful emergence of the Mycobacterium tuberculosis Beijing genotype strains. Lancet Infect Dis, 2010; 10, 103−11. doi: 10.1016/S1473-3099(09)70330-5 [55] Manca C, Reed MB, Freeman S, et al. Differential monocyte activation underlies strain-specific Mycobacterium tuberculosis pathogenesis. Infect Immun, 2004; 72, 5511−4. doi: 10.1128/IAI.72.9.5511-5514.2004 [56] Kerubo G, Ndungu P, Shuaib YA, et al. Molecular epidemiology of Mycobacterium tuberculosis complex strains in urban and slum settings of Nairobi, Kenya. Genes, 2022; 13, 475. doi: 10.3390/genes13030475 [57] O'Neill MB, Shockey A, Zarley A, et al. Lineage specific histories of Mycobacterium tuberculosis dispersal in Africa and Eurasia. Mol Ecol, 2019; 28, 3241−56. doi: 10.1111/mec.15120 [58] Jia QJ, Zeng MC, Cheng QL, et al. The retrospective diagnostic potential of GeneXpert MTB/RIF for the analysis of formalin-fixed paraffin-embedded tissue from extrapulmonary tuberculosis patients. Biomed Environ Sci, 2023; 36, 295−8. -
 23064Supplementary Materials.pdf

-

 点击查看大图
计量
- 文章访问数: 1445
- HTML全文浏览量: 575
- PDF下载量: 141
- 被引次数: 0

 Quick Links