

 下载:
下载:


-
Cerebral small vessel disease (CSVD) is a syndrome of clinical, imaging, and pathological feature manifestations resulting from intracranial small vessel lesions[1,2]. CSVD is responsible for 25% of strokes and 45% of dementias[3,4]. The primary pathological changes in CSVD include the destruction of the blood-brain barrier (BBB), the progression of white matter hyperintensities (WMH), and other structural lesions[4,5]. Among these, WMH are a significant pathological feature in CSVD, presenting as visible lesions on magnetic resonance imaging (MRI). The cognitive, mood, gait, and urinary problems caused by WMH seriously affect patients’ quality of life and place substantial economic pressure on their families and society[3].
At present, WMH is often diagnosed using MRI sequences. Nevertheless, MRI cannot always be undertaken due to MR conditions and economicrestraints. Therefore, new detection methods for WMH identification are urgently needed. The pathogenesis of WMH is still not fully understood, and many studies have indicated that it is related to chronic hypoperfusion. The possible pathogenesis of WMH includes the inflammatory response of the immune system, oxidative stress, destruction of the BBB, endothelial dysfunction, and so on[6-10]. Recent studies confirmed that exosomes may be a crucial factor in WMH[11,12]. Therefore, plasma exosomes may be a valuable target for the diagnosis and prognosis of WMH.
Exosomes are tiny vesicular structures secreted by cells and range in size from 40–160 nm in diameter[13]. Exosomes play key roles in intercellular communication because they provide a stable environment and fuse with the plasma membrane of recipient cells[14,15]. In addition, exosomes are considered ideal drug delivery carriers due to their good biocompatibility and ability to cross the BBB[16,17]. Exosomes contribute to multiple disease processes, such as immune responses[18], inflammation[19], and even neurodegenerative diseases[20,21]. Exosome contents have been shown to act as biomarkers of neurodegeneration and efficiently pass through the BBB[13,15,22]. One feature distinguishing exosomes from other biological vesicles is the high number of nucleotides contained within exosomes[13,14]. Recent studies have found that noncoding RNAs in exosomes, such as long noncoding RNAs (lncRNAs), have diagnostic value in many diseases[23,24].
LncRNAs refer to RNAs with more than 200 nucleotides with rare protein-coding capability[25,26]. Recently, researchers have shown that lncRNAs are implicated in WMH; for example, lncRNA AC020928.1 is a potential diagnostic biomarker for WMH in hypertensive populations[27]. LncRNAs are very unstable and easily destroyed by RNA enzymes[28,29]. Exosomes provide a stable environment that avoids RNA enzyme destruction[13]. Recently, studies have found that exosomal lncRNAs possess diagnostic value in diseases[30,31]. However, there is a lack of research on the correlation between the severity and lesion site of WMH and exo-lncRNAs.
In this study, to prove the clinical diagnostic value of exosomal lncRNAs in WMH, the lncRNAs in human plasma exosomes were investigated using sequencing, validation, and functional analysis. Furthermore, the correlation between exo-lncRNAs and the severity and sites of WMH was also assessed. Our results may provide a novel direction for understanding the mechanism and improving the diagnosis of WMH.
-
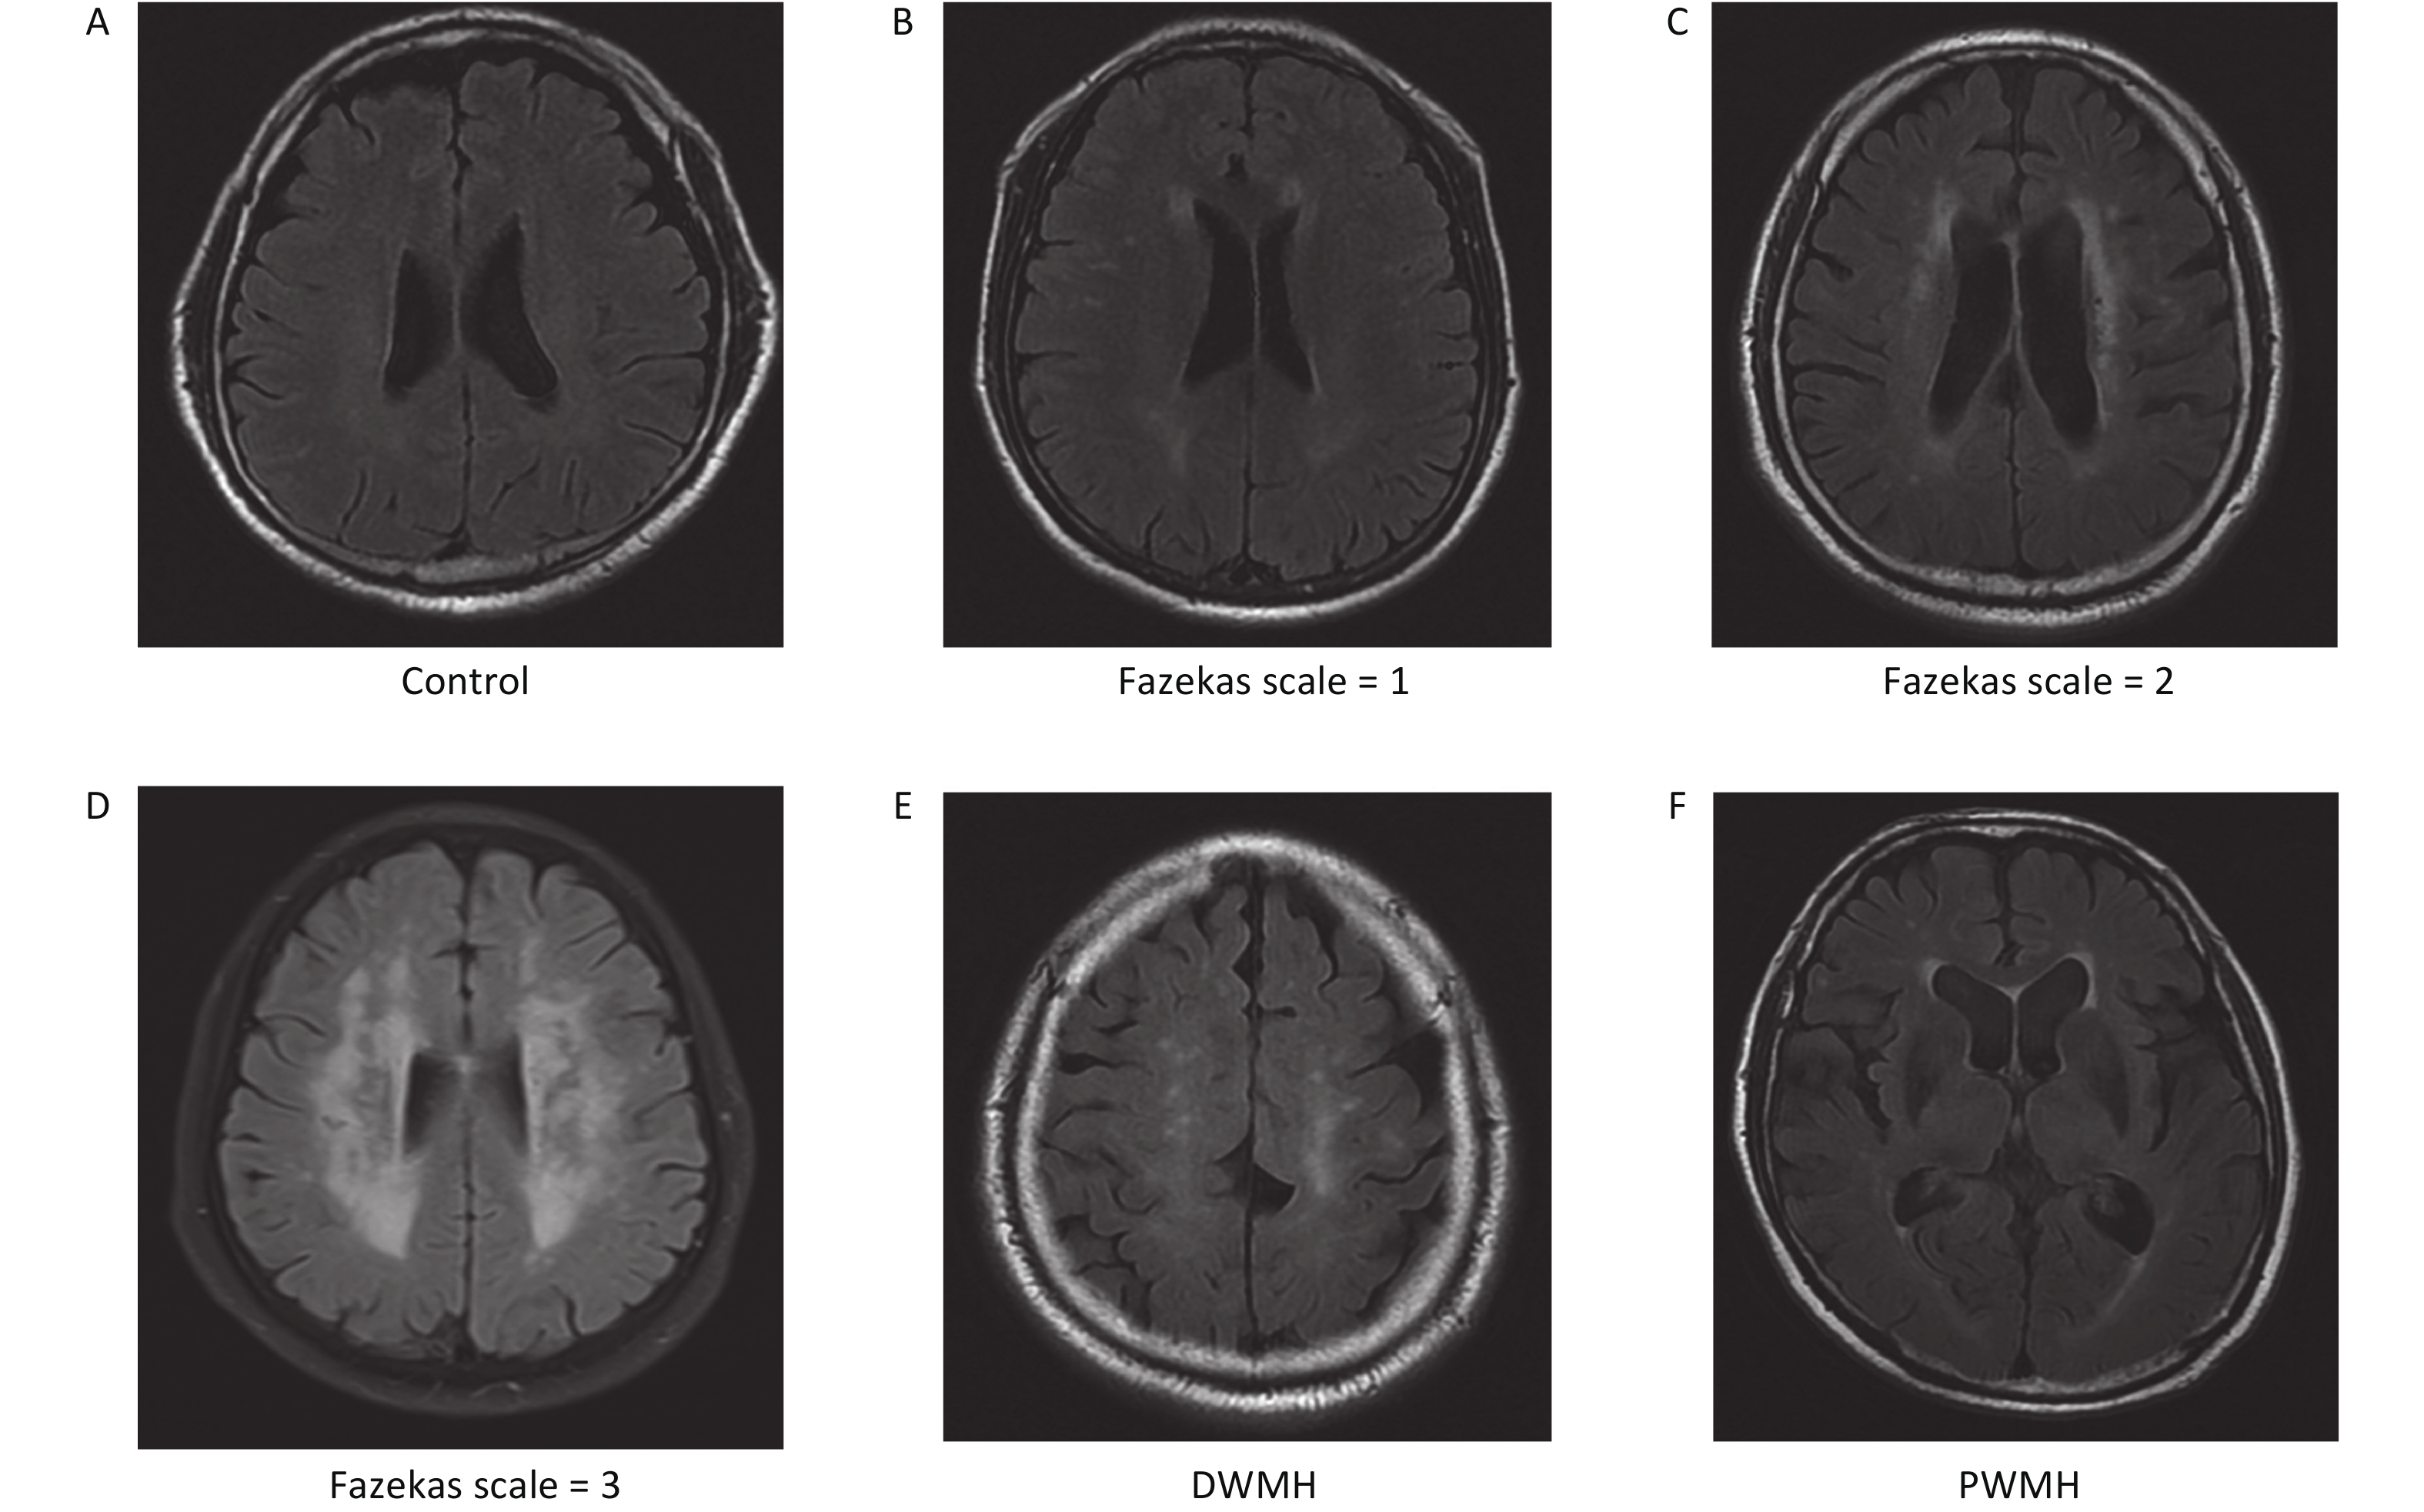
We enrolled 211 patients from the Affiliated Hospital of Qingdao University from March 2018 to October 2020. We reviewed the brain MRI results of these patients. Patients’ images were retrospectively reviewed by two trained neurologists with more than 10 years of experience who were blind to any patient information. According to the MRI results, the patients were divided into a WMH group and a control group[32,33]. All patients, including 107 WMH patients and 104 controls, were age- and sex-matched. Cranial images from fluid-attenuated inversion recovery (FLAIR), T1-weighted, and T2-weighted sequences were obtained from all patients using a Siemens Skyra 3.0 T scanner (Siemens, Germany). WMH is defined as hyperintensities in T2WI or FLAIR images[34]. The site of WMH was divided into deep white matter hyperintensities (DWMH) and paraventricular white matter hyperintensities (PWMH)[32]. The severity of WMH was evaluated by the FLAIR sequence, which primarily uses the Fazekas scale, with scores from 0 to 3[32,35]. The severity of DWMH was graded from 0 to 3 (0: no lesion; 1: punctate foci; 2: beginning confluence; 3: large confluent areas). Similarly, PWMH was graded from 0 to 3 (0: no lesion; 1: caps or pencil-thin lining; 2: smooth halo; 3: irregular paraventricular signal extending into the deep white matter). If the DWMH and PWMH grades differed, the higher grade was taken as the value (Supplementary Figure S1, available in www.besjournal.com)[32,35].
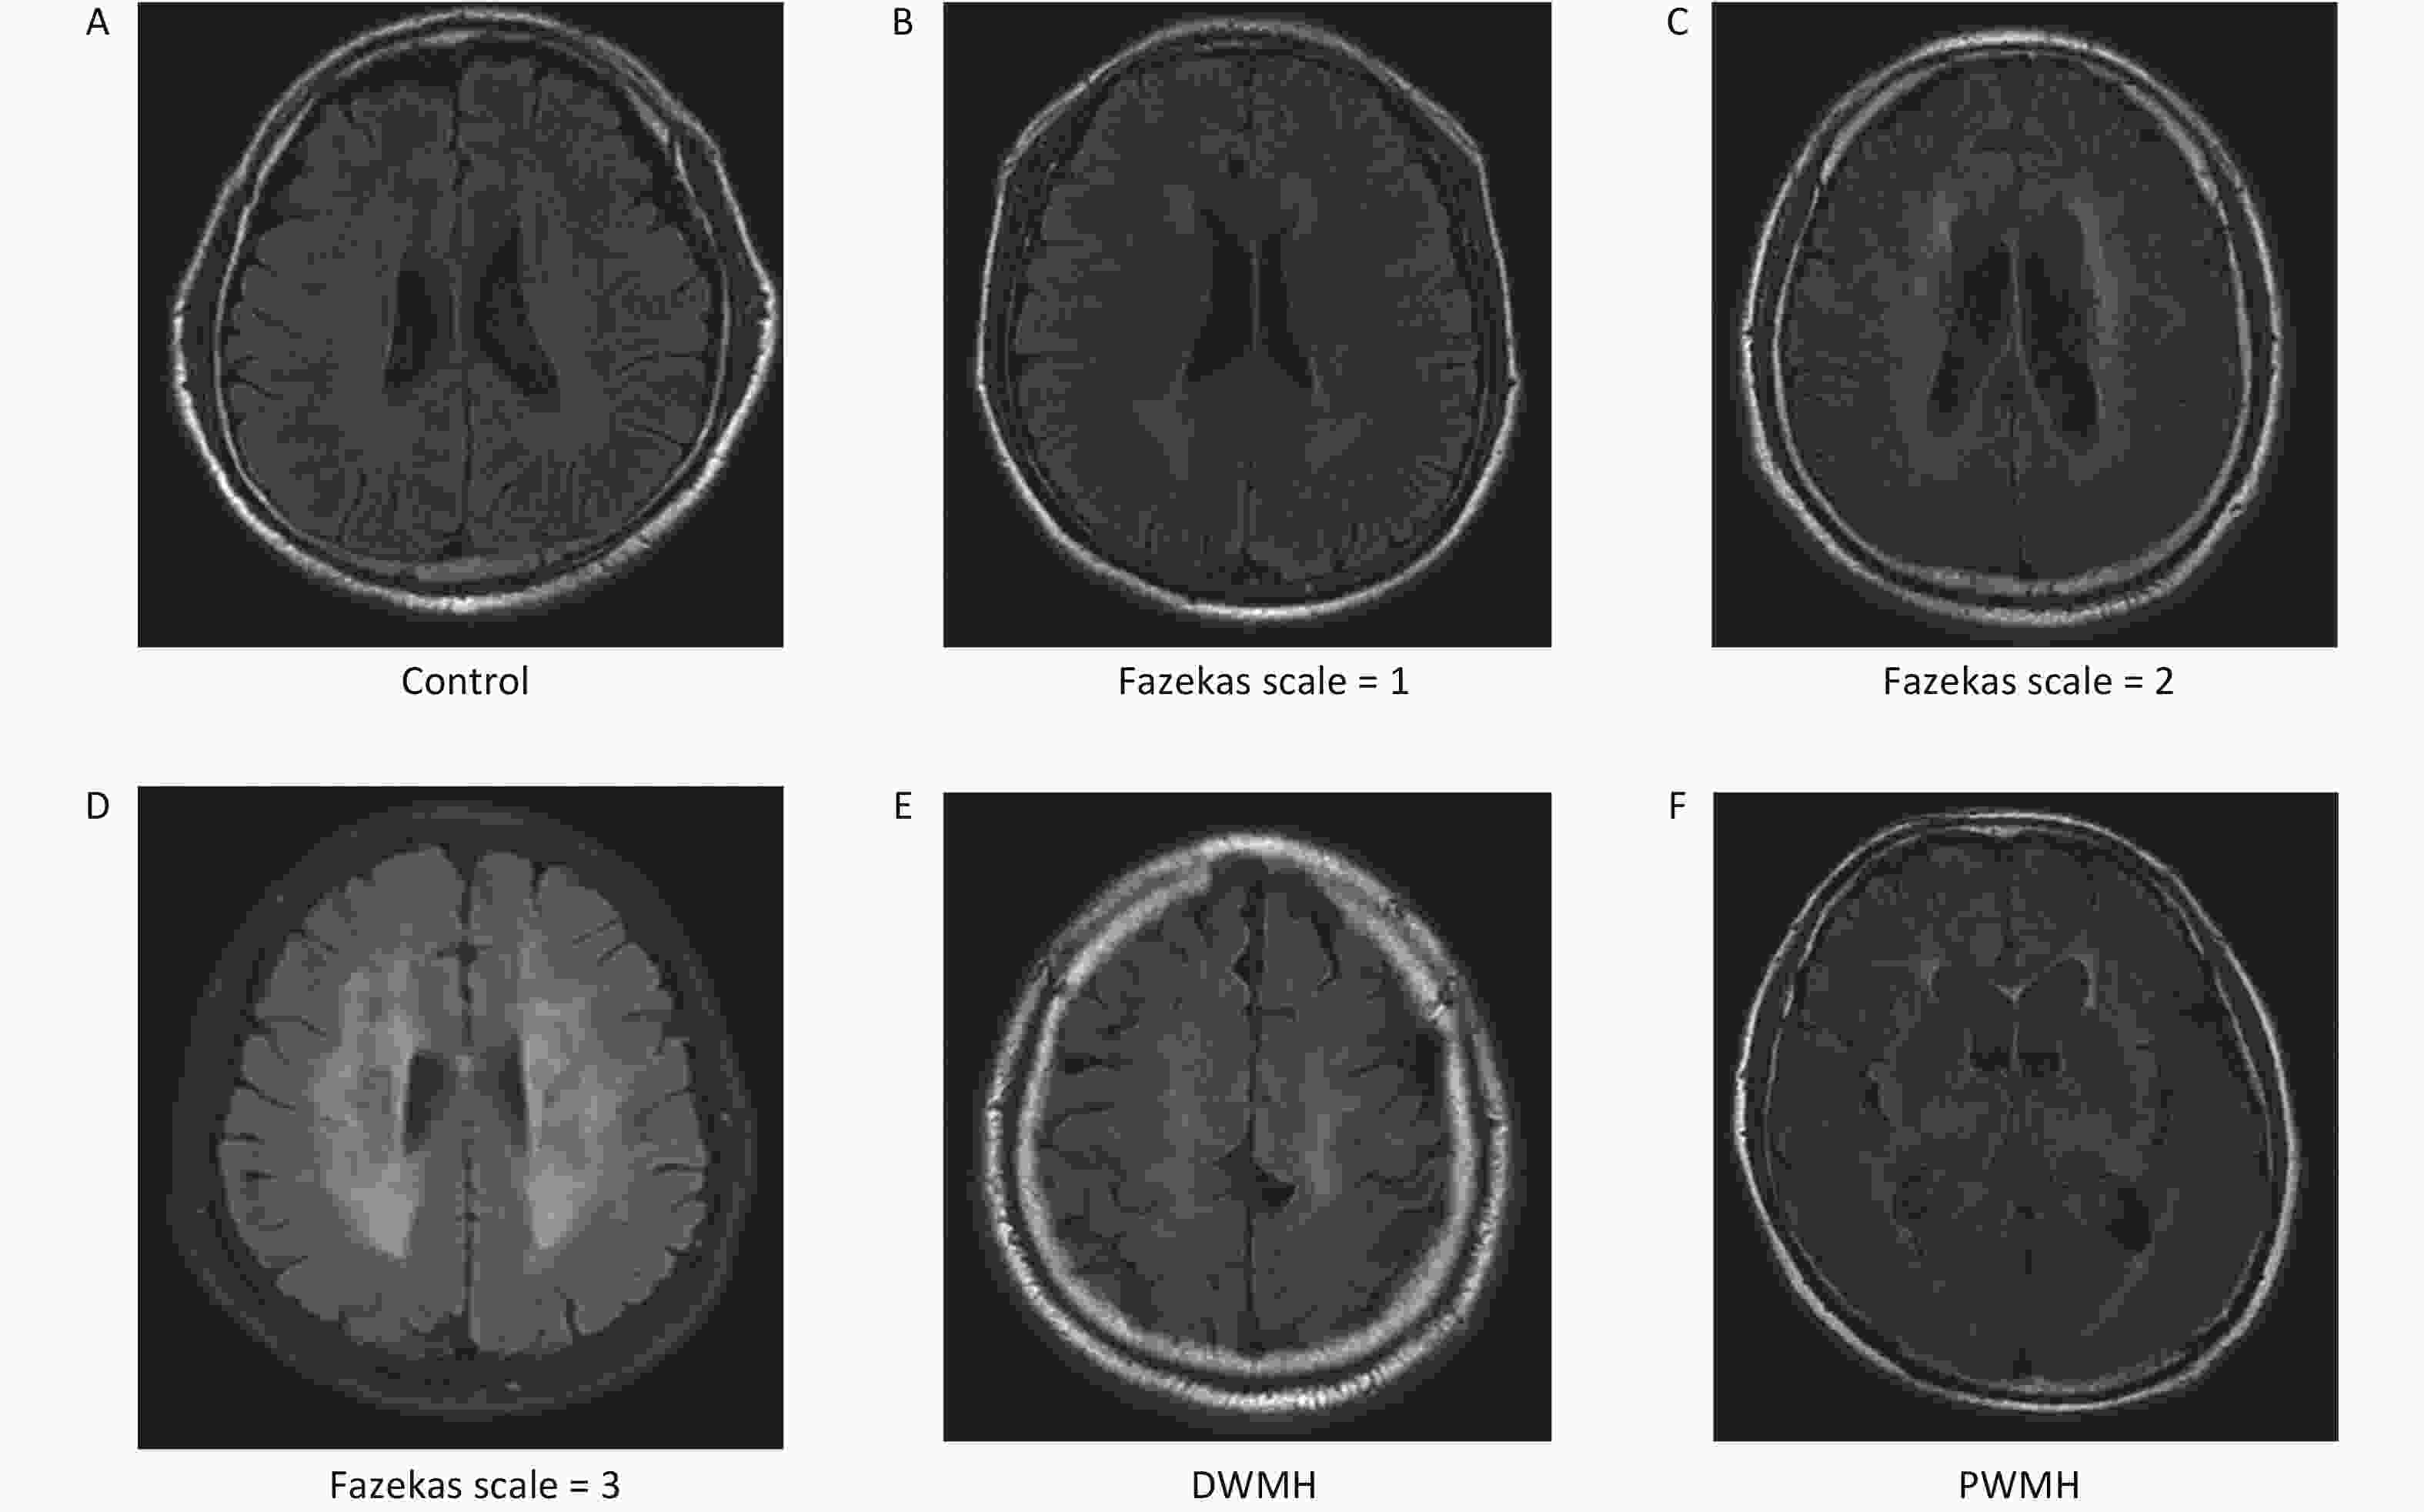
Figure S1. The representative MR images of WMH of different severity and lesion sites.
The main exclusion criteria of this study were as follows: (I) age < 18 years; (II) incomplete brain MRI examination; (III) severe liver or kidney dysfunction; (IV) blood system diseases or tumors; (V) history of cardiac embolism; (VI) history of ischemic or hemorrhagic stroke; and (VII) WMH caused by genetic or other known etiologies[32,33,36].
Plasma exosomes from seven patients with WMH and four controls were randomly selected from each group and sequenced.
All patients in our study provided written informed consent. Furthermore, our study was approved by the Ethics Committee of the Affiliated Hospital of Qingdao University.
-
Within 24 hours of admission, peripheral venous blood was collected in ethylenediaminetetra acetic acid (EDTA) tubes and centrifuged at 2,500 ×g at 4 °C for 15 min. The upper plasma layer was collected in a new 1.5 mL EP tube and stored at −80 °C[31]. Plasma samples of this study were centrifuged at 3,000 ×g for 15 min at room temperature to remove cells and cellular debris. And exosomes were mainly isolated using Total Exosome Isolation (from plasma) reagent (Invitrogen, California, USA)[37]. Furthermore, plasma samples of our study were fully centrifuged at 2,000 ×g for 20 min at room temperature to remove cells and cellular debris. Then, the supernatant was centrifuged at 10,000 ×g for 20 min to remove any remaining debris. A 0.5 volume of 1× phosphate buffer saline (PBS) and a 0.05 volume of protease K were added to the supernatant. All samples were then incubated in tubes at 37 °C for 10 min. A 0.2 volume of Exosome Precipitation Reagent was added, at which point the solution had a cloudy appearance. The samples were incubated at 2 to 8 °C for thirty min, followed by centrifugation at room temperature at 10,000 ×g for five min. Finally, exosomes were precipitated in a pellet at the bottom of the tube. The exosomes were resuspended in PBS and subsequently stored at −80 °C.
-
The exosome suspension (20 µL) was placed in a carbon net and then left at room temperature for 20 min. Next, 2% phosphotungstic acid (20 µL) was dropped onto the carbon net and allowed to stand for 20 s. The image was observed using TEM (JEOL, JEM-1400, Tokyo, Japan)[38,39].
-
Exosomal proteins were prepared in Radio Immunoprecipitation Assay (RIPA) buffer with Phenylmethanesulfonyl fluoride (PMSF) (MCE, USA). Total protein concentrations can be detected by the bicinchoninic acid (BCA) protein assay. Protein samples were subjected to 12% SDS-PAGE and then moved onto membranes (Millipore Co., NJ, USA). Polyvinylidene fluoride (PVDF) membranes were incubated with primary antibodies overnight at 4 °C and then with a secondary antibody (Abcam, MA, USA) at room temperature for 1 h[40]. According to the recommendations from the International Society for Extracellular Vesicles, the primary antibodies included positive markers (rabbit anti-CD63 and rabbit anti-CD9) and a negative marker (rabbit anti-GRP94) (Abcam, MA, USA)[39].
-
The exosome samples of the study were resuspended in 1 mL PBS. The size and concentration of exosomes were determined using a Zeta View PMX 110 (Particle Metrix, Meerbusch, Germany)[41]. Particle characteristics were evaluated using NTA software (ZetaView 8.02.28)[39].
-
In our study, total RNA was isolated from exosomes using the miRNeasy Serum/Plasma Advanced kit (Qiagen, cat. 217204, Germany) according to the manufacturer’s protocol[30]. A total of 20 ng RNA per sample was used as the input material to prepare the RNA sample. The ribosomal RNA was cleaned up by an Epicenter Ribo-zero™ rRNA Removal Kit (Epicenter, USA), and then the rRNA-free residues were removed by ethanol precipitation. Furthermore, the sequencing libraries were developed using rRNA-depleted RNA by the NEBNext® Ultra™ Directional RNA Library Prep Kit for Illumina® (NEB, USA), as recommended by the manufacturer. The RNA concentration, purity, and integrity were evaluated using the Agilent Bioanalyzer 2100 system (Agilent Technologies, CA, USA)[42]. According to the manufacturer’s instructions, and the indexed coded samples were clustered on a cBot clustering system using TruSeq PE Cluster Kit V3-CBOT-HS (Illumina). After clustering, the libraries were sequenced on an Illumina HiSeq 2500 platform, and then the 125 bp paired-end reads were obtained[43].
-
In our study, differentially expressed genes (DEGs) were compared using an unpaired t-test. The cutoff value was P ≤ 0.05, and a log2 fold change ≥ 1.5. Additionally, volcano plots and heatmaps were prepared using GraphPad Prism 8 and TBtools. The biological functions of DE exo-lncRNAs were analyzed using Gene Ontology (GO) and Kyoto Encyclopedia of Genes and Genomes (KEGG) enrichment[44].
-
A PPI network based on the STRING database (https://cn.string-db.org/) was used to analyze DE mRNAs. Then, the submodules were identified with a cutoff score > 2.0 using the MCODE plugin from the PPI network. Furthermore, the PPI network analysis was visualized using Cytoscape 3.8.2 (NIGMS, USA)[45].
-
The extraction method of exosomal RNAs was the same as described above. RNA was converted into cDNA using a Goldenstar RT6 cDNA synthesis kit v. 2 (TSINGKE, Beijing, China). The cDNA templates were amplified by real-time PCR using 2×T5 Fast qPCR Mix (SYBR Green I) (TSINGKE, Beijing, China). The specific primers are listed in Table 1. PCR was performed in 20 μL reaction volumes, which included 2 μL of cDNA, 10 μL of 2×T5 Fast qPCR Mix, 0.8 μL of forward primer (10 μmol/L), 0.8 μL of reverse primer (10 μmol/L), and 6.4 μL of double distilled water. All experiments were performed in duplicate. ACTB was used as the internal control, and the 2−ΔΔCt method was used to evaluate the expression of relative genes.
Table 1. Primer sequences in the study
Gene Primer sequences 5'–3' Exo-lnc_011776 F: ATTCCCGCAAGTTTGACTCCTTCC R: TCTGGTCCTTGTTCCCGTCTGG Exo-lnc_011797 F: AGGTGGAACGGGTTTAGGGCTAG R: CACTTGGACGAACCAGAGTGTAGC Exo-lnc_004326 F: CTCTGTCAAACCCTGAGCCAACC R: GAGCCGTCTCCACCTCCCATAG Exo-lnc_013222 F: GAAGTCGTGCCTTTCCTGTCCTG R: GTGAGTCCACCTCGCTGAAGATAC Exo-WNK1 F: CGAGTGAGCAGCCAACAGACAG R: TGTGCTTGGACAGTAGAAGGTATATGC Exo-RPL18 F: CCGCCATAACAAGGACCGAAAGG R: TGGTTGAATGTGGAGTTGGTTCTTCTG ACTB F: TGCTGTCACCTTCACCGTTCCA R: GCGGACTATGACTTAGTTGCGTTACA -
The correlation between lncRNAs and mRNAs among samples was analyzed using the Pearson correlation coefficient. Coexpression refers to a correlation coefficient > 0.95. lncRNA-mRNA networks were constructed using Cytoscape 3.8.2.
-
In this study, quantitative variables are expressed as the mean ± standard deviation (SD) and categorical variables are expressed as percentages. They were analyzed using chi-square tests, with t-tests used to compare two groups. Nonnormally distributed data were compared between two groups using the Mann-Whitney U test. One-way analysis of variance (ANOVA) was used to compare three or more groups. Binary logistic regression analysis was used to evaluate the relationship between exo-lncRNAs and WMH. A receiver operating characteristic (ROC) curve analysis was used to compare the potential diagnostic value of the exosomal lncRNAs between the control and WMH groups. The diagnostic value of differentially expressed exo-lncRNAs was determined by the area under the curve (AUC). A P value < 0.05 was considered statistically significant, and all statistical analyses were conducted with SPSS12.0 (SPSS Inc., Chicago, USA) and GraphPad Prism 8 (GraphPad, California, USA) software.
-
There were 107 WMH patients and 104 controls in the study. There were no obvious differences in age, sex, hypertension, diabetes, TC, HDL, and LDL between the WMH and control groups. The smoking consumption and the levels of TG in WMH patients was higher than that in control subjects (Table 2).
Table 2. Basic clinical data of two groups of patients
Variables WMH Control P value Case number 107 104 Age (years) 61.09 ± 12.59 63.65 ± 10.70 0.111 Gender, male, n (%) 50 (46.72) 59 (56.73) 0.146 Hypertension, n (%) 0.109 Yes 76 (71.03) 63 (60.58) No 31 (28.97) 41 (39.42) Diabetes, n (%) 0.098 Yes 31 (28.97) 20 (19.23) No 76 (73.07) 84 (80.77) Smoke, n (%) 0.037* Yes 34 (31.78) 20 (19.23) No 73 (68.22) 84 (80.77) TG (mmol/L) 1.63 ± 0.96 1.37 ± 0.78 0.031* TC (mmol/L) 4.45 ± 1.00 4.28 ± 1.08 0.252 HDL (mmol/L) 1.28 ± 0.43 1.20 ± 0.28 0.099 LDL (mmol/L) 2.55 ± 0.76 2.62 ± 0.84 0.586 Note. *P < 0.05 is considered statistically significant. -
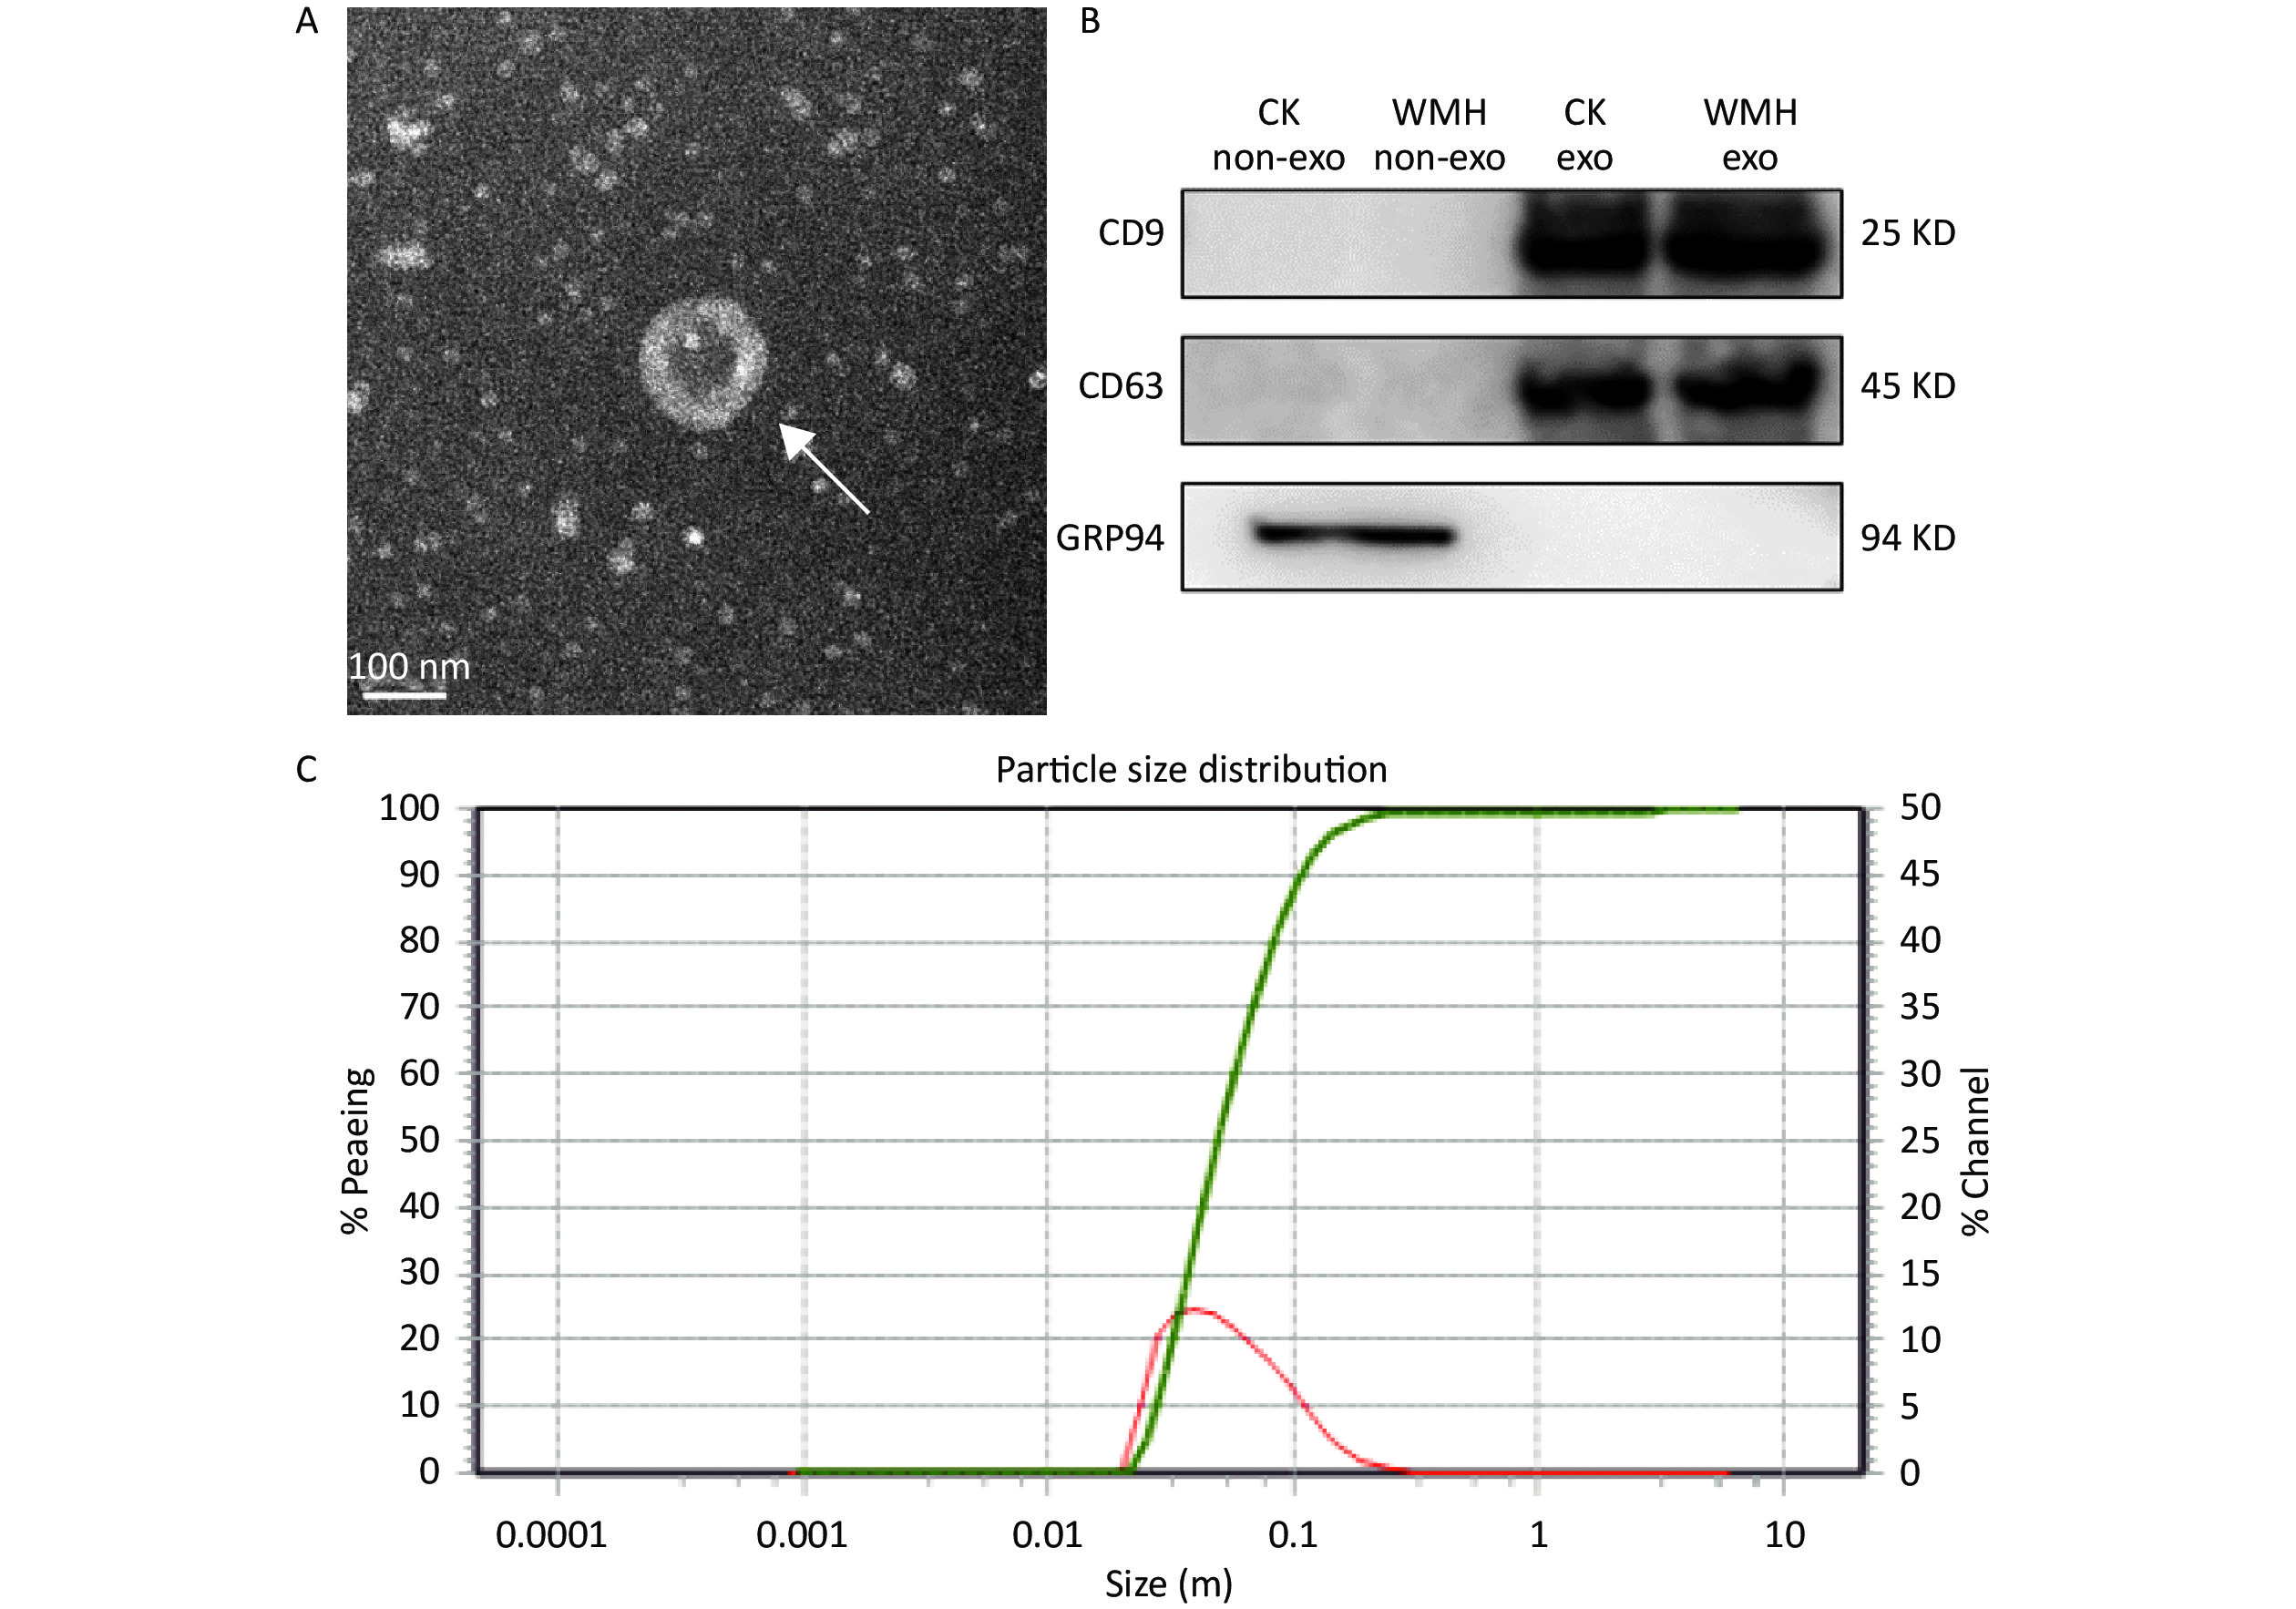
The extracted exosomes were observed by TEM as cup-shaped vesicles with an average diameter of 40–160 nm (Figure 1A)[13,23]. According to previous literature, we performed western blot analysis on exosomes extracted from WMH and controls[31]. Two positive exosome markers (CD63 and CD9) were identified, while the negative marker, GRP94, was absent from exosomes (Figure 1B). The size range of the exosomes was determined using NTA (Figure 1C). The results confirmed the characteristics of plasma exosomes[39].
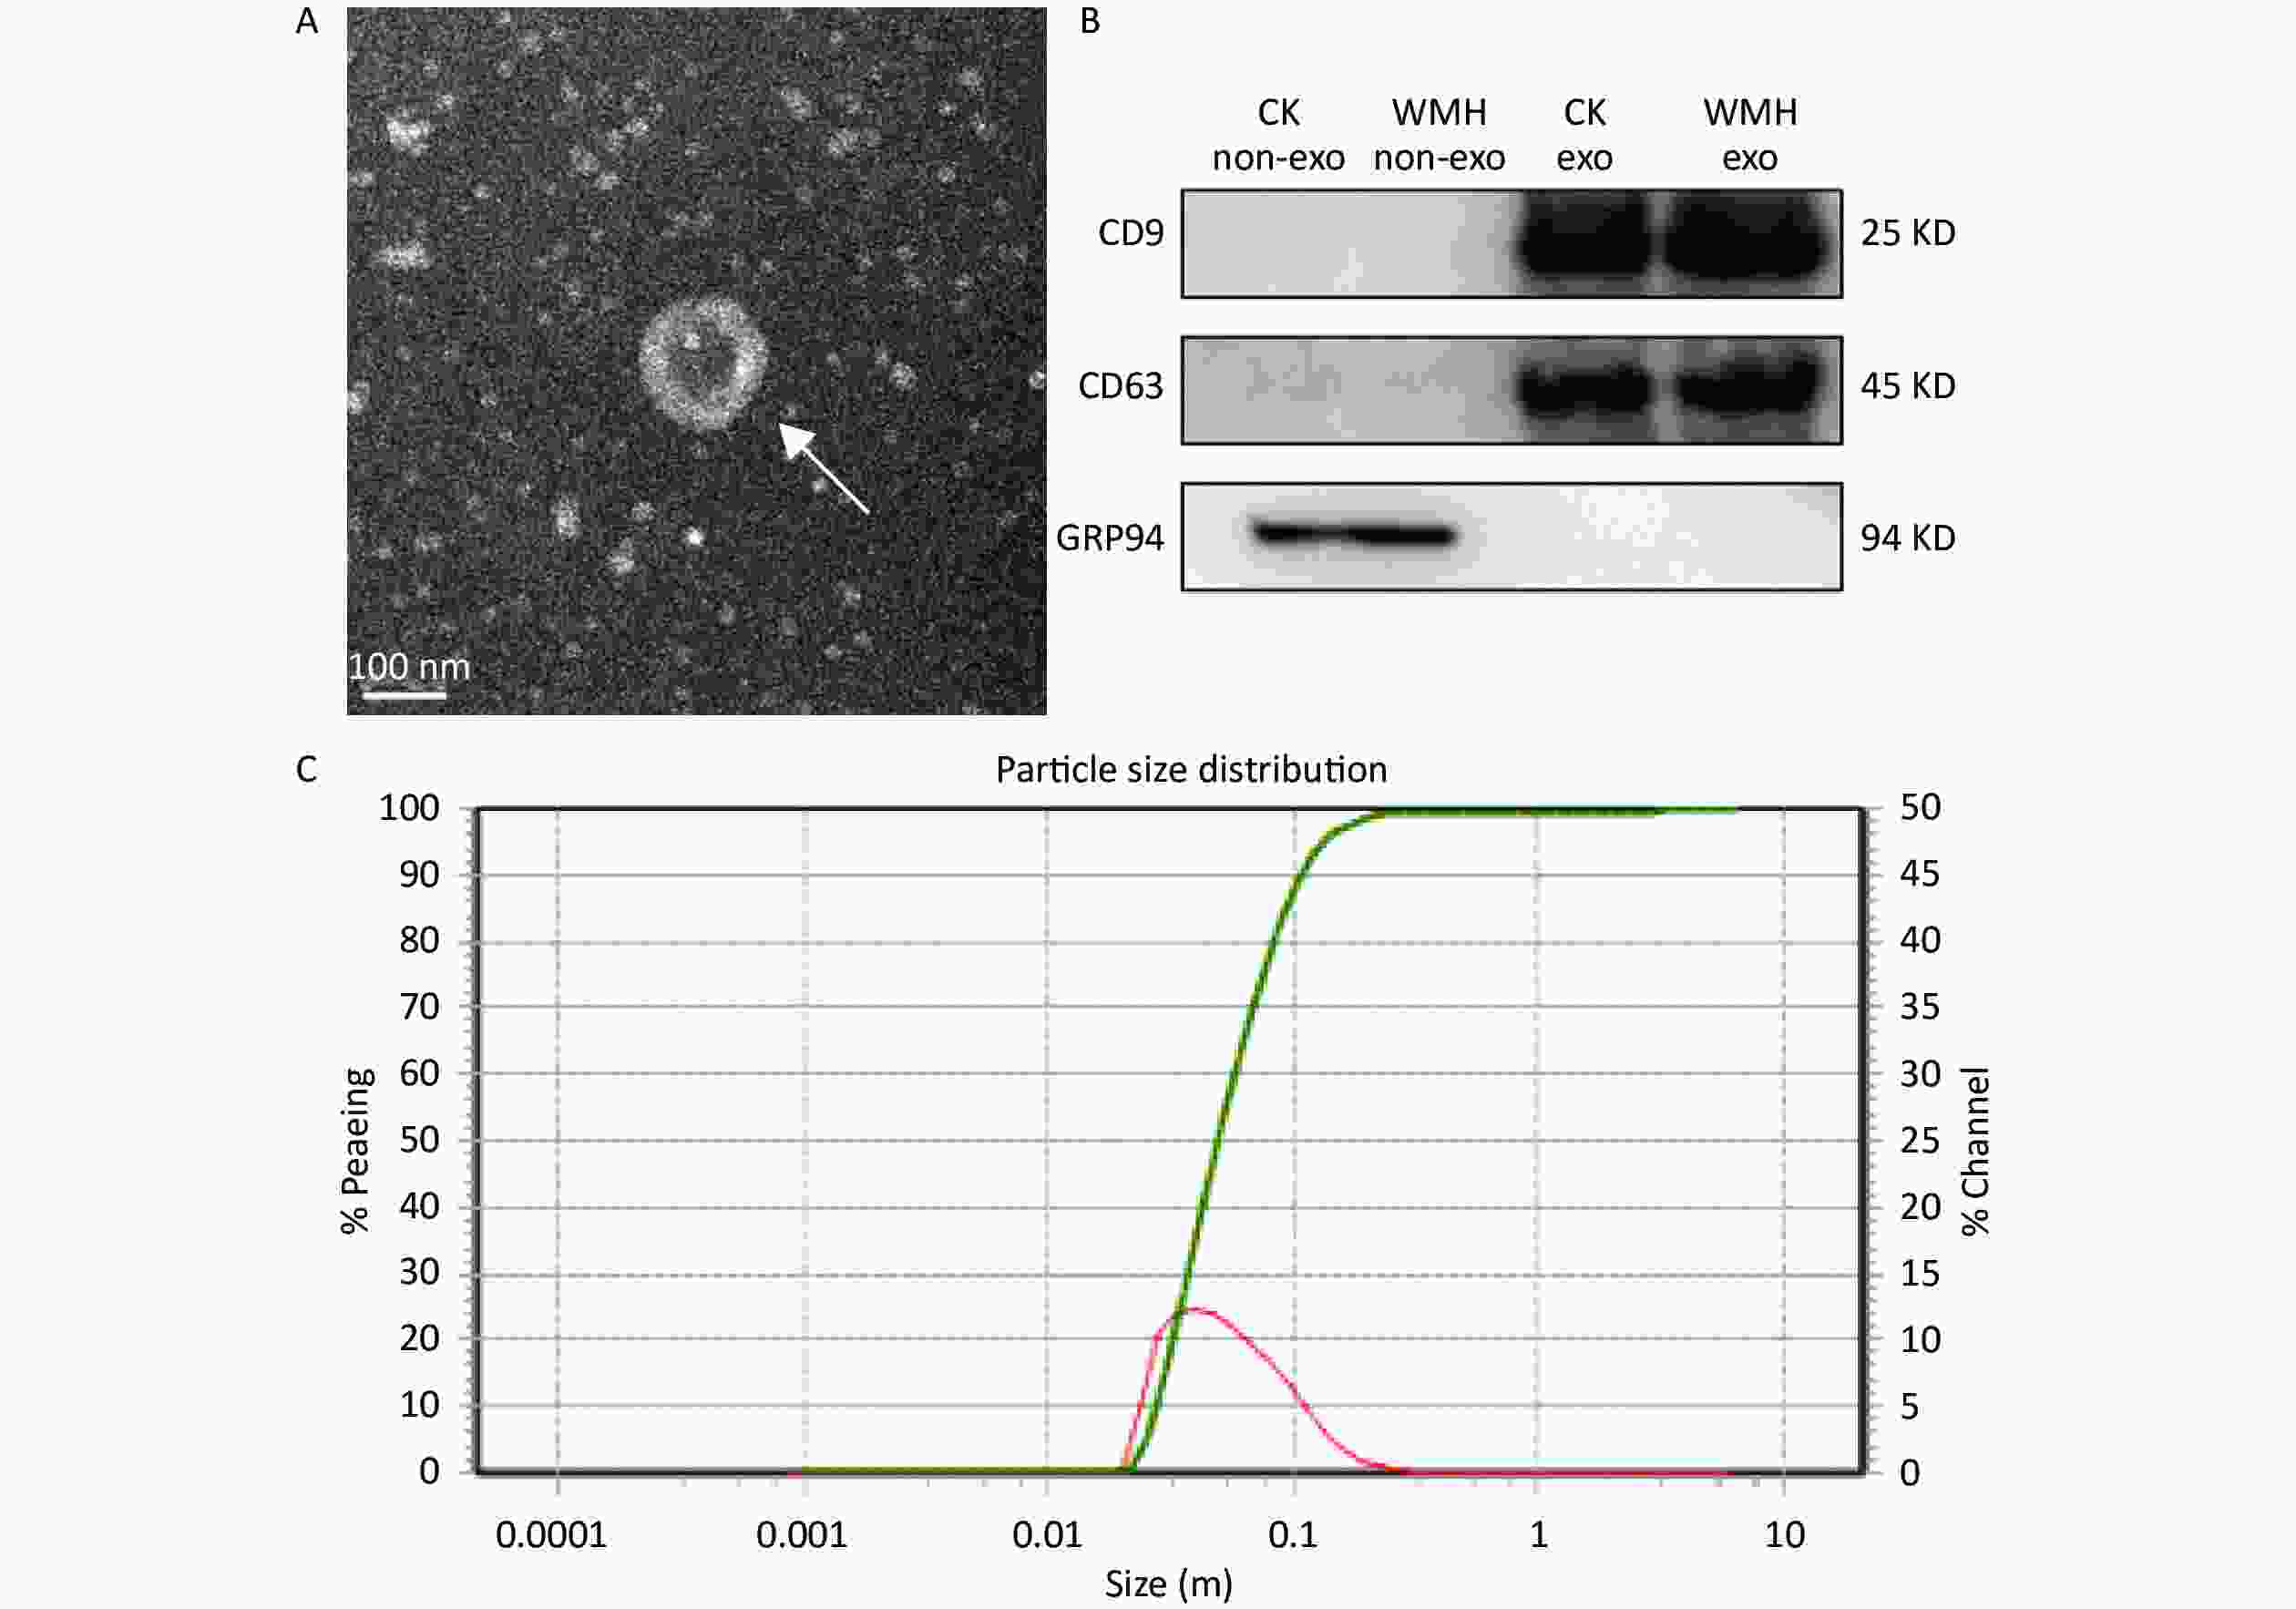
Figure 1. Identification and characterization of exosomes. (A) TEM image shows that the exosomes are cup-shaped vesicles with round membranes. White arrow indicates typical exosomes. Scale bar = 100 nm; (B) Western blot analysis of exosome protein markers (CD9, CD63, GRP94). Column 1: plasma without exosomes of controls; Column 2: plasma without exosomes of WMH; Column 3: control exosomes; Column 4: WMH exosomes; (C) the size of exosomes ranged from 40 to 160 nm, as revealed by NTA. CK, control.
-
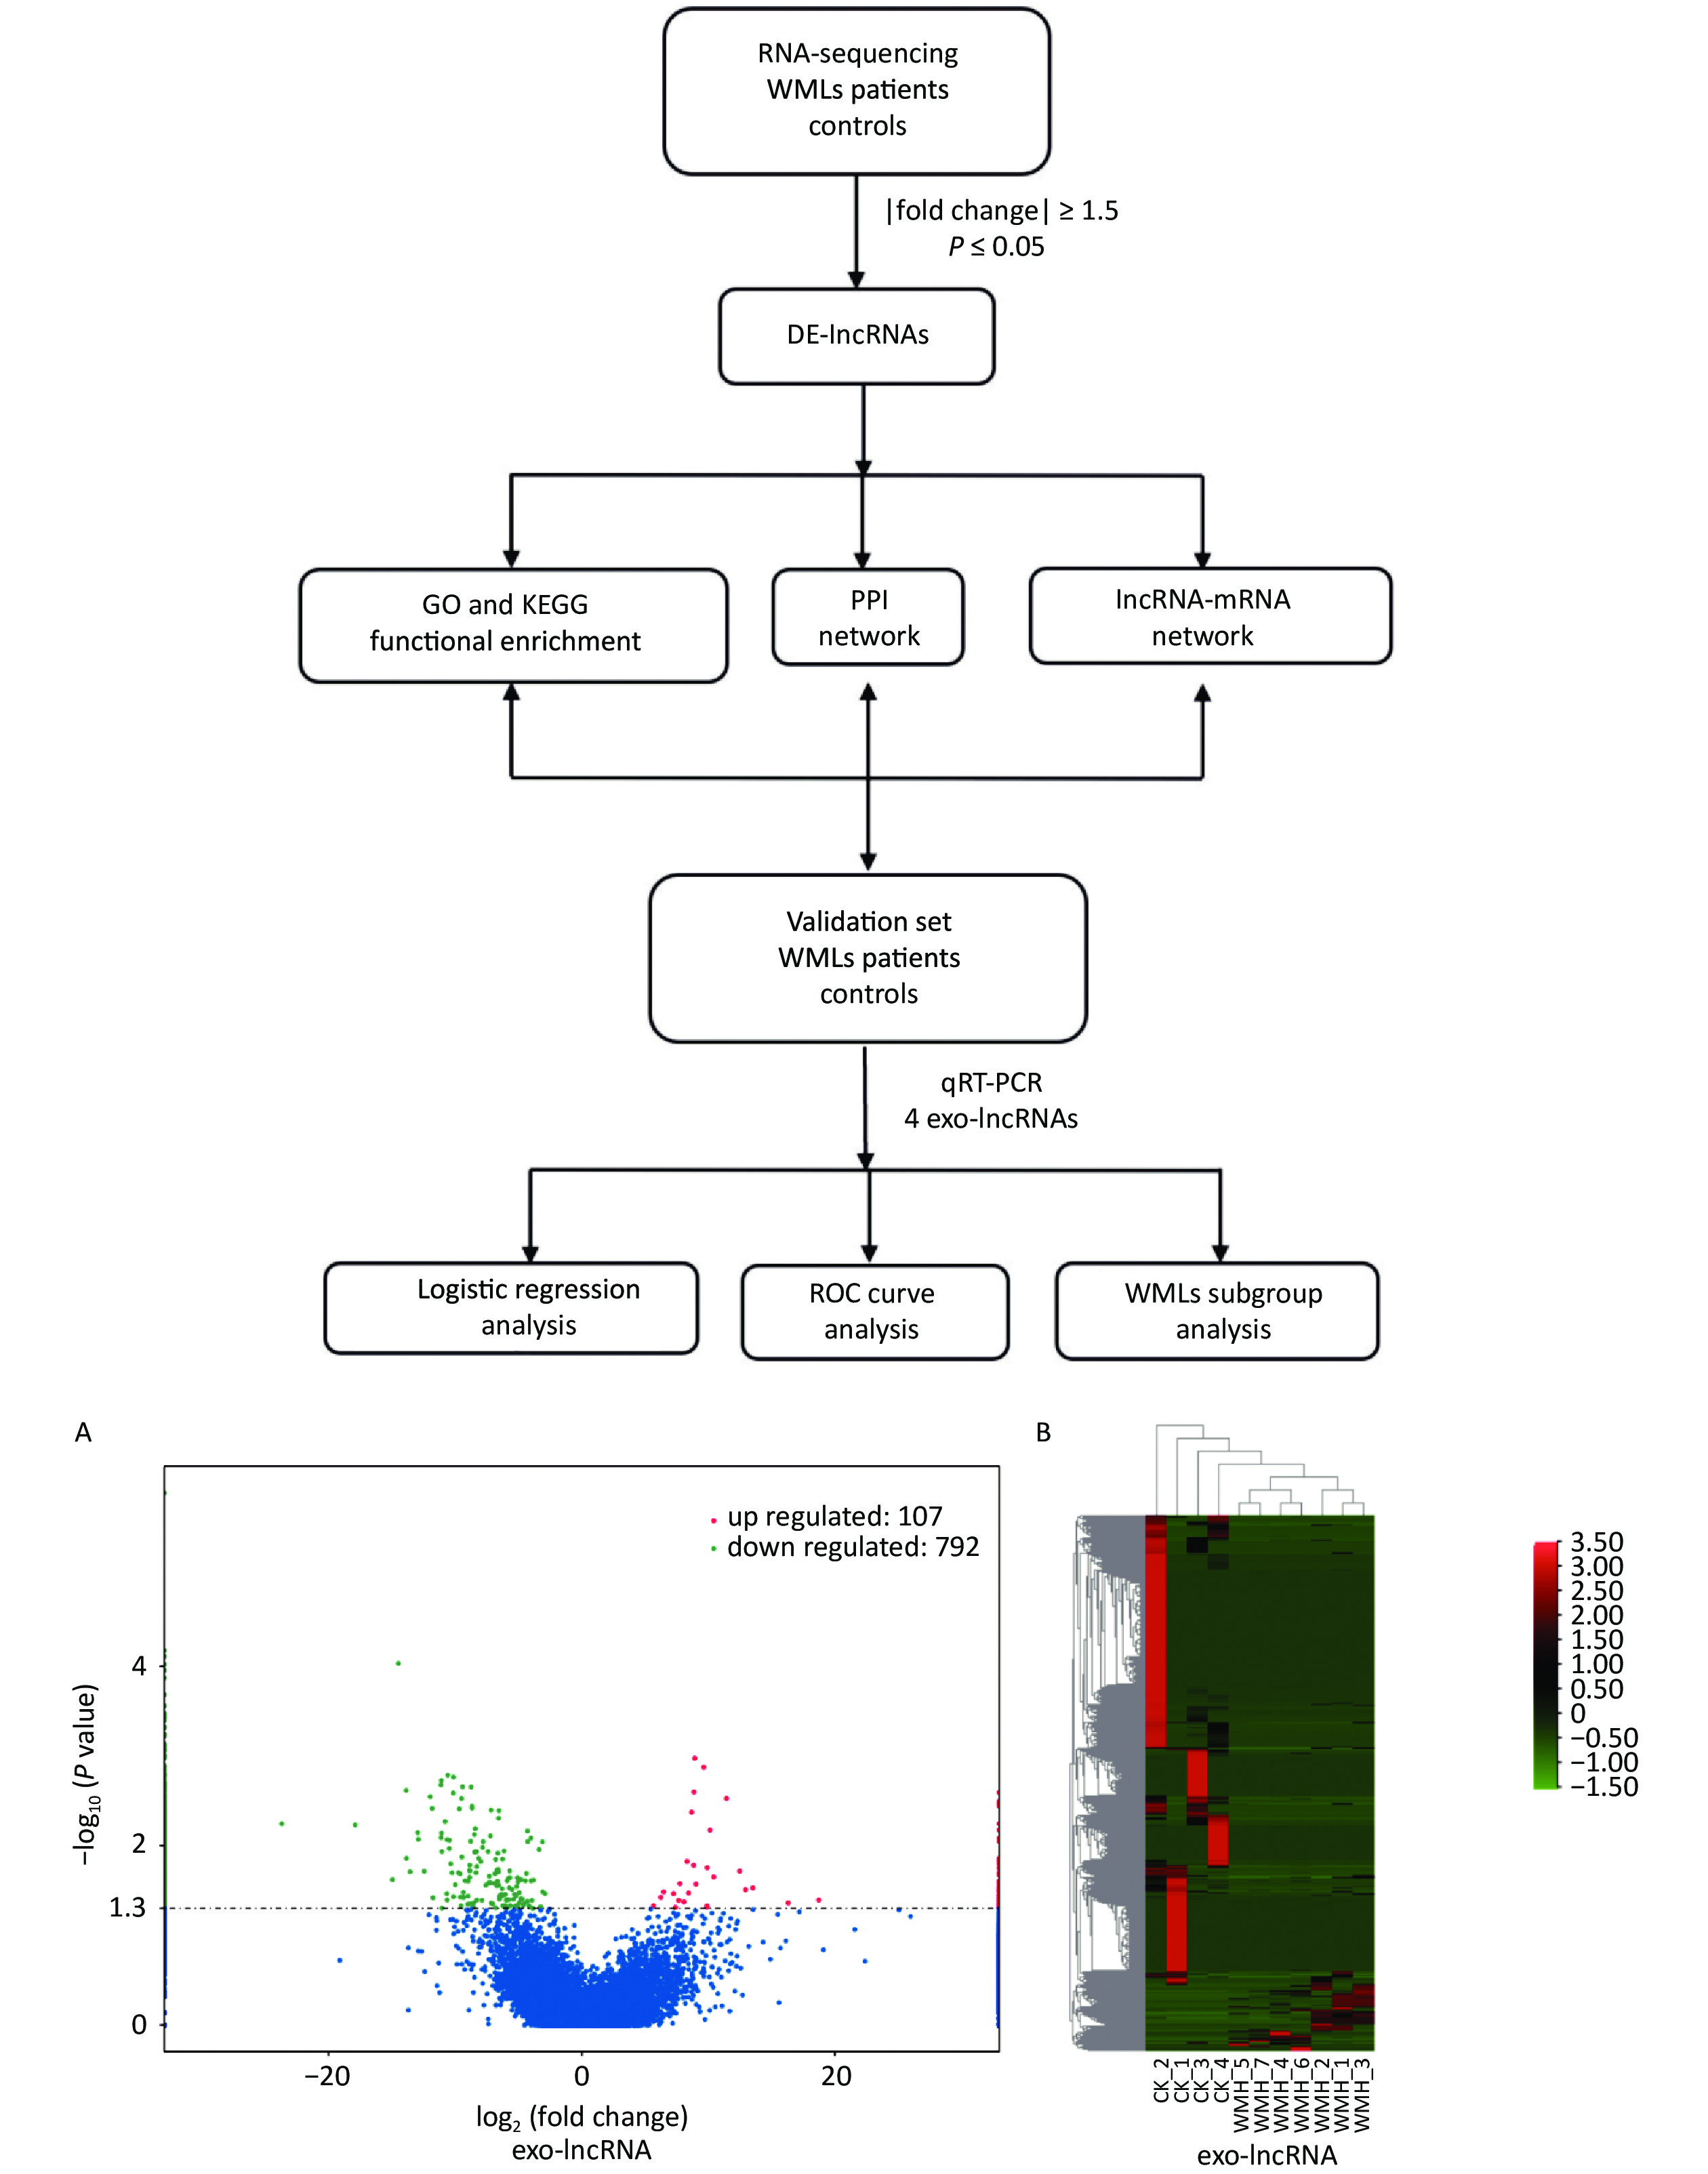
To analyze the expression of exosomal lncRNAs in WMH patients, we screened four controls and seven WMH patients for RNA sequencing. A total of 899 DE exo-lncRNAs were identified between the WMH and control samples, including 107 upregulated and 792 downregulated exo-lncRNAs. The volcano plot and heatmap better display the sequencing results, as shown in Figure 2.

Figure 2. Workflow and differential expression of exo-lncRNAs. (A) Volcano plot of exo-lncRNAs. (B) Heatmap of exo-lncRNA, where red indicates upregulated RNAs and green indicates downregulated RNAs. GO, Gene Ontology; KEGG, Kyoto Encyclopedia of Genes and Genomes; PPI, Protein-protein Interaction; ROC, receiver operating characteristic; CK, control.
-
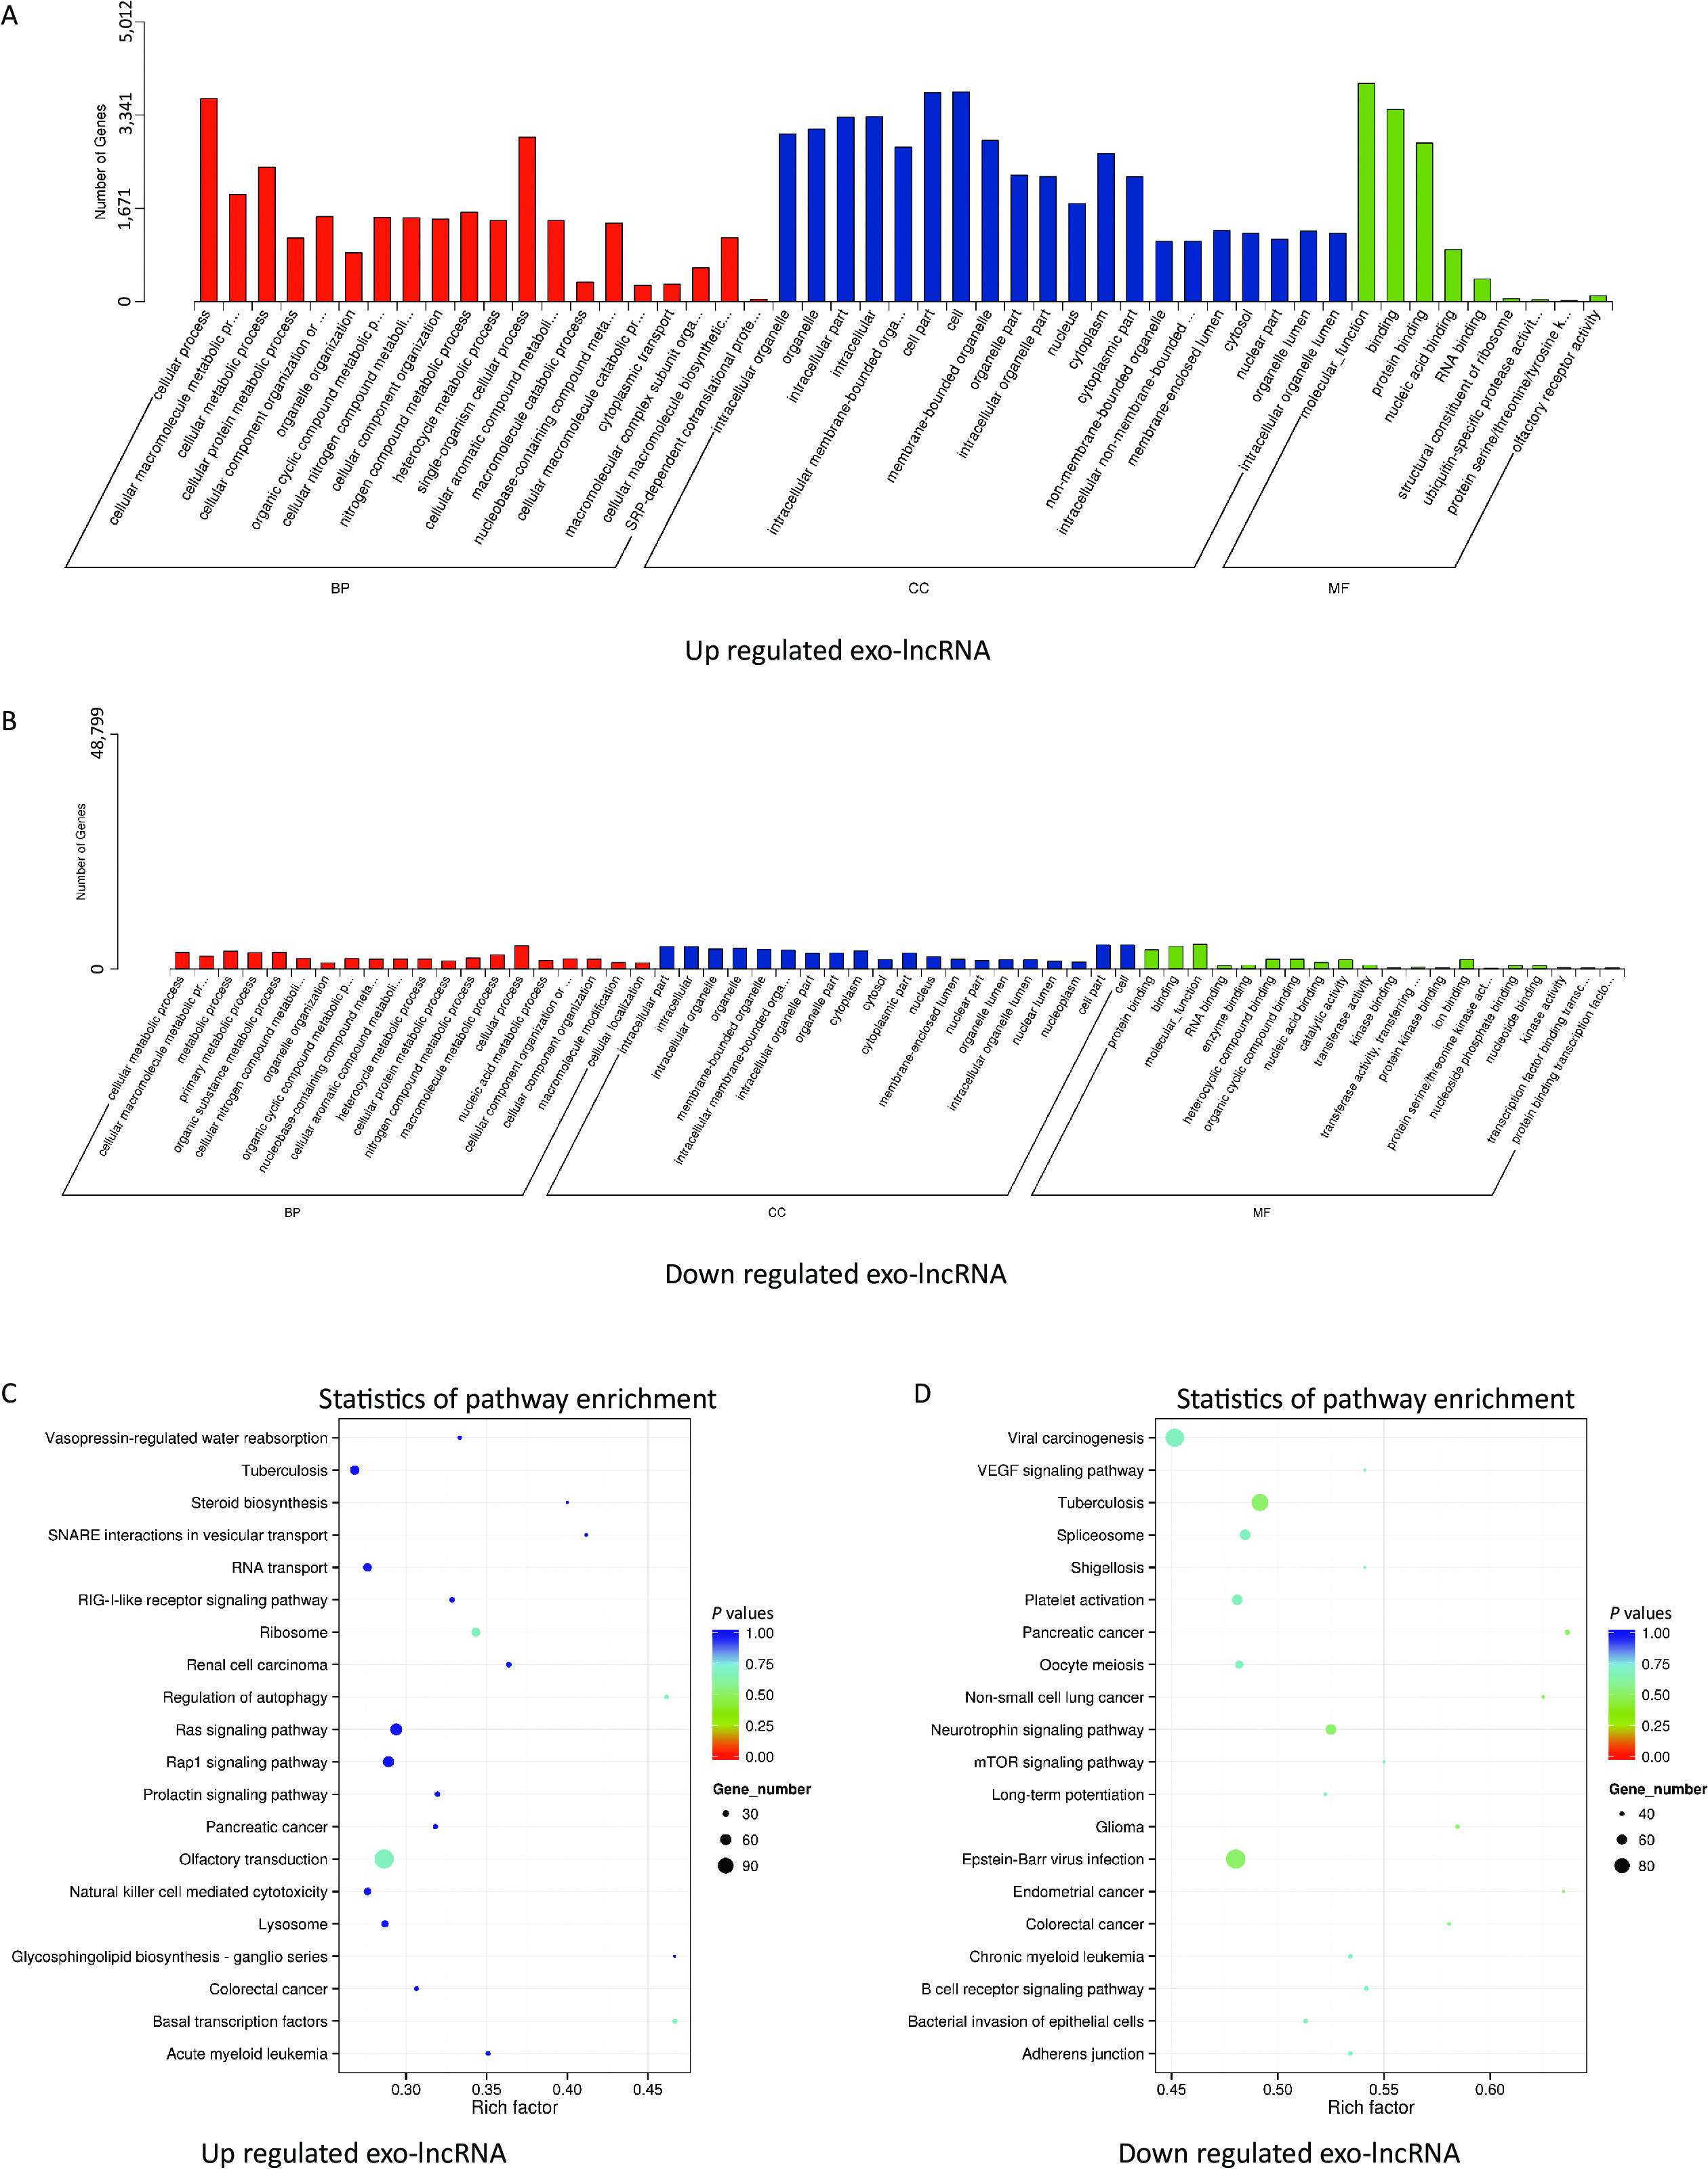
The potential and important biological functions of DE exo-lncRNAs were predicted using GO and KEGG enrichment analyses. The GO analysis was characterized by biological process (BP), cellular component (CC), and molecular function (MF) terms, which included, among others, ubiquitin-specific protease activity (GO: 0004843) and transferase activity (GO: 0016772) (Figure 3A–B). The KEGG analysis showed that the upregulated exo-lncRNAs were primarily related to autophagy regulation (hsa04140) and ribosomes (hsa03010) (Figure 3C), whereas downregulated exo-lncRNAs were related mainly to the neurotrophin signaling pathway (hsa04722) (Figure 3D). These functional analyses suggest that exosomal lncRNAs are involved in regulating the WMH process.
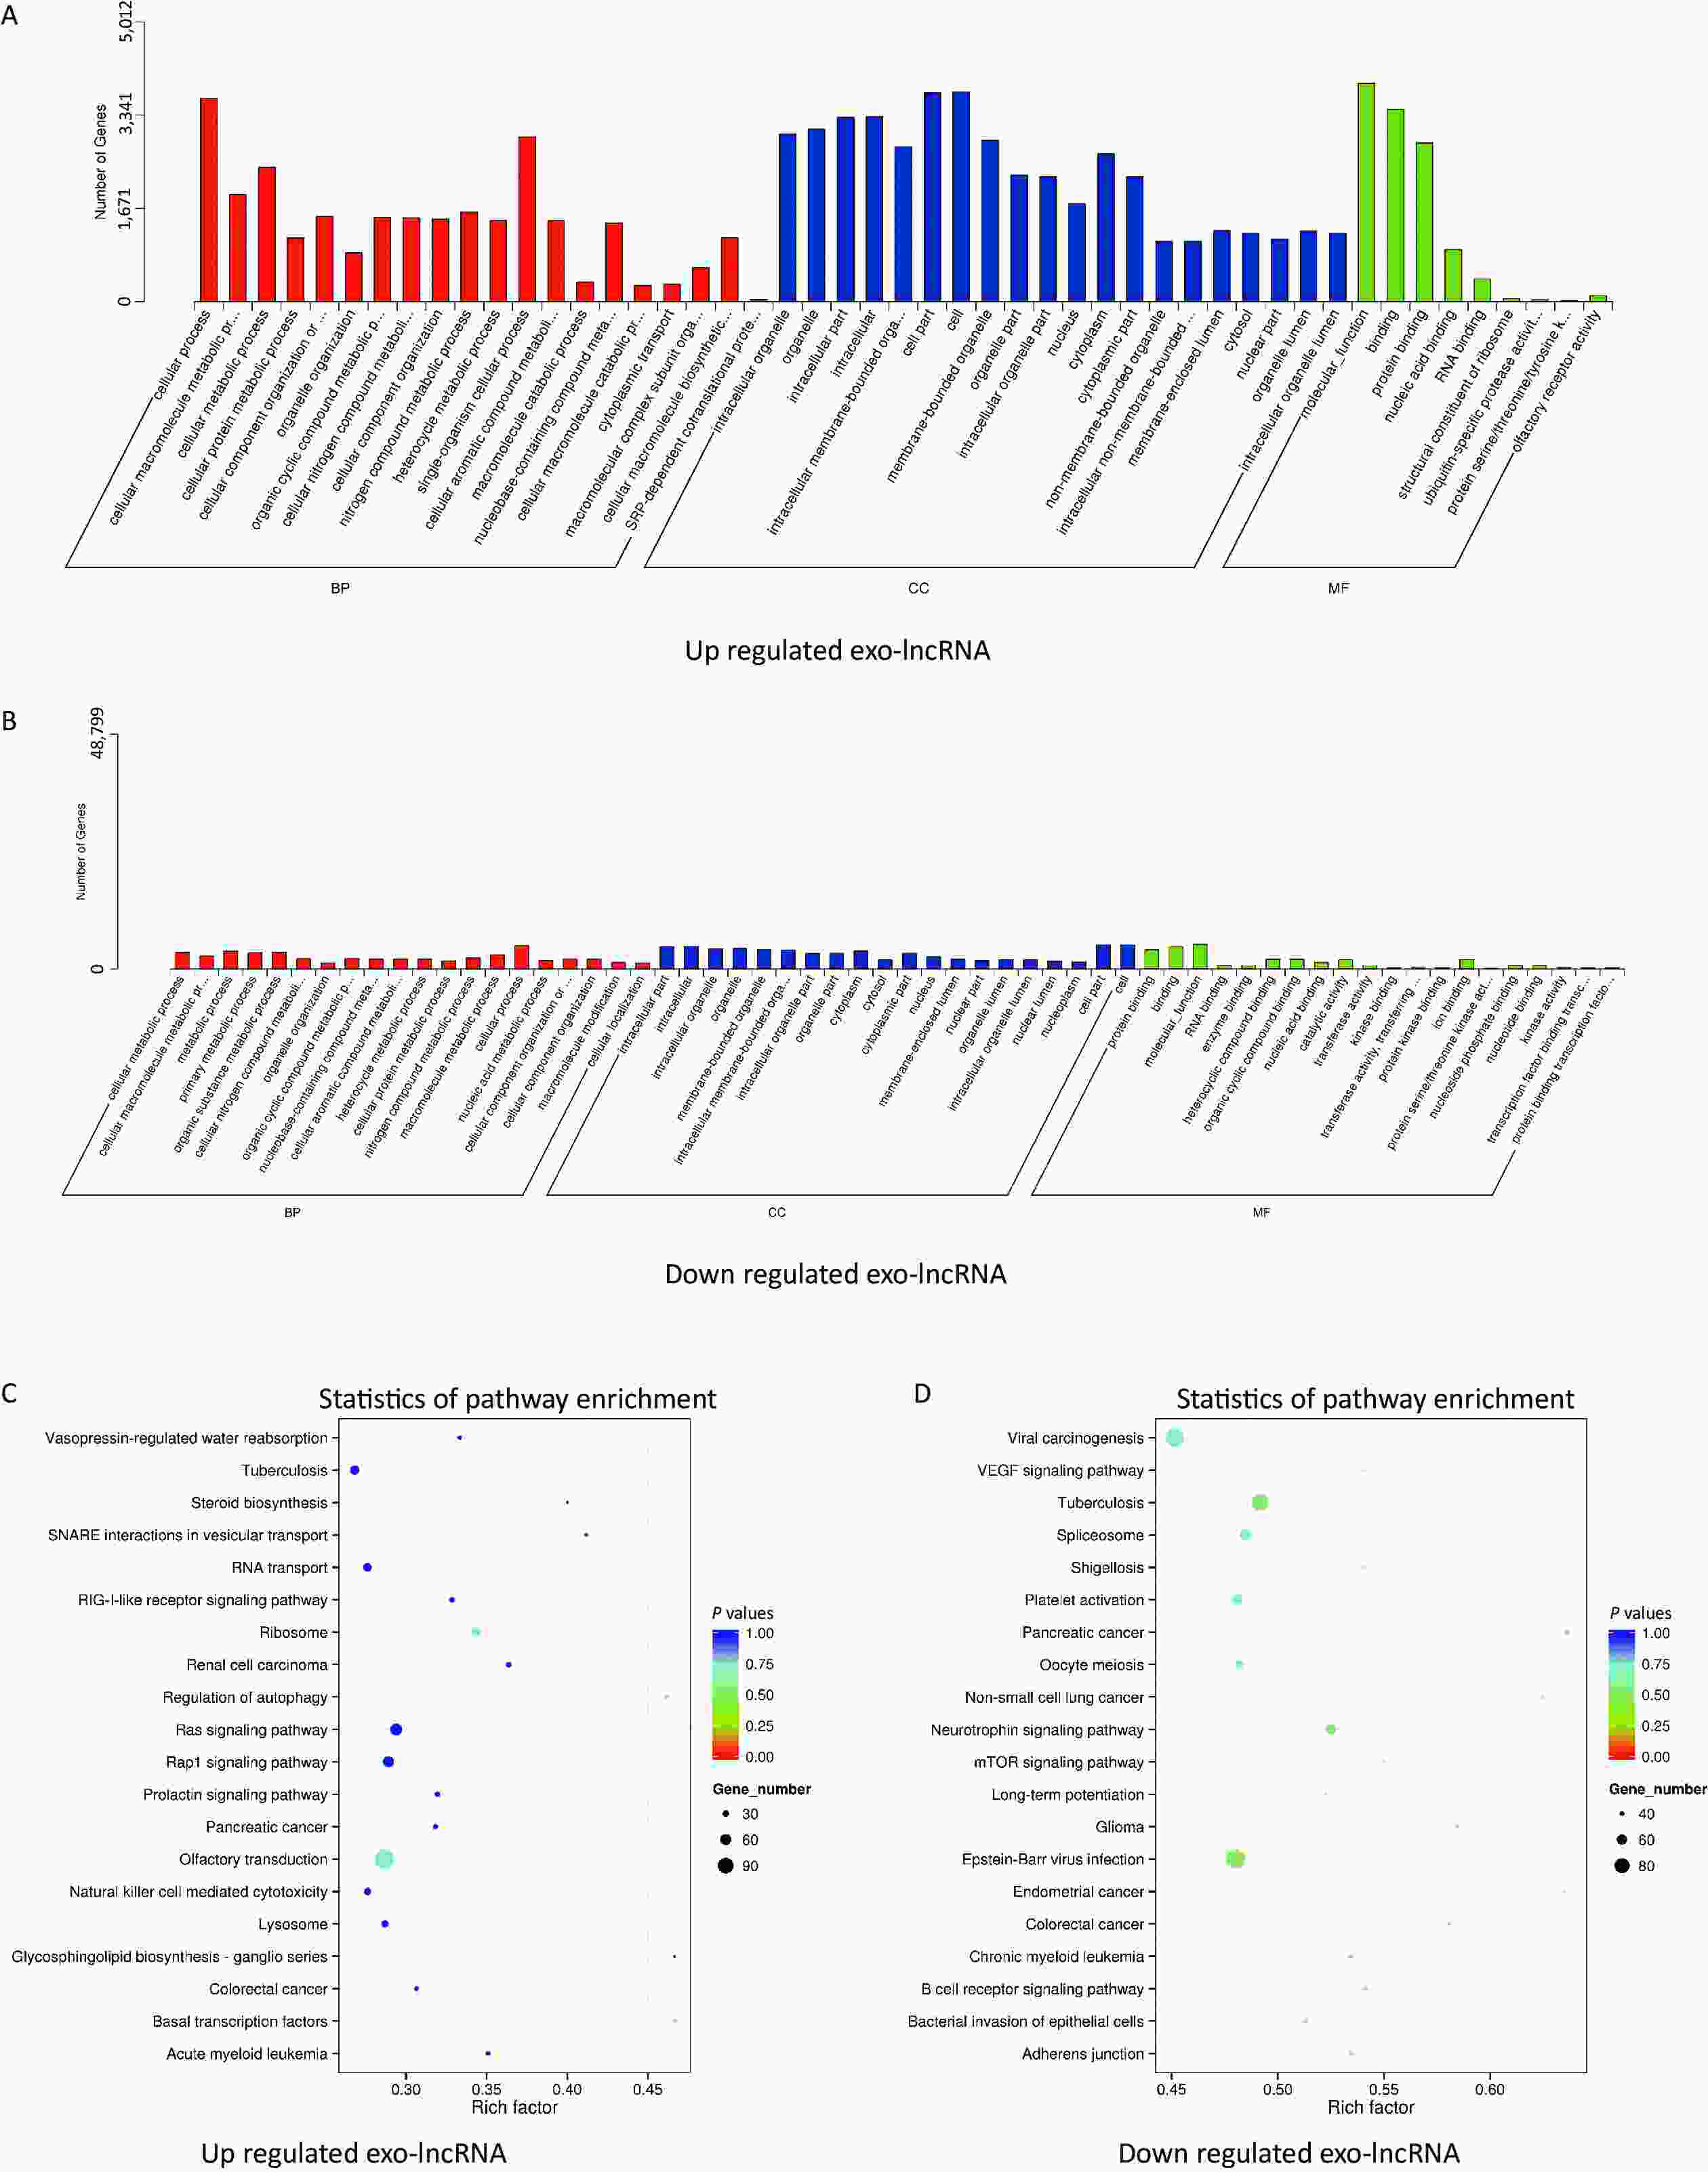
Figure 3. Functional enrichment of differentially expressed exo-lncRNAs. (A, B) Pathways of GO analysis, including biological processes, cell components, and molecular functions. (C, D) Pathways by KEGG analysis shown on a bubble graph. The range of P values corresponds to the dot color, and the dot size indicates the number of genes.
-
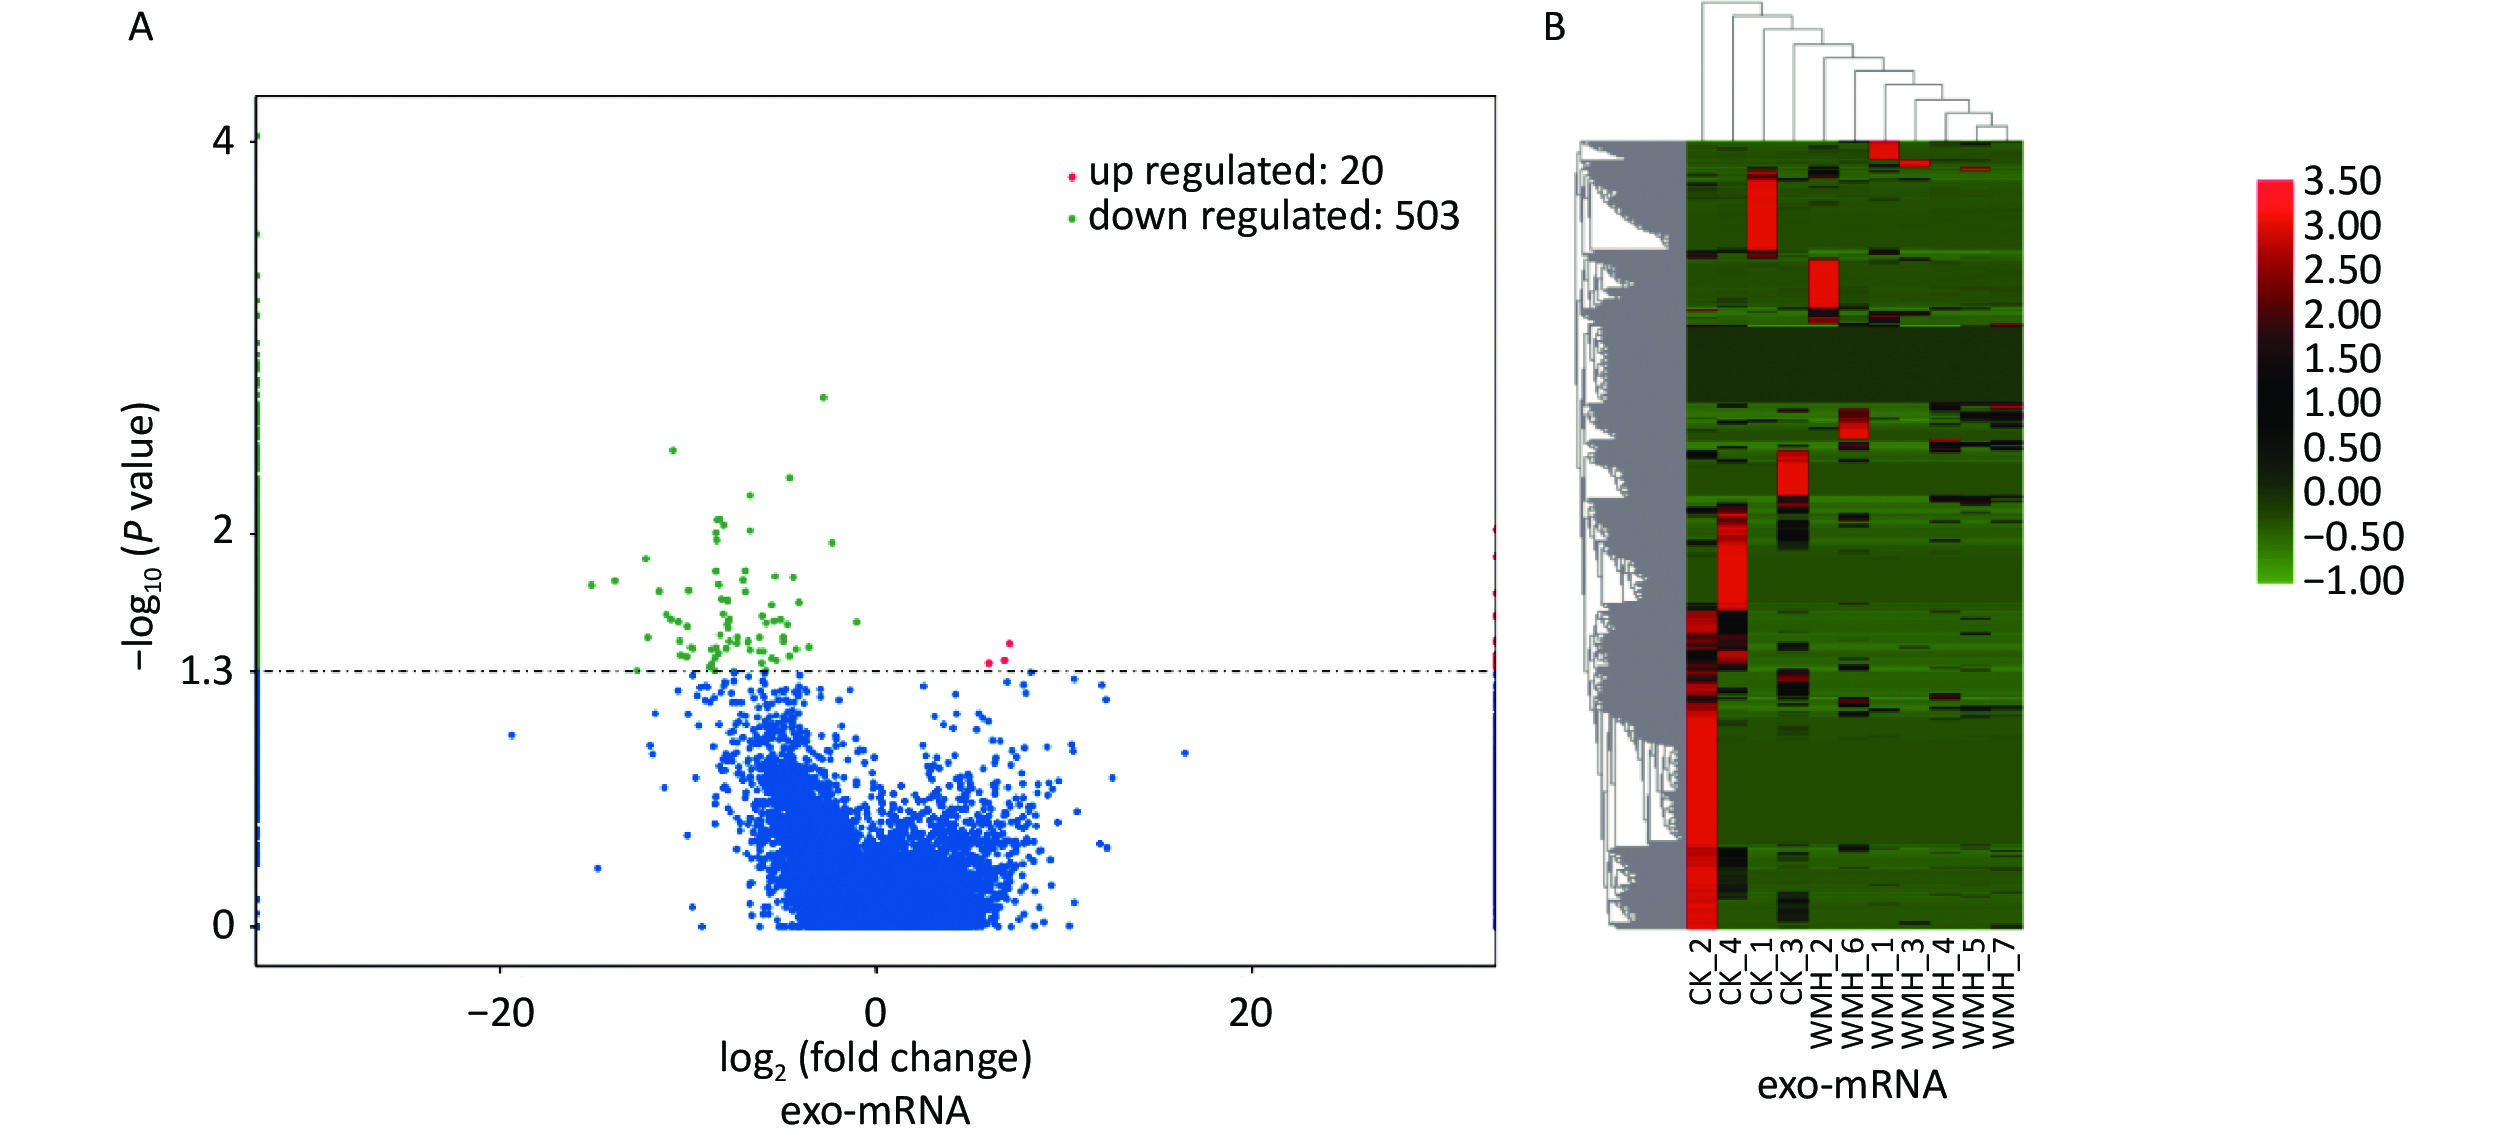
We further studied the biological functions of exosomal lncRNAs, such as the target genes of lncRNAs. We sequenced exosomal mRNA to analyze the differential expression (DE) of exo-mRNA between the control and WMH groups. Finally, 523 DE exo-mRNA transcripts were detected in this study, among which 20 were upregulated, and 503 were downregulated. The volcano plot and heatmap are shown in Figure 4. Data analysis was performed using the STRING database to generate a PPI network for DE mRNAs. The network of 397 nodes and 1,532 edges was analyzed and visualized using Cytoscape (Figure 5A). The Cytoscape plugin MCODE was used primarily to identify two modules with a score > 10 (Figure 5B–C).
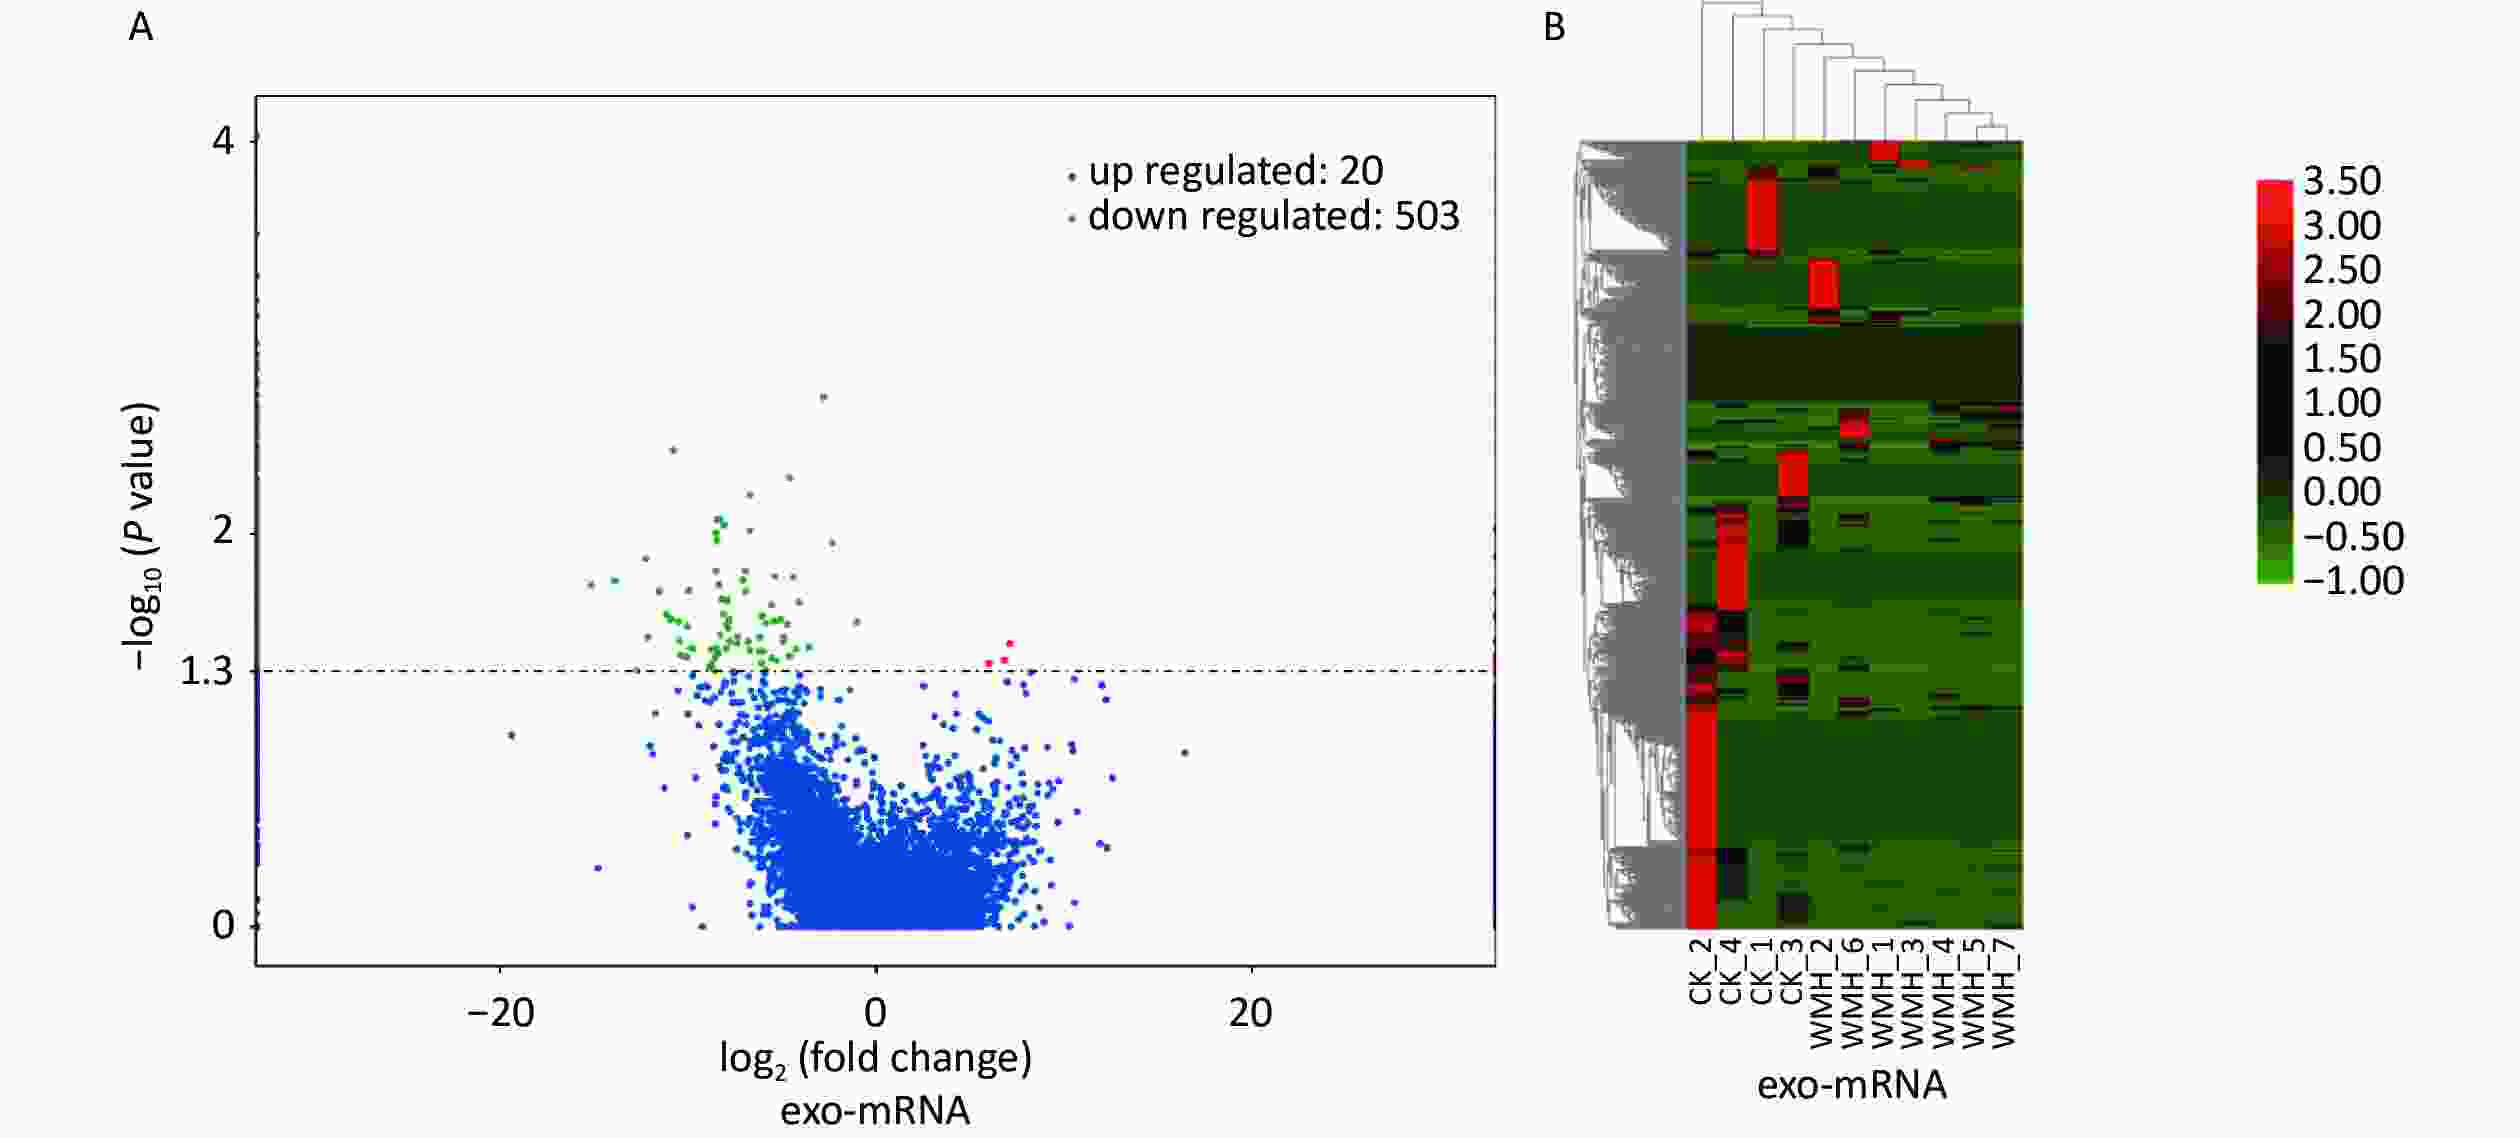
Figure 4. Expression profile of exo-mRNAs. (A) Volcano plot of exo-mRNAs. (B) Heatmap of exo-mRNAs. Red indicates upregulated RNAs, and green indicates downregulated RNAs. CK, control.
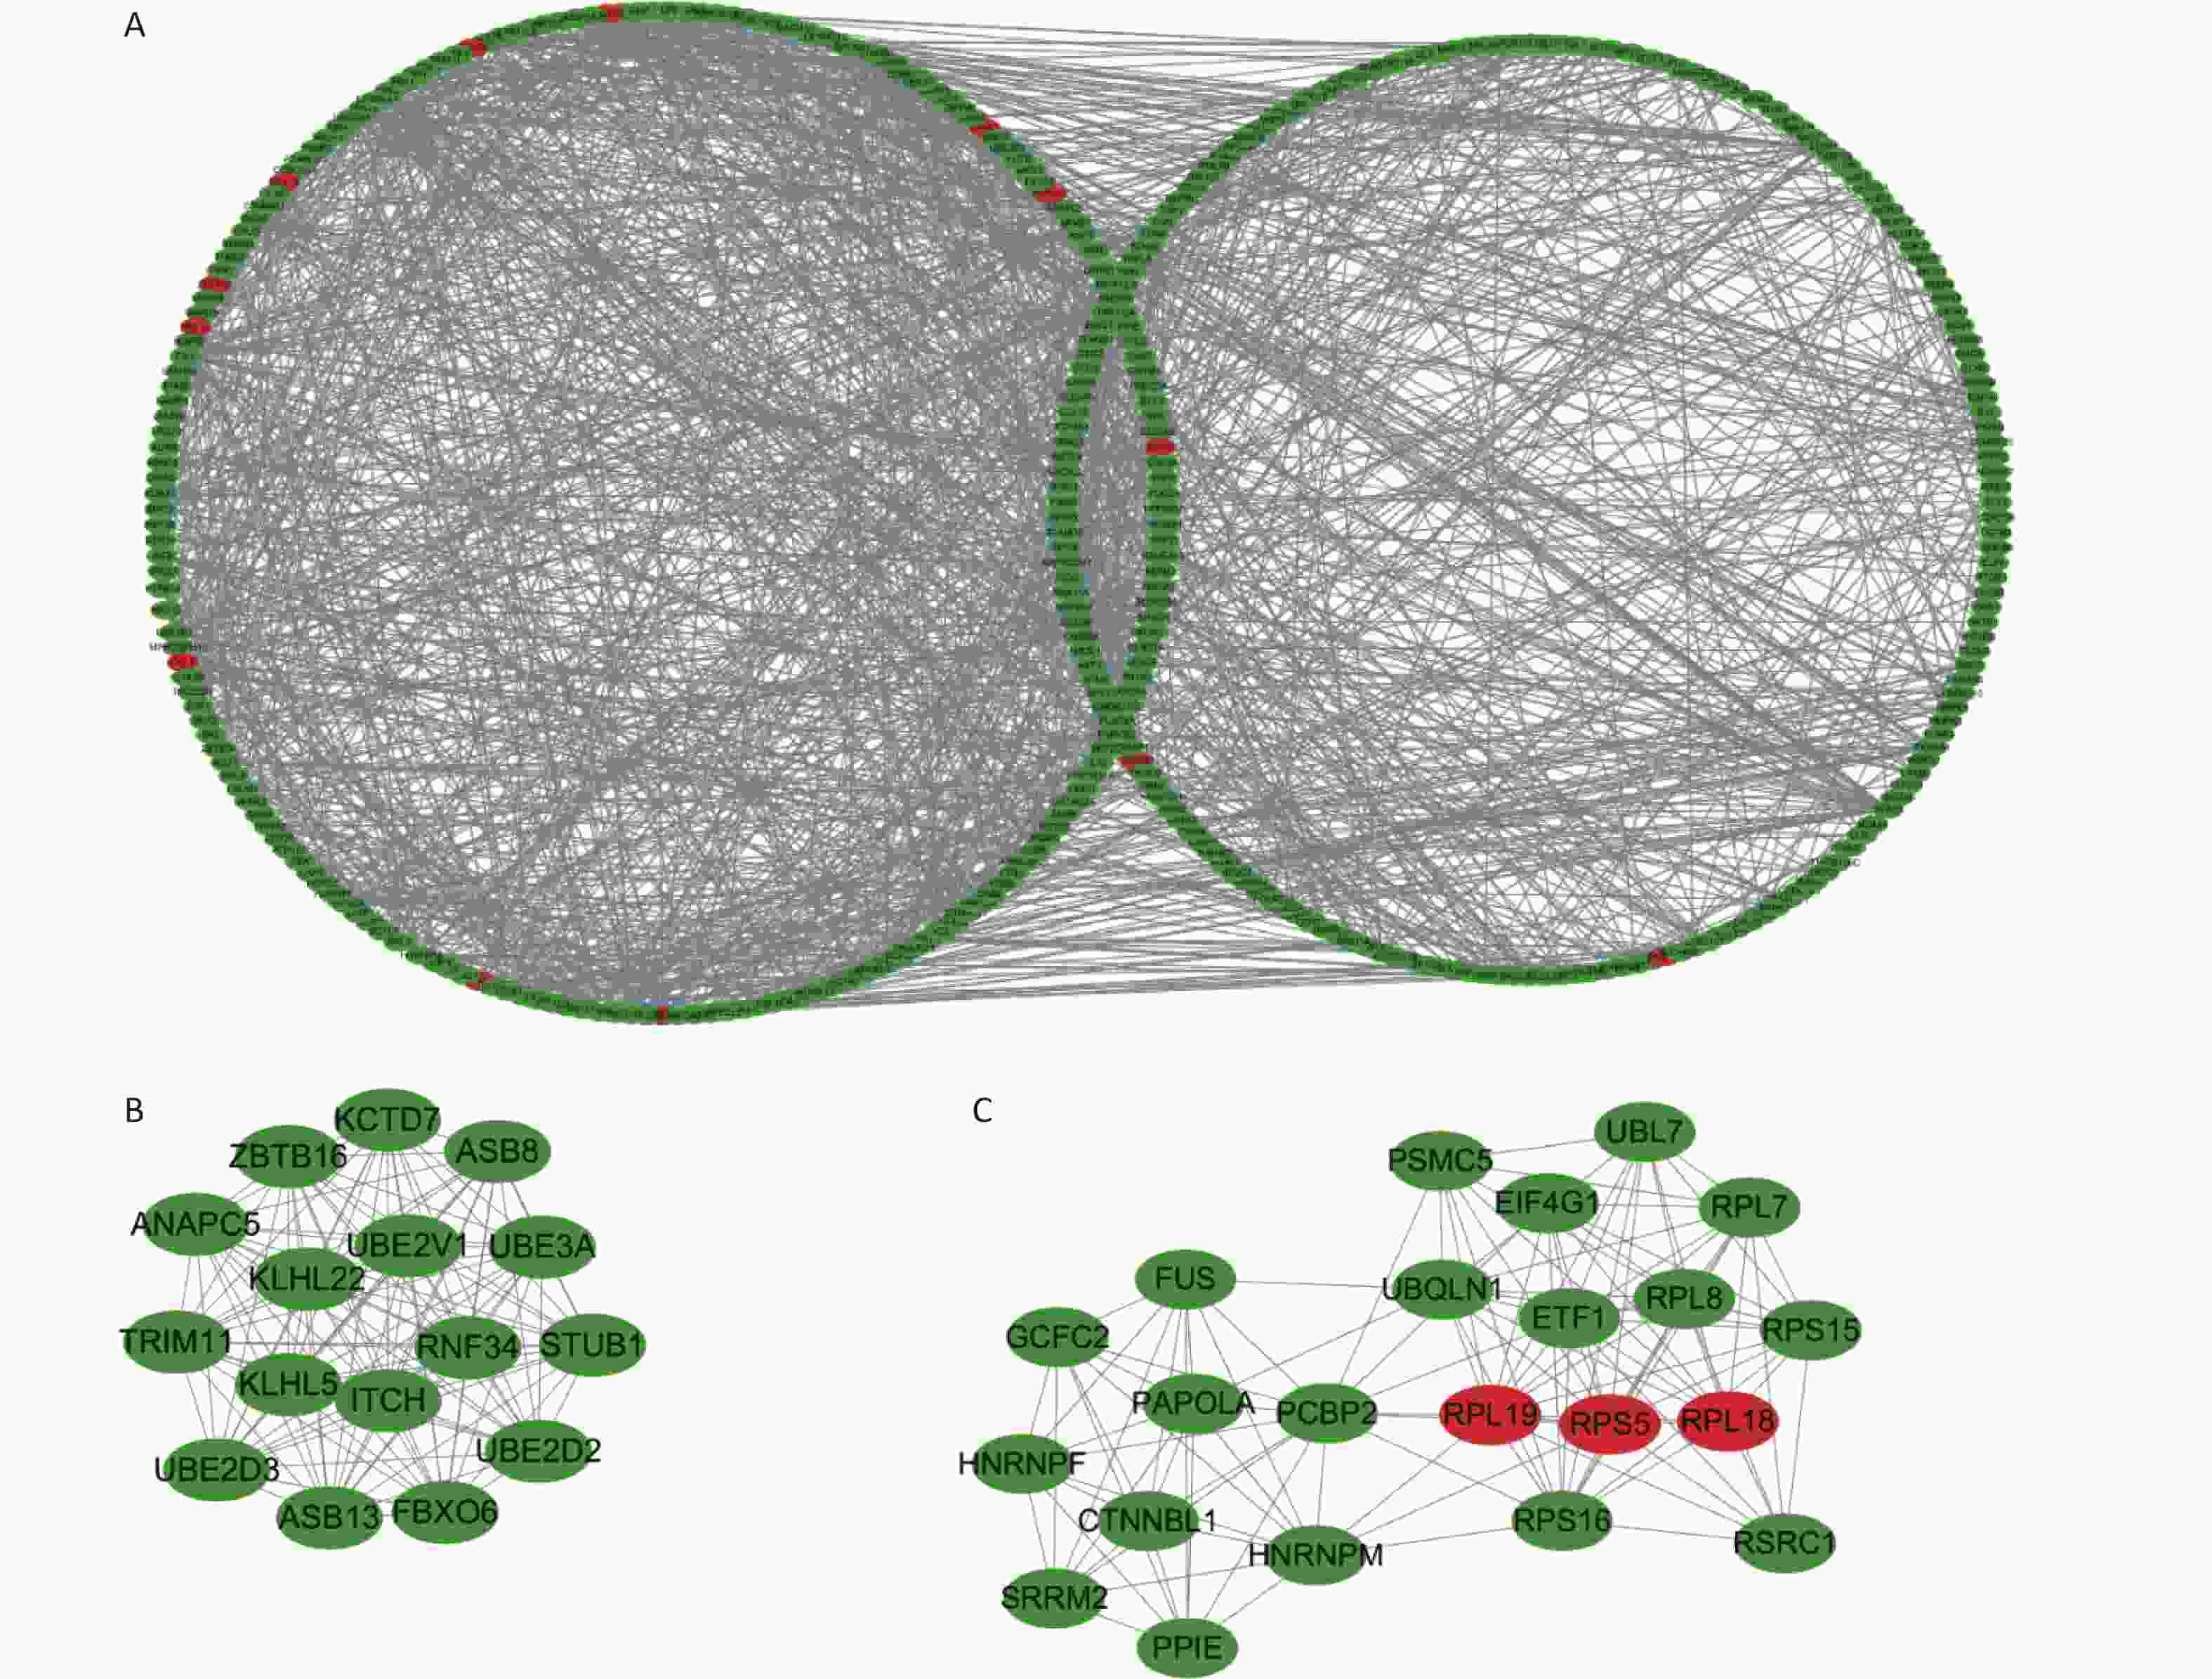
Figure 5. Protein-protein interaction networks and submodules of DE mRNAs. (A) PPI network of DE mRNAs. (B) Molecular 1 (score = 16) contains 16 nodes and 120 edges; (C) Molecular 2 (score = 11.048) contains 22 nodes and 116 edges. Upregulated RNAs are denoted in red, and downregulated RNAs are denoted in green.
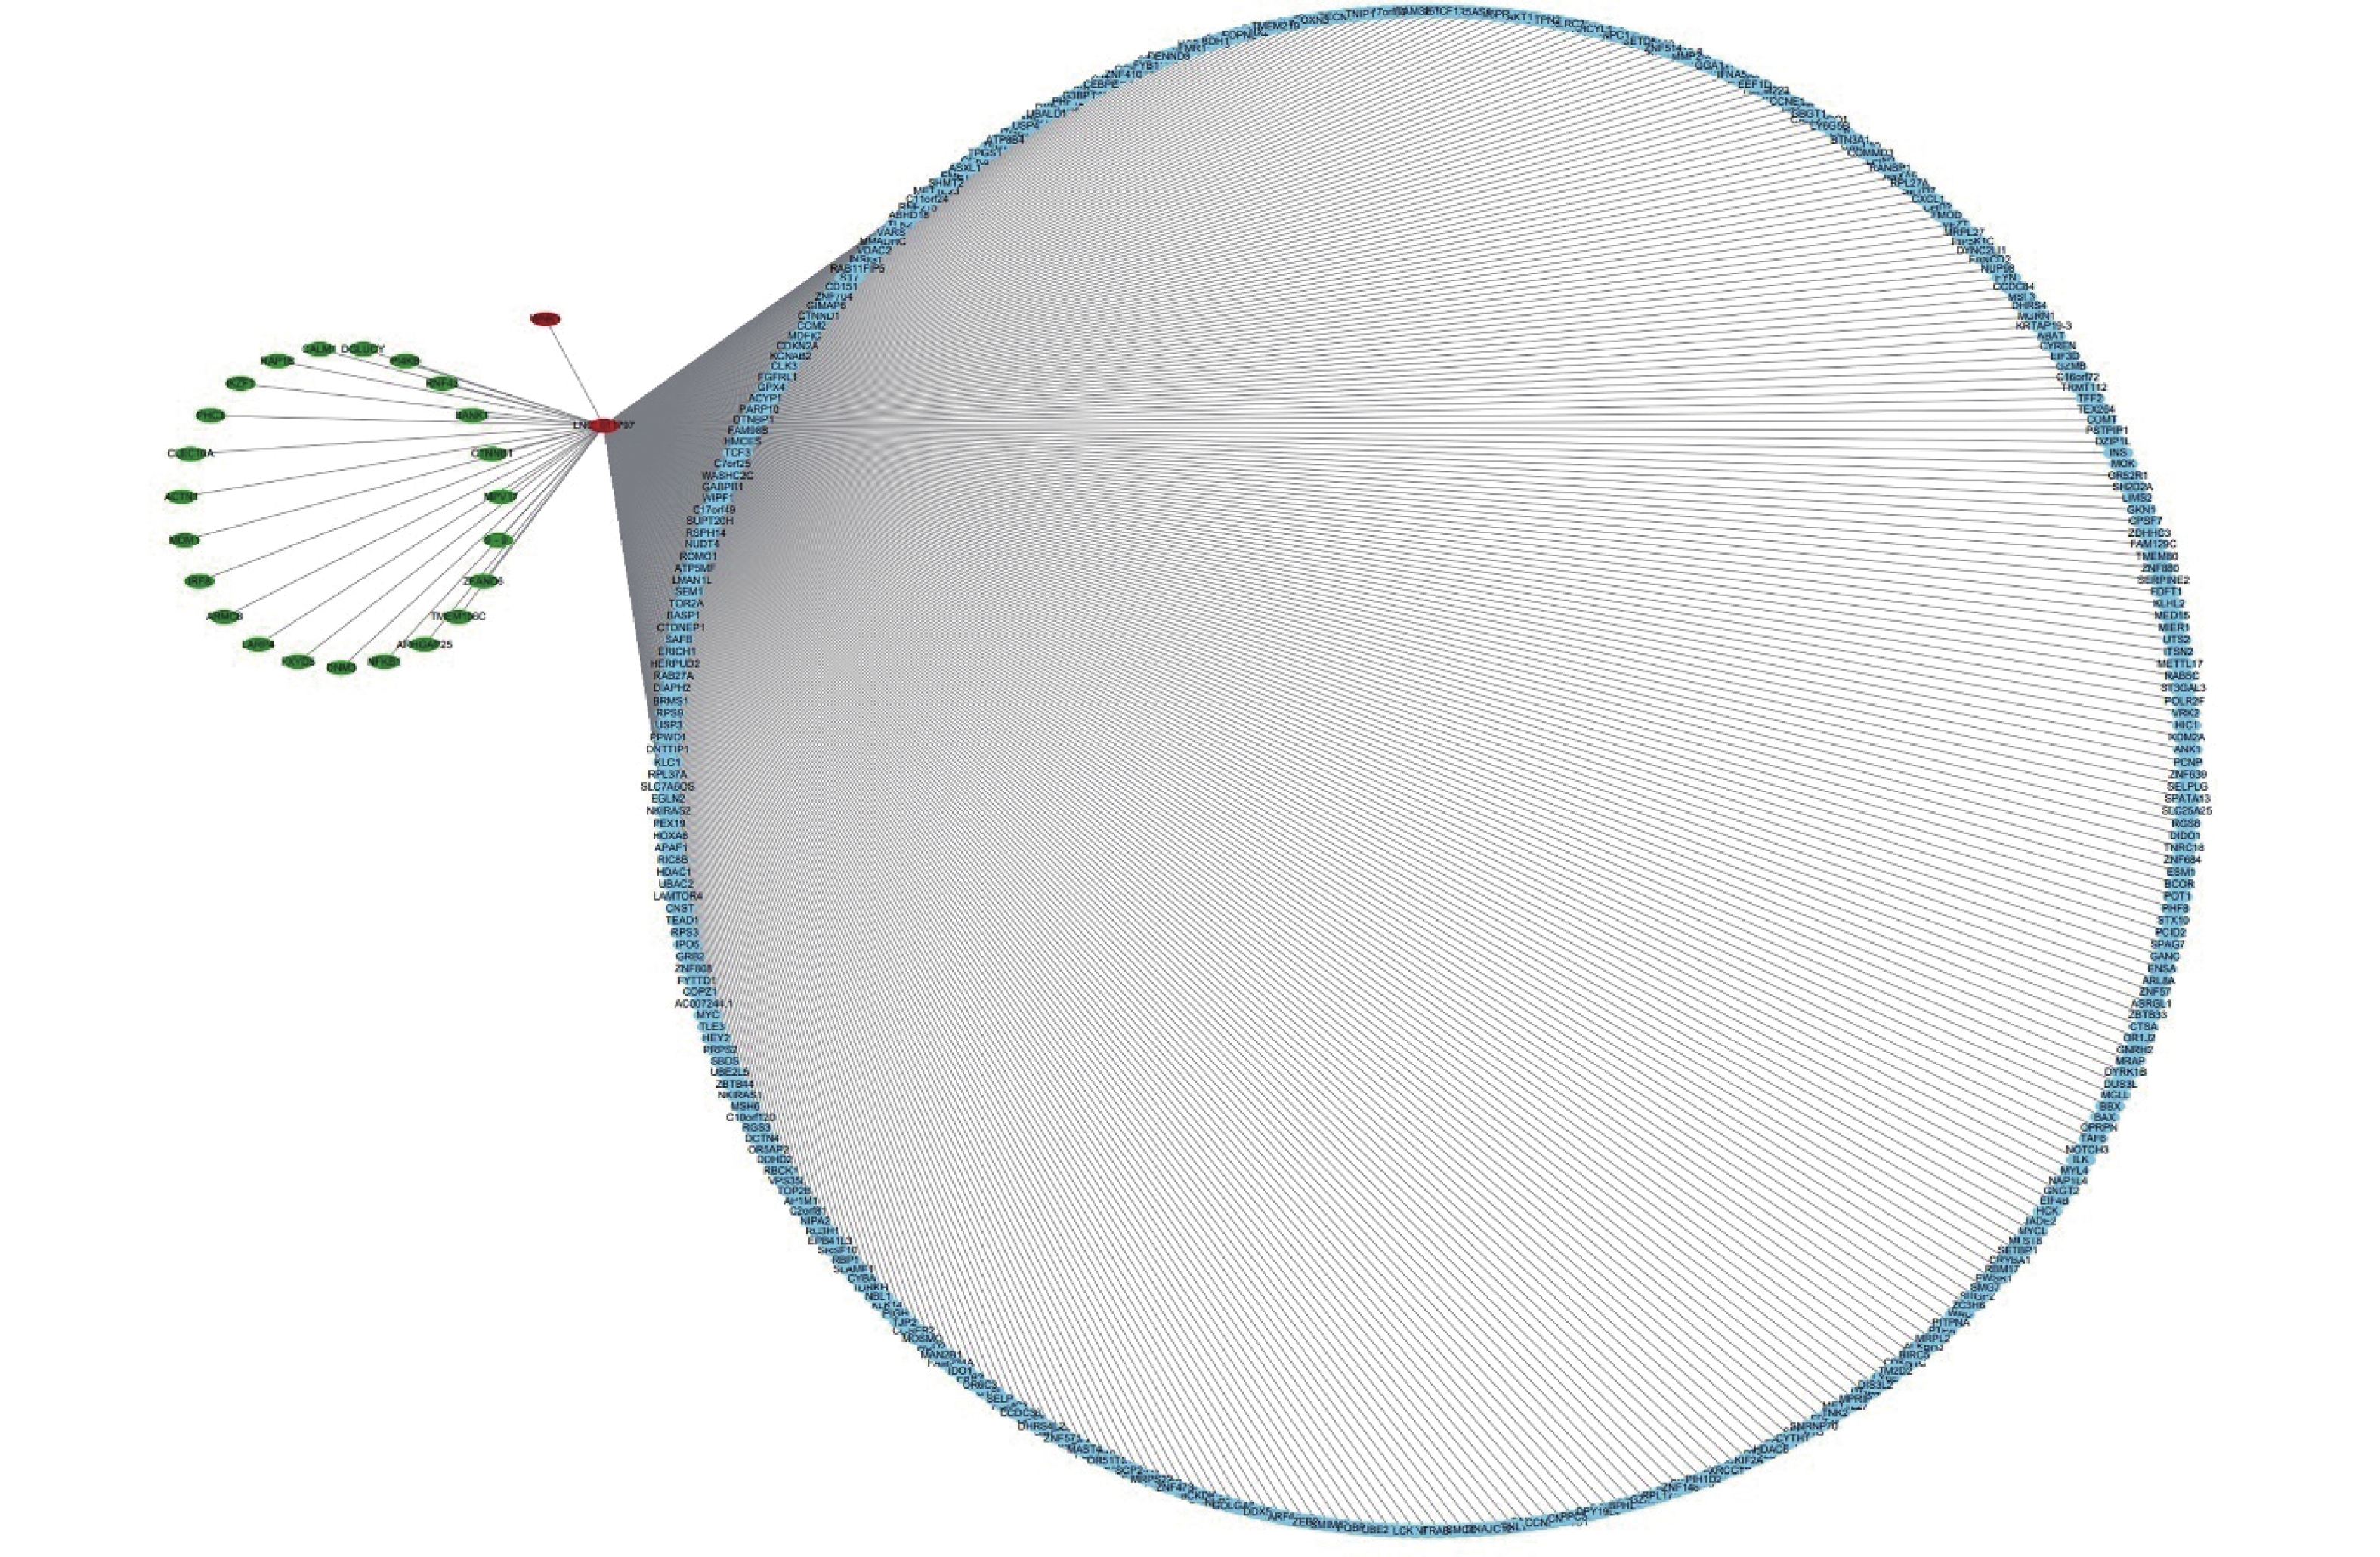
To further analyze the possible target genes of exosomal lncRNAs, we constructed coexpression lncRNA-mRNA networks. We selected four DE exo-lncRNAs (exo-lnc_011797, exo-lnc_011776, exo-lnc_004326, and exo-lnc_013222) based primarily on the DE and functional enrichment analysis of these RNAs. The coexpression lncRNA-mRNA networks showed that the upregulated exo-lncRNAs (exo-lnc_011797, exo-lnc_004326) were correlated with the upregulated mRNAs (WNK1, RPL18, USP45, UBE21, LCTL, PTPN13) (Supplementary Figures S2–S5, available in www.besjournal.com). As is well known, lncRNAs can indirectly upregulate target gene expressions by weakening the inhibition of target genes by miRNAs. Therefore, exo-lnc_011797 and exo-lnc_004326 may affect the occurrence or development of WMH by regulating the expression of with-no-lysine (K) 1 (WNK1), (ribosomal protein L18) RPL18, (ubiquitin specific processing protease 45) USP45, (ubiquitin-conjugating enzyme E2I) UBE21, (Lactase-like protein) LCTL, and Recombinant Protein Tyrosine Phosphatase, Non-Receptor Type 13 (PTPN13).
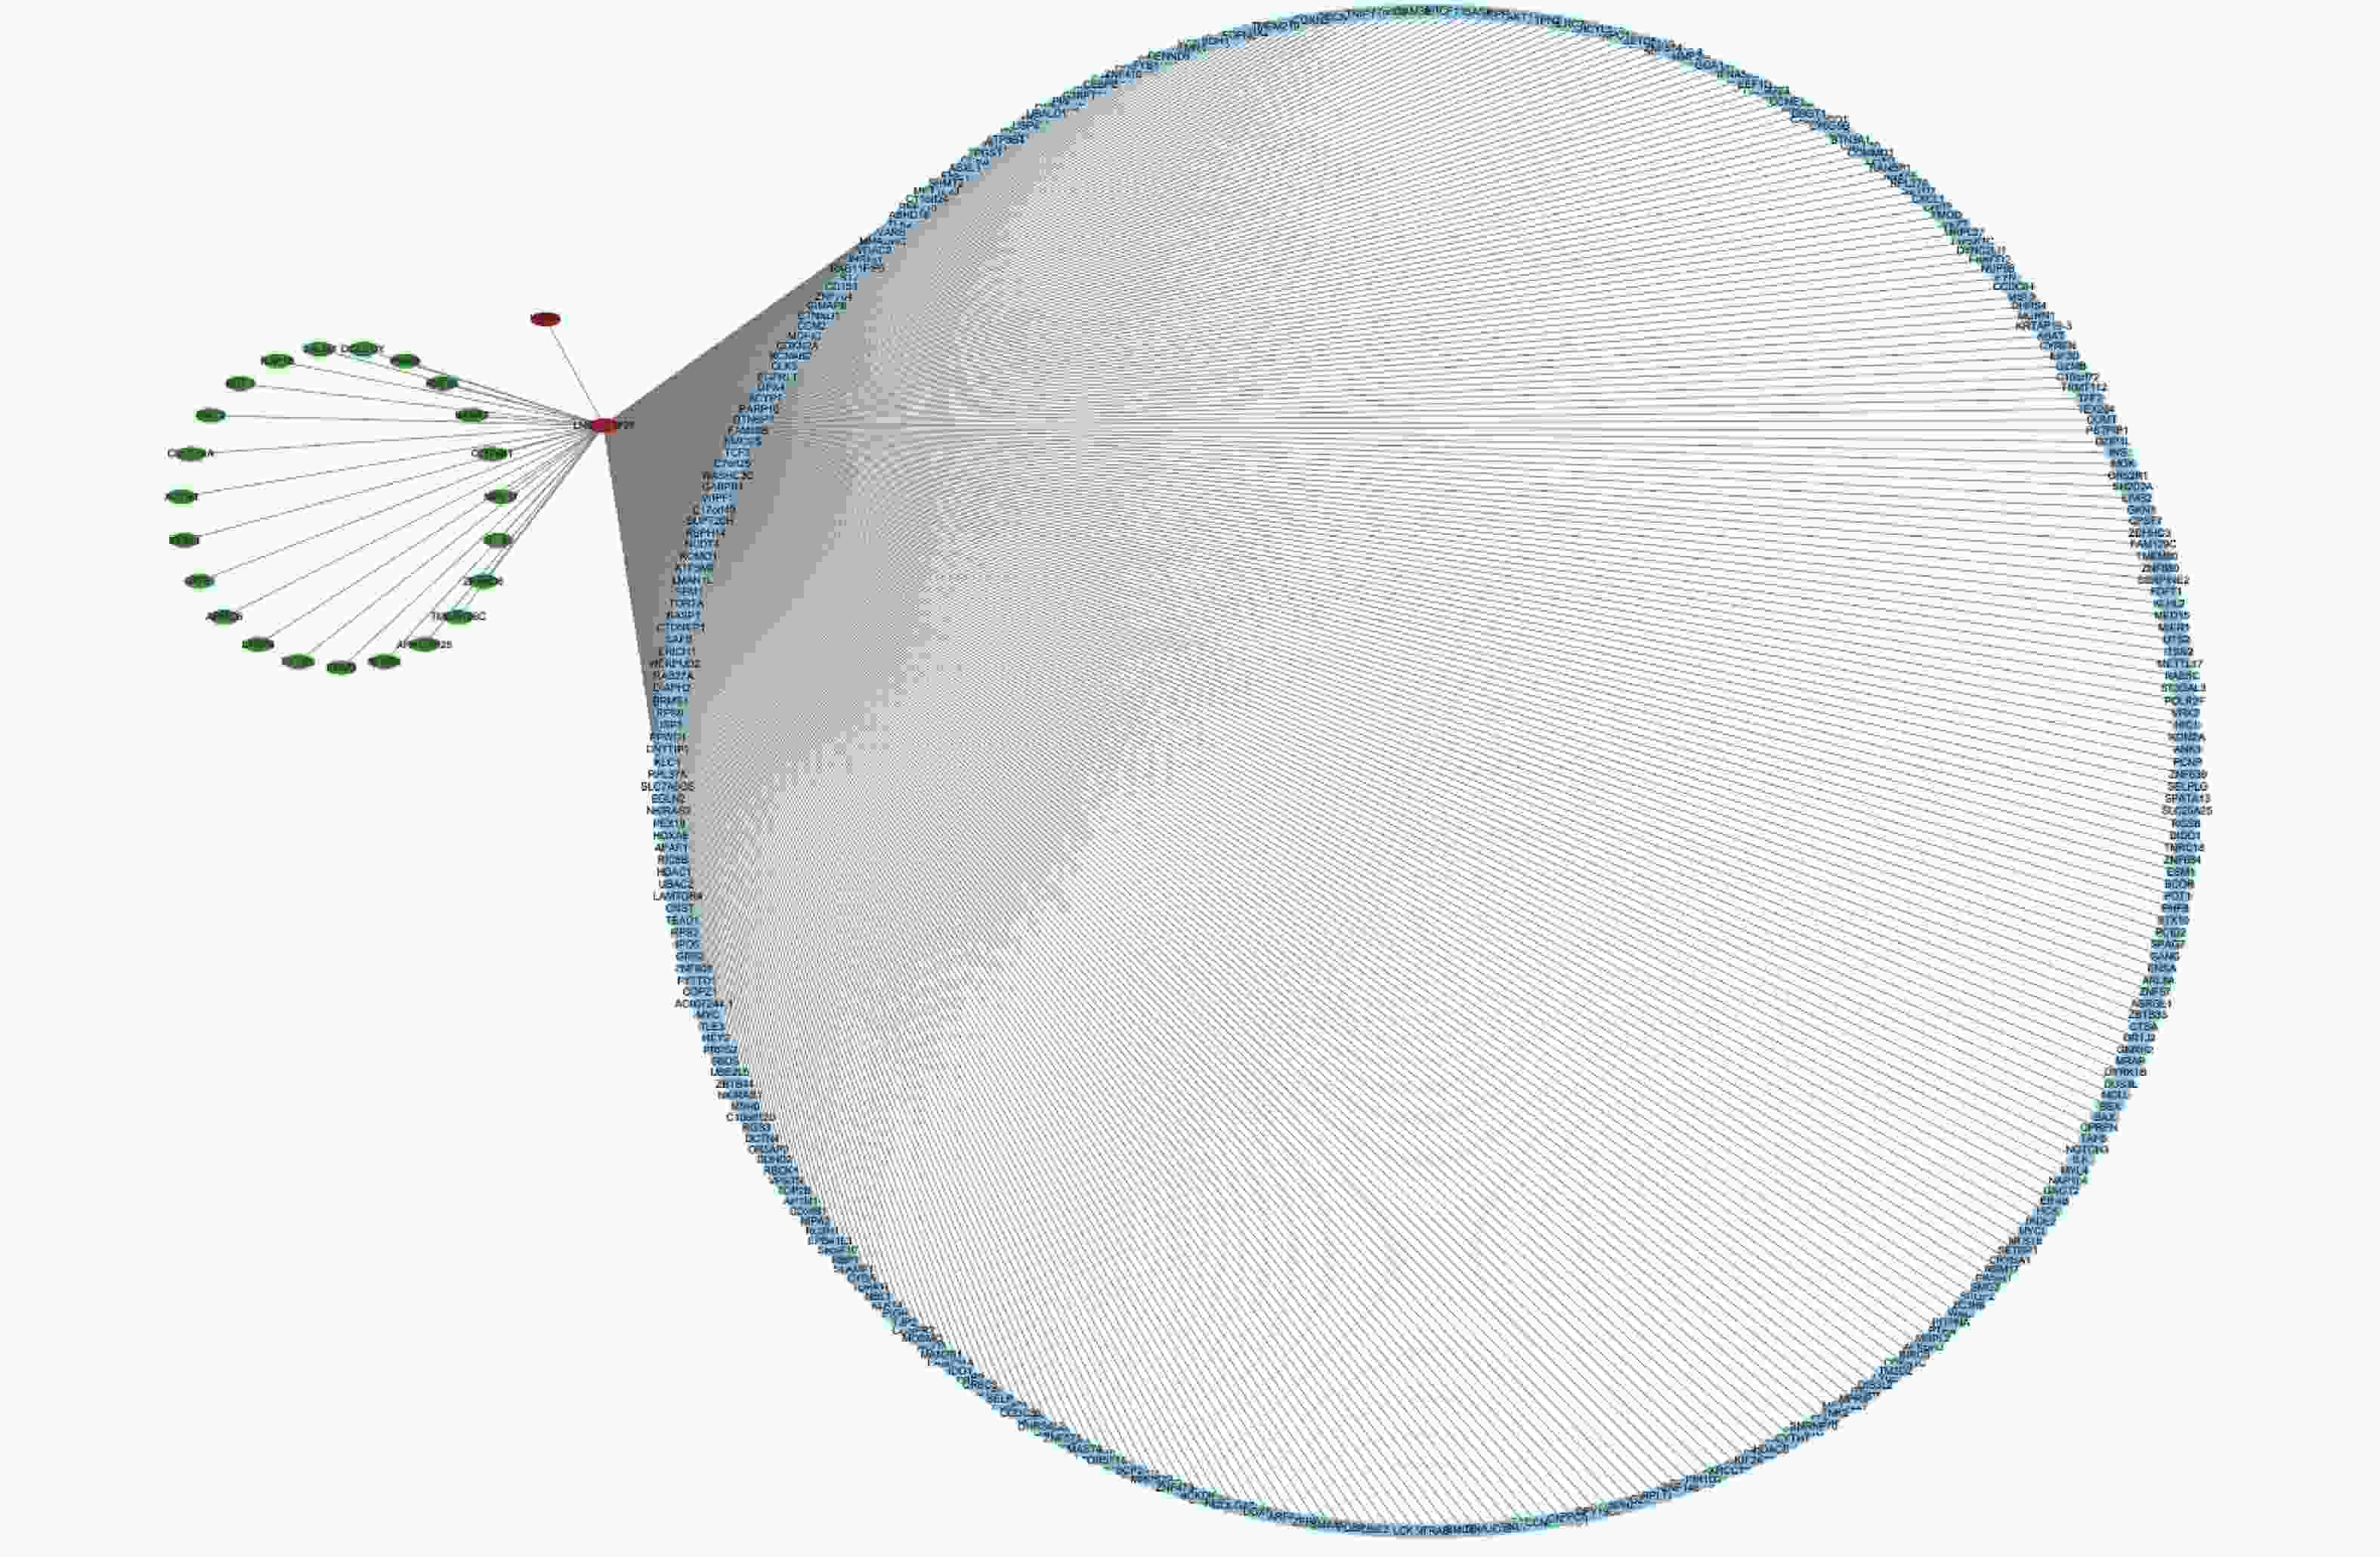
Figure S2. The coexpression of lncRNA-mRNA networks of exo-lnc_011797. Upregulated RNAs are denoted in red, and downregulated RNAs are denoted in green; Blue indicates RNAs that are not differentially expressed.
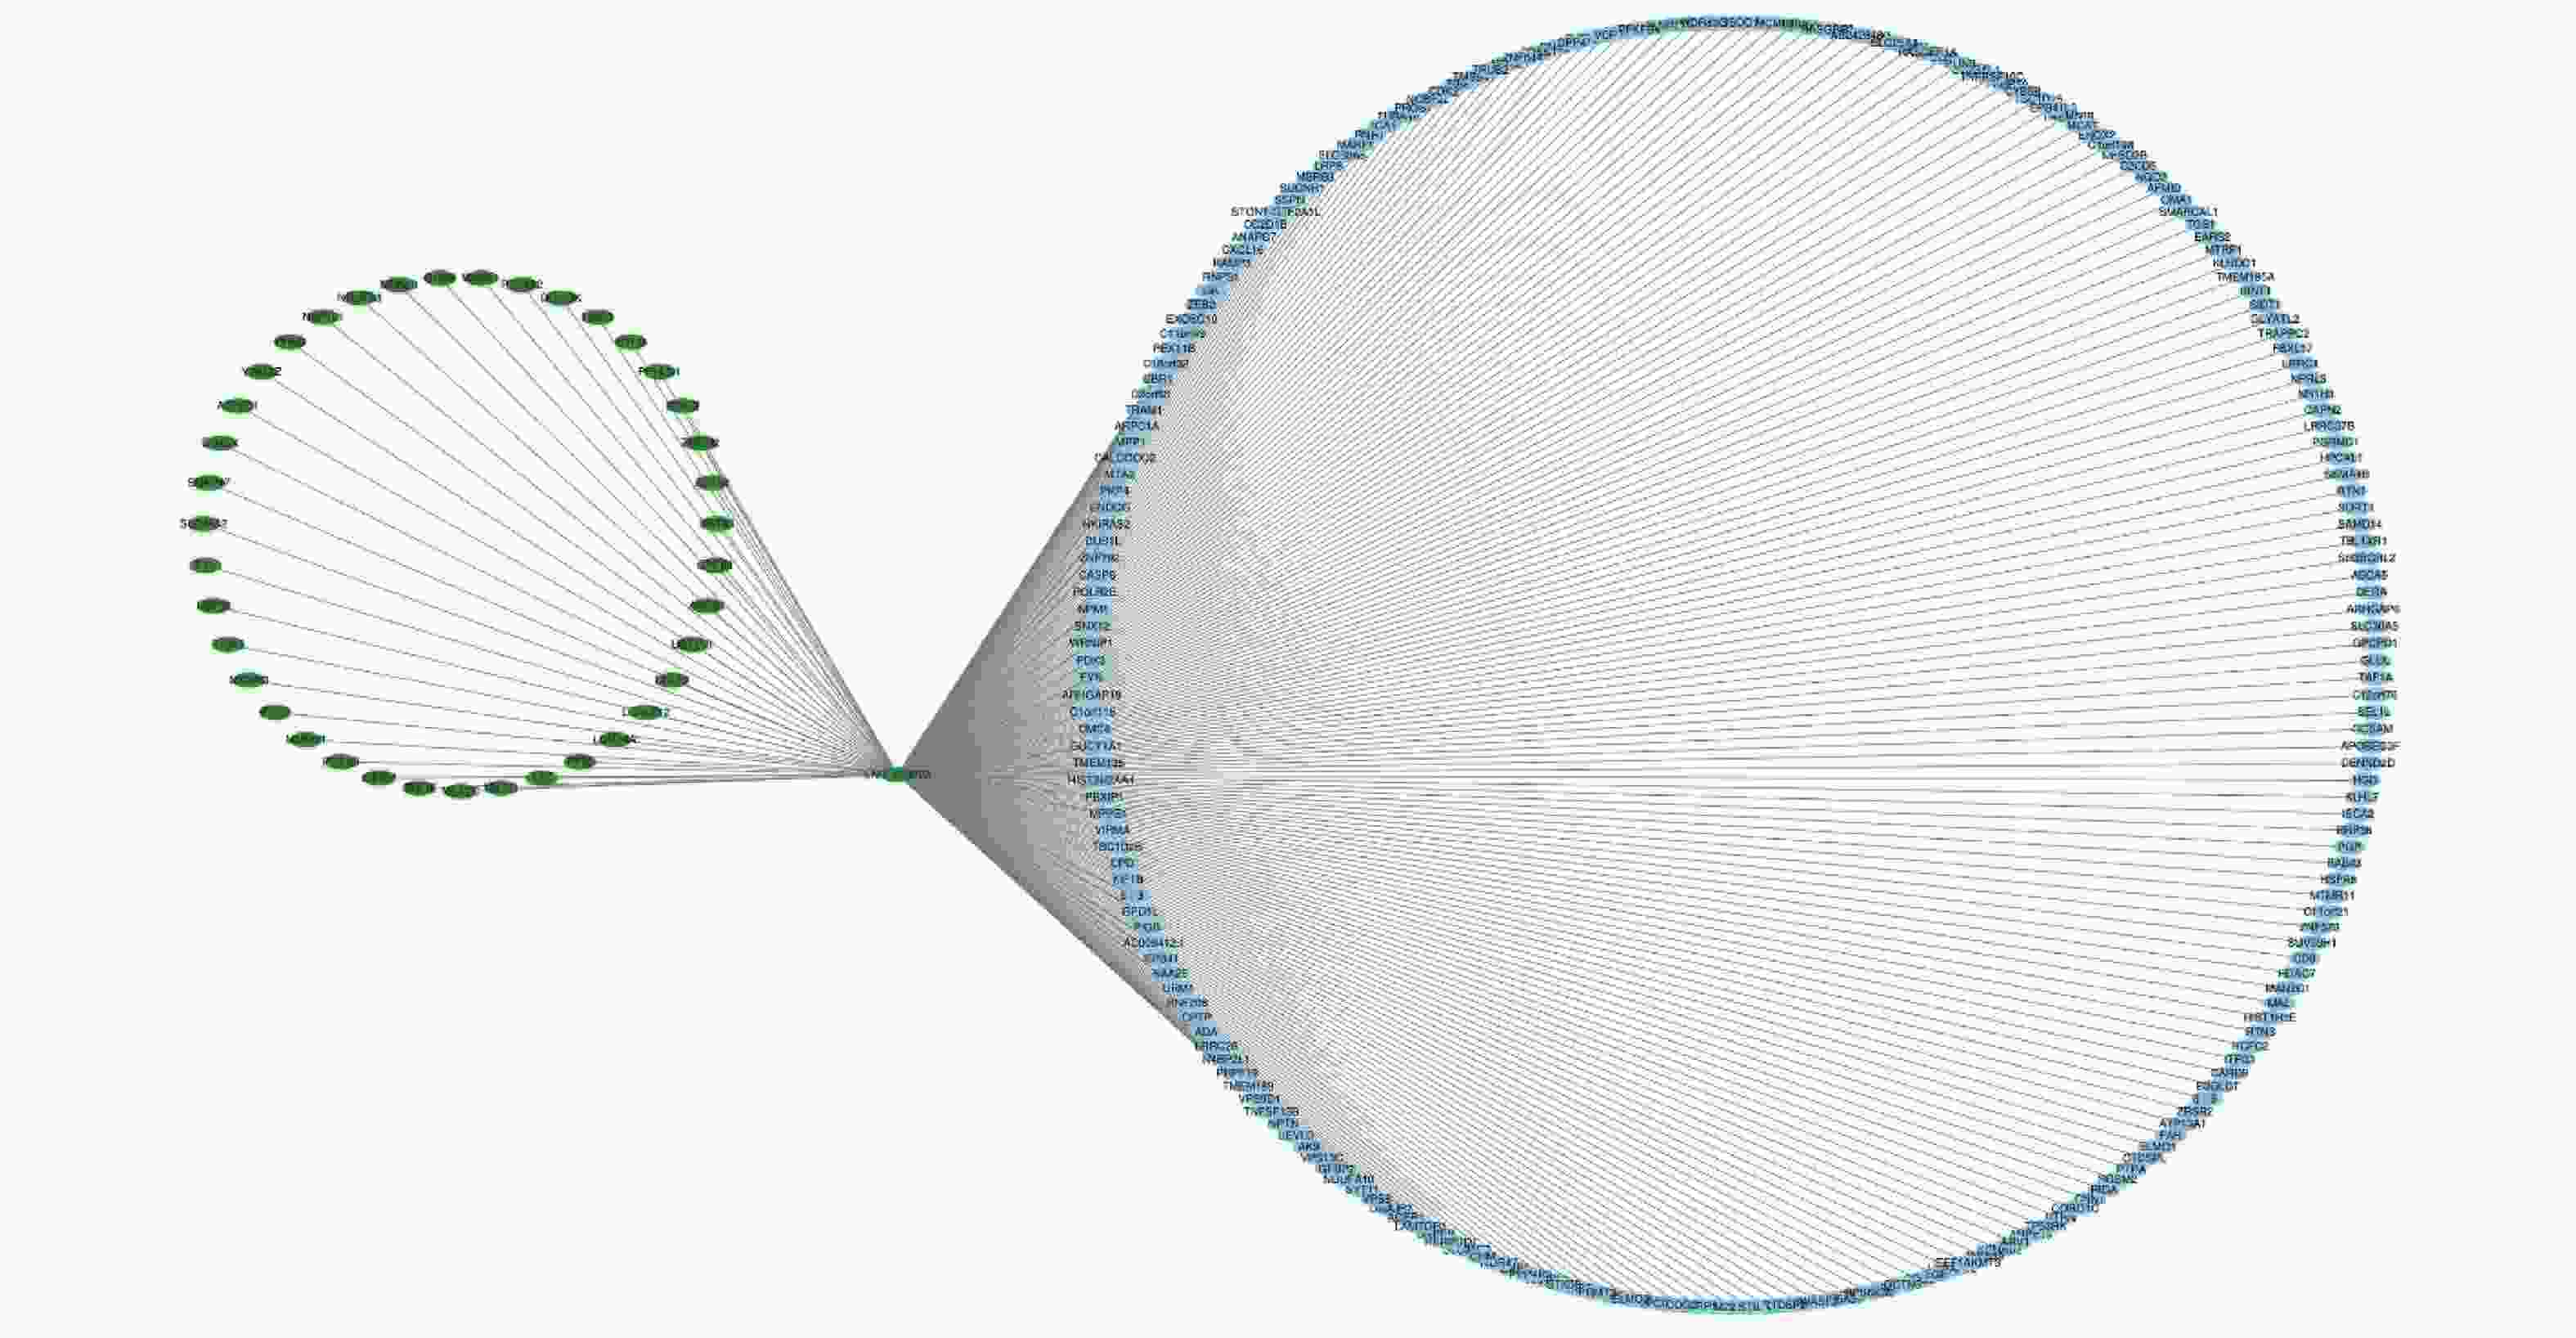
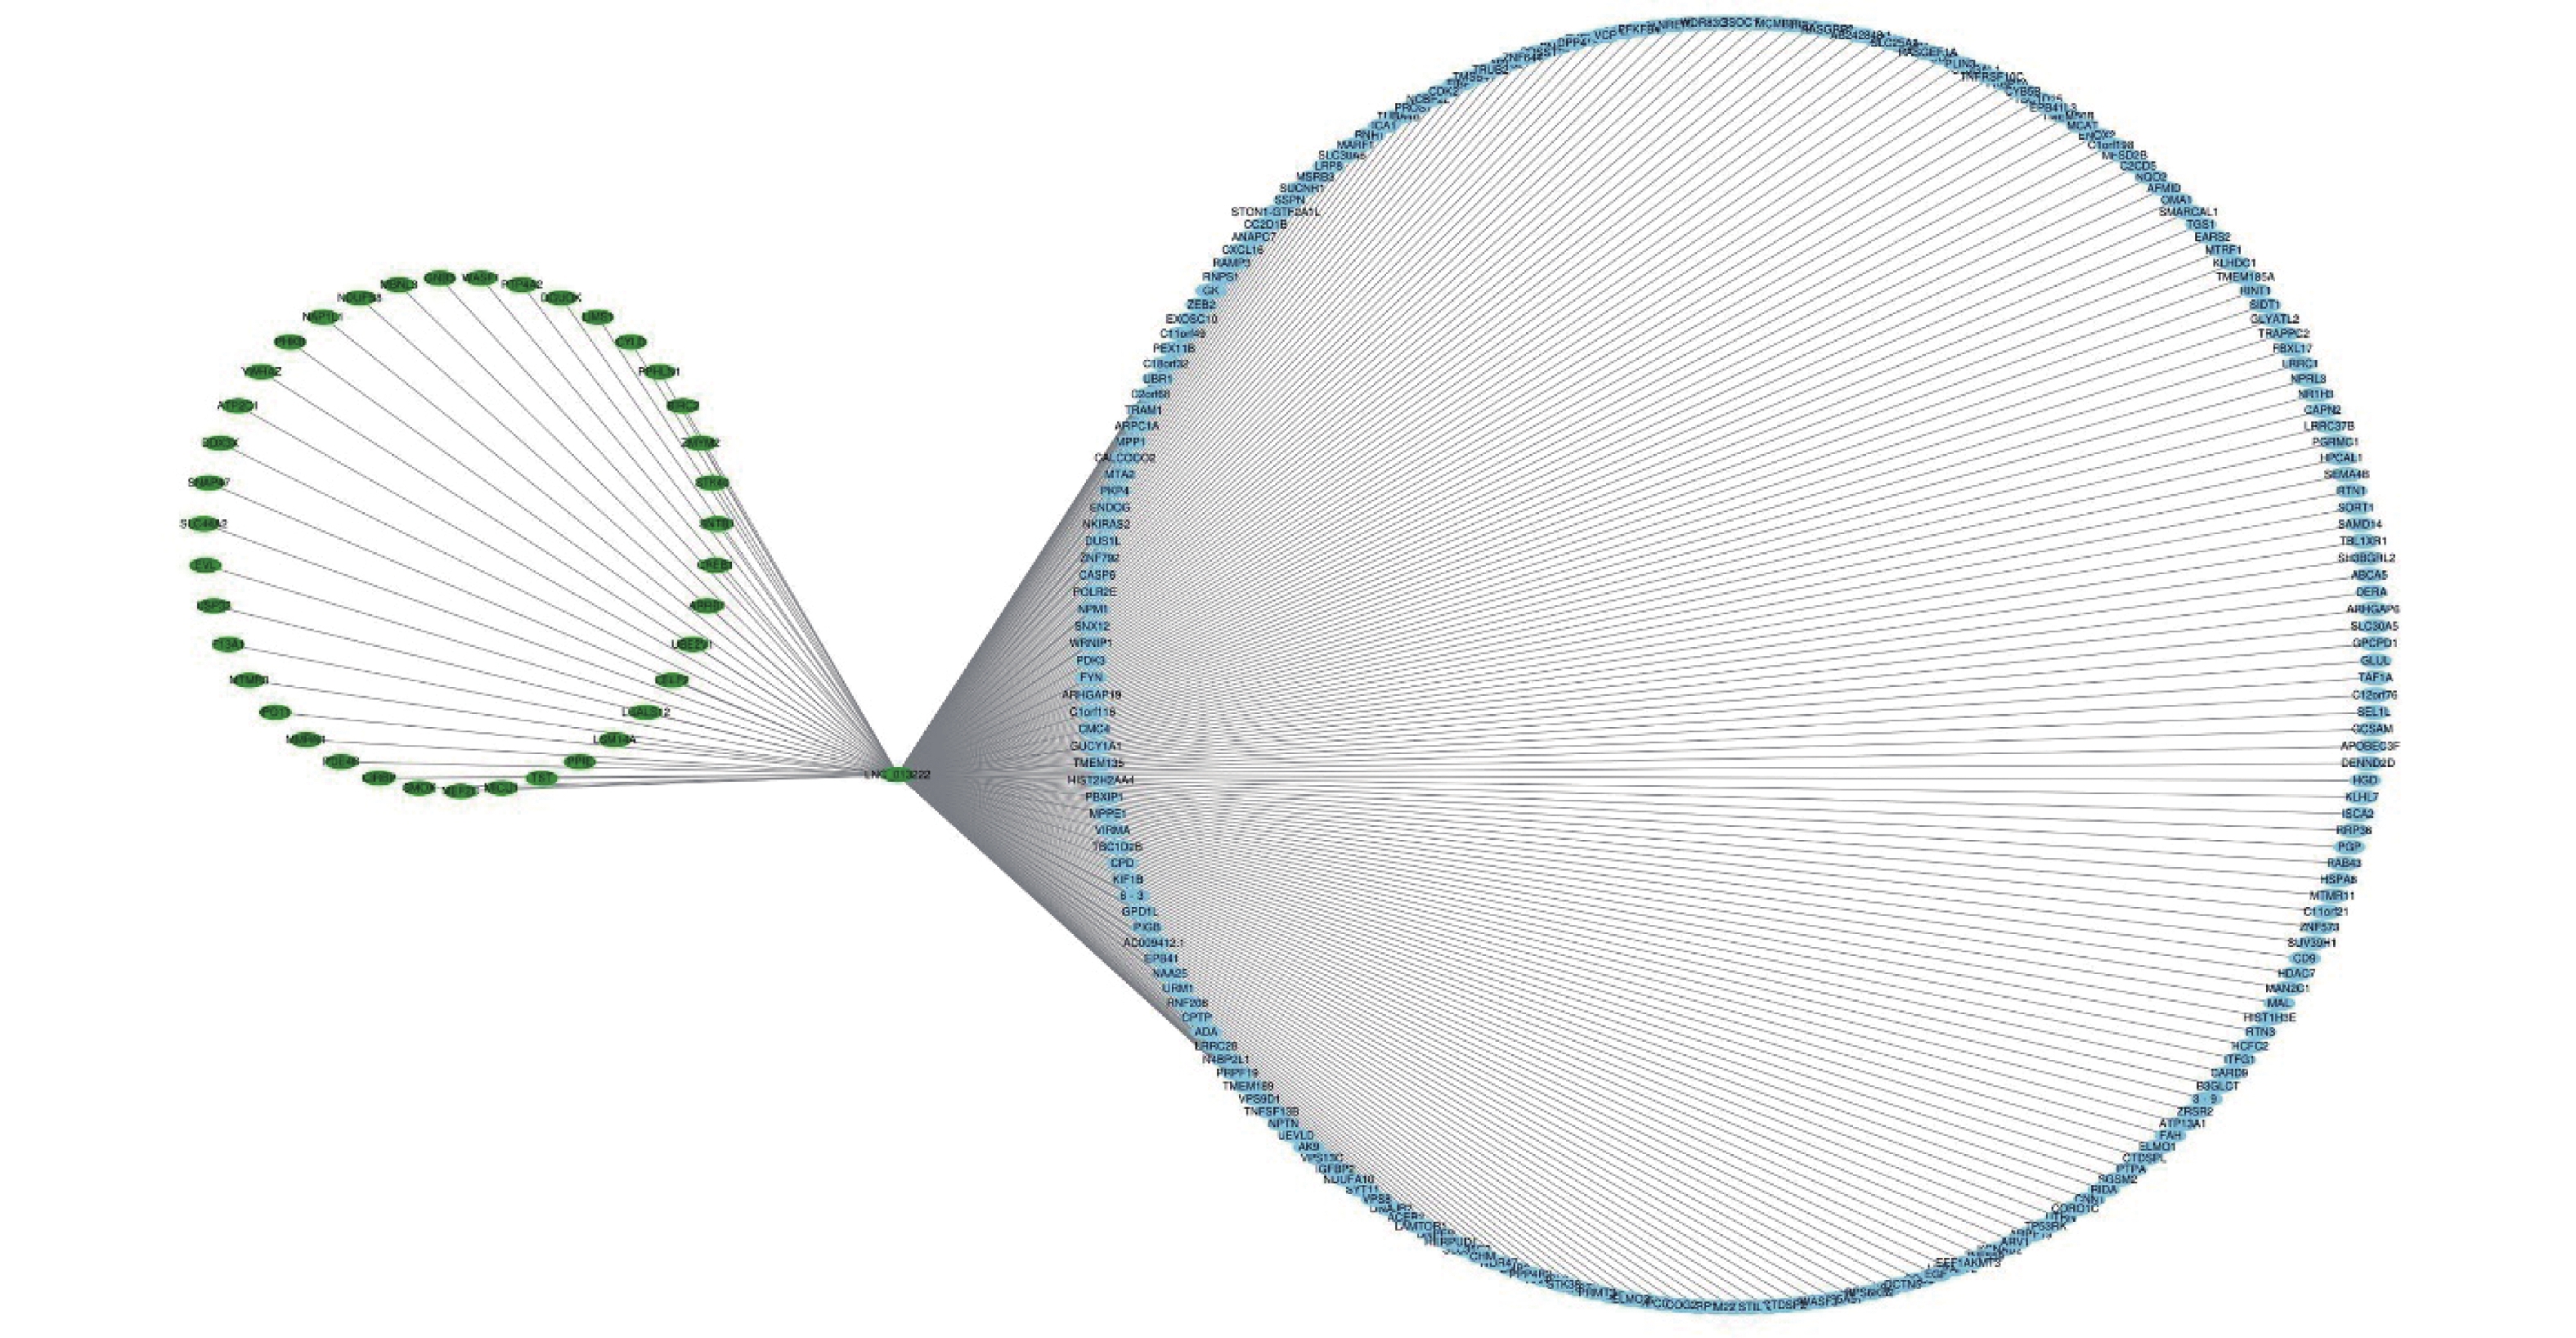
Figure S5. The coexpression of lncRNA-mRNA networks of exo-lnc_013222. Upregulated RNAs are denoted in red, and downregulated RNAs are denoted in green. Blue indicates RNAs that are not differentially expressed.
-
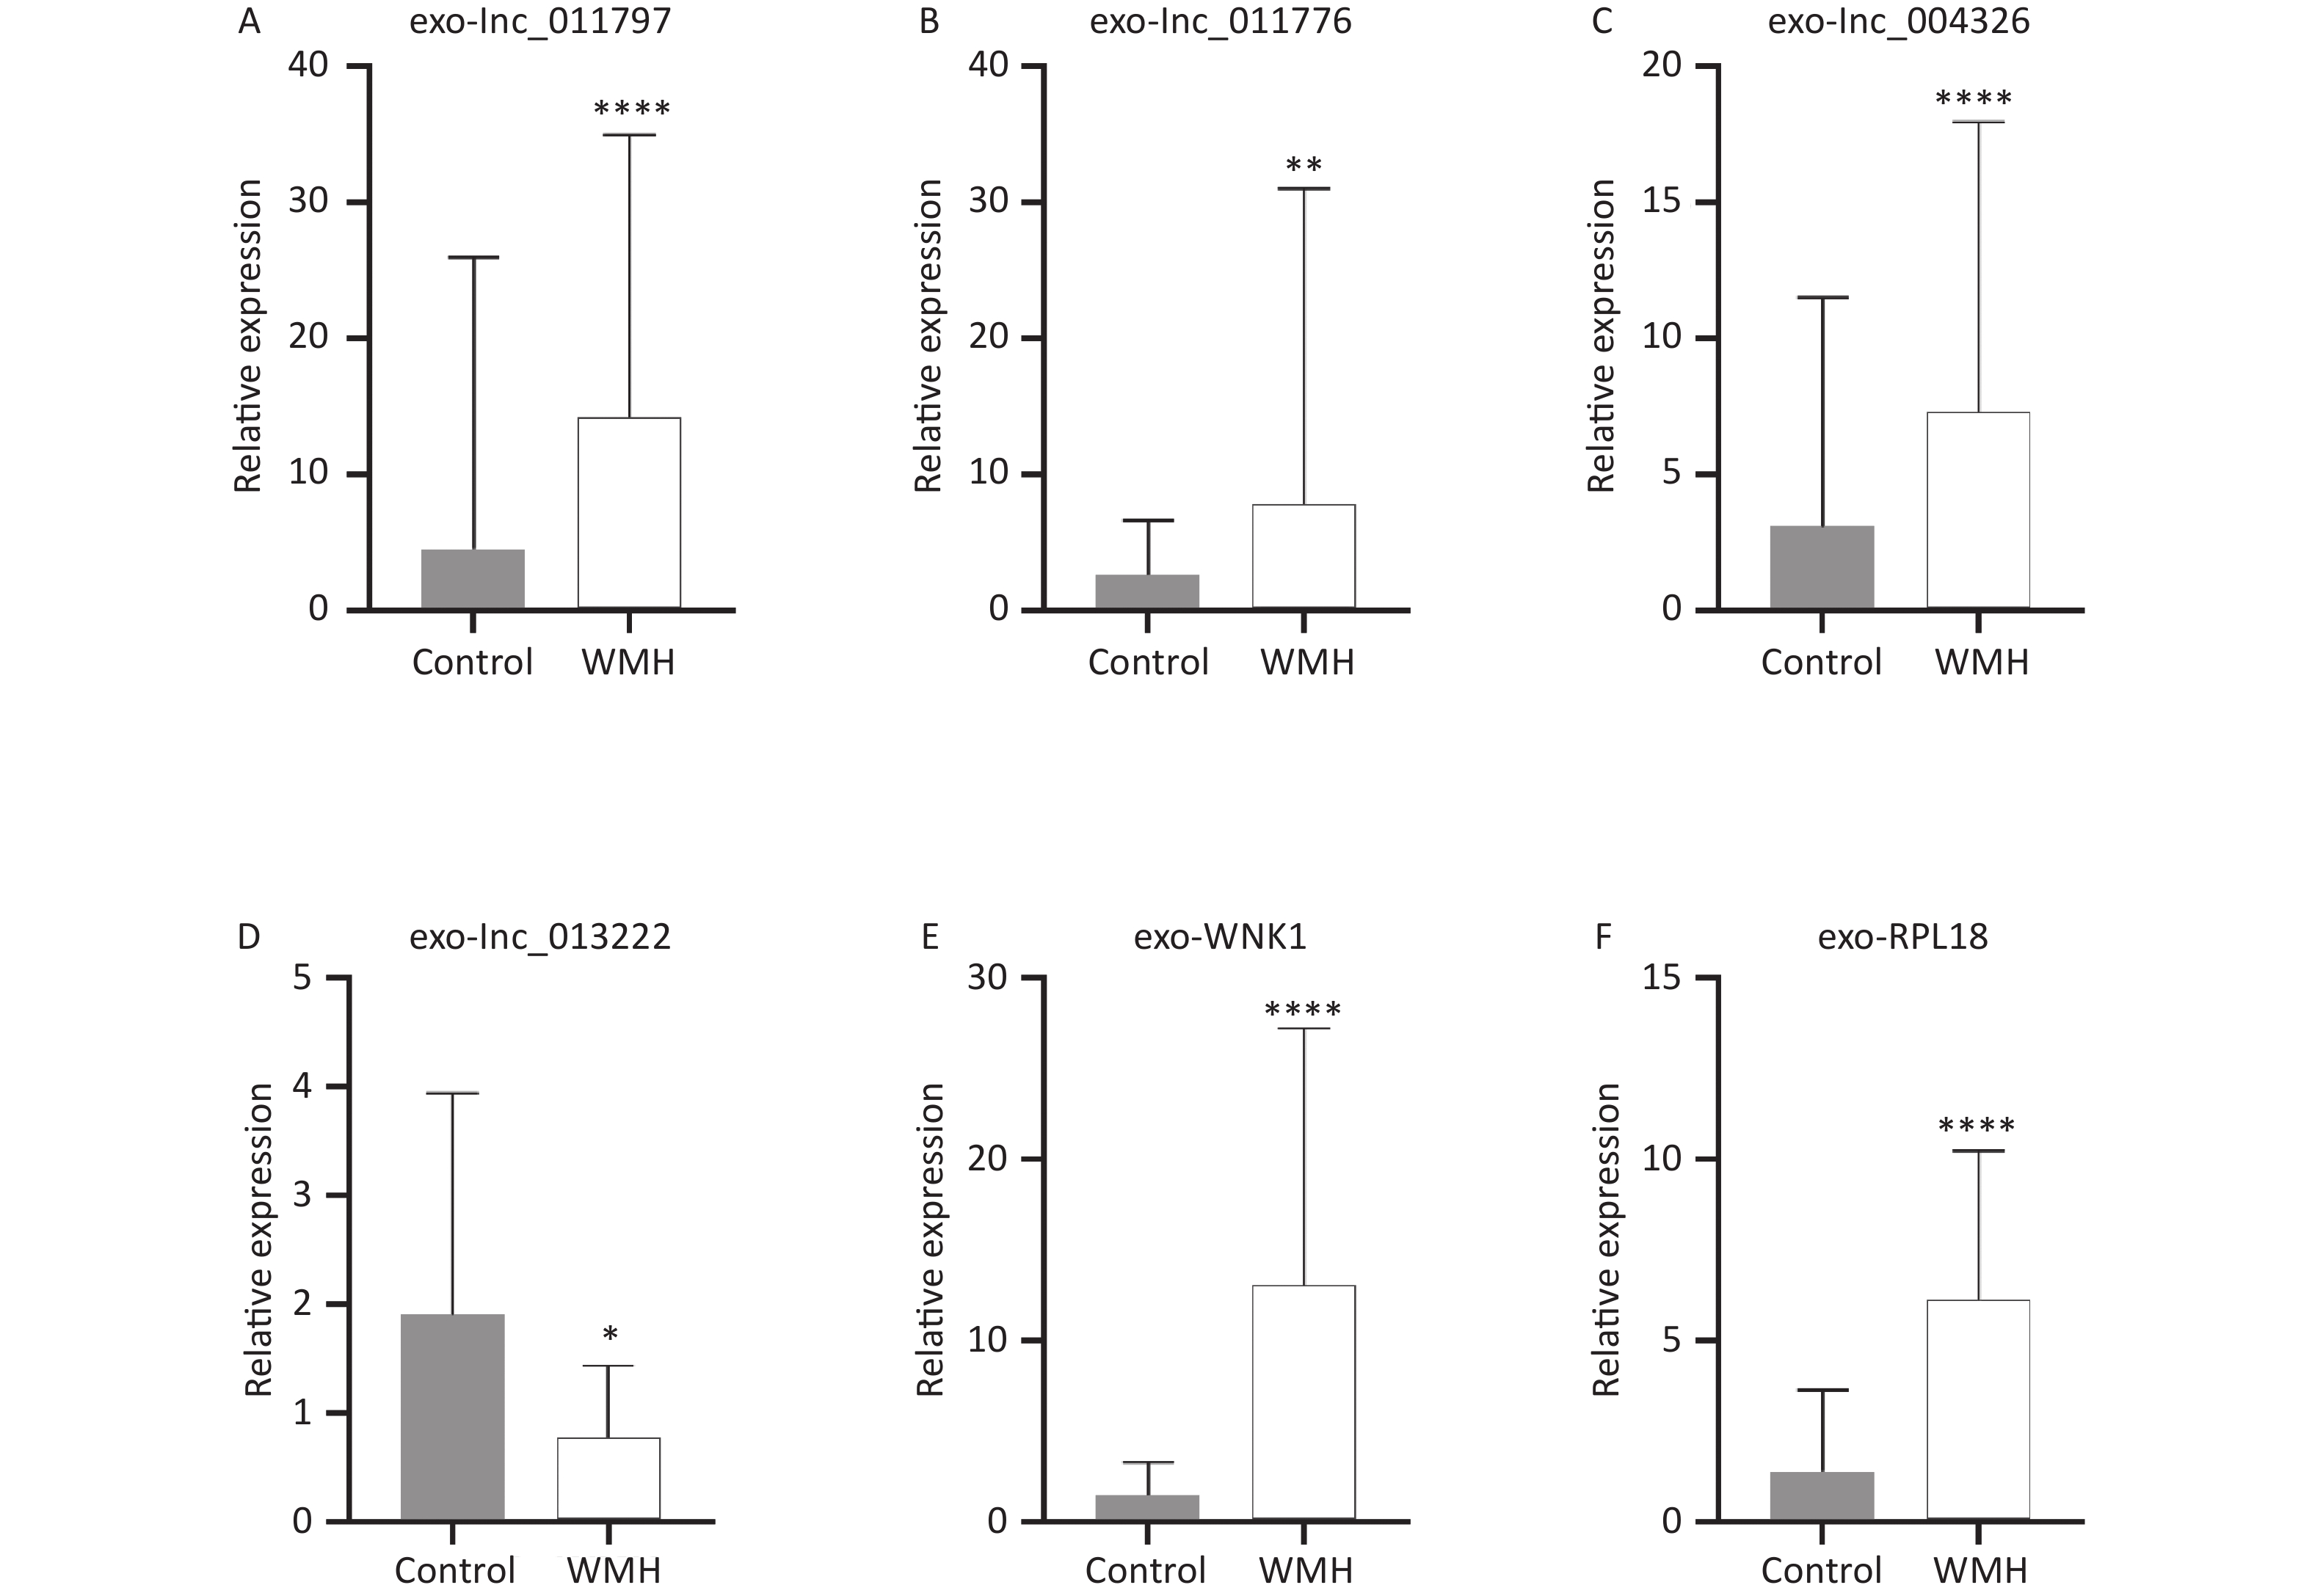
To verify the sequencing results, we confirmed the expression levels of the previously selected four DE exo-lncRNAs in the validation set by qRT-PCR. Meanwhile, two coexpressed mRNAs with large DEs were selected for verification. The two mRNAs were protein kinase with-no-lysine (K) 1 (WNK1) and ribosomal protein L18 (RPL18). The results showed that exo-lnc_011797, lnc_011776, exo-lnc_004326, exo-WNK1, and exo-RPL18 exhibited higher expressions in WMH patients than in controls (Figure 6). In contrast, exo-lnc_013222 was significantly downregulated in WMH (Figure 6). These study results were more consistent with the sequencing results.
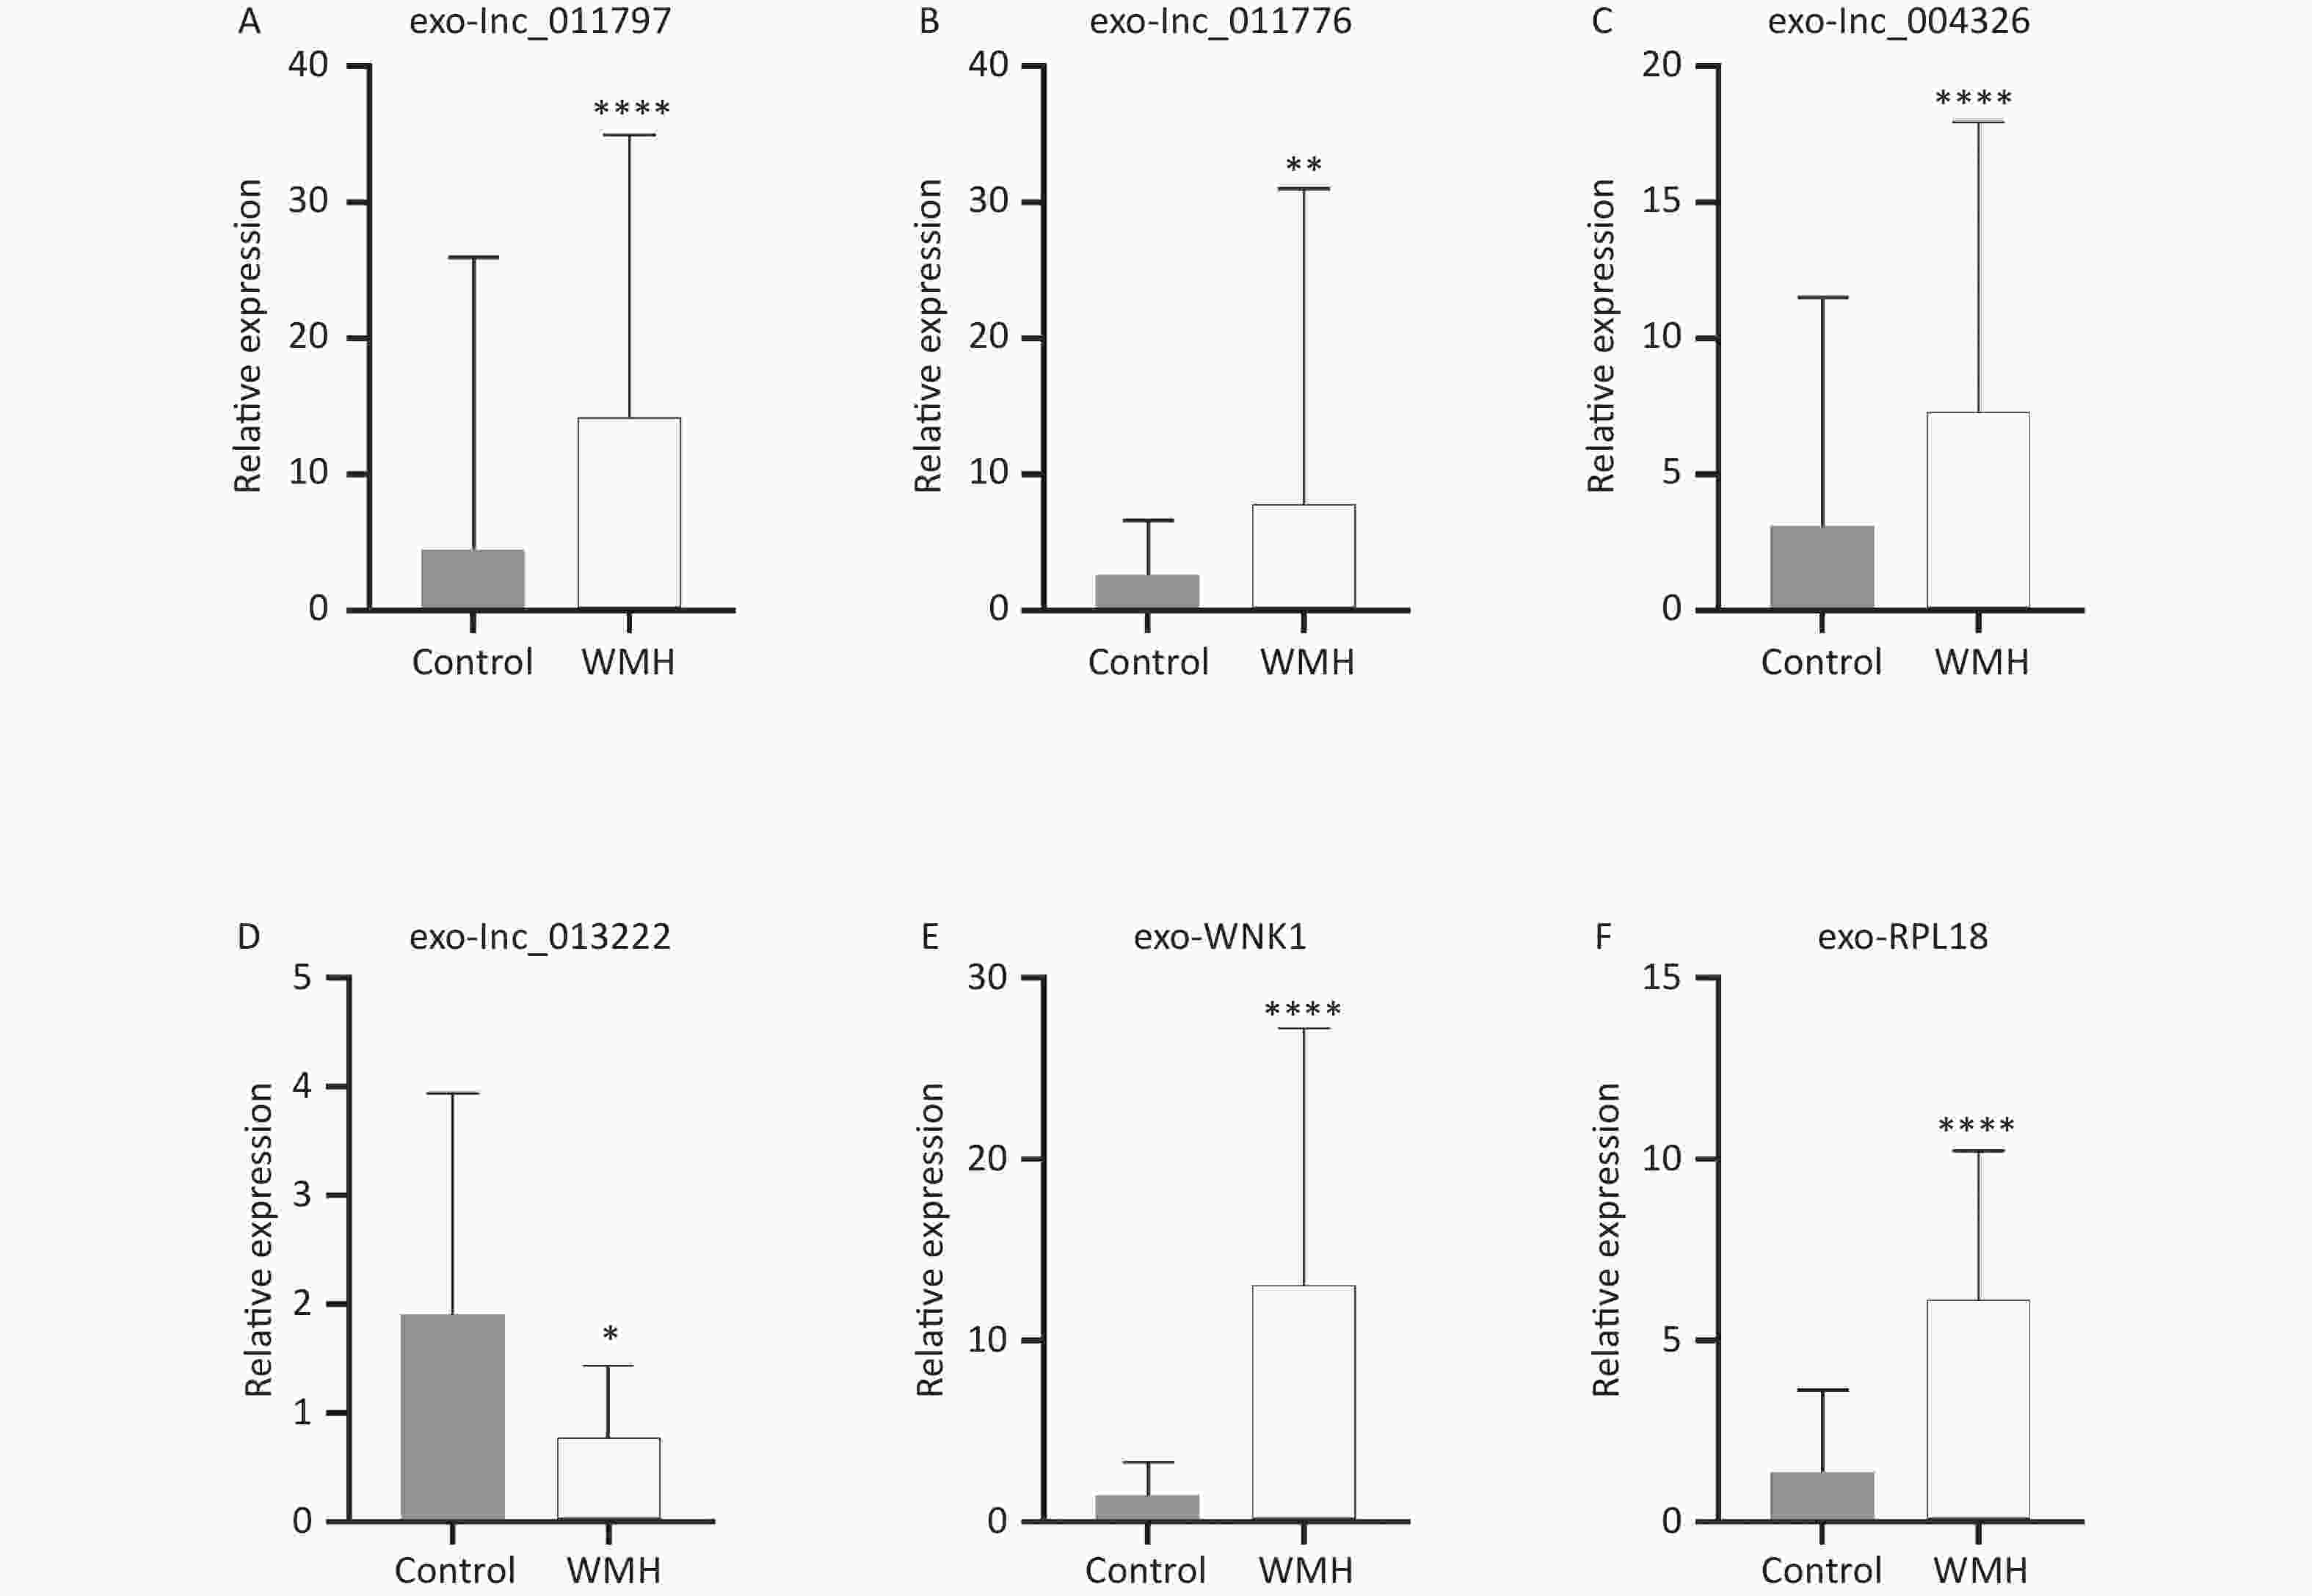
Figure 6. Validation of DE RNAs expression by qRT-PCR. The differential expression of exo-lnc_011797 (A), exo-lnc_011776 (B), exo-lnc_004326 (C), exo-lnc_013222 (D), exo-WNK1 (E), and exo-RPL18 (F) between WMH and controls. *P < 0.05; **P < 0.005; ****P < 0.0001.
-
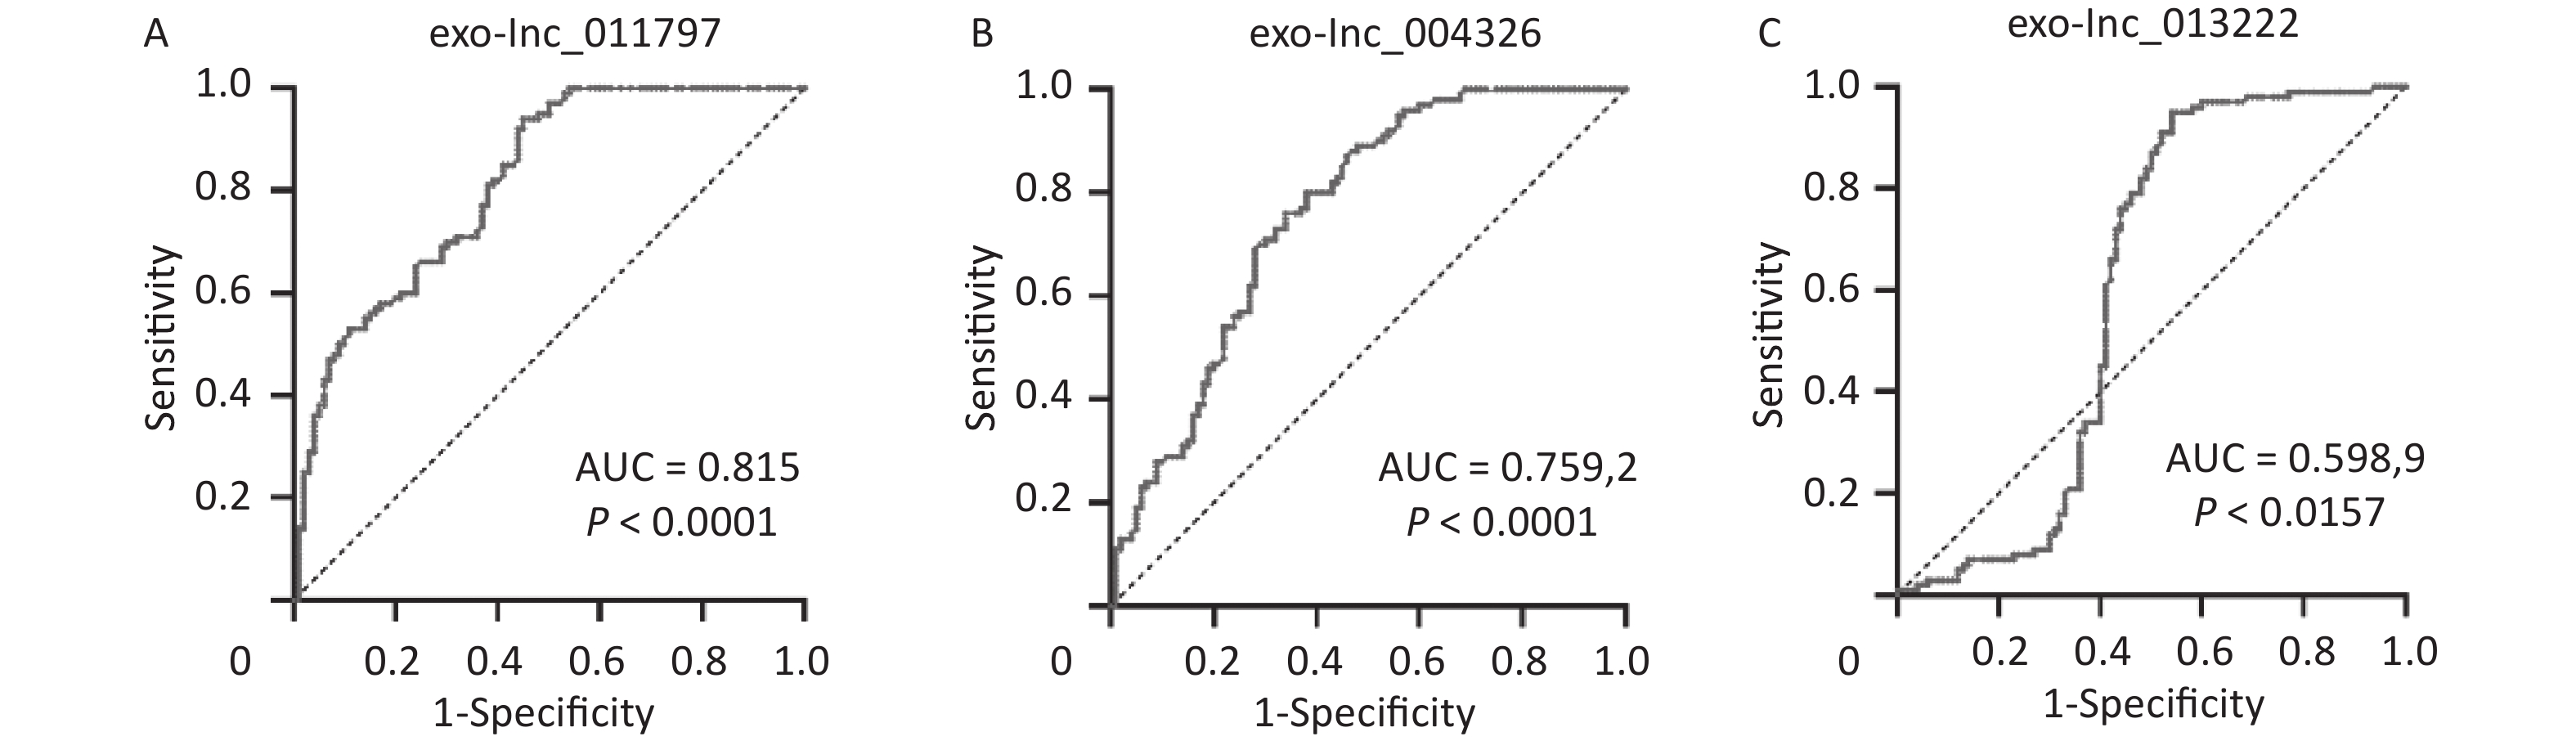
To better evaluate and prove the diagnostic performance of candidate exosomal lncRNAs for WMH, we first used binary logistic analysis to assess the association of the exo-lncRNAs and WMH. After adjusting for confounding variables, we found that exo-lnc_011797 and exo-lnc_004326 were independent risk factors for WMH, while exo-lnc_013222 was an independent protective factor for WMH (Table 3). We then performed a ROC curve analysis for exo-lnc_011797, exo-lnc_00432, and exo-lnc_013222. The ROC curve analysis showed that the AUCs of exo-lnc_011797 and exo-lnc_004326 were 0.815 and 0.7592, respectively (Figure 7). These results indicated that exo-lnc_011797 and exo-lnc_004326 exhibited a greater diagnostic efficacy for WMH. However, exo-lnc_013222 had lesser diagnostic efficacy for WMH (AUC = 0.5989).
Table 3. Logistic analysis of risk factors associated with WMH
LncRNA expression level Unadjusted Adjusted# OR (95% CI) P OR (95% CI) P Exo-lnc_011797 1.043 (1.013–1.074) 0.004* 1.033 (1.000–1.066) 0.048* Exo-lnc_011776 1.046 (0.994–1.101) 0.082 1.051 (0.991–1.051) 0.098 Exo-lnc_004326 1.075 (1.020–1.132) 0.007* 1.061 (1.061–1.008) 0.022* Exo-lnc_013222 0.494 (0.358–0.680) 0.000* 0.406 (0.277–0.596) 0.000* Note. *P < 0.05 indicates statistical significance. #OR was adjusted for age, sex, hypertension, diabetes, smoking, TG, TC, HDL, and LDL. 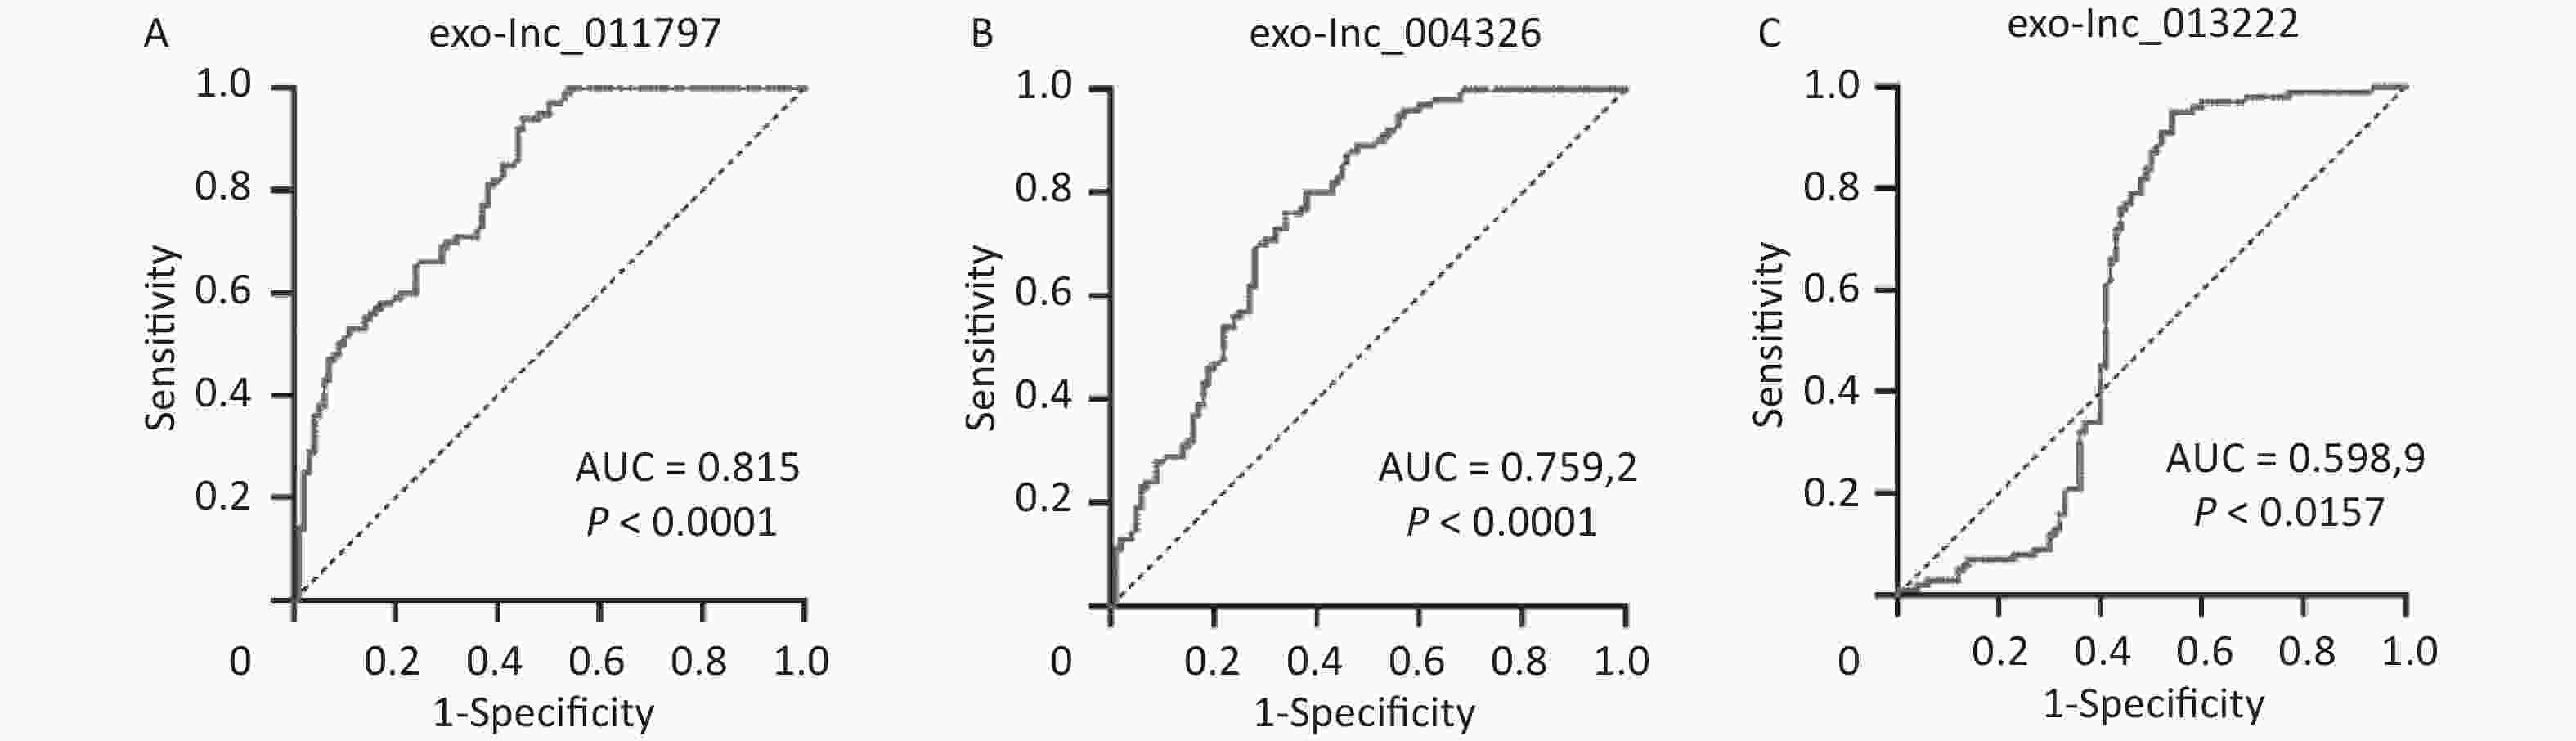
Figure 7. ROC curve analyses of exo lncRNAs for the diagnostic efficacy of WMH. The AUC evaluated the diagnostic value of (A) exo-lnc_011797, (B) exo-lnc_004326, and (C) exo-lnc_013222.
-
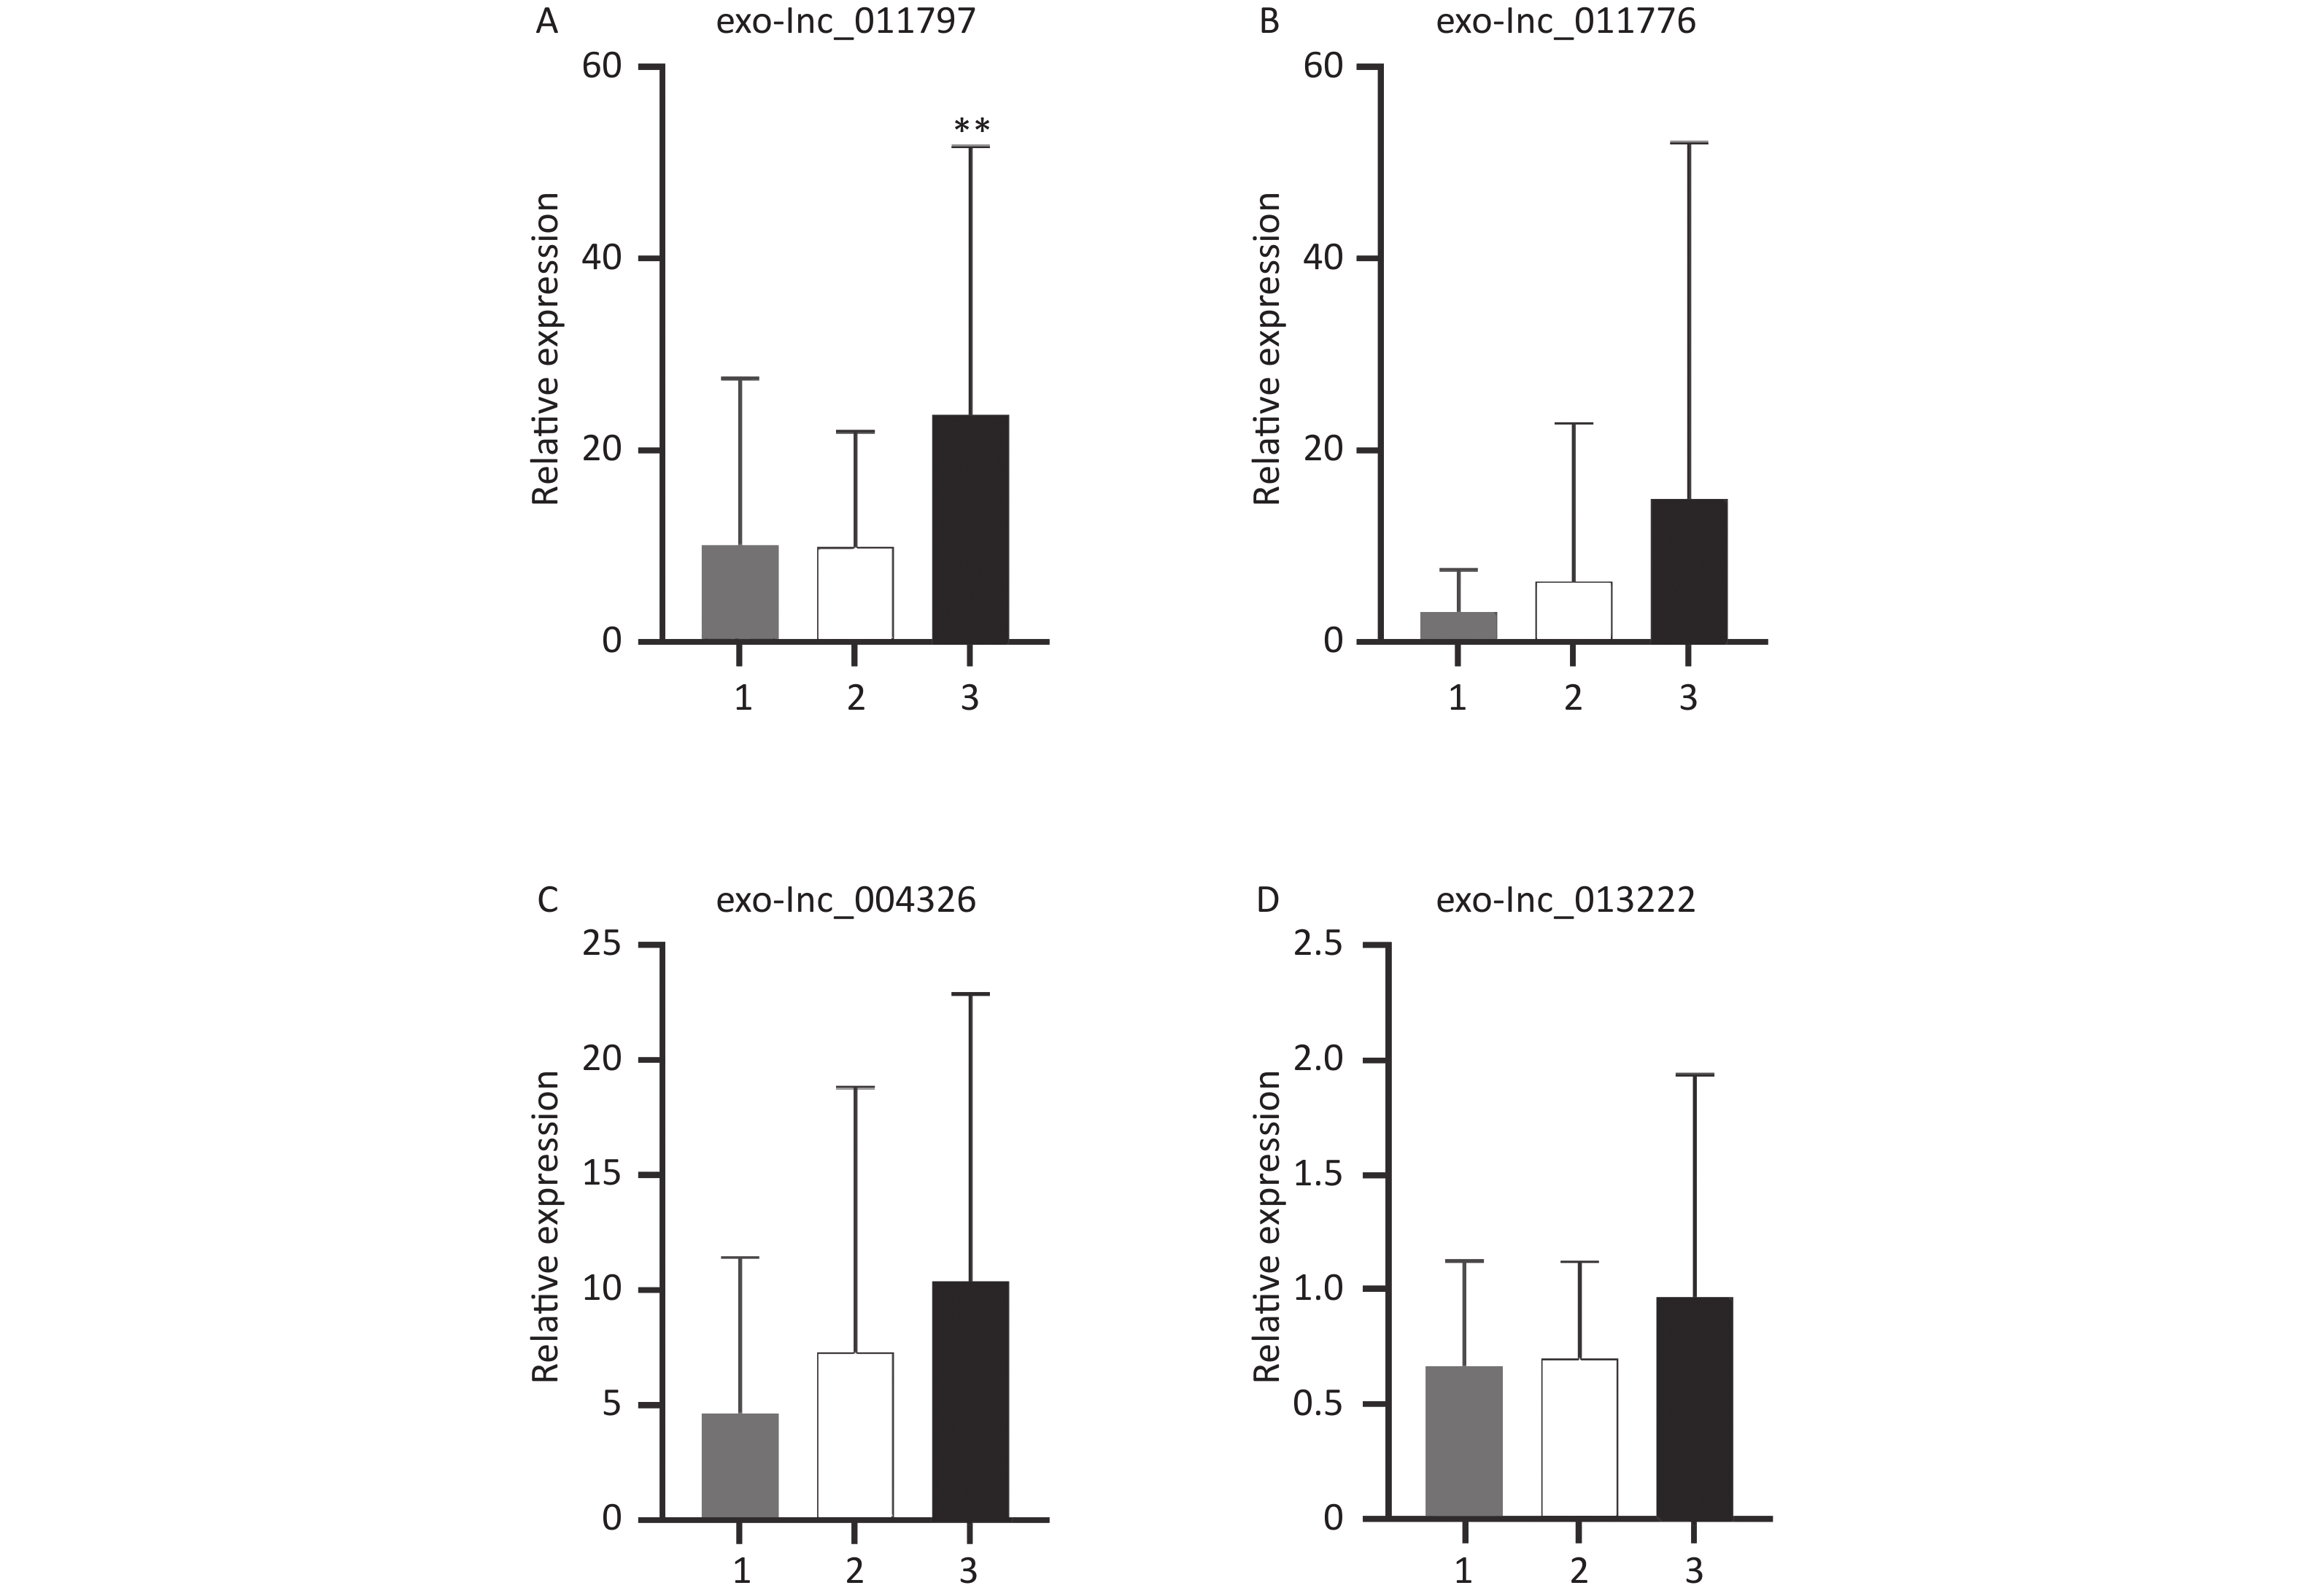
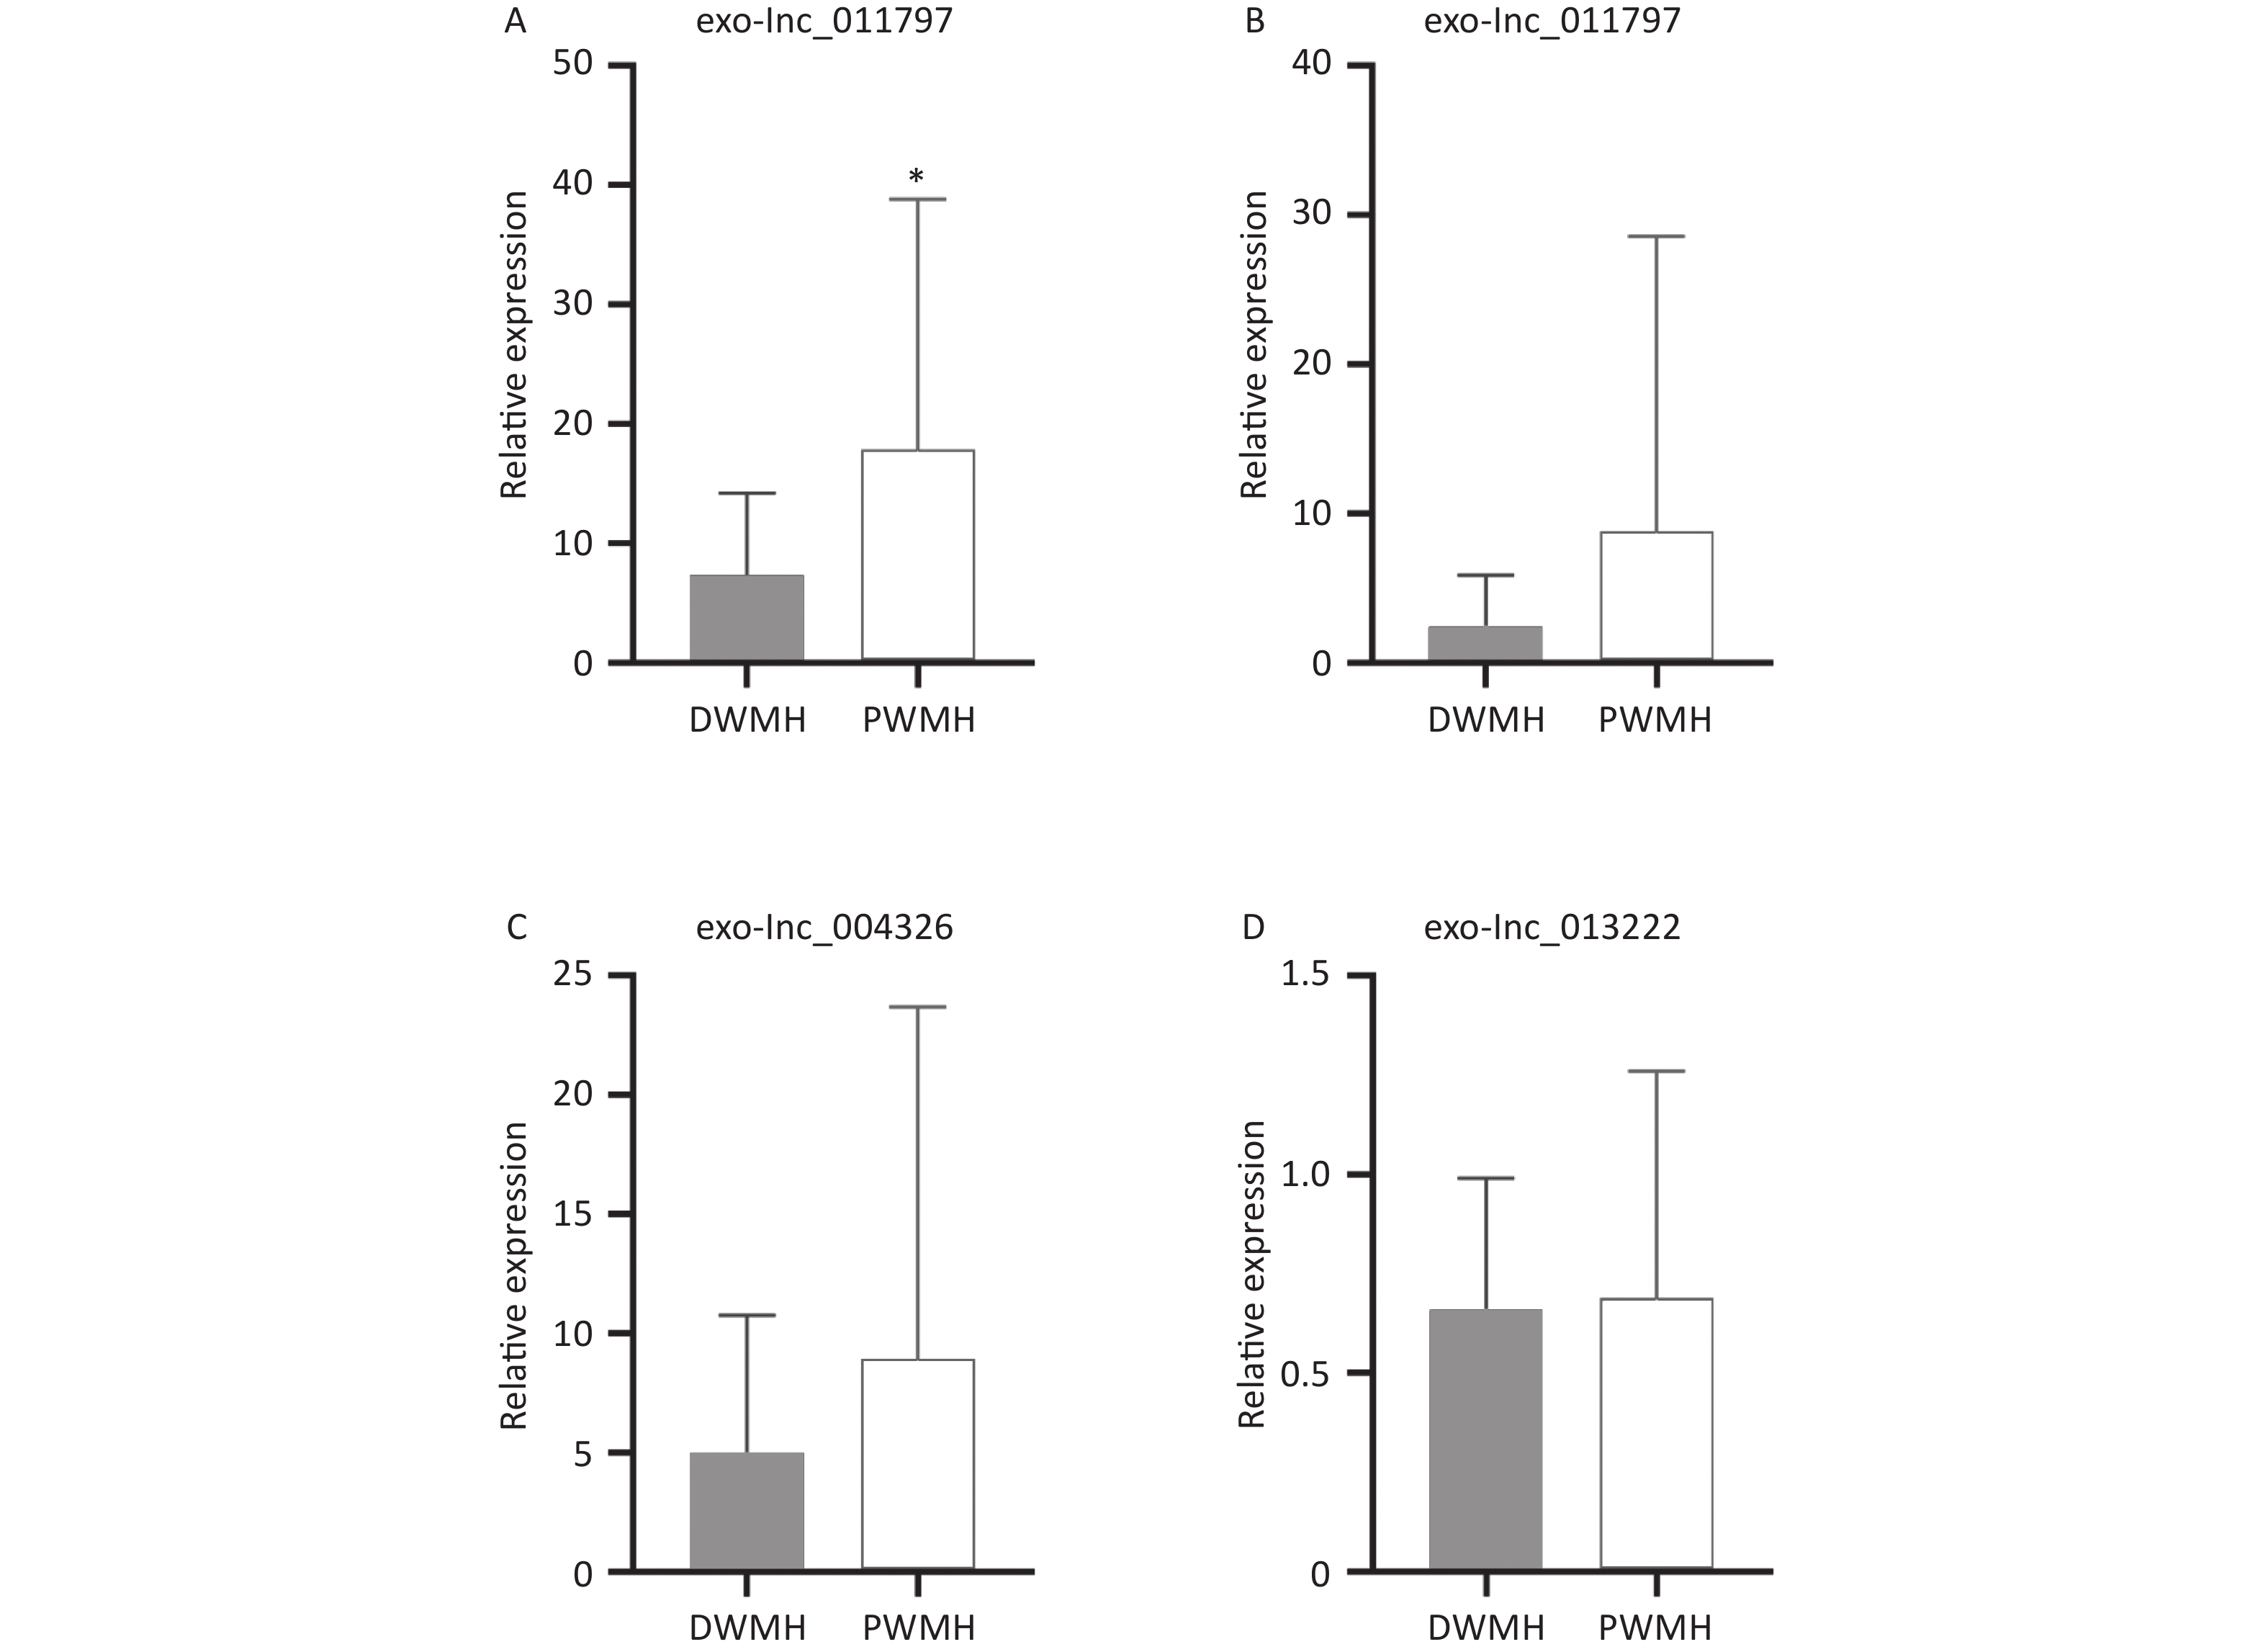
All 100 WMH patients underwent cerebral MRI. The Fazekas scale was used to assess the severity of WMH on FLAIR sequences. All patients had WMH; 35 patients had a score of 1, 34 patients had a score of 2, and 31 patients had a score of 3. Then we excluded patients with the same DWMH and PWMH Fazekas scale, and the site of WMH was divided into DWMH (n = 31) and PWMH (n = 25). We tested the expression levels of exosomal lncRNAs in different subgroups by qRT-PCR and analyzed the signaling role of exo-lncRNAs in WMH severity and localization. Our analysis revealed that the expression of exo-lnc_011797 was positively correlated with the severity of WMH (P = 0.0087) (Figure 8). Additionally, the expression of exo-lnc_011797 was significantly higher in PWMH patients than in DWMH patients (Figure 9). Consequently, lnc_011797 may have predictive value for the severity and localization of WMH.

Figure 8. Correlation between 4 exosomal lncRNAs and WMH severity. (A–D) The relative expressions of exo-lncRNAs. The expression of exo-lnc_011797 was significantly increased in patients with a Fazekas score of 3. **P < 0.005.
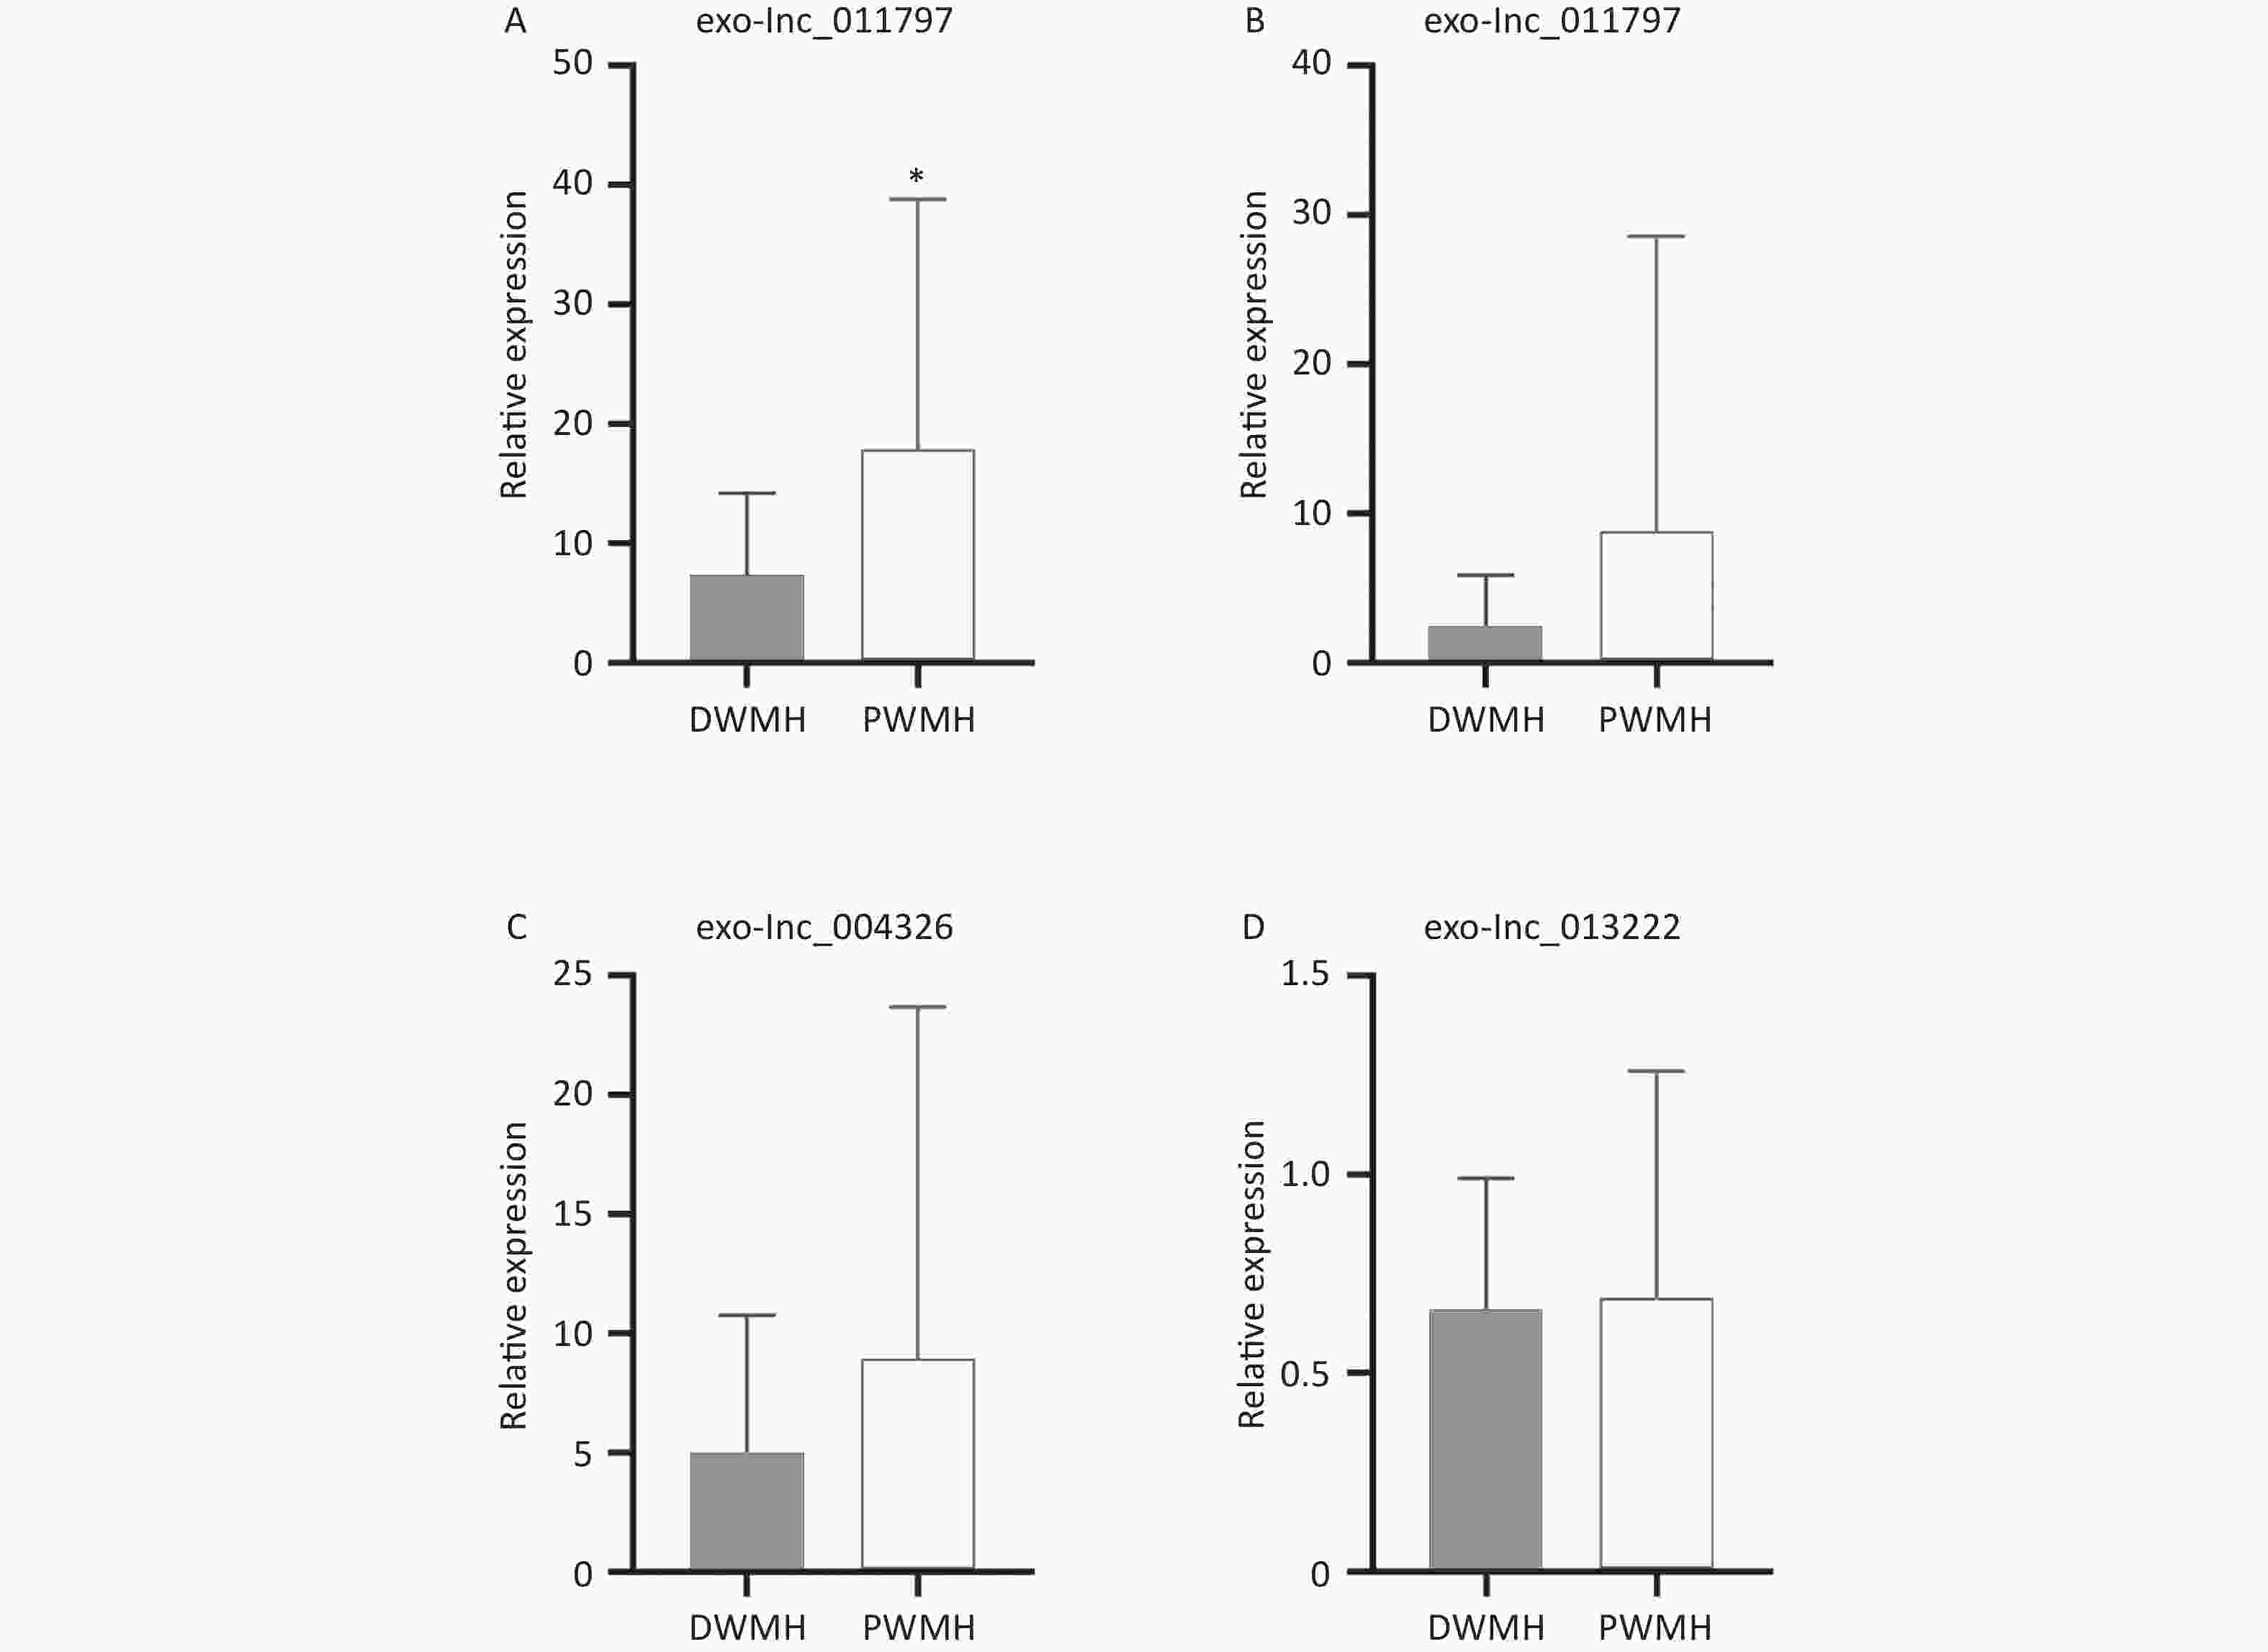
Figure 9. The levels of 4 exosomal lncRNAs in different white matter sites. (A–D) Relative expression of exo-lncRNAs. The expression of exo-lnc_011797 was significantly higher in PWMH patients than in DWMH patients (P = 0.0383). *P < 0.05.
-
In this study, we sequenced the lncRNAs in the plasma exosomes of patients with WMH. Three significantly upregulated lncRNAs (exo-lnc_011776, exo-lnc_011797, and exo-lnc_004326) and one significantly downregulated lncRNA (exo-lnc_013222) were found in the plasma exosomes from WMH patients. Logistic regression analysis indicated that exo-lnc_11797 and exo-lnc_004326 were independent risk factors for WMH, while exo-lnc_013222 was an independent protective factor for WMH. The ROC curve analysis showed that exo-lnc_011797 and exo-lnc_04326 had specific diagnostic value for WMH. Interestingly, exo-lnc_011797 was positively correlated with the severity of WMH and significantly elevated in PWMH patients.
With the aging of the population and the widespread use of imaging technologies, the incidence and detection rate of WMH are increasing each year. However, the pathogenesis of WMH remains unclear, and genetic studies may provide new targets for the prediction, diagnosis, and treatment of WMH. An increasing number of recent research studies have also shown that lncRNAs regulate gene expression via various mechanisms[46-48]. LncRNAs show high universality and diversity in gene regulation[26] and have been proven to play a significant role in various neurological diseases[11,30,49,50]. However, they are highly susceptible to destruction by RNA enzymes[46,51]. Exosomes are nanoscale extracellular lipid bilayer vesicles that allow RNAs carried within them to have high stability and activity[13,14]. In the central nervous system, exosomes participate in the development of neurons, maintain the normal activity of neurons, and promote the regeneration of neurons. There is evidence that exosomes may contribute to the deterioration of neuropathological processes, especially in neurodegenerative diseases[11,22]. Our previous study found that exosomal lncRNAs have important diagnostic significance in ischemic cerebrovascular disease[52]. However, there are few studies on the role of exo-lncRNAs in WMH.
In our study, we analyzed the diagnostic efficacy of exosomal lncRNAs in WMH. We found that exosomal exo-lnc_011797 and exo-lnc_04326 were independent risk factors for WMH and had specific diagnostic value. Exosomal lncRNAs have been demonstrated to play regulatory functions in different diseases via various mechanisms. Mao et al. reported that exosomal lncRNA KLF3-AS1 affects the progression of myocardial infarction by regulating Sirt1[53]. RNA polymerase (pol) III is involved in the synthesis of large amounts of non-coding RNA, and mutations in the Pol III subunit can cause Pol III-associated leukodystrophy[54]. Nevertheless, the mechanism of lncRNAs in WMH remains unclear. Through functional enrichment (GO and KEGG pathways), our results illustrated that DE exo-lncRNAs in WMH were primarily involved in autophagy, ribosomes, and other functions. Defects in autophagy promote the accumulation of dysfunctional mitochondria, leading to the production of immune-inflammatory mediators[55]. Thus, the BBB and endothelial cell function are further damaged, leading to WMH. Single-cell transcriptomic analysis revealed that ribosomal protein gene expression is regulated in opposite directions between different cell types and neuronal subtypes with aging[56]. Further research revealed that the coexpressed target protein of exo-lnc_011797, WNK1, an autophagy inhibitor[57], was significantly expressed in the WMH group. WNK1 is a known gene associated with brain, some variants were associated with autism, neurodevelopmental disorders, hyperlkalamic hypertension, pseudohypoaldosteronism[58]. The WNK kinases are an atypical family of Serine/threonine kinase that regulate ion transport across cell membranes[59]. Mutations in this gene have been associated with pseudohypoaldosteronism type II and hereditary sensory neuropathy type II[58]. Serine/threonine kinase which plays an important role in the regulation of electrolyte homeostasis, cell signaling, survival, and proliferation, it activates genes that are critical to the brain, including SCNN1A, SCNN1B, SCNN1D, and SGK1[59,60]. Shekarabi et al. reported that nervous system mutations resulting from overexpression of WNK1 lead to neurodegenerative diseases[61]. Other studies have found that WNK1 may be associated with Alzheimer’s disease (AD)[62]. Our sequencing and verification results also found that WNK1 was upregulated in WMH. Therefore, exo-lnc_011797 may regulate WNK1 to affect the occurrence and development of WMH. Another upregulated exosomal lncRNA in WMH, exo-lnc_004326, and its coexpressed target protein RPL18 were also significantly upregulated in WMH. RPL18 is an important component of the large subunit of ribosomes. Studies have suggested that RPL18 deficiency can lead to Diamond-Blackfan anemia through p53 activation and increased JAK2-STAT3 activity[63]. Among its related pathways are Viral mRNA Translation and rRNA processing in the nucleus and cytosol[63]. The proteomic study of mouse WMH model showed that RPL18 may be related to myelination process[64]. Other co-expressed mRNAs have also been found to be associated with central nervous system diseases, for example, PTPN13 is associated with AD, Parkinson's disease and epilepsy[65]. USP45 is a key regulator of DNA repair, and recent studies have found that it is associated with delayed brain development[66]. LCTL plays an important immunosuppressive role in glioma[67]. Therefore, lncRNAs can affect the pathogenesis of WMH through various ways. We constructed lncRNA-mRNA networks to provide a basis for subsequent mechanistic studies.
Furthermore, our study found that exo-lnc_011797 has significant predictive value in the severity and location of WMH. Increased severity of WMH was closely linked to deterioration in memory, attention, executive function, and global cognitive ability[68]. A multicenter study, the Leukoaraiosis and Disability Study (LADIS), followed 600 patients for three years and found that those with severe WMH developed gait and mood disorders, and urinary problems were twice as common compared to those with mild lesions[69]. Studies have revealed that different sites of WMH result from different pathological processes. Ischemia leads to nerve fiber fracture, which results in pathological changes in DWMH[70]. However, PWMH may be due to BBB dysfunction or disruption in the ventricular ependymal lining, resulting in leakage of cerebrospinal fluid into the periventricular white matter[71]. The location of WMH was also correlated with clinical symptoms, such as the degree of dementia[72,73]. In this study, we divided WMH patients into subgroups based on Fazekas grade and WMH site. Analysis of the expression levels of four plasma exo-lncRNAs in different subgroups demonstrated a significant association between exo-lnc_011797 expression and the severity and location of WMH. We observed upregulation of exosomal lnc_011797 in patients with Fazekas 3, so lnc_011797 was correlated with WMH severity. In addition, the expression levels of exo-lnc_011797 were significantly increased in PWMH patients. Therefore, exosomal lnc_011797 may be a predictor and regulator of WMH progression.
In our study a significant number of patients had a history of cigarette smoke, suggesting cigarette smoking as a WMH risk factor, as has previously been suggested[74,75]. The exo-lnc_011797 and exo-lnc_004326 expression could allow the diagnosis of WMH among smokers and no-smokers, arguing about its use in the clinic, favoring health care.
In previous studies, lncRNAs can be used as a diagnostic marker for WMH[27]. However, the diagnostic value of plasma exosomal lncRNAs in WMH and its relationship with the severity of lesions have not been reported in detail. In addition, there are some limitations to this study. The sample size of our study was small, and the study population were from a single center and all were Chinese Han population. Other ethnic groups and larger cohorts are required to verify the diagnostic value of exo-lncRNAs in WMH. Further studies are also needed to investigate the mechanism of exo-lncRNAs in WMH.
-
In conclusion, using high-throughput sequencing and validation of plasma exo-RNAs, we identified two novel exo-lncRNAs with apparent diagnostic value for WMH. Furthermore, exo-lnc_011797 functions as a predictor of WMH severity and location. Our results have diagnostic and predictive value for WMH.
-
Raw data files have been deposited to the Gene Expression Omnibus Database (www.ncbi.nlm.nih.gov/geo/), and the accession number is GSE200473.
-
The authors have stated explicitly that there are no conflicts of interest in connection with this article.
-
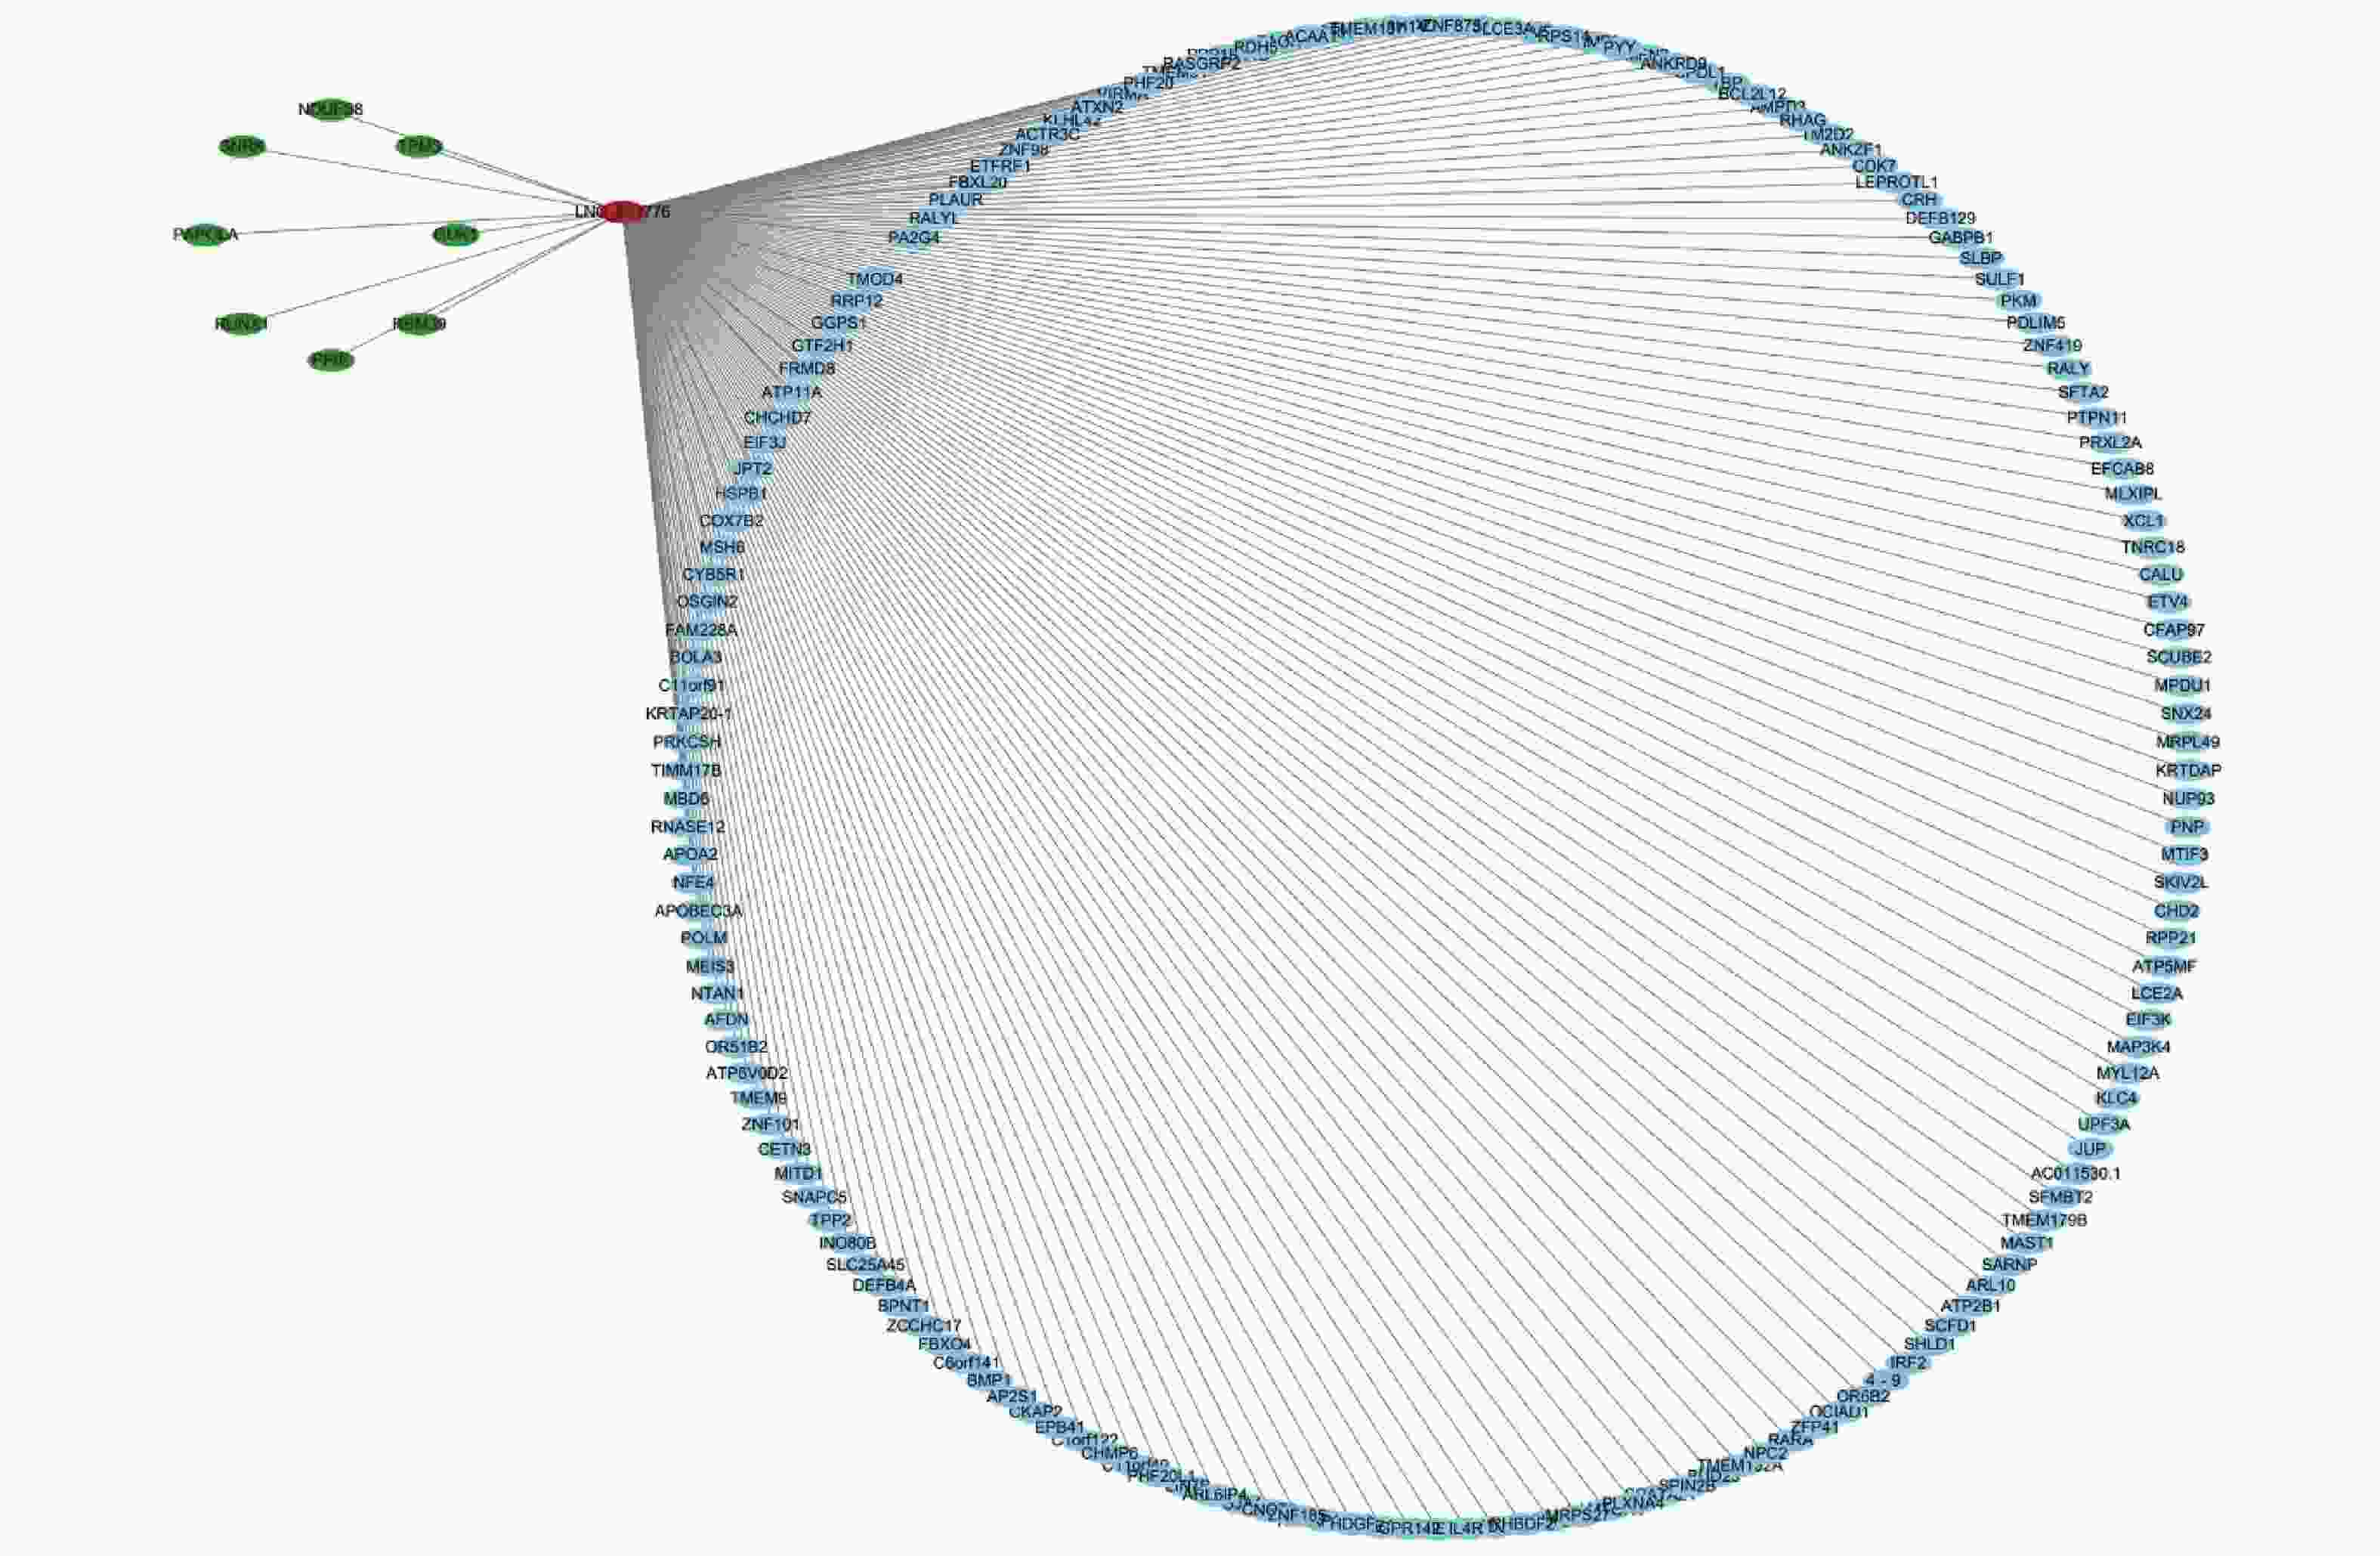
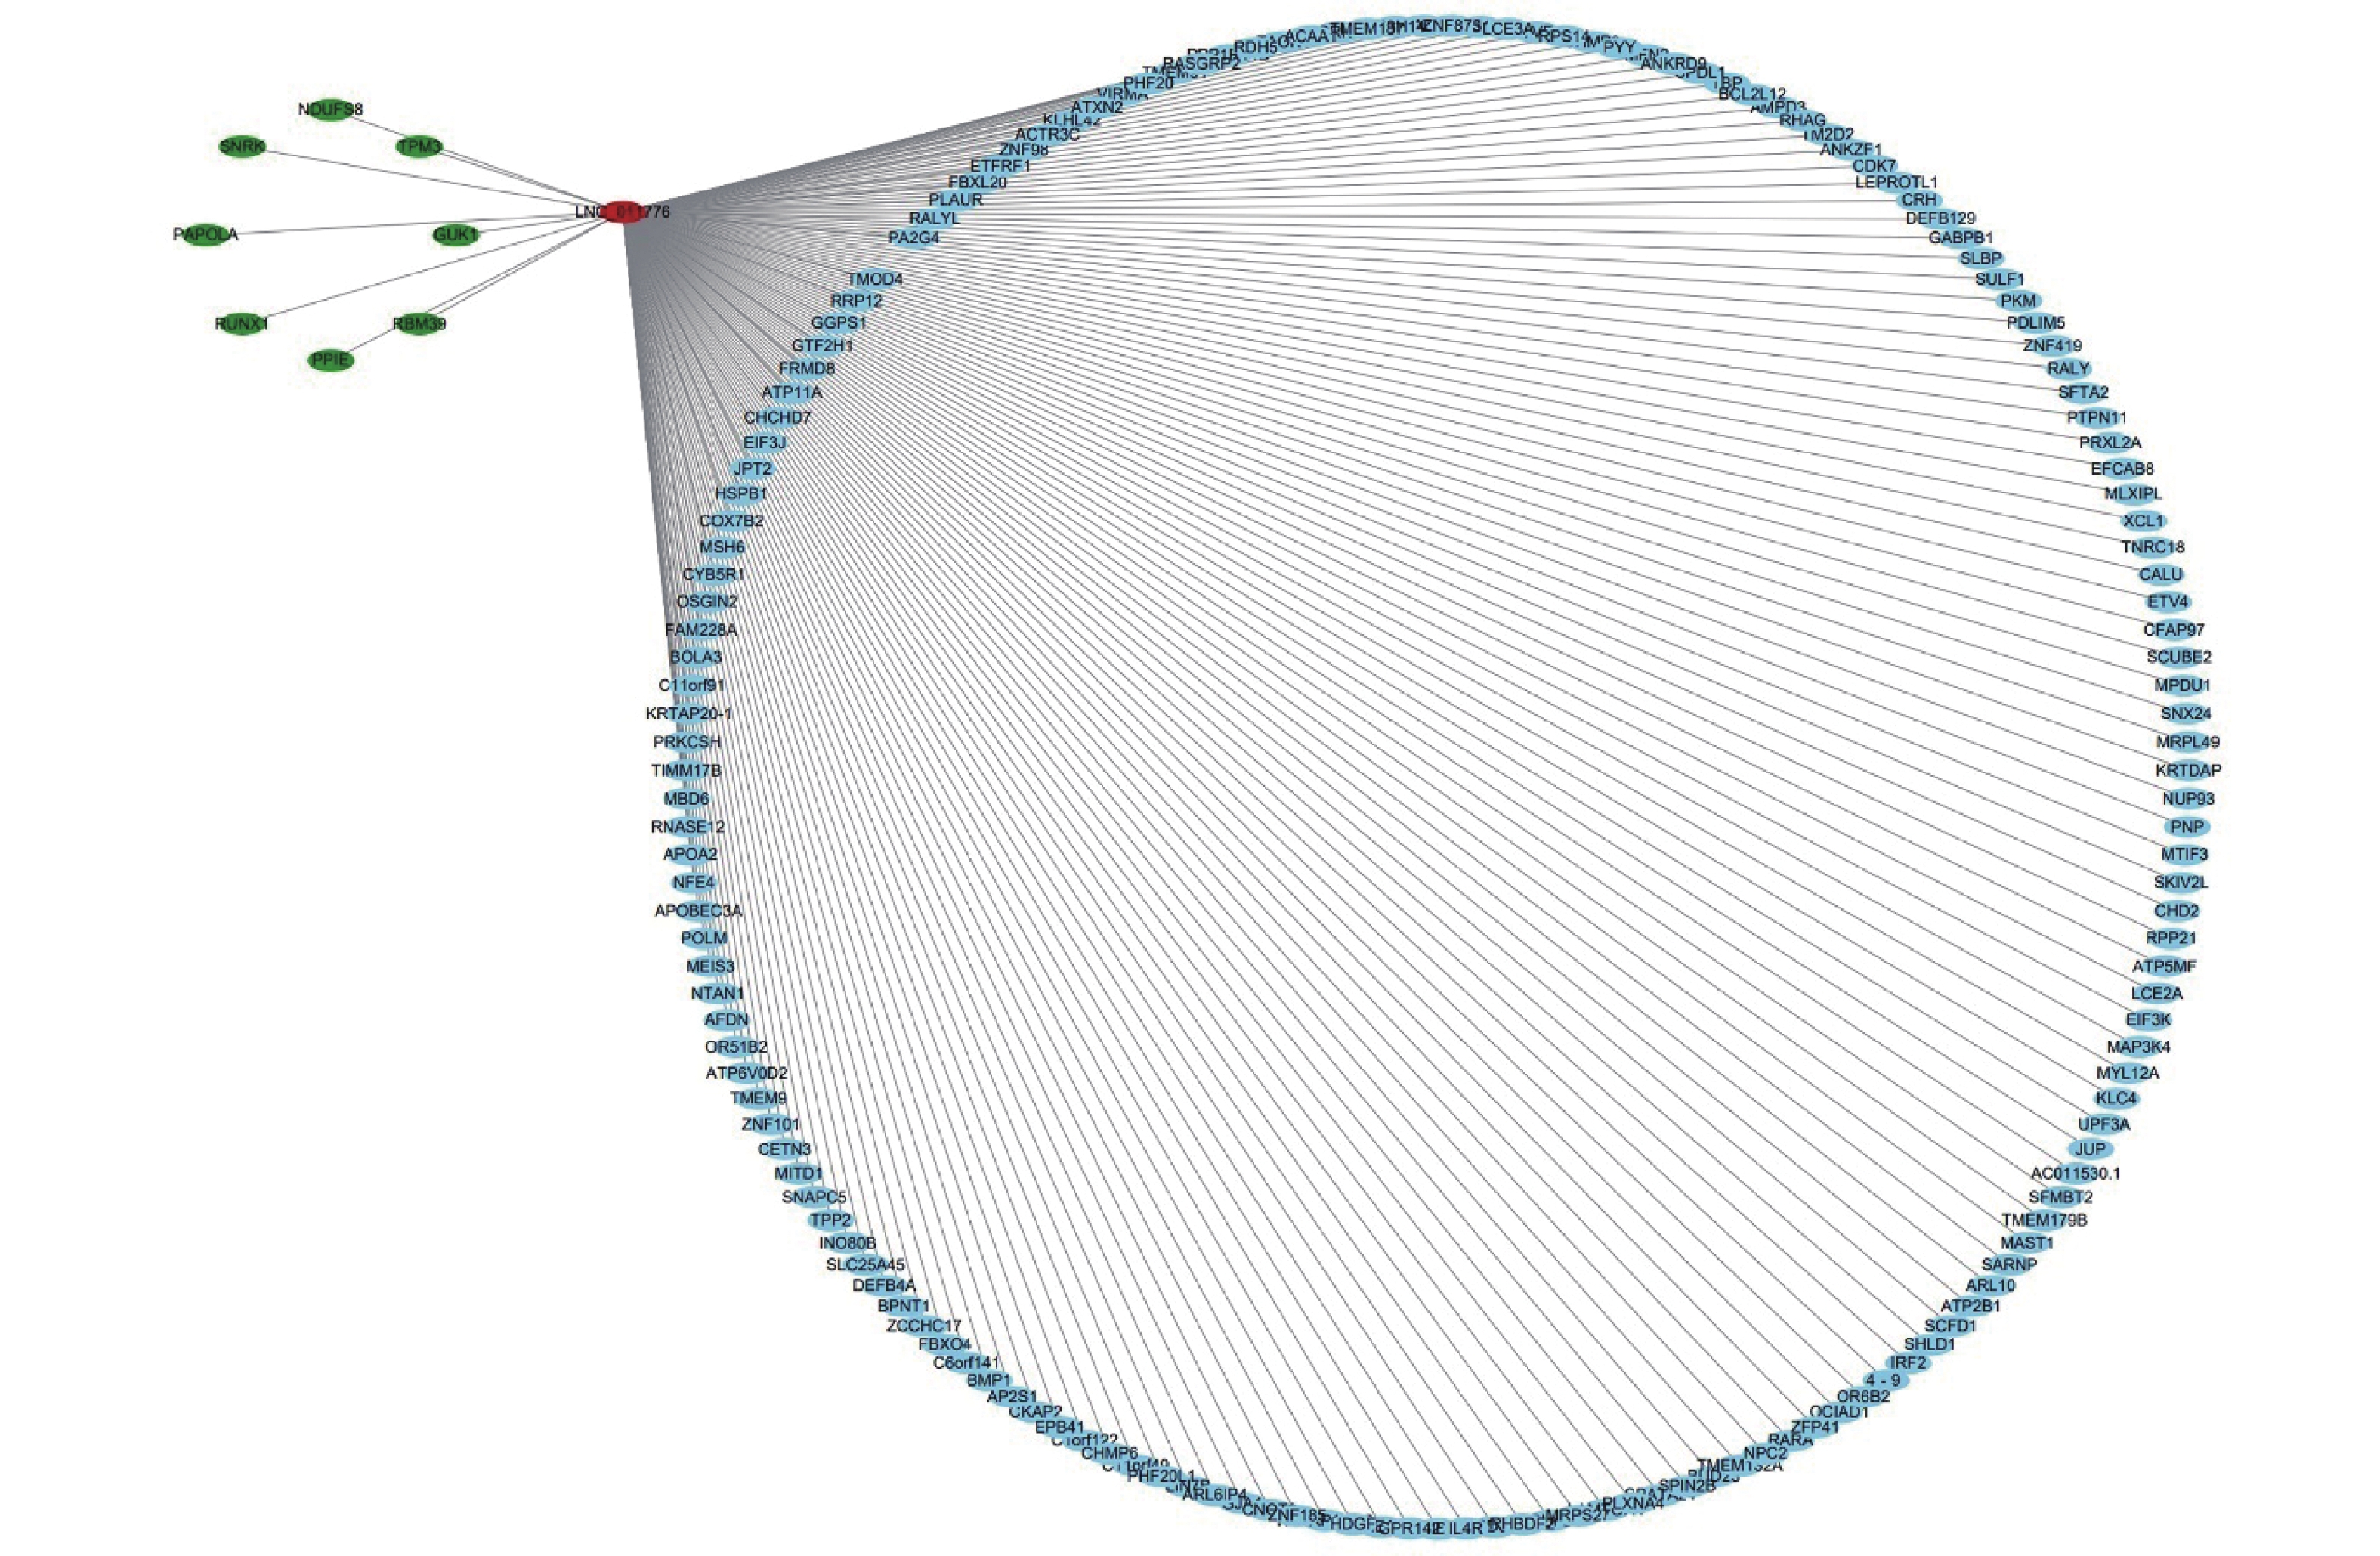
Figure S3. The coexpression of lncRNA-mRNA networks of exo-lnc_011776. Upregulated RNAs are denoted in red, and downregulated RNAs are denoted in green. Blue indicates RNAs that are not differentially expressed.
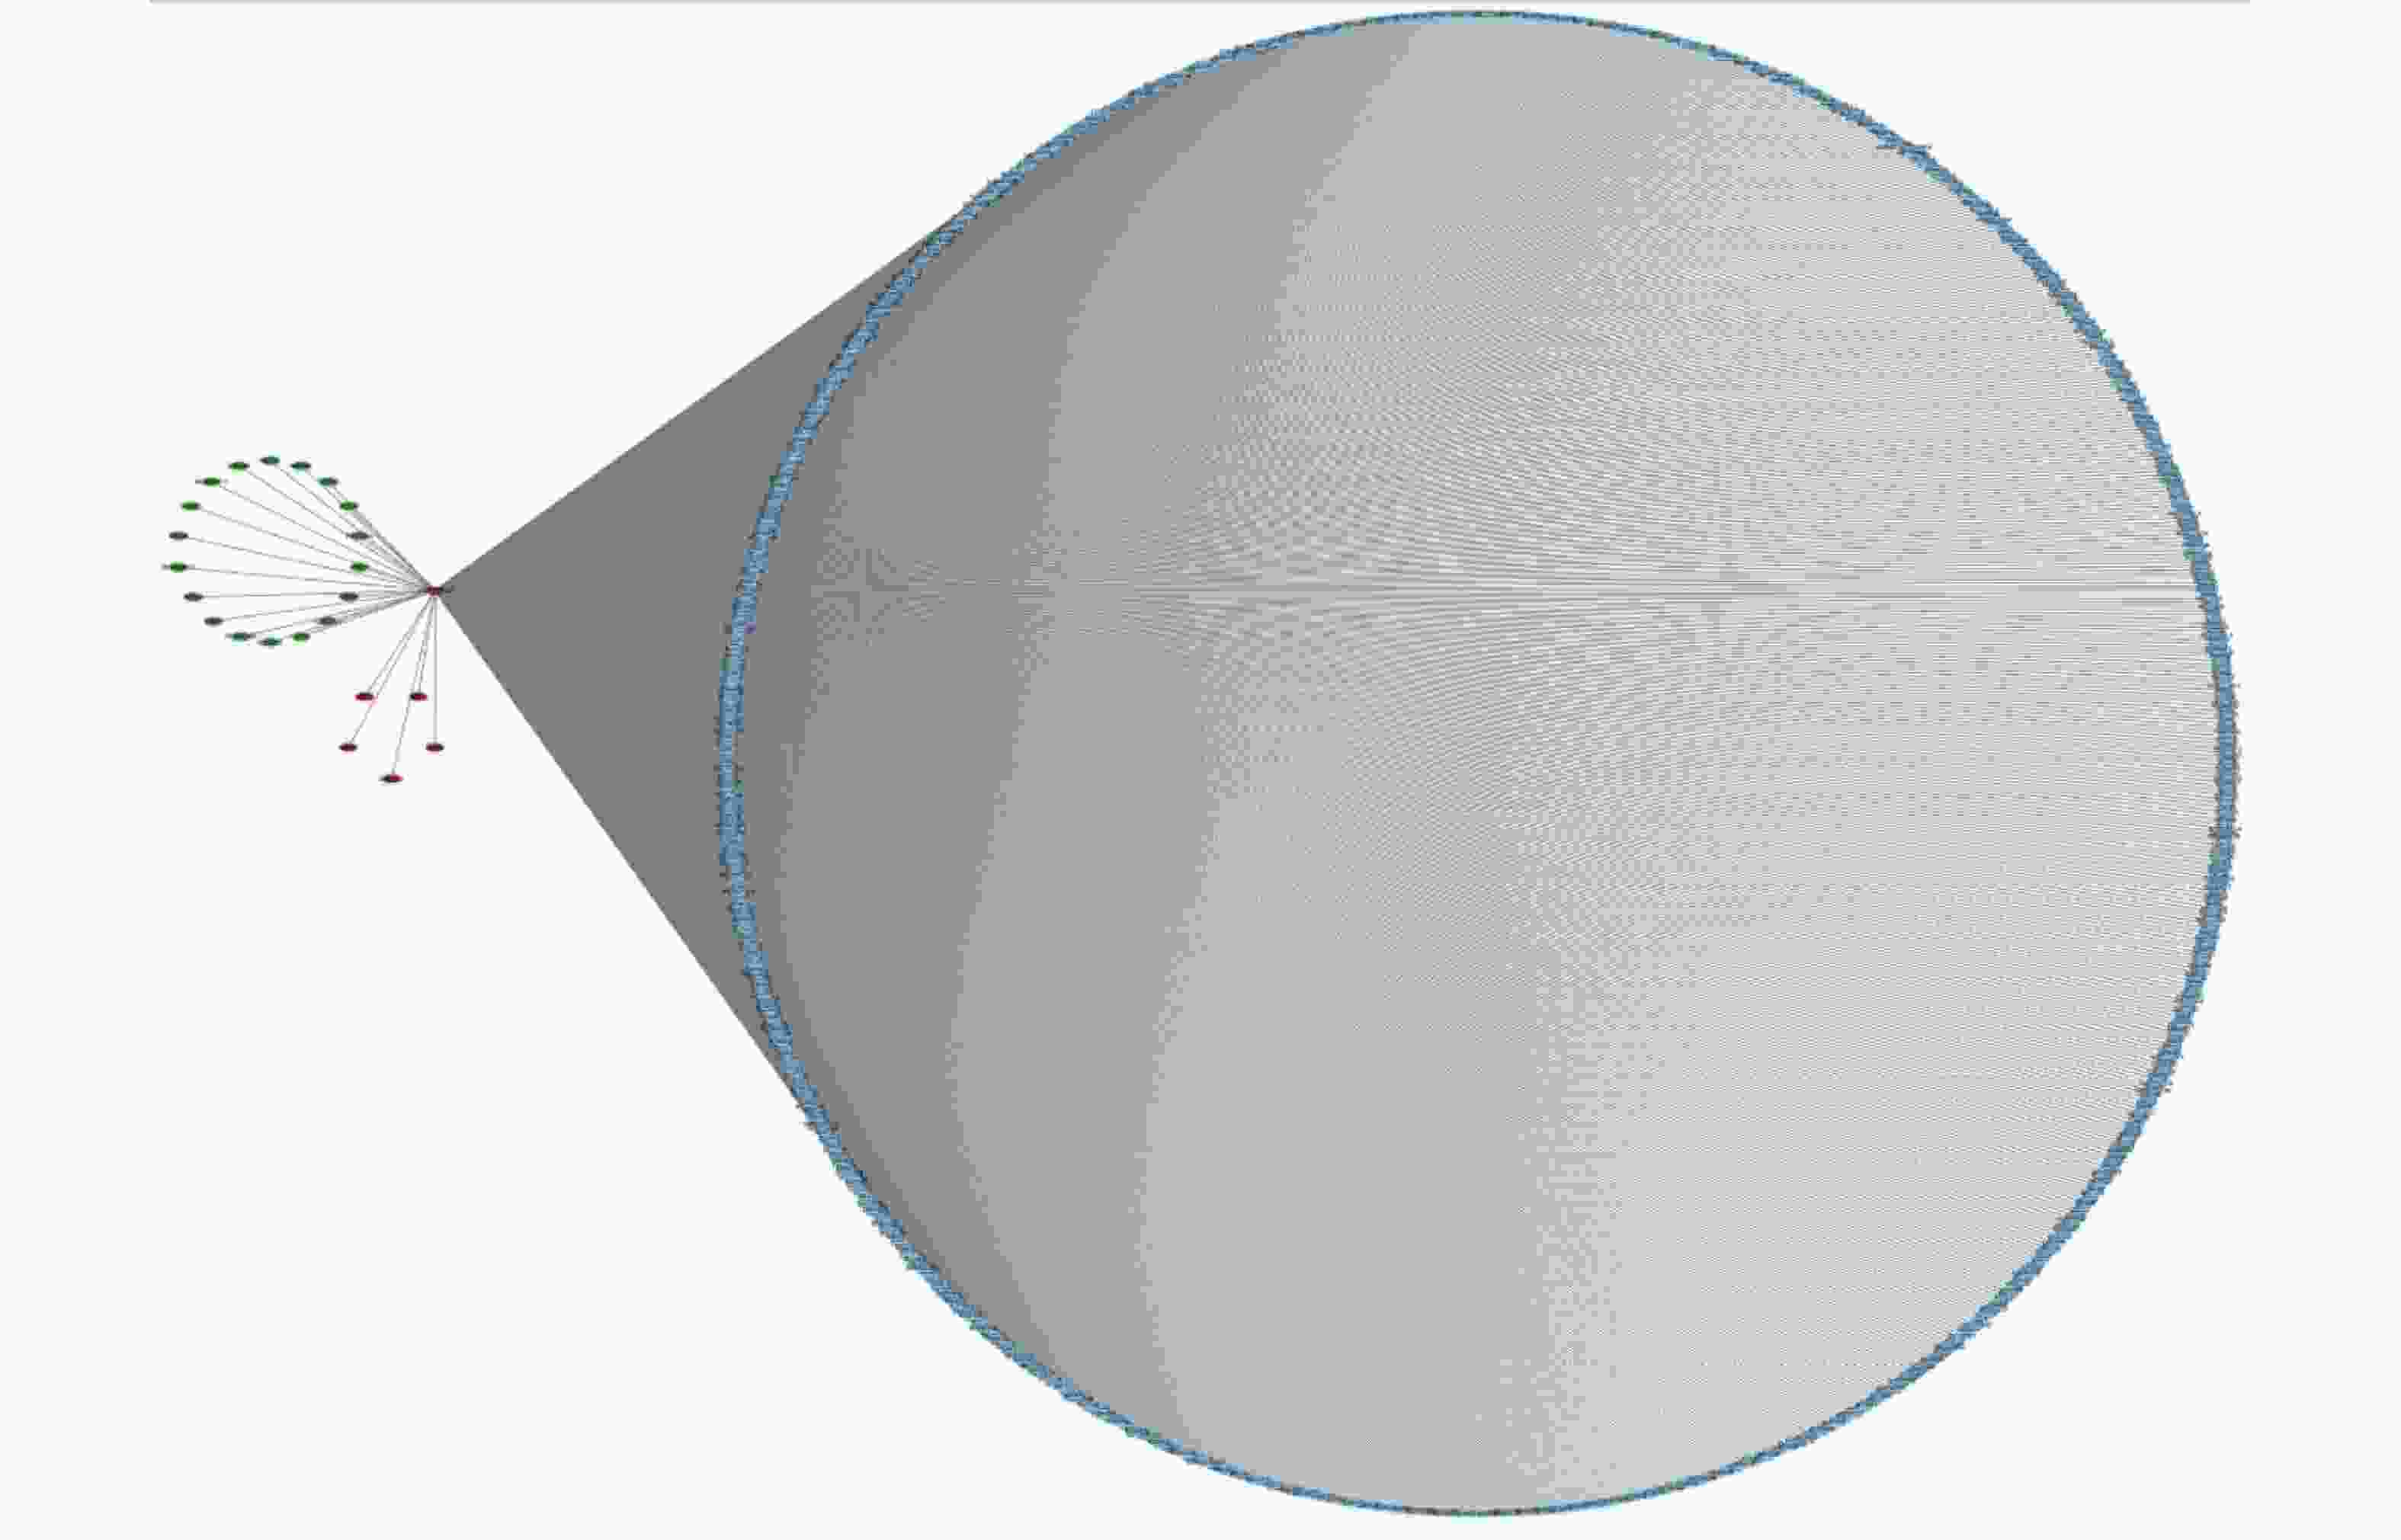
Figure S4. The coexpression of lncRNA-mRNA networks of exo-lnc_004326. Upregulated RNAs are denoted in red, and downregulated RNAs are denoted in green. Blue indicates RNAs that are not differentially expressed.
doi: 10.3967/bes2023.149
Circulating Exosomal LncRNAs as Novel Diagnostic Predictors of Severity and Sites of White Matter Hyperintensities
-
Abstract:
Objective Exosomal long noncoding RNAs (lncRNAs) are the key to diagnosing and treating various diseases. This study aimed to investigate the diagnostic value of plasma exosomal lncRNAs in white matter hyperintensities (WMH). Methods We used high-throughput sequencing to determine the differential expression (DE) profiles of lncRNAs in plasma exosomes from WMH patients and controls. The sequencing results were verified in a validation cohort using qRT-PCR. The diagnostic potential of candidate exosomal lncRNAs was proven by binary logistic analysis and receiver operating characteristic (ROC) curves. The diagnostic value of DE exo-lncRNAs was determined by the area under the curve (AUC). The WMH group was then divided into subgroups according to the Fazekas scale and white matter lesion site, and the correlation of DE exo-lncRNAs in the subgroup was evaluated. Results In our results, four DE exo-lncRNAs were identified, and ROC curve analysis revealed that exo-lnc_011797 and exo-lnc_004326 exhibited diagnostic efficacy for WMH. Furthermore, WMH subgroup analysis showed exo-lnc_011797 expression was significantly increased in Fazekas 3 patients and was significantly elevated in patients with paraventricular matter hyperintensities. Conclusion Plasma exosomal lncRNAs have potential diagnostic value in WMH. Moreover, exo-lnc_011797 is considered to be a predictor of the severity and location of WMH. -
Key words:
- Exosome /
- Long noncoding RNA (lncRNA) /
- White matter hyperintensities (WMH) /
- RNA sequencing /
- Diagnostic performance
The authors have stated explicitly that there are no conflicts of interest in connection with this article.
&These authors contributed equally to this work.
注释:1) AUTHOR CONTRIBUTIONS: 2) COMPETING INTERESTS: -
Figure 1. Identification and characterization of exosomes. (A) TEM image shows that the exosomes are cup-shaped vesicles with round membranes. White arrow indicates typical exosomes. Scale bar = 100 nm; (B) Western blot analysis of exosome protein markers (CD9, CD63, GRP94). Column 1: plasma without exosomes of controls; Column 2: plasma without exosomes of WMH; Column 3: control exosomes; Column 4: WMH exosomes; (C) the size of exosomes ranged from 40 to 160 nm, as revealed by NTA. CK, control.
Figure 2. Workflow and differential expression of exo-lncRNAs. (A) Volcano plot of exo-lncRNAs. (B) Heatmap of exo-lncRNA, where red indicates upregulated RNAs and green indicates downregulated RNAs. GO, Gene Ontology; KEGG, Kyoto Encyclopedia of Genes and Genomes; PPI, Protein-protein Interaction; ROC, receiver operating characteristic; CK, control.
Figure 3. Functional enrichment of differentially expressed exo-lncRNAs. (A, B) Pathways of GO analysis, including biological processes, cell components, and molecular functions. (C, D) Pathways by KEGG analysis shown on a bubble graph. The range of P values corresponds to the dot color, and the dot size indicates the number of genes.
Figure 4. Expression profile of exo-mRNAs. (A) Volcano plot of exo-mRNAs. (B) Heatmap of exo-mRNAs. Red indicates upregulated RNAs, and green indicates downregulated RNAs. CK, control.
Figure 5. Protein-protein interaction networks and submodules of DE mRNAs. (A) PPI network of DE mRNAs. (B) Molecular 1 (score = 16) contains 16 nodes and 120 edges; (C) Molecular 2 (score = 11.048) contains 22 nodes and 116 edges. Upregulated RNAs are denoted in red, and downregulated RNAs are denoted in green.
S2. The coexpression of lncRNA-mRNA networks of exo-lnc_011797. Upregulated RNAs are denoted in red, and downregulated RNAs are denoted in green; Blue indicates RNAs that are not differentially expressed.
S5. The coexpression of lncRNA-mRNA networks of exo-lnc_013222. Upregulated RNAs are denoted in red, and downregulated RNAs are denoted in green. Blue indicates RNAs that are not differentially expressed.
Figure 6. Validation of DE RNAs expression by qRT-PCR. The differential expression of exo-lnc_011797 (A), exo-lnc_011776 (B), exo-lnc_004326 (C), exo-lnc_013222 (D), exo-WNK1 (E), and exo-RPL18 (F) between WMH and controls. *P < 0.05; **P < 0.005; ****P < 0.0001.
Figure 7. ROC curve analyses of exo lncRNAs for the diagnostic efficacy of WMH. The AUC evaluated the diagnostic value of (A) exo-lnc_011797, (B) exo-lnc_004326, and (C) exo-lnc_013222.
Figure 8. Correlation between 4 exosomal lncRNAs and WMH severity. (A–D) The relative expressions of exo-lncRNAs. The expression of exo-lnc_011797 was significantly increased in patients with a Fazekas score of 3. **P < 0.005.
Figure 9. The levels of 4 exosomal lncRNAs in different white matter sites. (A–D) Relative expression of exo-lncRNAs. The expression of exo-lnc_011797 was significantly higher in PWMH patients than in DWMH patients (P = 0.0383). *P < 0.05.
S3. The coexpression of lncRNA-mRNA networks of exo-lnc_011776. Upregulated RNAs are denoted in red, and downregulated RNAs are denoted in green. Blue indicates RNAs that are not differentially expressed.
S4. The coexpression of lncRNA-mRNA networks of exo-lnc_004326. Upregulated RNAs are denoted in red, and downregulated RNAs are denoted in green. Blue indicates RNAs that are not differentially expressed.
Table 1. Primer sequences in the study
Gene Primer sequences 5'–3' Exo-lnc_011776 F: ATTCCCGCAAGTTTGACTCCTTCC R: TCTGGTCCTTGTTCCCGTCTGG Exo-lnc_011797 F: AGGTGGAACGGGTTTAGGGCTAG R: CACTTGGACGAACCAGAGTGTAGC Exo-lnc_004326 F: CTCTGTCAAACCCTGAGCCAACC R: GAGCCGTCTCCACCTCCCATAG Exo-lnc_013222 F: GAAGTCGTGCCTTTCCTGTCCTG R: GTGAGTCCACCTCGCTGAAGATAC Exo-WNK1 F: CGAGTGAGCAGCCAACAGACAG R: TGTGCTTGGACAGTAGAAGGTATATGC Exo-RPL18 F: CCGCCATAACAAGGACCGAAAGG R: TGGTTGAATGTGGAGTTGGTTCTTCTG ACTB F: TGCTGTCACCTTCACCGTTCCA R: GCGGACTATGACTTAGTTGCGTTACA  下载: 导出CSV
Table 2. Basic clinical data of two groups of patients
Variables WMH Control P value Case number 107 104 Age (years) 61.09 ± 12.59 63.65 ± 10.70 0.111 Gender, male, n (%) 50 (46.72) 59 (56.73) 0.146 Hypertension, n (%) 0.109 Yes 76 (71.03) 63 (60.58) No 31 (28.97) 41 (39.42) Diabetes, n (%) 0.098 Yes 31 (28.97) 20 (19.23) No 76 (73.07) 84 (80.77) Smoke, n (%) 0.037* Yes 34 (31.78) 20 (19.23) No 73 (68.22) 84 (80.77) TG (mmol/L) 1.63 ± 0.96 1.37 ± 0.78 0.031* TC (mmol/L) 4.45 ± 1.00 4.28 ± 1.08 0.252 HDL (mmol/L) 1.28 ± 0.43 1.20 ± 0.28 0.099 LDL (mmol/L) 2.55 ± 0.76 2.62 ± 0.84 0.586 Note. *P < 0.05 is considered statistically significant.
下载: 导出CSV
Table 3. Logistic analysis of risk factors associated with WMH
LncRNA expression level Unadjusted Adjusted# OR (95% CI) P OR (95% CI) P Exo-lnc_011797 1.043 (1.013–1.074) 0.004* 1.033 (1.000–1.066) 0.048* Exo-lnc_011776 1.046 (0.994–1.101) 0.082 1.051 (0.991–1.051) 0.098 Exo-lnc_004326 1.075 (1.020–1.132) 0.007* 1.061 (1.061–1.008) 0.022* Exo-lnc_013222 0.494 (0.358–0.680) 0.000* 0.406 (0.277–0.596) 0.000* Note. *P < 0.05 indicates statistical significance. #OR was adjusted for age, sex, hypertension, diabetes, smoking, TG, TC, HDL, and LDL.
下载: 导出CSV
-
[1] Wardlaw JM, Smith C, Dichgans M. Mechanisms of sporadic cerebral small vessel disease: insights from neuroimaging. Lancet Neurol, 2013; 12, 483−97. doi: 10.1016/S1474-4422(13)70060-7 [2] De Silva TM, Faraci FM. Contributions of aging to cerebral small vessel disease. Annu Rev Physiol, 2020; 82, 275−95. doi: 10.1146/annurev-physiol-021119-034338 [3] Pantoni L. Cerebral small vessel disease: from pathogenesis and clinical characteristics to therapeutic challenges. Lancet Neurol, 2010; 9, 689−701. doi: 10.1016/S1474-4422(10)70104-6 [4] Cannistraro RJ, Badi M, Eidelman BH, et al. CNS small vessel disease: A clinical review. Neurology, 2019; 92, 1146−56. doi: 10.1212/WNL.0000000000007654 [5] Wardlaw JM, Smith C, Dichgans M. Small vessel disease: mechanisms and clinical implications. Lancet Neurol, 2019; 18, 684−96. doi: 10.1016/S1474-4422(19)30079-1 [6] Anderson MA, Burda JE, Ren YL, et al. Astrocyte scar formation aids central nervous system axon regeneration. Nature, 2016; 532, 195−200. doi: 10.1038/nature17623 [7] Forsberg KME, Zhang YS, Reiners J, et al. Endothelial damage, vascular bagging and remodeling of the microvascular bed in human microangiopathy with deep white matter lesions. Acta Neuropathol Commun, 2018; 6, 128. doi: 10.1186/s40478-018-0632-z [8] Hainsworth AH, Minett T, Andoh J, et al. Neuropathology of white matter lesions, blood-brain barrier dysfunction, and dementia. Stroke, 2017; 48, 2799−804. doi: 10.1161/STROKEAHA.117.018101 [9] Quick S, Moss J, Rajani RM, et al. A vessel for change: Endothelial dysfunction in cerebral small vessel disease. Trends Neurosci, 2021; 44, 289−305. doi: 10.1016/j.tins.2020.11.003 [10] Solé-Guardia G, Custers E, de Lange A, et al. Association between hypertension and neurovascular inflammation in both normal-appearing white matter and white matter hyperintensities. Acta Neuropathol Commun, 2023; 11, 2. doi: 10.1186/s40478-022-01497-3 [11] Yuyama K, Igarashi Y. Physiological and pathological roles of exosomes in the nervous system. Biomol Concepts, 2016; 7, 53−68. doi: 10.1515/bmc-2015-0033 [12] Venkat P, Zacharek A, Landschoot-Ward J, et al. Exosomes derived from bone marrow mesenchymal stem cells harvested from type two diabetes rats promotes neurorestorative effects after stroke in type two diabetes rats. Exp Neurol, 2020; 334, 113456. doi: 10.1016/j.expneurol.2020.113456 [13] Kalluri R, LeBleu VS. The biology, function, and biomedical applications of exosomes. Science, 2020; 367, eaau6977. doi: 10.1126/science.aau6977 [14] He CJ, Zheng S, Luo Y, et al. Exosome theranostics: Biology and translational medicine. Theranostics, 2018; 8, 237−55. doi: 10.7150/thno.21945 [15] Terstappen GC, Meyer AH, Bell RD, et al. Strategies for delivering therapeutics across the blood-brain barrier. Nat Rev Drug Discov, 2021; 20, 362−83. doi: 10.1038/s41573-021-00139-y [16] Zhang H, Wang SM, Sun M, et al. Exosomes as smart drug delivery vehicles for cancer immunotherapy. Front Immunol, 2023; 13, 1093607. doi: 10.3389/fimmu.2022.1093607 [17] Li H, Ding YN, Huang JY, et al. Angiopep-2 modified exosomes load rifampicin with potential for treating central nervous system tuberculosis. Int J Nanomedicine, 2023; 18, 489−503. doi: 10.2147/IJN.S395246 [18] Robbins PD, Morelli AE. Regulation of immune responses by extracellular vesicles. Nat Rev Immunol, 2014; 14, 195−208. doi: 10.1038/nri3622 [19] Kulshreshtha A, Ahmad T, Agrawal A, et al. Proinflammatory role of epithelial cell–derived exosomes in allergic airway inflammation. J Allergy Clin Immunol, 2013; 131, 1194-203. e14. [20] György B, Szabó TG, Pásztói M, et al. Membrane vesicles, current state-of-the-art: emerging role of extracellular vesicles. Cell Mol Life Sci, 2011; 68, 2667−88. doi: 10.1007/s00018-011-0689-3 [21] Pacheco-Quinto J, Clausen D, Pérez-González R, et al. Intracellular metalloprotease activity controls intraneuronal Aβ aggregation and limits secretion of Aβ via exosomes. FASEB J, 2019; 33, 3758−71. doi: 10.1096/fj.201801319R [22] Jia LF, Zhu M, Kong CJ, et al. Blood neuro-exosomal synaptic proteins predict Alzheimer's disease at the asymptomatic stage. Alzheimers Dement, 2021; 17, 49−60. doi: 10.1002/alz.12166 [23] Han ML, Gu YT, Lu PW, et al. Exosome-mediated lncRNA AFAP1-AS1 promotes trastuzumab resistance through binding with AUF1 and activating ERBB2 translation. Mol Cancer, 2020; 19, 26. [24] Jafarzadeh-Esfehani R, Soudyab M, Parizadeh SM, et al. Circulating exosomes and their role in stroke. Curr Drug Targets, 2020; 21, 89−95. [25] Okazaki Y, Furuno M, Kasukawa T, et al. Analysis of the mouse transcriptome based on functional annotation of 60, 770 full-length cDNAs. Nature, 2002; 420, 563−73. doi: 10.1038/nature01266 [26] Herman AB, Tsitsipatis D, Gorospe M. Integrated lncRNA function upon genomic and epigenomic regulation. Mol Cell, 2022; 82, 2252−66. doi: 10.1016/j.molcel.2022.05.027 [27] Wang WD, Sun P, Han FY, et al. Transcriptome sequencing identifies potential biomarker for white matter lesions diagnosis in the hypertension population. Neurochem Res, 2021; 46, 2079−88. doi: 10.1007/s11064-021-03346-6 [28] Houseley J, Tollervey D. The many pathways of RNA degradation. Cell, 2009; 136, 763−76. doi: 10.1016/j.cell.2009.01.019 [29] Ransohoff JD, Wei YN, Khavari PA. The functions and unique features of long intergenic non-coding RNA. Nat Rev Mol Cell Biol, 2018; 19, 143−57. doi: 10.1038/nrm.2017.104 [30] Zhang S, Wang J, Qu MJ, et al. Novel insights into the potential diagnostic value of circulating exosomal IncRNA-related networks in large artery atherosclerotic stroke. Front Mol Biosci, 2021; 8, 682769. doi: 10.3389/fmolb.2021.682769 [31] Zheng R, Du ML, Wang XW, et al. Exosome-transmitted long non-coding RNA PTENP1 suppresses bladder cancer progression. Mol Cancer, 2018; 17, 143. doi: 10.1186/s12943-018-0880-3 [32] Jin HQ, Ding ZJ, Lian SQ, et al. Prevalence and risk factors of white matter lesions in tibetan patients without acute stroke. Stroke, 2020; 51, 149−53. doi: 10.1161/STROKEAHA.119.027115 [33] Li Y, Li M, Zhang XY, et al. Higher blood-brain barrier permeability is associated with higher white matter hyperintensities burden. J Neurol, 2017; 264, 1474−81. doi: 10.1007/s00415-017-8550-8 [34] Steingart A, Hachinski VC, Lau C, et al. Cognitive and neurologic findings in subjects with diffuse white matter lucencies on computed tomographic scan (leuko-araiosis). Arch Neurol, 1987; 44, 32−5. doi: 10.1001/archneur.1987.00520130024012 [35] Fazekas F, Chawluk JB, Alavi A, et al. MR signal abnormalities at 1.5 T in Alzheimer's dementia and normal aging. AJR Am J Roentgenol, 1987; 149, 351−6. doi: 10.2214/ajr.149.2.351 [36] Wang TT, Jin AM, Fu Y, et al. Heterogeneity of white matter hyperintensities in cognitively impaired patients with cerebral small vessel disease. Front Immunol, 2021; 12, 803504. doi: 10.3389/fimmu.2021.803504 [37] Lobb RJ, Becker M, Wen SW, et al. Optimized exosome isolation protocol for cell culture supernatant and human plasma. J Extracell Vesicles, 2015; 4, 27031. doi: 10.3402/jev.v4.27031 [38] Zhang HT, Chen GH, Qiu WJ, et al. Plasma endothelial microvesicles and their carrying miRNA-155 serve as biomarkers for ischemic stroke. J Neurosci Res, 2020; 98, 2290−301. doi: 10.1002/jnr.24696 [39] Théry C, Witwer KW, Aikawa E, et al. Minimal information for studies of extracellular vesicles 2018 (MISEV2018): a position statement of the International Society for Extracellular Vesicles and update of the MISEV2014 guidelines. J Extracell Vesicles, 2018; 7, 1535750. doi: 10.1080/20013078.2018.1535750 [40] Cordonnier M, Nardin C, Chanteloup G, et al. Tracking the evolution of circulating exosomal-PD-L1 to monitor melanoma patients. J Extracell Vesicles, 2020; 9, 1710899. doi: 10.1080/20013078.2019.1710899 [41] Zhan Y, Du LT, Wang LS, et al. Expression signatures of exosomal long non-coding RNAs in urine serve as novel non-invasive biomarkers for diagnosis and recurrence prediction of bladder cancer. Mol Cancer, 2018; 17, 142. doi: 10.1186/s12943-018-0893-y [42] Min L, Zhu ST, Chen L, et al. Evaluation of circulating small extracellular vesicles derived miRNAs as biomarkers of early colon cancer: a comparison with plasma total miRNAs. J Extracell Vesicles, 2019; 8, 1643670. doi: 10.1080/20013078.2019.1643670 [43] Tian SL, Zhou XM, Phuntsok T, et al. Genomic analyses reveal genetic adaptations to tropical climates in chickens. iScience, 2020; 23, 101644. doi: 10.1016/j.isci.2020.101644 [44] Han XY, Cai L, Shi YM, et al. Integrated analysis of long non-coding RNA -mRNA profile and validation in diabetic cataract. Curr Eye Res, 2022; 47, 382−90. doi: 10.1080/02713683.2021.1984536 [45] Naghsh-Nilchi A, Ghahnavieh LE, Dehghanian F. Construction of miRNA-lncRNA-mRNA co-expression network affecting EMT-mediated cisplatin resistance in ovarian cancer. J Cell Mol Med, 2022; 26, 4530−47. doi: 10.1111/jcmm.17477 [46] Kopp F, Mendell JT. Functional classification and experimental dissection of long noncoding RNAs. Cell, 2018; 172, 393−407. doi: 10.1016/j.cell.2018.01.011 [47] Ørom UA, Derrien T, Beringer M, et al. Long noncoding RNAs with enhancer-like function in human cells. Cell, 2010; 143, 46−58. doi: 10.1016/j.cell.2010.09.001 [48] Statello L, Guo CJ, Chen LL, et al. Gene regulation by long non-coding RNAs and its biological functions. Nat Rev Mol Cell Biol, 2021; 22, 96−118. doi: 10.1038/s41580-020-00315-9 [49] Chen SC, Wang MD, Yang H, et al. LncRNA TUG1 sponges microRNA-9 to promote neurons apoptosis by up-regulated Bcl2l11 under ischemia. Biochem Biophys Res Commun, 2017; 485, 167−73. doi: 10.1016/j.bbrc.2017.02.043 [50] Yu L, Qian S, Wei S. Identification of a noncoding RNA-mediated gene pair-based regulatory module in Alzheimer's disease. Mol Med Rep, 2018; 18, 2164−70. [51] Nojima T, Proudfoot NJ. Mechanisms of lncRNA biogenesis as revealed by nascent transcriptomics. Nat Rev Mol Cell Biol, 2022; 23, 389−406. [52] Zhang S, Wang X, Yin RH, et al. Circulating exosomal lncRNAs as predictors of risk and unfavorable prognosis for large artery atherosclerotic stroke. Clin Transl Med, 2021; 11, e555. doi: 10.1002/ctm2.555 [53] Mao Q, Liang XL, Zhang CL, et al. LncRNA KLF3-AS1 in human mesenchymal stem cell-derived exosomes ameliorates pyroptosis of cardiomyocytes and myocardial infarction through miR-138-5p/Sirt1 axis. Stem Cell Res Ther, 2019; 10, 393. doi: 10.1186/s13287-019-1522-4 [54] Merheb E, Cui MH, DuBois JC, et al. Defective myelination in an RNA polymerase III mutant leukodystrophic mouse. Proc Natl Acad Sci USA, 2021; 118, e2024378118. doi: 10.1073/pnas.2024378118 [55] Li TM, Huang YN, Cai W, et al. Age-related cerebral small vessel disease and inflammaging. Cell Death Dis, 2020; 11, 932. doi: 10.1038/s41419-020-03137-x [56] Ximerakis M, Lipnick SL, Innes BT, et al. Single-cell transcriptomic profiling of the aging mouse brain. Nat Neurosci, 2019; 22, 1696−708. doi: 10.1038/s41593-019-0491-3 [57] Gallolu Kankanamalage S, Lee AY, Wichaidit C, et al. WNK1 is an unexpected autophagy inhibitor. Autophagy, 2017; 13, 969−70. doi: 10.1080/15548627.2017.1286431 [58] Siew K, O'Shaughnessy KM. Extrarenal roles of the with‐no‐lysine[K] kinases (WNKs). Clin Exp Pharmacol Physiol, 2013; 40, 885-94. [59] Gallolu Kankanamalage S, Lee AY, Wichaidit C, et al. Multistep regulation of autophagy by WNK1. Proc Natl Acad Sci USA, 2016; 113, 14342−7. doi: 10.1073/pnas.1617649113 [60] Hanukoglu I, Hanukoglu A. Epithelial sodium channel (ENaC) family: Phylogeny, structure–function, tissue distribution, and associated inherited diseases. Gene, 2016; 579, 95−132. doi: 10.1016/j.gene.2015.12.061 [61] Shekarabi M, Girard N, Rivière JB, et al. Mutations in the nervous system-specific HSN2 exon of WNK1 cause hereditary sensory neuropathy type II. J Clin Invest, 2008; 118, 2496−505. [62] Puthiyedth N, Riveros C, Berretta R, et al. Identification of differentially expressed genes through integrated study of Alzheimer’s disease affected brain regions. PLoS One, 2016; 11, e0152342. doi: 10.1371/journal.pone.0152342 [63] Chen C, Lu MJ, Lin S, et al. The nuclear gene rpl18 regulates erythroid maturation via JAK2-STAT3 signaling in zebrafish model of Diamond-Blackfan anemia. Cell Death Dis, 2020; 11, 135. doi: 10.1038/s41419-020-2331-5 [64] Gat‐Viks I, Geiger T, Barbi M, et al. Proteomics‐level analysis of myelin formation and regeneration in a mouse model for Vanishing White Matter disease. J Neurochem, 2015; 134, 513−26. doi: 10.1111/jnc.13142 [65] He YT, Nan D, Wang HM. Role of non-receptor-type tyrosine phosphatases in brain-related diseases. Mol Neurobiol, 2023; 60, 6530−41. doi: 10.1007/s12035-023-03487-5 [66] Okazaki T, Kawaguchi T, Saiki Y, et al. Clinical course of a Japanese patient with developmental delay linked to a small 6q16.1 deletion. Hum Genome Var, 2022; 9, 14. doi: 10.1038/s41439-022-00194-w [67] Su J, Ma QQ, Long WY, et al. LCTL Is a prognostic biomarker and correlates with stromal and immune infiltration in gliomas. Front Oncol, 2019; 9, 1083. doi: 10.3389/fonc.2019.01083 [68] Benedictus MR, van Harten AC, Leeuwis AE, et al. White matter hyperintensities relate to clinical progression in subjective cognitive decline. Stroke, 2015; 46, 2661−4. doi: 10.1161/STROKEAHA.115.009475 [69] Benisty S, Gouw AA, Porcher R, et al. Location of lacunar infarcts correlates with cognition in a sample of non-disabled subjects with age-related white-matter changes: the LADIS study. J Neurol Neurosurg Psychiatry, 2009; 80, 478−83. doi: 10.1136/jnnp.2008.160440 [70] Fazekas F, Kleinert R, Offenbacher H, et al. Pathologic correlates of incidental MRI white matter signal hyperintensities. Neurology, 1993; 43, 1683−9. doi: 10.1212/WNL.43.9.1683 [71] Schmidt R, Schmidt H, Haybaeck J, et al. Heterogeneity in age-related white matter changes. Acta Neuropathol, 2011; 122, 171−85. doi: 10.1007/s00401-011-0851-x [72] De Groot JC, De Leeuw FE, Oudkerk M, et al. Periventricular cerebral white matter lesions predict rate of cognitive decline. Ann Neurol, 2002; 52, 335−41. doi: 10.1002/ana.10294 [73] Dadar M, Maranzano J, Ducharme S, et al. White matter in different regions evolves differently during progression to dementia. Neurobiol Aging, 2019; 76, 71−9. doi: 10.1016/j.neurobiolaging.2018.12.004 [74] Kim SH, Yun CH, Lee SY, et al. Age-dependent association between cigarette smoking on white matter hyperintensities. Neurol Sci, 2012; 33, 45−51. doi: 10.1007/s10072-011-0617-1 [75] Gray JC, Thompson M, Bachman C, et al. Associations of cigarette smoking with gray and white matter in the UK Biobank. Neuropsychopharmacology, 2020; 45, 1215−22. doi: 10.1038/s41386-020-0630-2 -
 23211+Supplementary Materials.pdf

-

 点击查看大图
计量
- 文章访问数: 675
- HTML全文浏览量: 278
- PDF下载量: 45
- 被引次数: 0

 Quick Links