

 下载:
下载:


-
Microwave-related devices are commonly used. A certain dose of microwave might induce cognitive injuries[1]. The frequency of mobile 4G communication and wireless networks is located in the L-band and C-band range, respectively. We found that the accumulative exposure group, exposed to 1.5 GHz and 4.3 GHz microwaves, was more severely damaged than the single exposure group, indicated by prolonged average escape latency and structural damage to the hippocampus[2].
The proteomic analysis of the hippocampus in the accumulative microwave exposure was discussed in our previous work[3]. However, whole-transcriptome sequencing, especially of messenger RNAs (mRNAs) and long non-coding RNAs (lncRNAs), for identifying sensitive markers of microwave-induced brain changes has not been reported.
Sixteen male Wistar rats 200 ± 20 g were divided into four groups. The groups, microwave exposure methods, and specific absorption rate (SAR) values are shown in Supplementary Table S1 (available in www.besjournal.com). All experiments were designed and reported according to the Animal Research: Reporting of In Vivo Experiments (ARRIVE) guidelines. Details of microwave exposure systems have been given in previous studies [4].
Table S1. Experimental groups and exposure to microwave radiation
Group Average power density of
L-band microwavesAverage power density of
C-band microwavesSAR (W/kg) S* 0 mW/cm2 0 mW/cm2 0 L10 10 mW/cm2 for 6 min 0 mW/cm2 3.7 C10 0 mW/cm2 10 mW/cm2 for 6 min 3.3 LC10# 10 mW/cm2 for 6 min 10 mW/cm2 for 6 min 3.7 for 6 min + 3.3 for 6 min Note. *The rats in the sham radiation group were placed in polypropylene cages and placed on the radiation table for 6 min without microwave exposure. #The rats in the LC10 groups were first radiated with L-band microwave radiation for 6 min and then immediately radiated with C-band microwave radiation for 6 min. The sham group and exposure group. The sham group and exposure groups adopt the same settings, and the sham group did not give microwave exposure. The experiment of the sham group and exposure groups were not conducted in parallel. At 6 h after accumulative exposure, hippocampal samples were extracted, and transcriptome sequencing was performed following the recommended protocol. The remaining RNA of each sample after sequencing was used for qRT-PCR. Supplementary Table S2 (available in www.besjournal.com) shows the primer sequences used in the qRT-PCR.
Table S2. Primer sequences of differentially expressed lncRNAs and mRNAs
Transcripts and gene names Primer sequences MSTRG.1068.1 (NA) Forward (F) CTCGGGAGAAAGGGTATGTGAG Reverse (R) TGGTGAGCGGGCATTTTAG ENSRNOT00000002044 (Napa) Forward (F) TGAAGGAGTGGGTGCAATGT Reverse (R) ATAAATGGCGGGGTGAAGG MSTRG.27033.1 (Slc24a2) Forward (F) GTGTGTGTGTGTGTTCAAGGAATAA Reverse (R) AGCAAGCCAGTCCCTATTAAGAAA ENSRNOT00000083373 (Slc24a2) Forward (F) GTCCACACCCAGTCCACCTT Reverse (R) GGCATCAAACCCTATCAAATCTTC MSTRG.31953.1 (Pdgfb) Forward (F) AGACGCTTGGAGTAGAGACAGGA Reverse (R) TACGTGAGTCTGGGAGGGGTAG ENSRNOT00000023196 (Pdgfb) Forward (F) GAATACTTTCAGGCAGGCTAGGG Reverse (R) AAGGGACAGGGAGAGATGAGTG ENSRNOT00000023066 (Syngr1) Forward (F) TGTCAAGGACCGCAAGAAAG Reverse (R) CAGAAACCCACGAACCAGAAG MSTRG.35922.1 (Dlgap1) Forward (F) GCACCATCGCTCACAGACA Reverse (R) CCTTGTAAACCCCTCCTCCAC ENSRNOT00000022351 (Dlgap1) Forward (F) TCACCAAAGTTCCGCTCCA Reverse (R) CTGTCCGTTCACCTCCATCTC Data were presented as mean and standard deviation. The data were subjected to two-way analysis variance using the software SPSS version 19. Differences at P < 0.05 were considered to be significant.
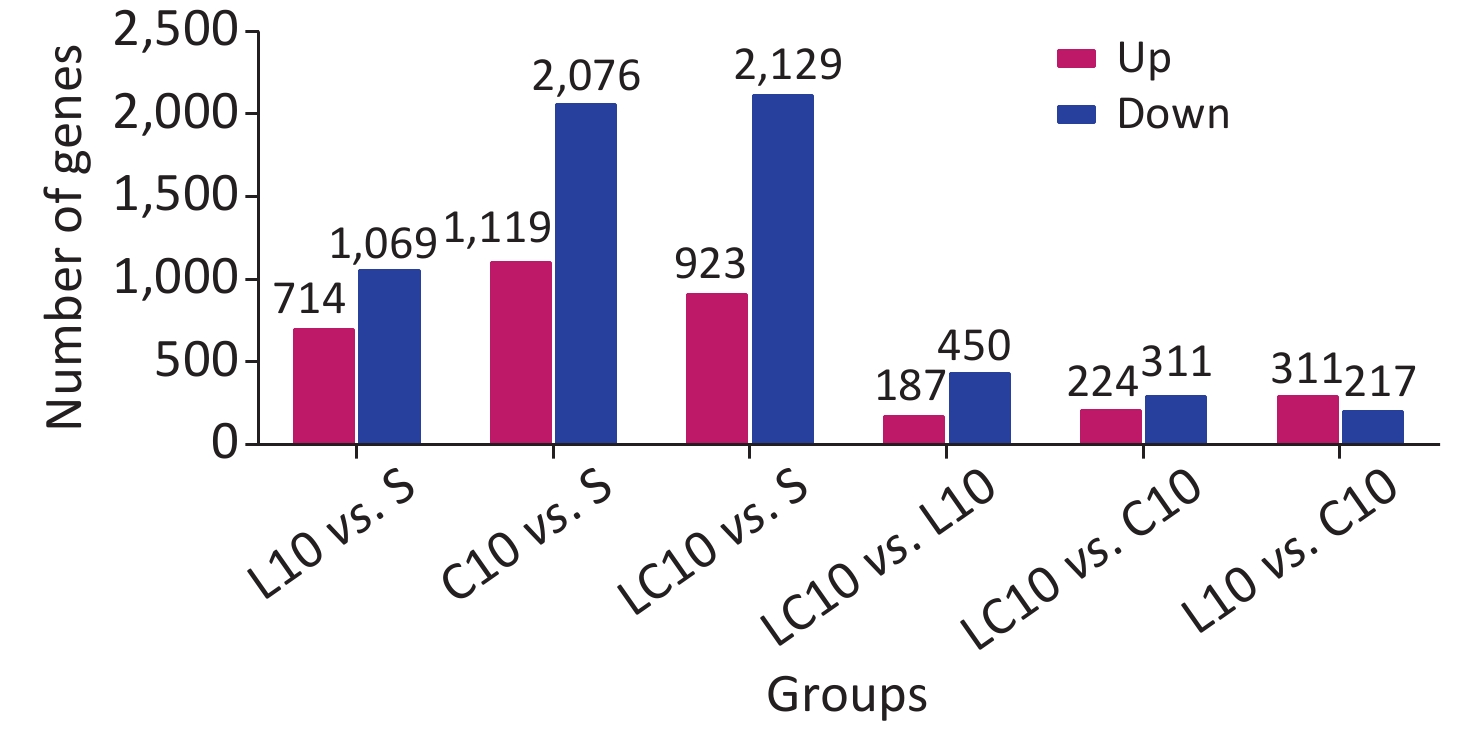
The mRNAs exhibiting significant differences in expression between the two groups were counted and are shown in Supplementary Figure S1 (available in www.besjournal.com). Compared to the S group, 714 mRNAs were upregulated, and 1,069 mRNAs were downregulated in the L10 group. In the C10 group, 1,119 mRNAs were upregulated, and 2,076 were downregulated. In the LC10 group, 923 mRNAs were upregulated, and 2,129 were downregulated.

Figure S1. Differentially expressed mRNAs in the sham and microwave exposure groups.
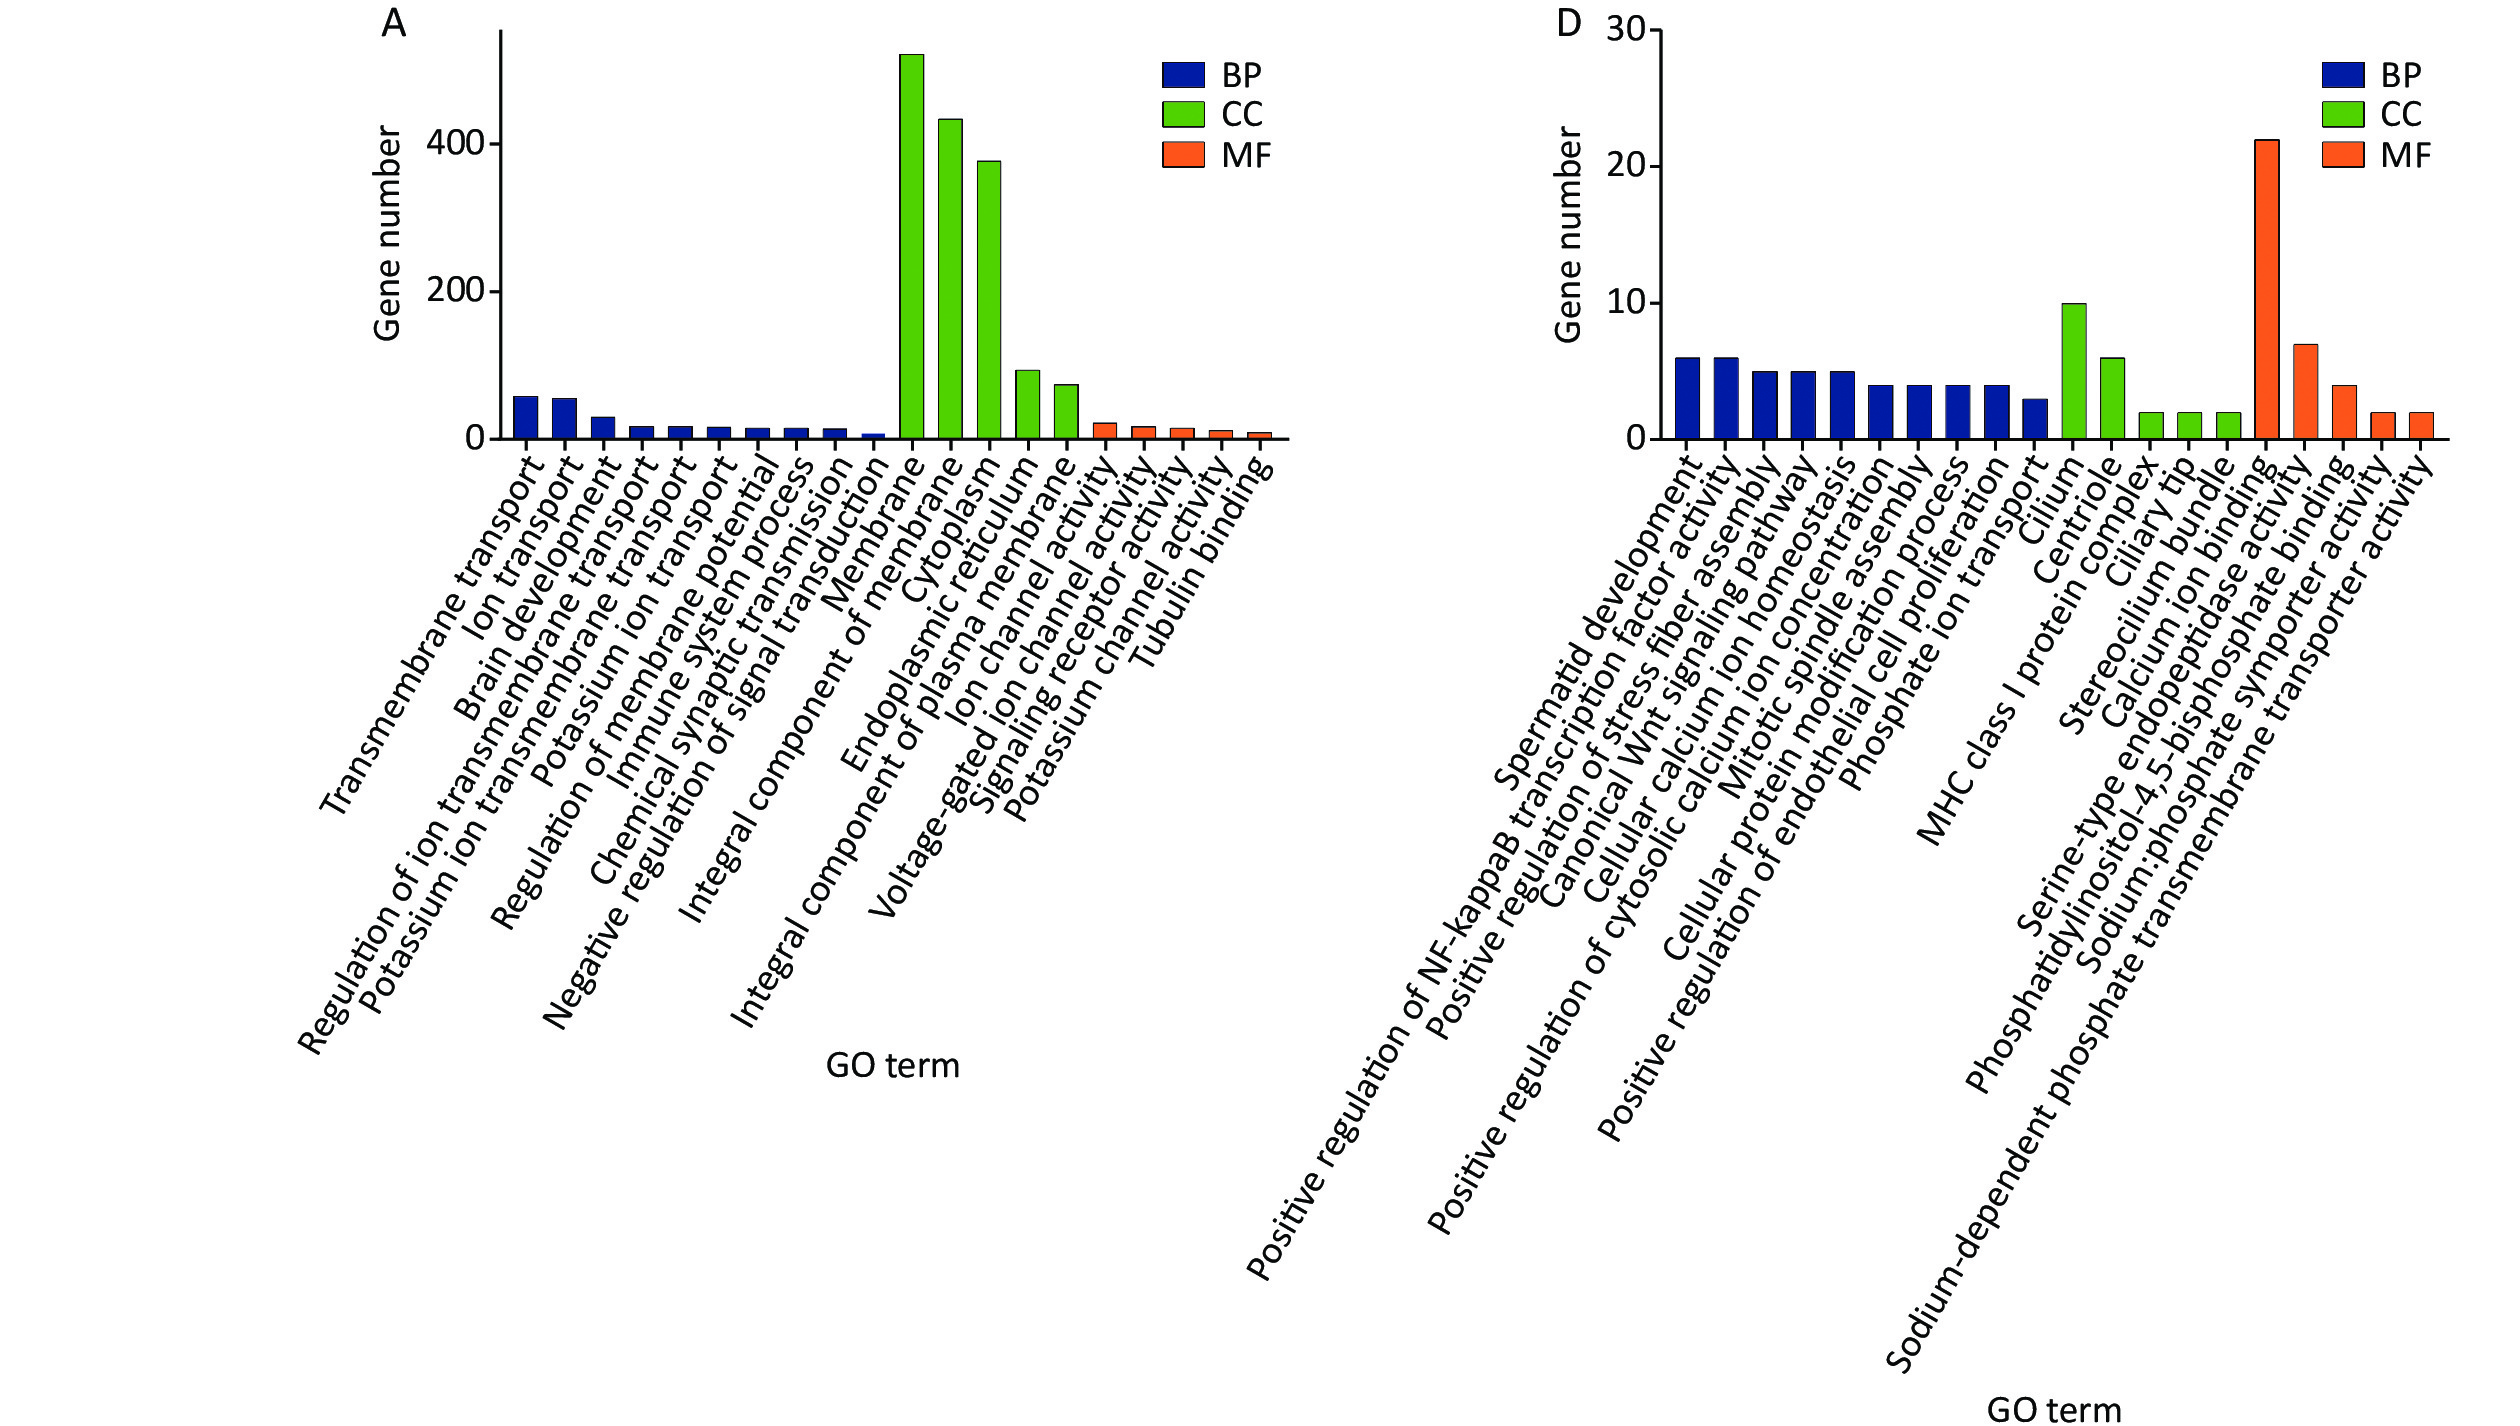
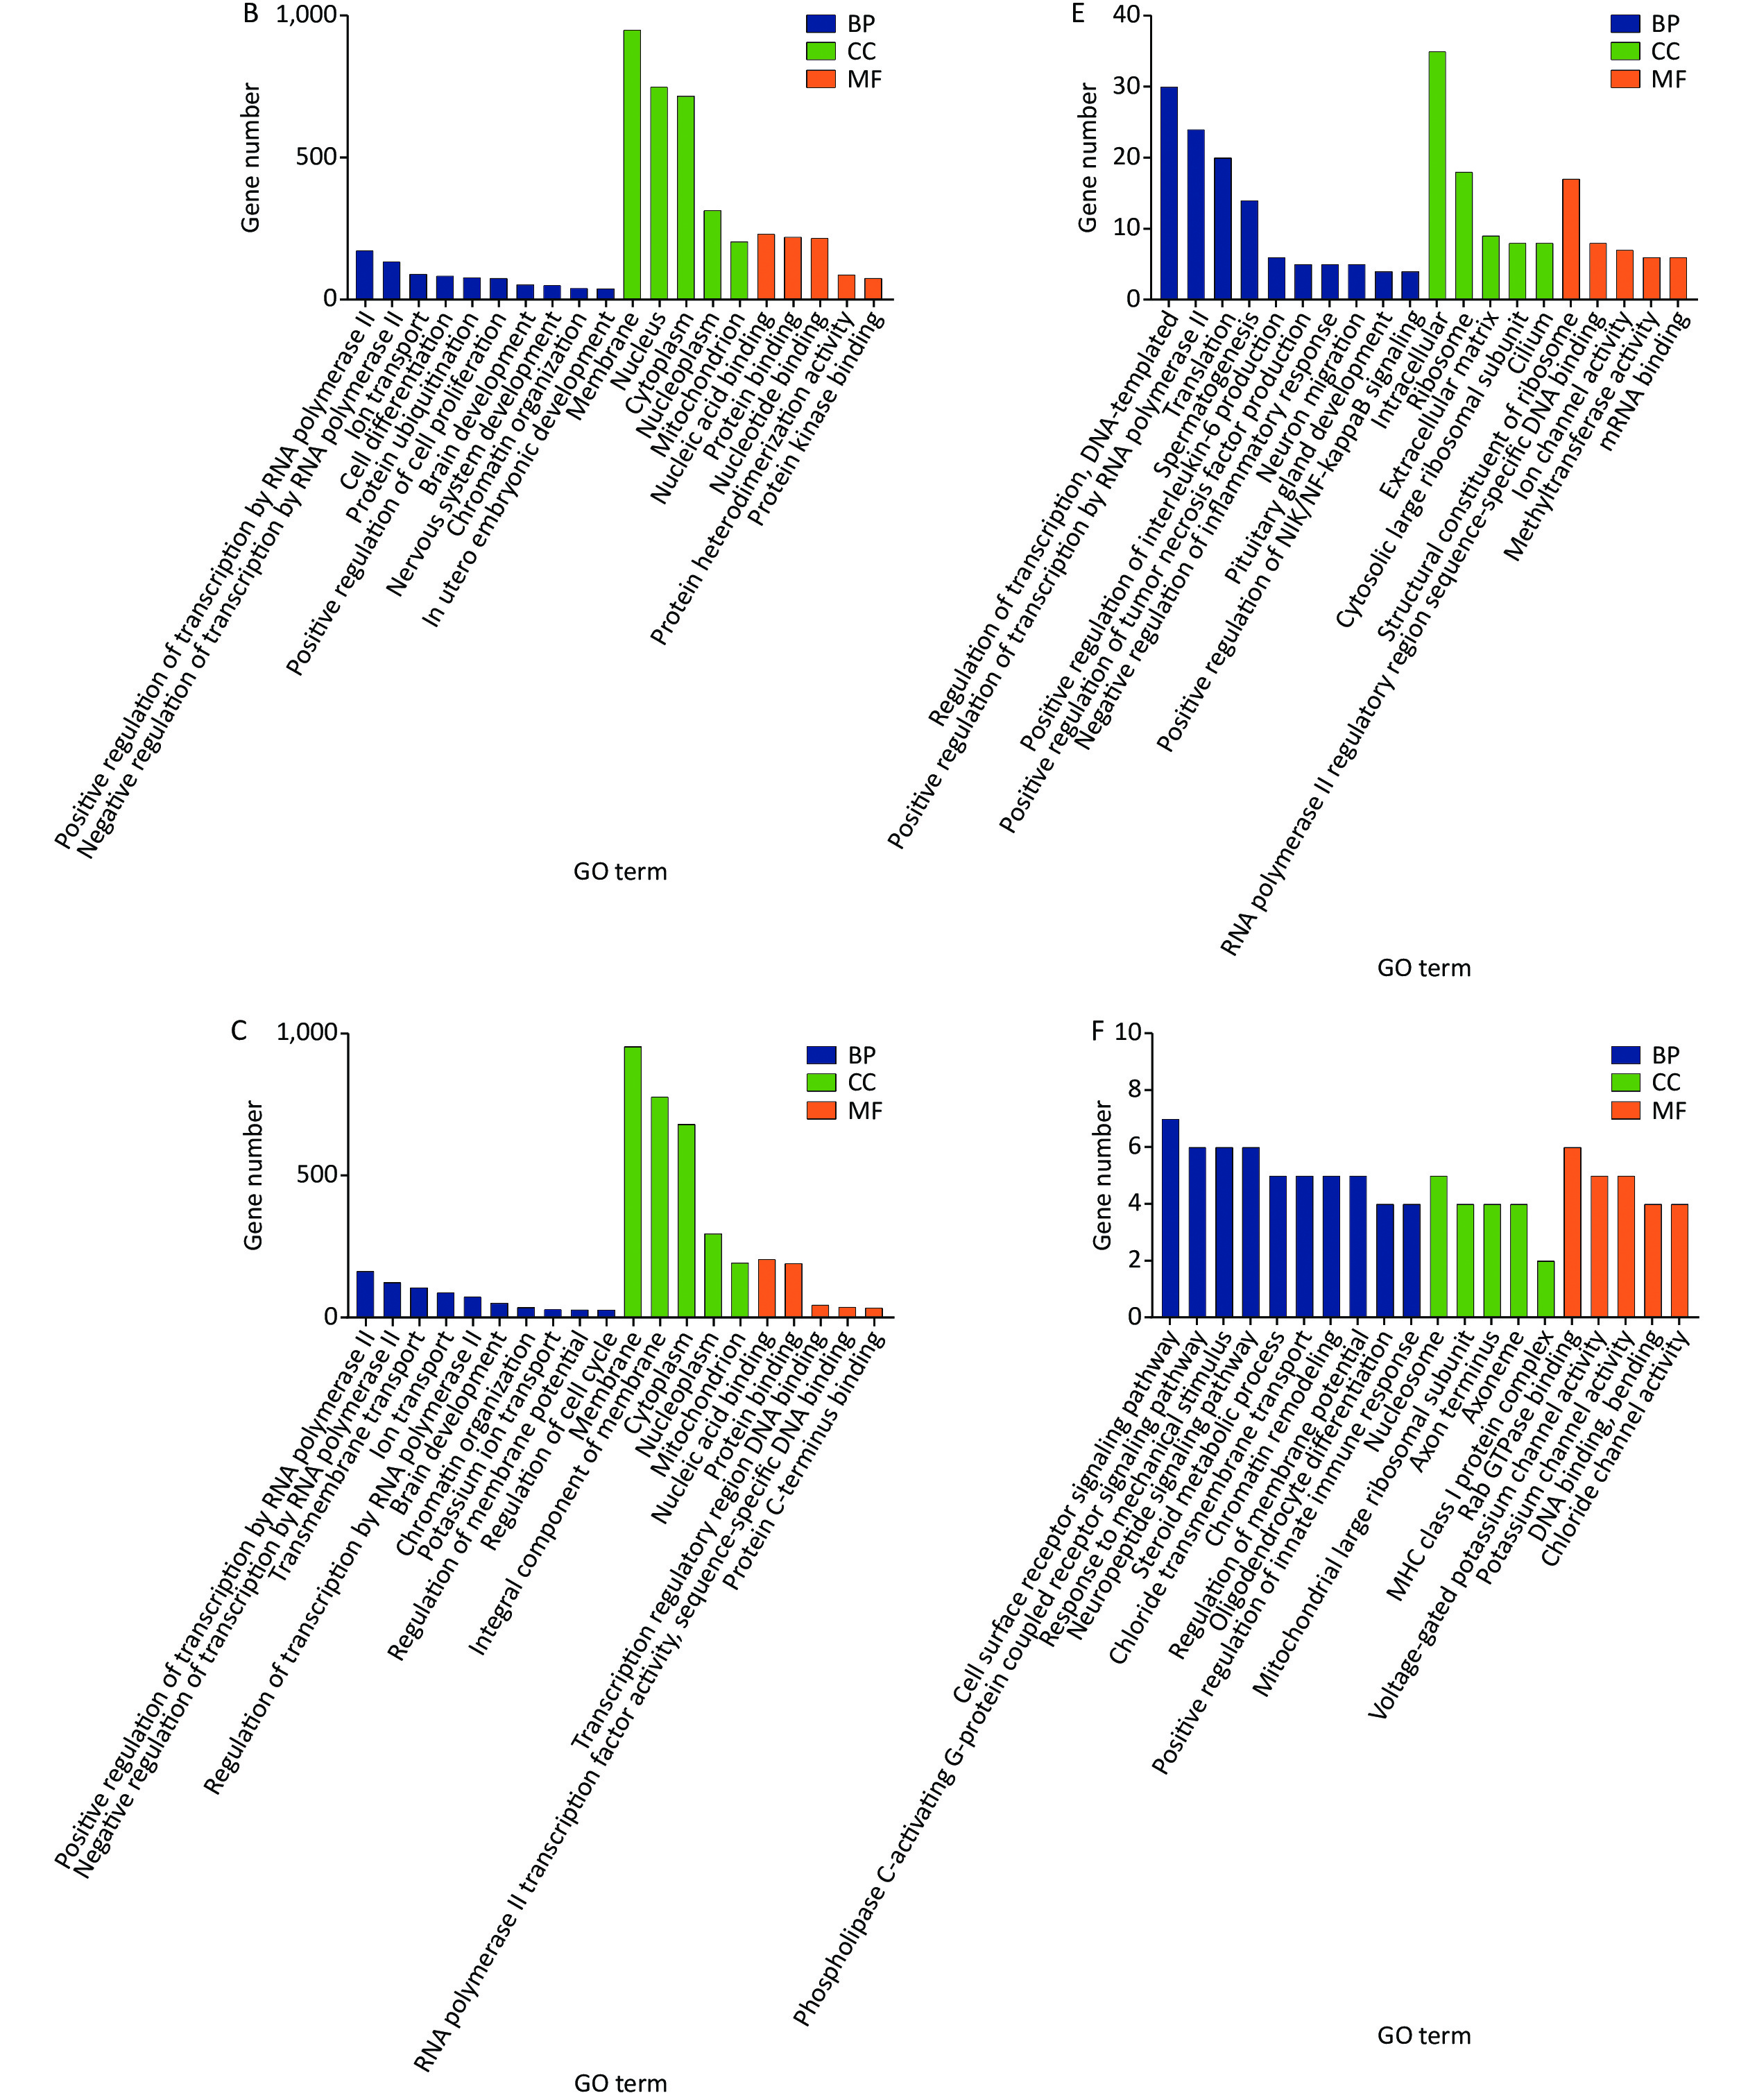
Gene ontology (GO) and Kyoto Encyclopedia of Genes and Genomes (KEGG) pathway analyzes were performed to search for possible biological processes related to cognitive changes. Following the GO functional enrichment analysis, the distribution of differentially expressed mRNAs in various biological processes, cellular components, and molecular functions was determined in the exposure groups relative to the S group. For the biological processes, differentially expressed mRNAs in the three exposure groups were mainly associated with positive regulation of transcription by RNA polymerase II, negative regulation of transcription by RNA polymerase II, transmembrane transport, ion transport, and brain development (Figure 1A, 1B, and 1C). Differential expression of mRNAs induced by microwave exposure was mainly located in the membrane, nucleus, cytoplasm, and mitochondrion (Figure 1A, 1B, and 1C). The molecular functions of differentially expressed mRNAs included nucleic acid binding, protein binding, and ion channel activity (Figure 1A, 1B, and 1C). KEGG pathway analysis suggested that glutamatergic synapse, mitogen-activated protein kinase signaling pathway, cAMP signaling pathway, and RNA degradation were involved in the differential expression of mRNAs in the S group and exposure groups (Figure 2A, 2B, and 2C). The biological processes, cellular components, molecular functions, and KEGG pathways between the LC10 group and L10 group are shown in Figures 1D and 2D. Figures 1E and 2E show the GO analysis and KEGG pathways of differentially expressed mRNAs between the LC10 and C10 groups. The differentially expressed mRNAs between the L10 and C10 groups were analyzed and are shown in Figures 1F and 2F.
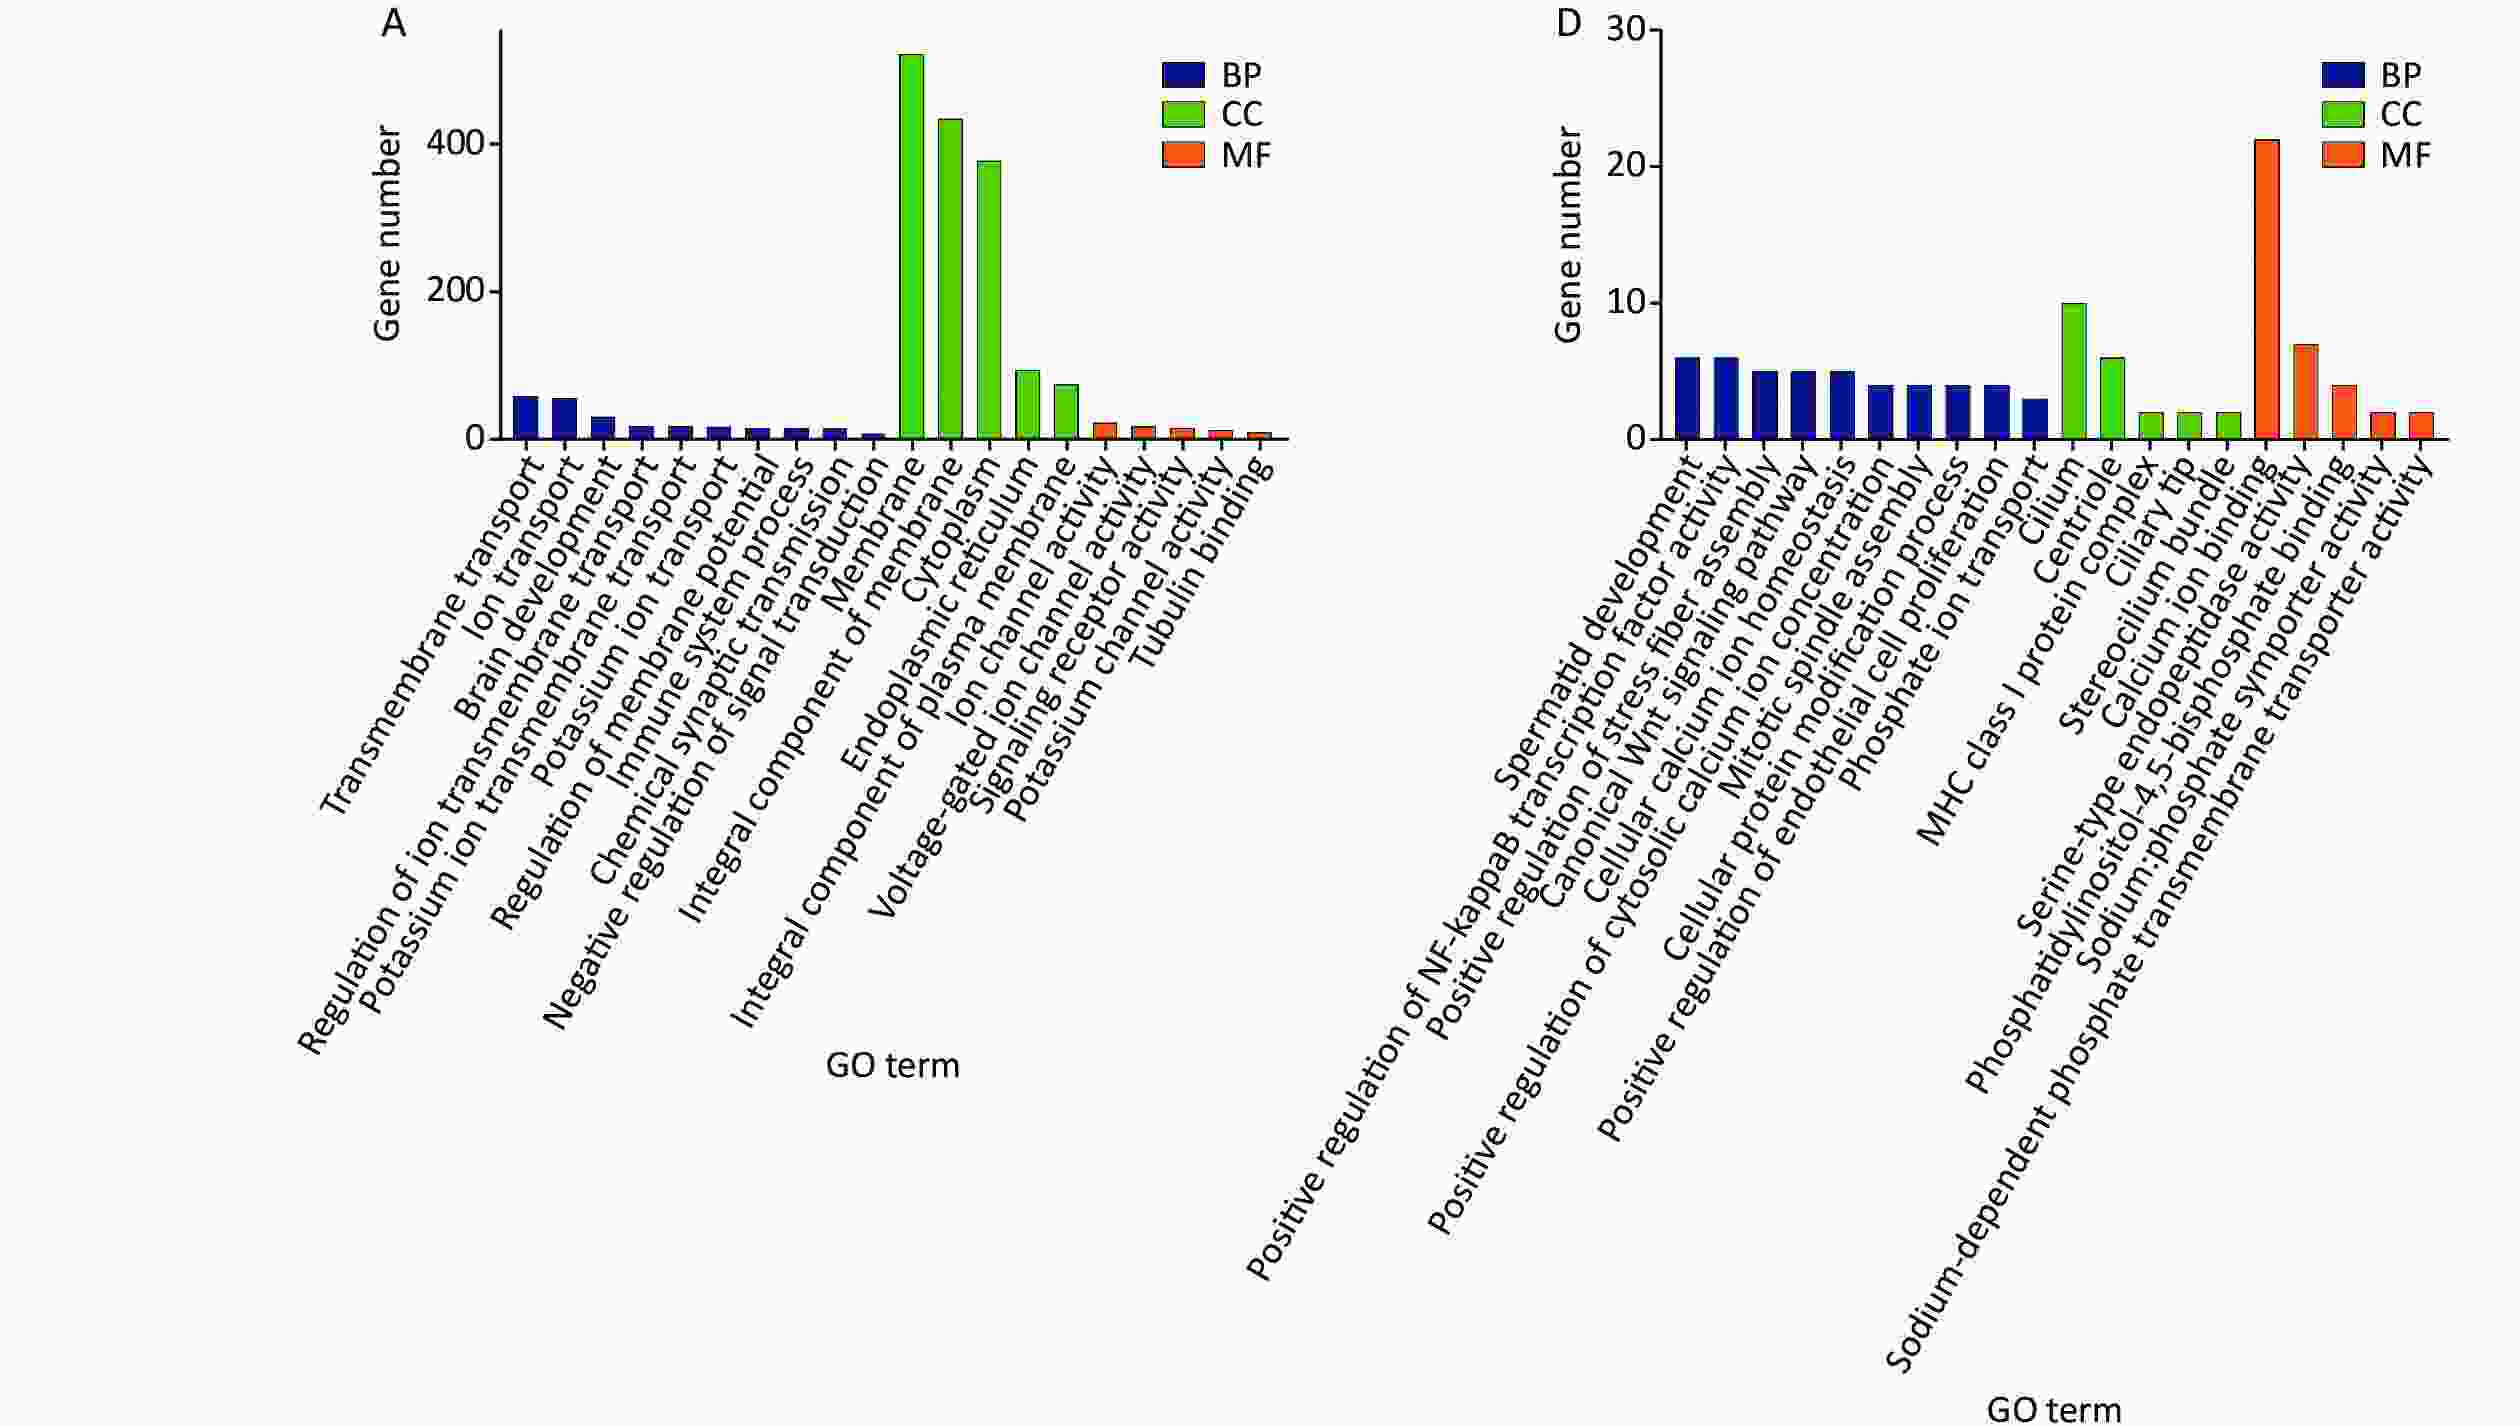
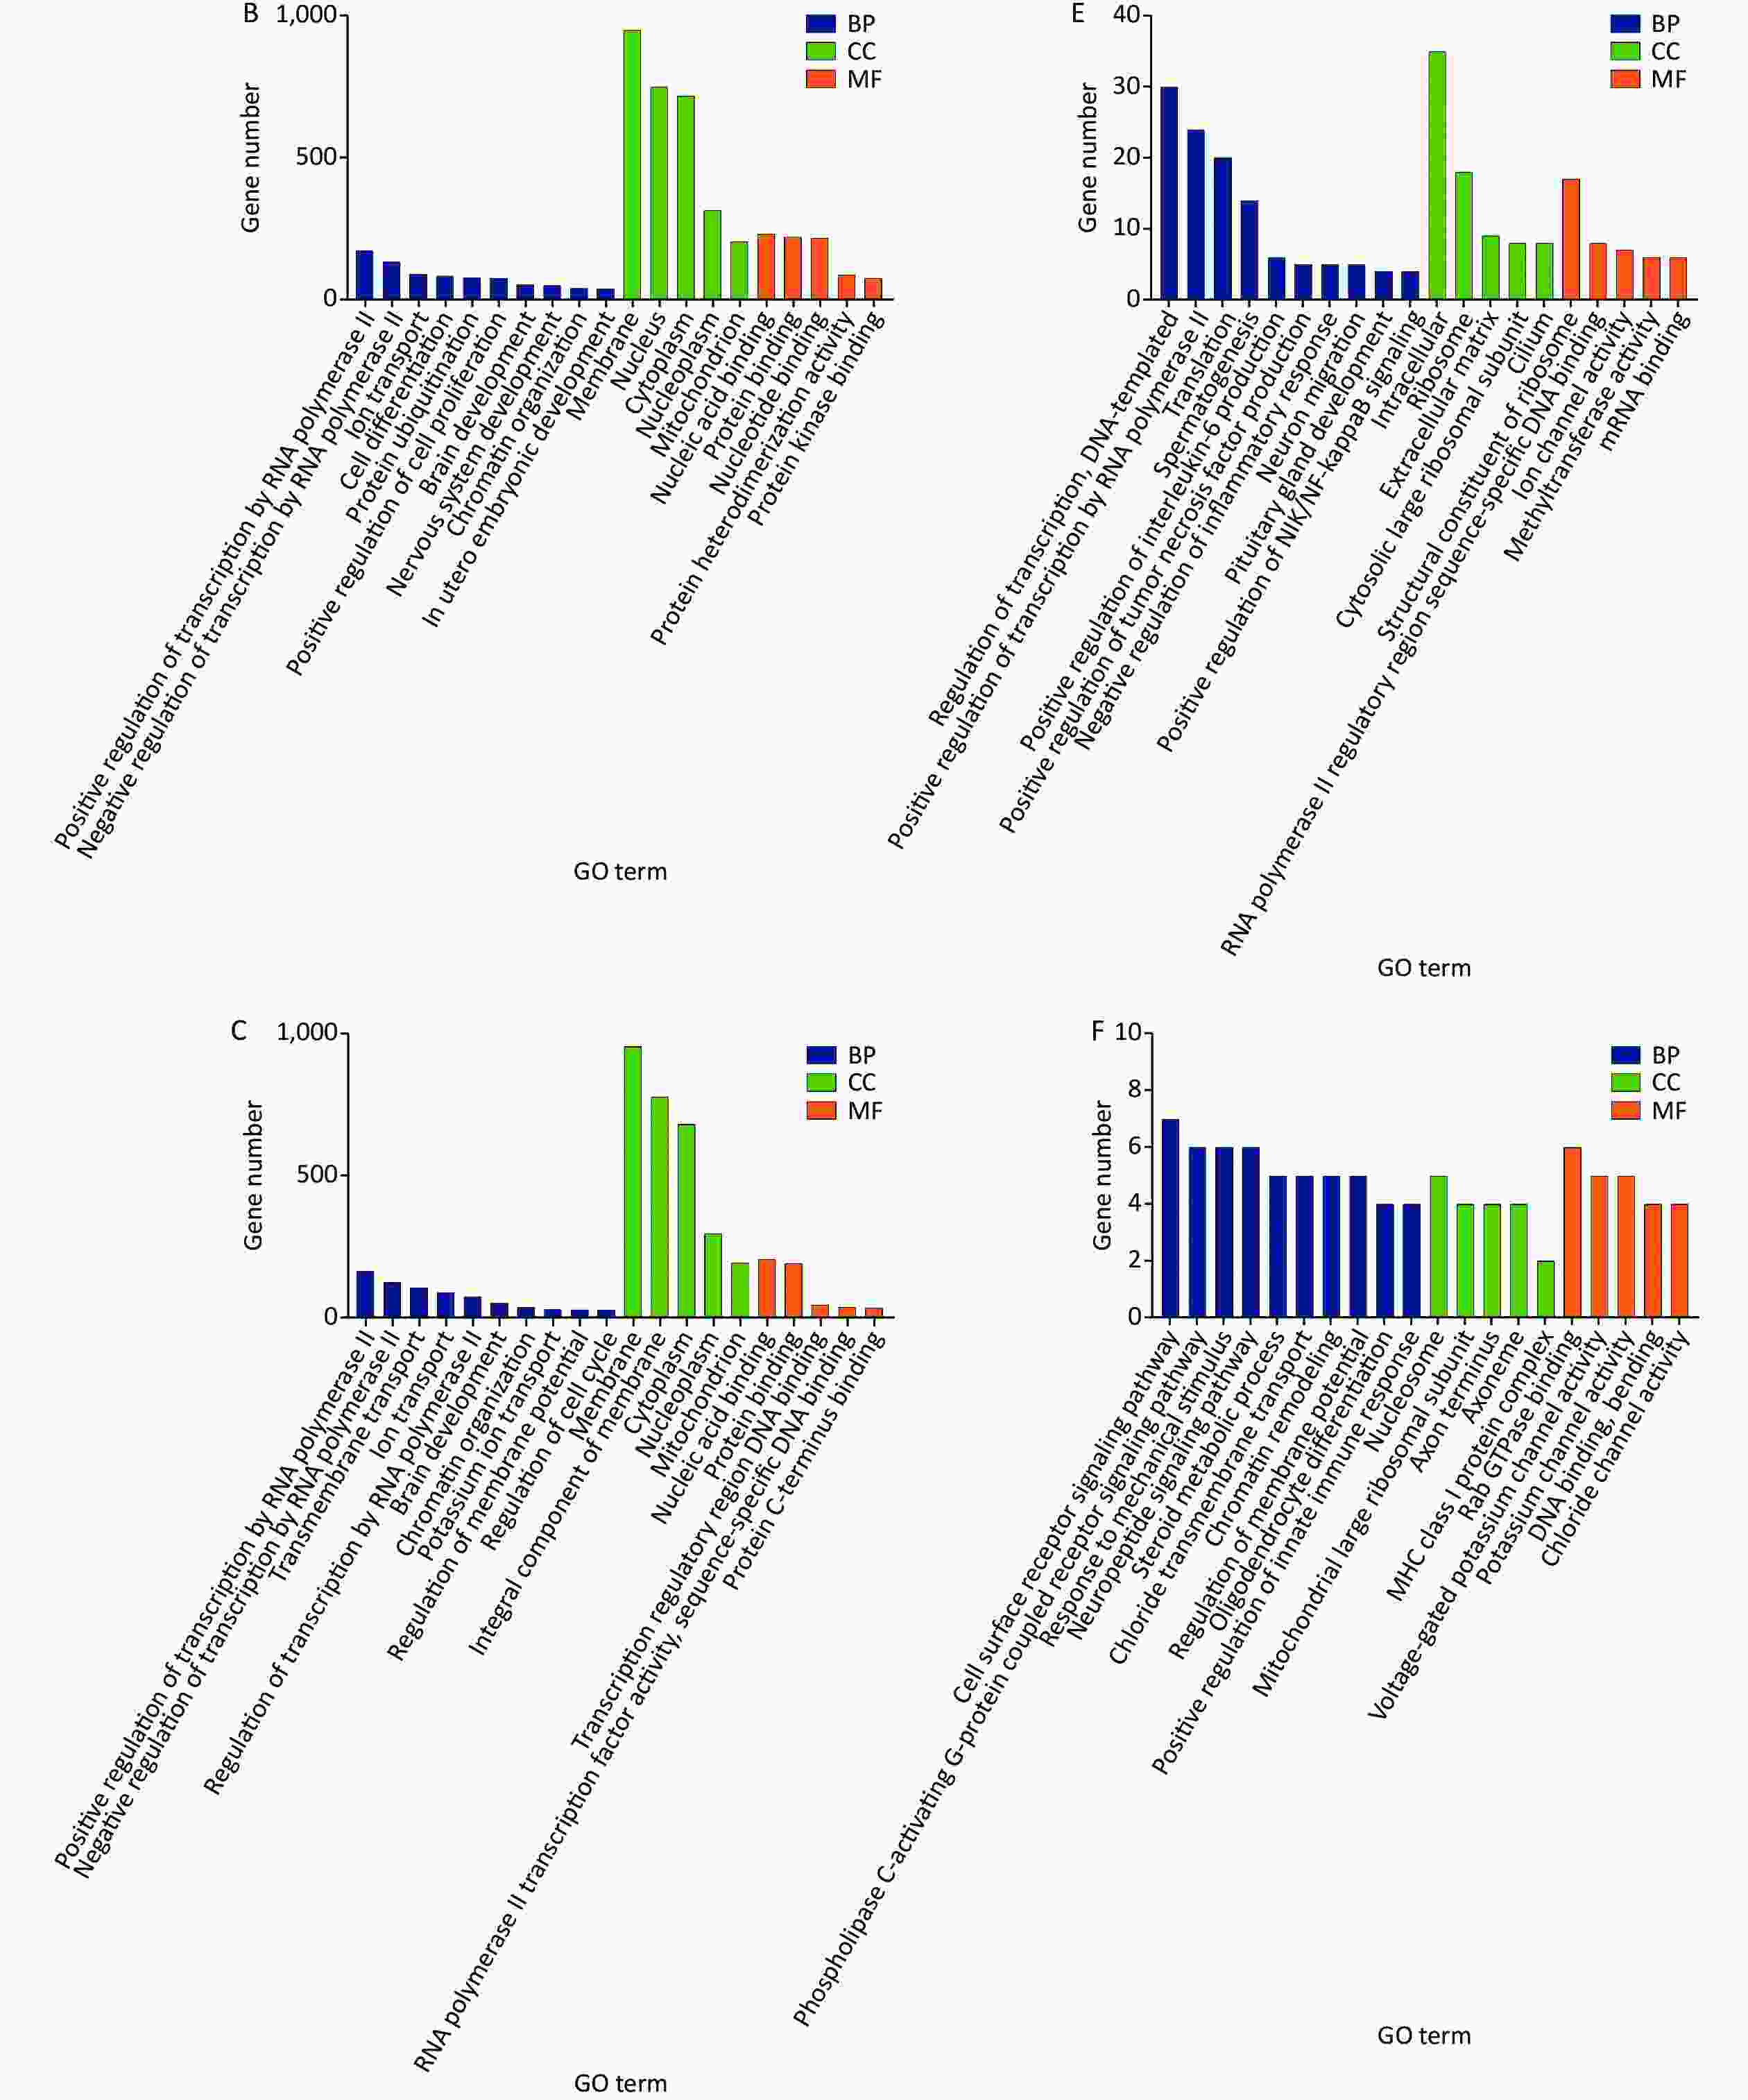
Figure 1. GO analysis of differentially expressed mRNAs in the sham and microwave exposure groups. A: biological processes (BP), cellular components (CC), and molecular functions (MF) in L10 vs. S; B: biological processes, cellular components, and molecular functions in C10 vs. S; C: biological processes, cellular components, and molecular functions in LC10 vs. S; D: biological processes, cellular components, and molecular functions in LC10 vs. L10; E: biological processes, cellular components, and molecular functions in LC10 vs. C10; F: biological processes, cellular components, and molecular functions in L10 vs. C10.
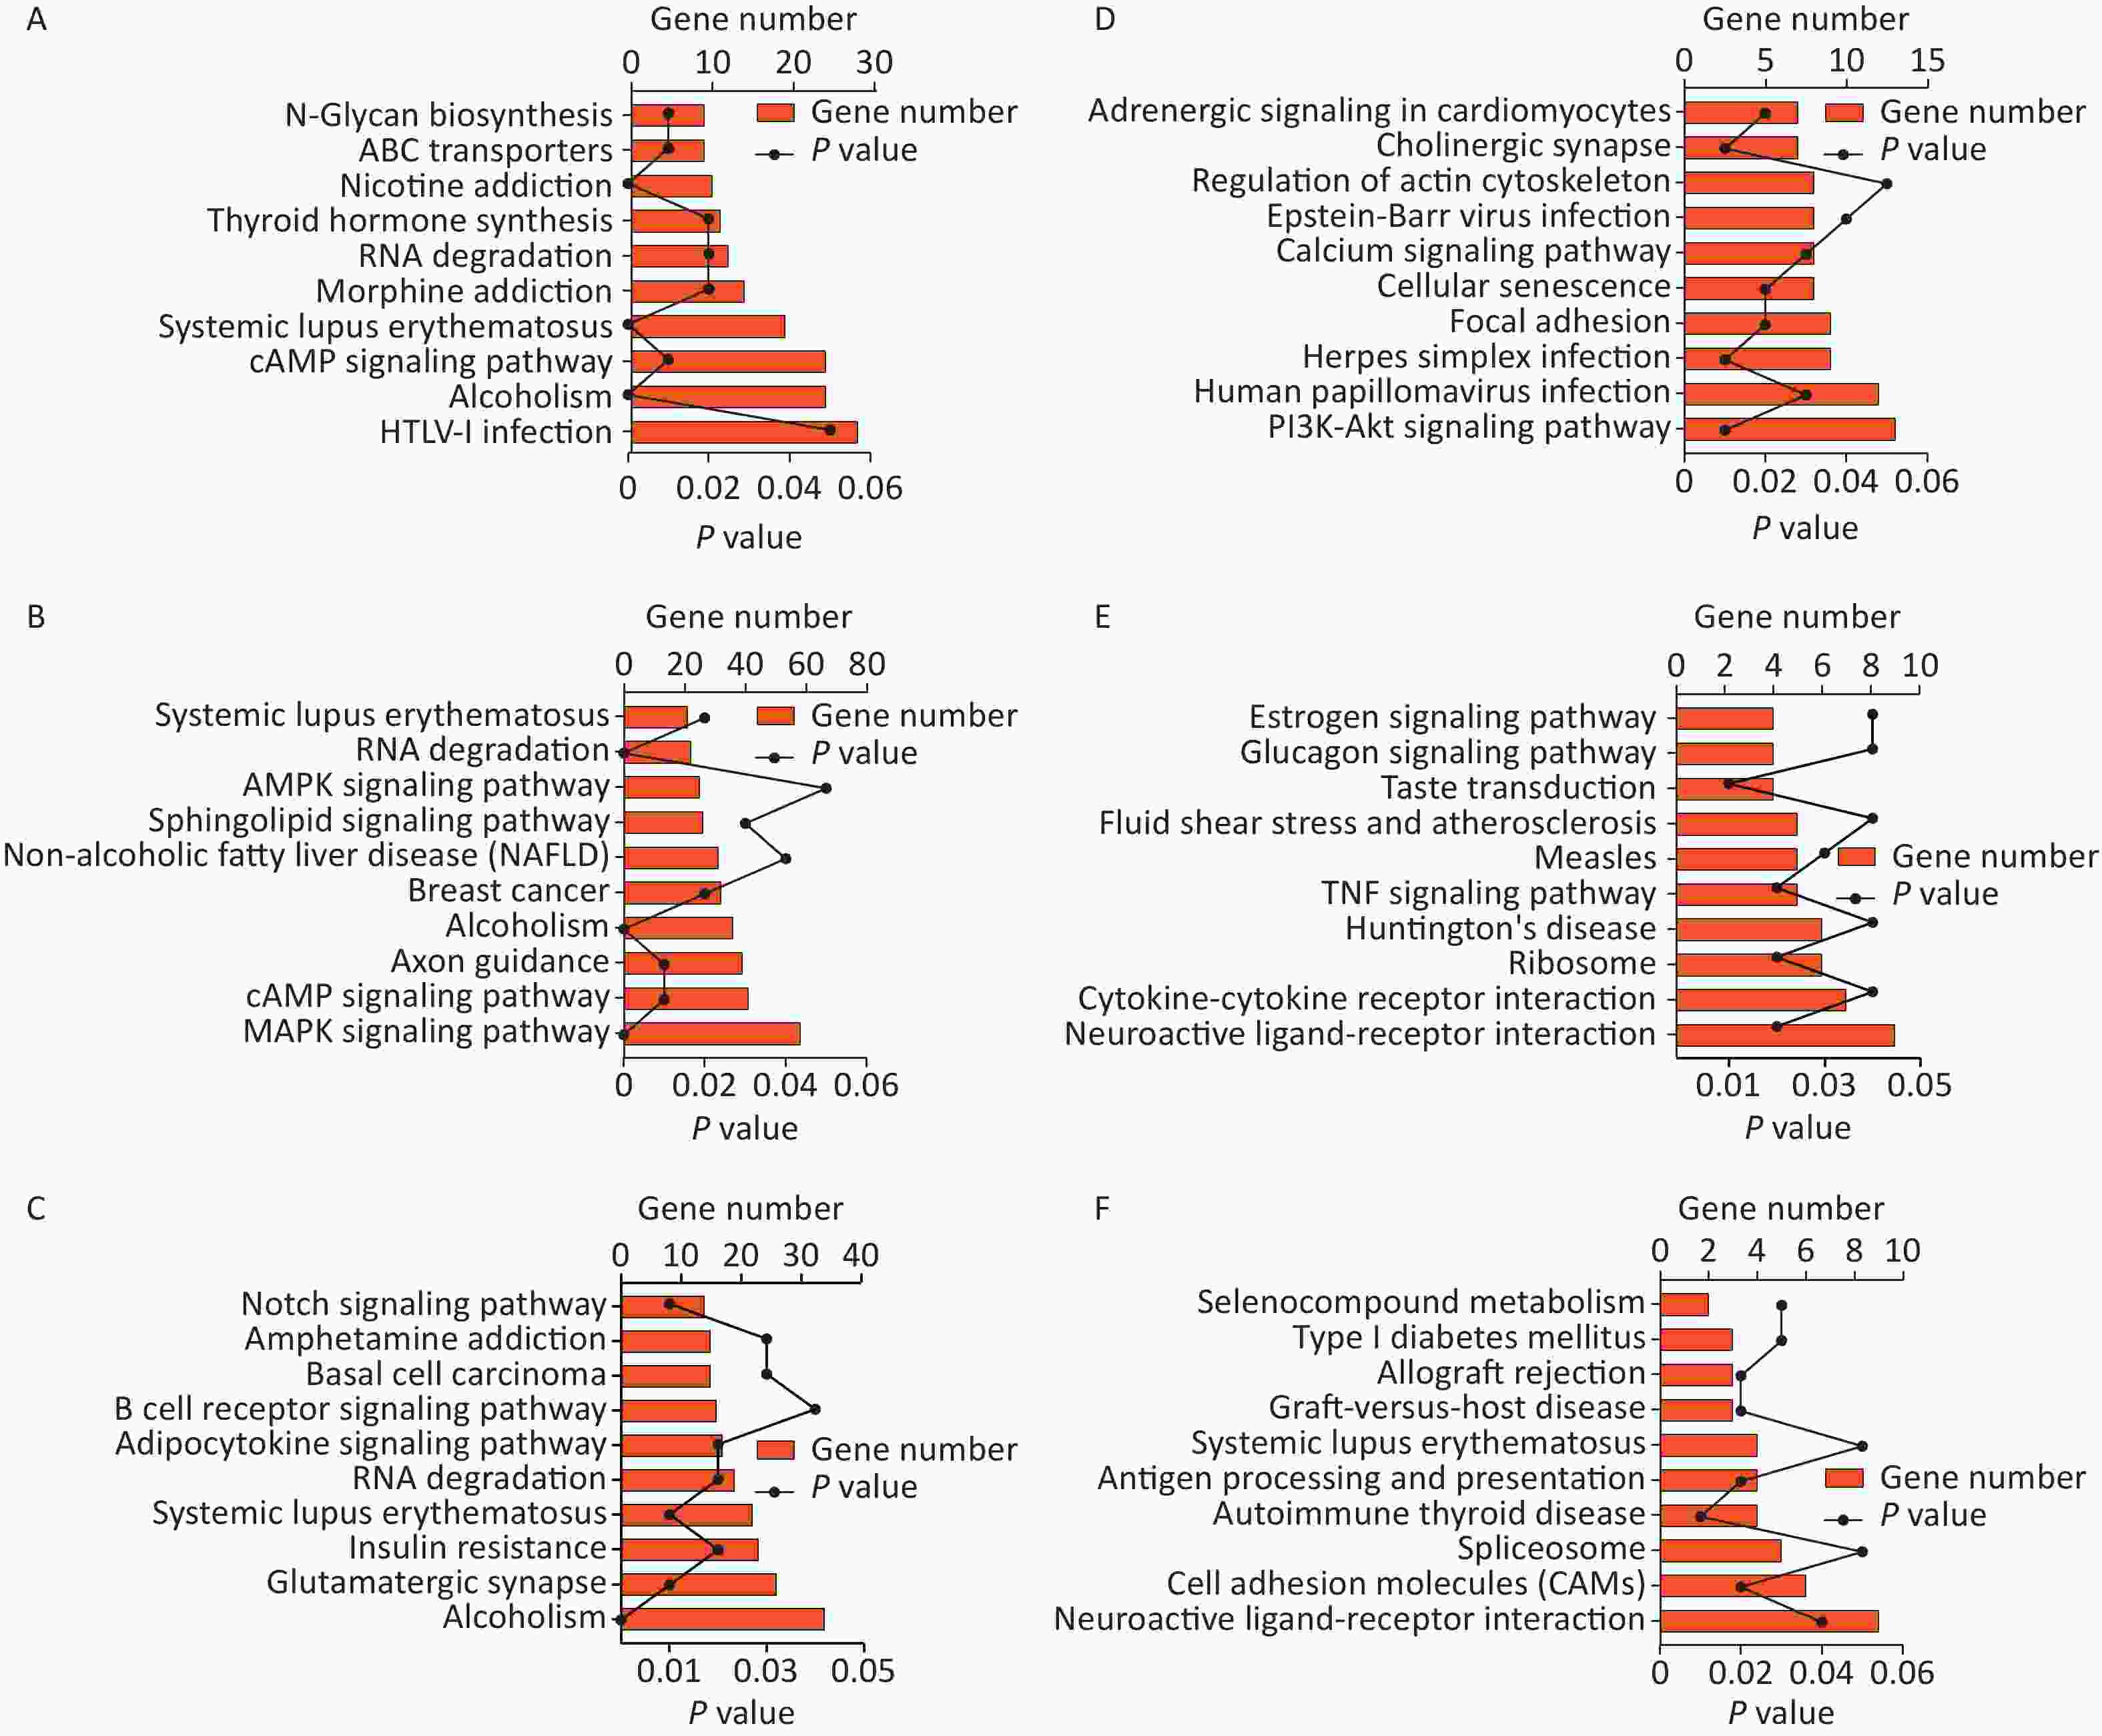
Figure 2. KEGG pathway analysis of differentially expressed mRNAs in the sham and microwave exposure groups. A: KEGG pathways in L10 vs. S; B: KEGG pathways in C10 vs. S; C: KEGG pathways in LC10 vs. S; D: KEGG pathways in LC10 vs. L10; E: KEGG pathways in LC10 vs. C10; F: KEGG pathways in L10 vs. C10.
Relative to the S group, more than 1,400 differentially expressed lncRNAs were found in each exposure group (Supplementary Figure S2 available in www.besjournal.com).
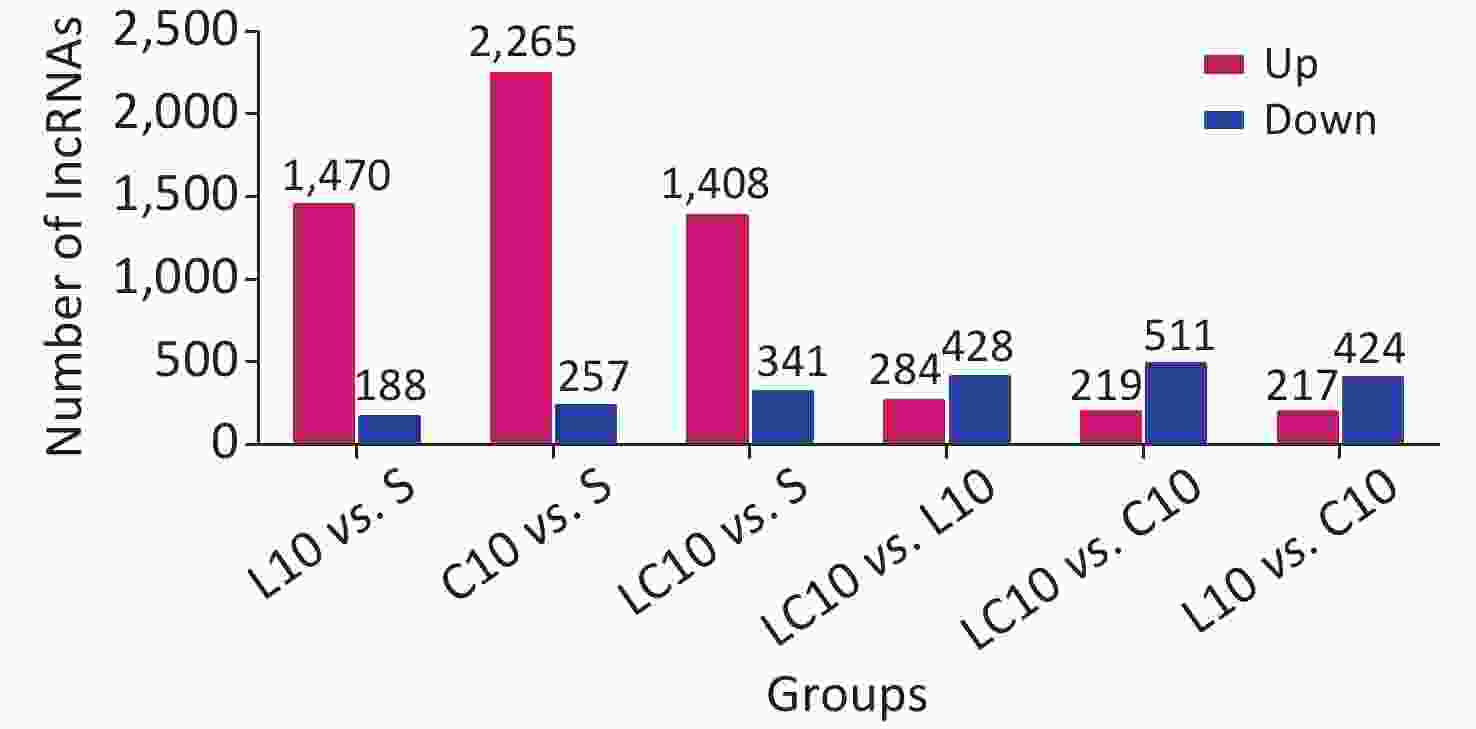
Figure S2. Differentially expressed lncRNAs in the sham and microwave exposure groups.
Relative to the S group, there were two predicted target genes of differentially expressed lncRNAs in the L10 group connected with cognitive functions. The biological processes mainly included synaptic plasticity and calcium ion transport. The cellular components were located in the synapse and the membrane. Molecular functions focused on syntaxin binding and calcium-dependent protein binding (Supplementary Table S3 available in www.besjournal.com).
Table S3. GO analysis of differentially expressed lncRNAs and corresponding mRNAs after microwave exposure
Groups mRNA
(transcripts, genes)lncRNA
(transcripts, genes)BP CC MF L10 vs. S ENSRNOT00000000117,
Cplx2MSTRG.14373.2,
Cplx2neurotransmitter transport, synaptic vesicle exocytosis, positive regulation of synaptic plasticity, regulation of neurotransmitter secretion and et al. Dendrite, SNARE complex, mast cell granule, neuronal cell body, terminal bouton, synapse, and et al. SNARE binding, syntaxin-1 binding, syntaxin binding, calcium-dependent protein binding ENSRNOT00000083373,
Slc24a2MSTRG.27033.1,
Slc24a2calcium ion transport, cellular calcium ion homeostasis, learning, memory, long-term synaptic potentiation, long term synaptic depression, calcium ion transmembrane transport integral component of plasma membrane, membrane, integral component of membrane, intrinsic component of plasma membrane calcium channel activity, calcium, potassium: sodium antiporter activity, symporter activity, antiporter activity, protein dimerization activity C10 vs. S ENSRNOT00000002044,
NapaMSTRG.1068.1 brain development, regulation of synaptic protein transport, vesicle-mediated transport, neuron differentiation, glutamatergic, SNARE complex disassembly SNARE complex, terminal bouton, myelin sheath, synaptobrevin 2-SNAP-25-syntaxin-1a complex, presynapse, postsynapse and et al. SNARE binding, syntaxin binding, protein-containing complex binding ENSRNOT00000072973,
Vbp1MSTRG.2384.1 protein folding, microtubule-based process, tubulin complex assembly Cytoplasm, polysome, prefoldin complex tubulin binding ENSRNOT00000031230,
ENSRNOT00000084012,
Agap2MSTRG.31244.1 positive regulation of phosphatidylinositol 3-kinase signaling, negative regulation of apoptotic process, negative regulation of neuron apoptotic process and et al. Nucleus, nucleolus, cytoplasm, mitochondrion, cytosol GTPase activity, GTPase activator activity, protein binding, GTP binding, metal ion binding and et al. ENSRNOT00000023196,
PdgfbMSTRG.31953.1,
Pdgfbpositive regulation of MAPK cascade, positive regulation of ERK1 and ERK2 cascade, positive regulation of calcium ion import and et al. Intracellular, membrane growth factor activity, superoxide-generating NADPH oxidase activator activity, identical protein binding and et al. ENSRNOT00000073079,
TbccMSTRG.34726.1,
Bicralcell morphogenesis, protein folding, tubulin complex assembly, post-chaperonin tubulin folding pathway Cytoplasm, cytosol, photoreceptor connecting cilium nucleotide binding, GTPase activity, GTP binding, tubulin binding ENSRNOT00000022351,
Dlgap1MSTRG.35922.1,
Dlgap1chemical synaptic transmission, signaling, protein localization to synapse, regulation of proteasomal protein catabolic process, maintenance of postsynaptic density structure and et al. postsynaptic density, synapse, postsynaptic membrane, glutamatergic synapse, postsynaptic density, intracellular component and et al. protein binding, protein domain specific binding, protein-containing complex binding, structural constituent of postsynaptic density C10 vs. S ENSRNOT00000012533,
Ccdc47MSTRG.6501.2,
Limd2ER overload response, endoplasmic reticulum organization, post-embryonic development, ubiquitin-dependent ERAD pathway, calcium ion homeostasis endoplasmic reticulum, rough endoplasmic reticulum, membrane, integral component of membrane) calcium ion binding ENSRNOT00000002906,
Atg3MSTRG.7482.1 autophagosome assembly, autophagy of mitochondrion, autophagy, macroautophagy cytoplasmic ubiquitin ligase complex, cytoplasm, cytosol transferase activity, Atg8 ligase activity, Atg12 transferase activity, ubiquitin-like protein transferase activity, enzyme binding LC10 vs. S ENSRNOT00000023066,
Syngr1MSTRG.31953.1,
Pdgfbregulation of long-term neuronal synaptic plasticity, regulation of short-term neuronal synaptic plasticity, synaptic vesicle membrane organization and et al. synaptic vesicle, membrane, integral component of synaptic vesicle membrane, synaptic vesicle membrane, cytoplasmic vesicle, synapse and et al. ENSRNOT00000023196,
PdgfbMSTRG.31953.1,
Pdgfbpositive regulation of MAP kinase activity, positive regulation of calcium ion import, positive regulation of reactive oxygen species metabolic process and et al. Intracellular, membrane identical protein binding, protein homodimerization activity, protein heterodimerization activity, platelet-derived growth factor binding ENSRNOT00000010827,
Slc24a2MSTRG.27033,
Slc24a2calcium ion transport, cellular calcium ion homeostasis, learning, memory, long-term synaptic potentiation, long term synaptic depression and et al. integral component of plasma membrane, membrane, integral component of membrane, intrinsic component of plasma membrane calcium channel activity, calcium, potassium: sodium antiporter activity, and et al. ENSRNOT00000018190,
RalaMSTRG.14864.1 Ras protein signal transduction, exocytosis, regulation of exocytosis and et al. cell surface, membrane, cleavage furrow, myelin sheath, Flemming body GTPase activity, protein tyrosine kinase activity, GTP binding, myosin binding, GDP binding, ATPase binding ENSRNOT00000019340,
Rap2bMSTRG.19020.1,
MSTRG.19019.1Rap protein signal transduction and et al. bicellular tight junction, membrane, recycling endosome, extracellular exosome nucleotide binding, GTP binding, GDP binding, protein domain specific binding LC10 vs. L10 None None None None None LC10 vs. C10 None None None None None L10 vs. C10 ENSRNOT00000043627,
Map2MSTRG.35424.1 Axonogenesis, microtubule binding, dendrite development, central nervous system neuron development, establishment of cell polarity, negative regulation of axon extension, neuron projection development, dendrite morphogenesis, regulation of axonogenesis Microtubule, postsynaptic density, dendrite, nuclear periphery, axon initial segment, dendritic shaft, axon hillock, cell body, CA3 pyramidal cell dendrite, proximal neuron projection dystroglycan binding, tubulin binding The differentially expressed target mRNAs and lncRNAs in the C10 group were analyzed relative to those of the S group. The biological processes included brain development and tubulin complex assembly. The cellular components were located in the SNARE complex and synapse. Molecular functions focused on SNARE binding, syntaxin binding, and tubulin binding (Supplementary Table S3).
The differentially expressed target mRNAs and lncRNAs in the LC10 were compared with those of the S group. The biological processes focused on synaptic plasticity and calcium ion import. The cellular components were located in synapses and membranes. The molecular functions included calcium channel activity and GTPase activity (Supplementary Table S3).
When comparing the LC10 group with the L10 group or the C10 group, there were no cognitively connected differentially expressed lncRNAs and targeted mRNAs. When comparing the L10 group with the C10 group, only one cognitively connected differentially expressed lncRNAs was found (Supplementary Table S3). The KEGG pathways of the differentially expressed lncRNAs connected to the cognitive functions in the exposure groups mainly included the synaptic vesicle cycle and glutamatergic synapse (Supplementary Table S4 available in www.besjournal.com).
Table S4. KEGG pathways of differentially expressed lncRNAs and corresponding mRNAs after microwave exposure
Groups mRNA
(transcripts, genes)lncRNA
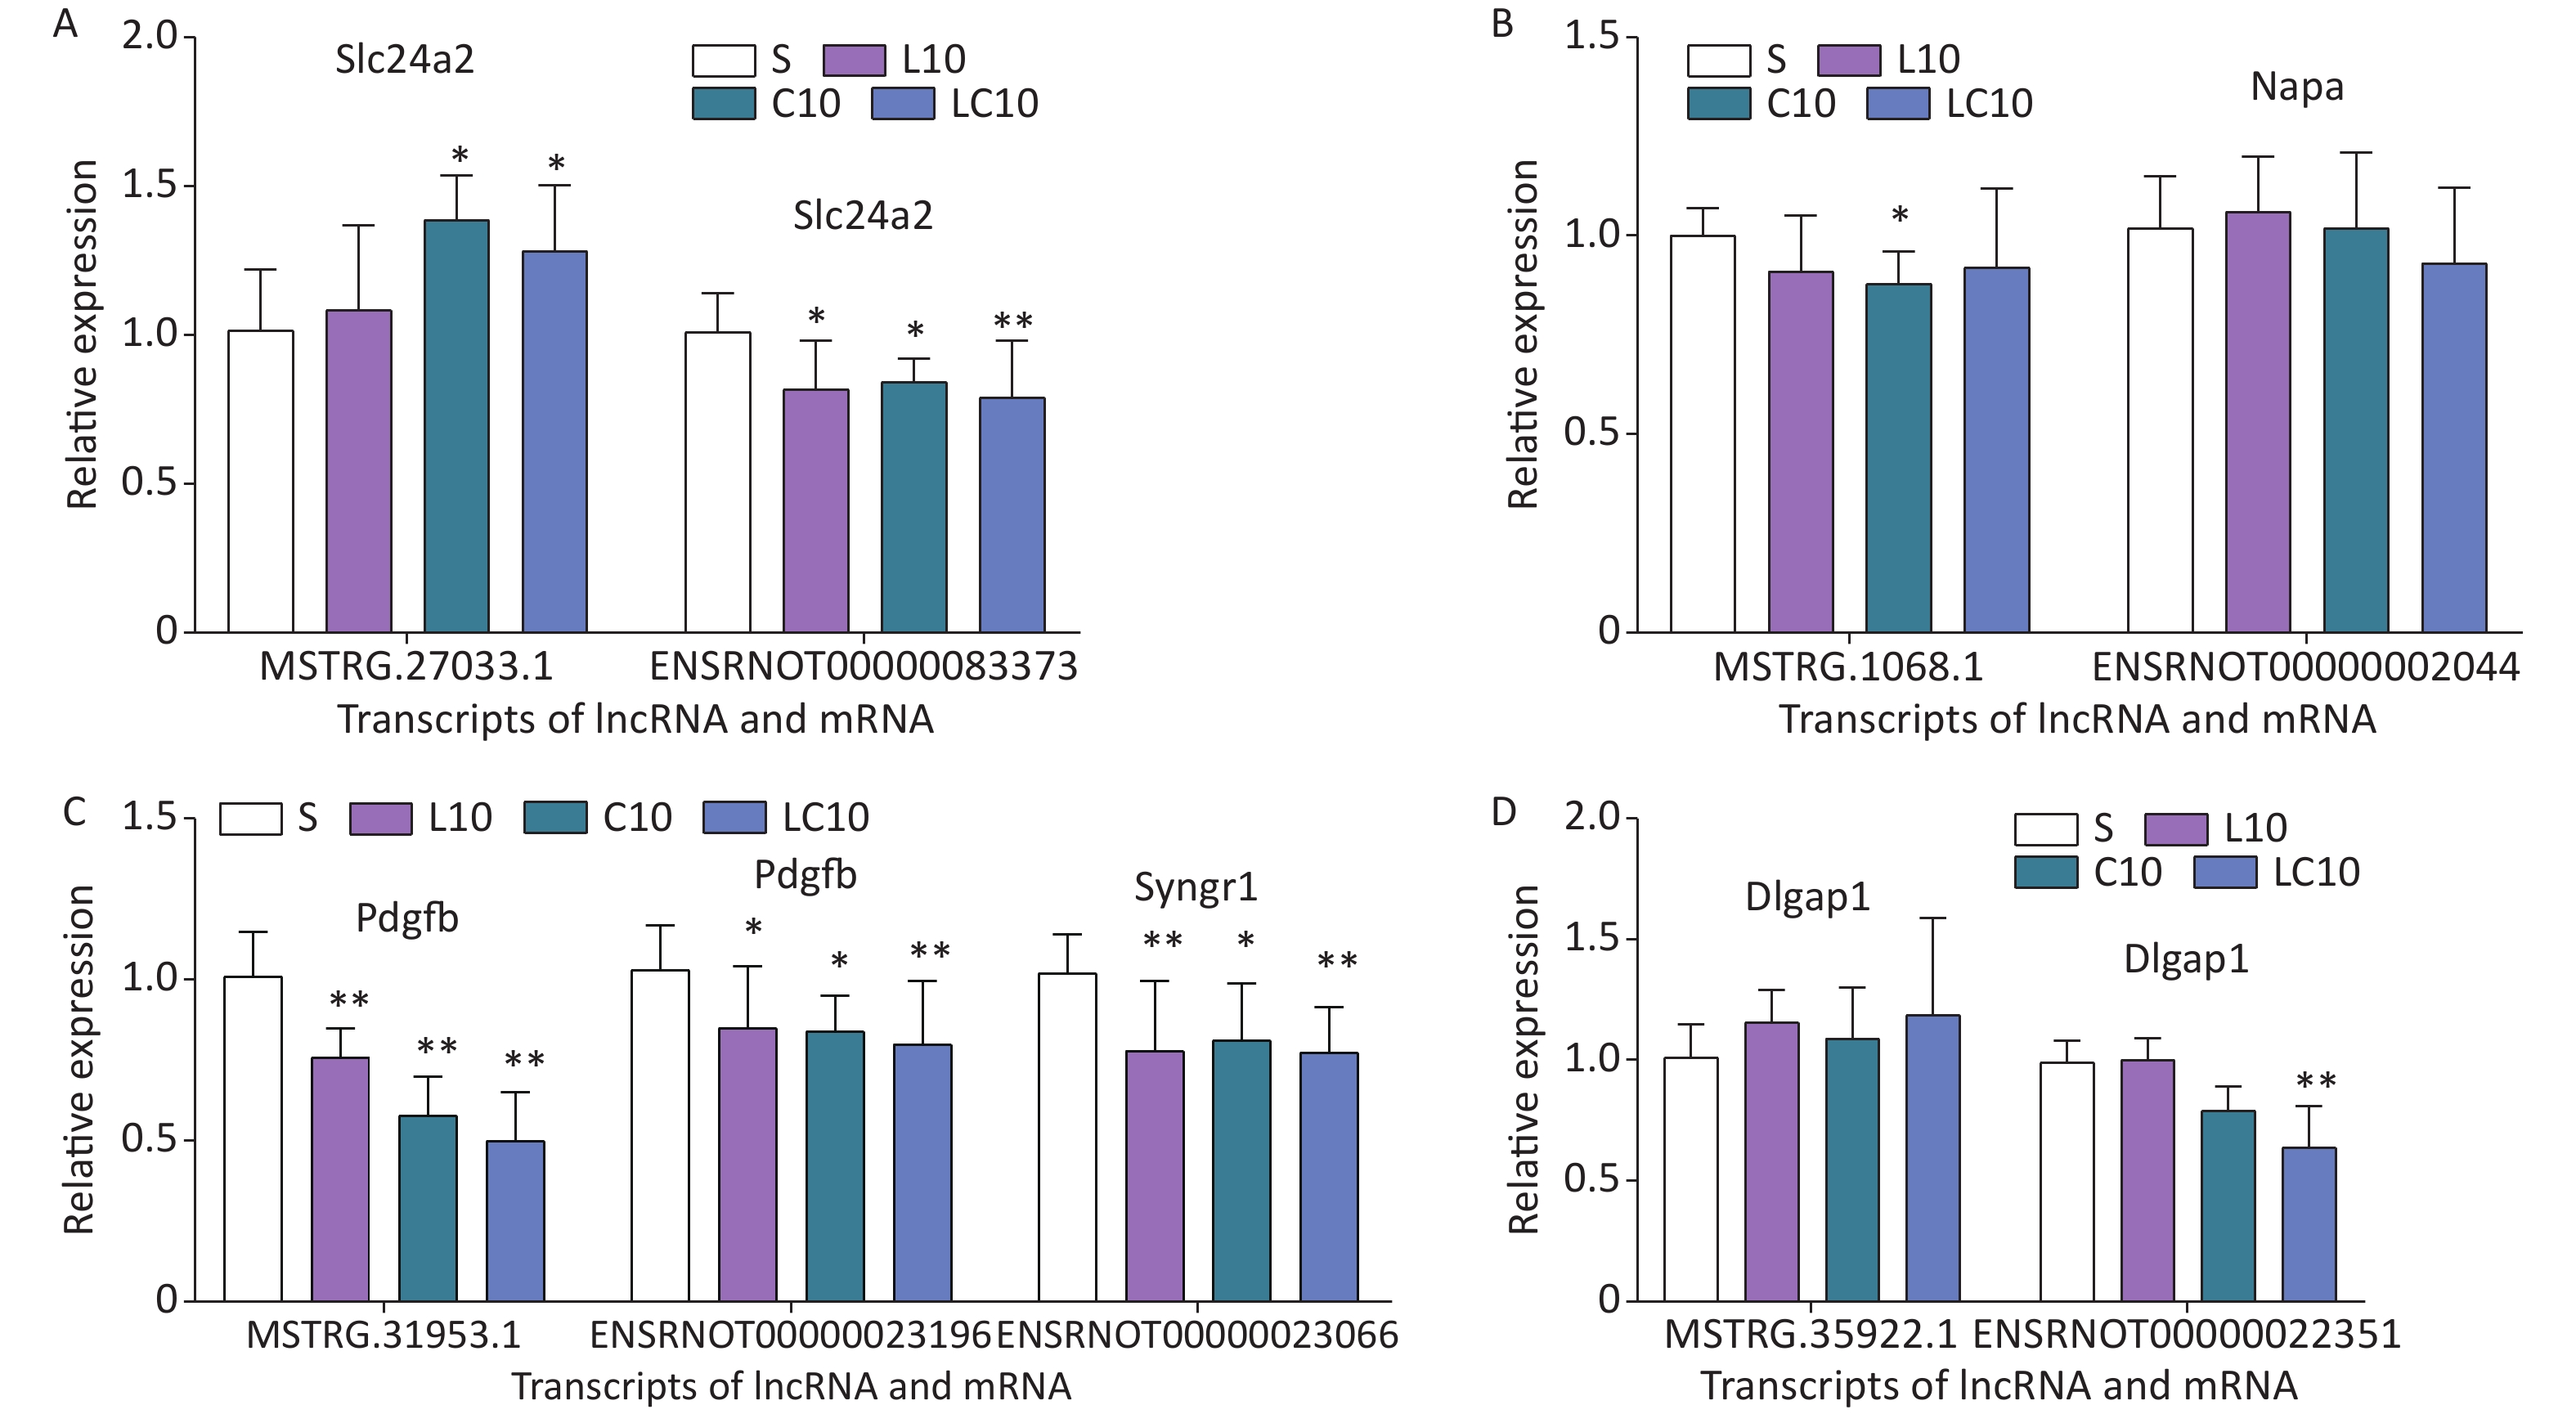
(transcripts,genes)KEGG pathways L10 vs. S ENSRNOT00000000117, Cplx2 MSTRG.14373.2, Cplx2 Synaptic vesicle cycle C10 vs. S ENSRNOT00000002044, Napa MSTRG.1068.1 Synaptic vesicle cycle ENSRNOT00000031230, Agap2 MSTRG.31244.1 FoxO signaling pathway, Endocytosis ENSRNOT00000084012, Agap2 MSTRG.31244.1 FoxO signaling pathway, Endocytosis ENSRNOT00000022351, Dlgap1 MSTRG.35922.1, Dlgap1 Glutamatergic synapse LC10 vs. S ENSRNOT00000023196, Pdgfb MSTRG.31953.1, Pdgfb MAPK signaling pathway, Ras signaling pathway, Rap1 signaling pathway, PI3K-Akt signaling pathway, and et al. ENSRNOT00000018190, Rala MSTRG.14864.1 Ras signaling pathway, Rap1 signaling pathway and et al. LC10 vs. L10 None None None LC10 vs. C10 None None None L10 vs. C10 None None None From combined GO enrichment and KEGG pathway analyzes, five-pair genes were selected for the following validation related to the cognitive changes. The genes, their transcripts, and the fold difference between groups are shown in Supplementary Table S5 (available in www.besjournal.com). The qRT-PCR was used to verify the sequencing results. Compared with that of the S group, the expression level of lncRNA (MSTRG.1068.1) decreased only in the C10 group, but the level of expression of mRNA (ENSRNOT00000002044) did not significantly change, which was not consistent with the sequencing data (Figure 3A). Compared with that of the S group, the level of expression of lncRNA (MSTRG. 27033.1) increased significantly in the C10 and LC10 groups, and the level of expression of mRNA (ENSRNOT00000083373) decreased in the L10, C10, and LC10 groups, which was consistent with the sequencing data (Figure 3B). The lncRNA (MSTRG.31953.1) was targeted with two mRNAs (ENSRNT00000023196 and ENSRNOT000000023066). The qRT-PCR results of lncRNA (MSTRG.31953.1) and mRNAs (ENSRNT00000023196 and ENSRNOT000000023066) showed a decrease in their expression in the L10, C10, and LC10 groups, which was consistent with the sequencing data (Figure 3C). Only mRNA (ENSRNOT00000022351) decreased in the LC10 group. The lncRNA (MSTRG. 35922.1) and mRNA (ENSRNOT00000022351) validation results were not consistent with the sequencing results (Figure 3D). Statistical analysis results are shown in Supplementary Table S6 (available in www.besjournal.com). The results indicated that the lncRNAs (Slc24a2 and Pdgfb) and mRNAs (Slc24a2, Pdgfb, and Syngr1) might be sensitive genes of microwave exposure, which should be considered for future study.
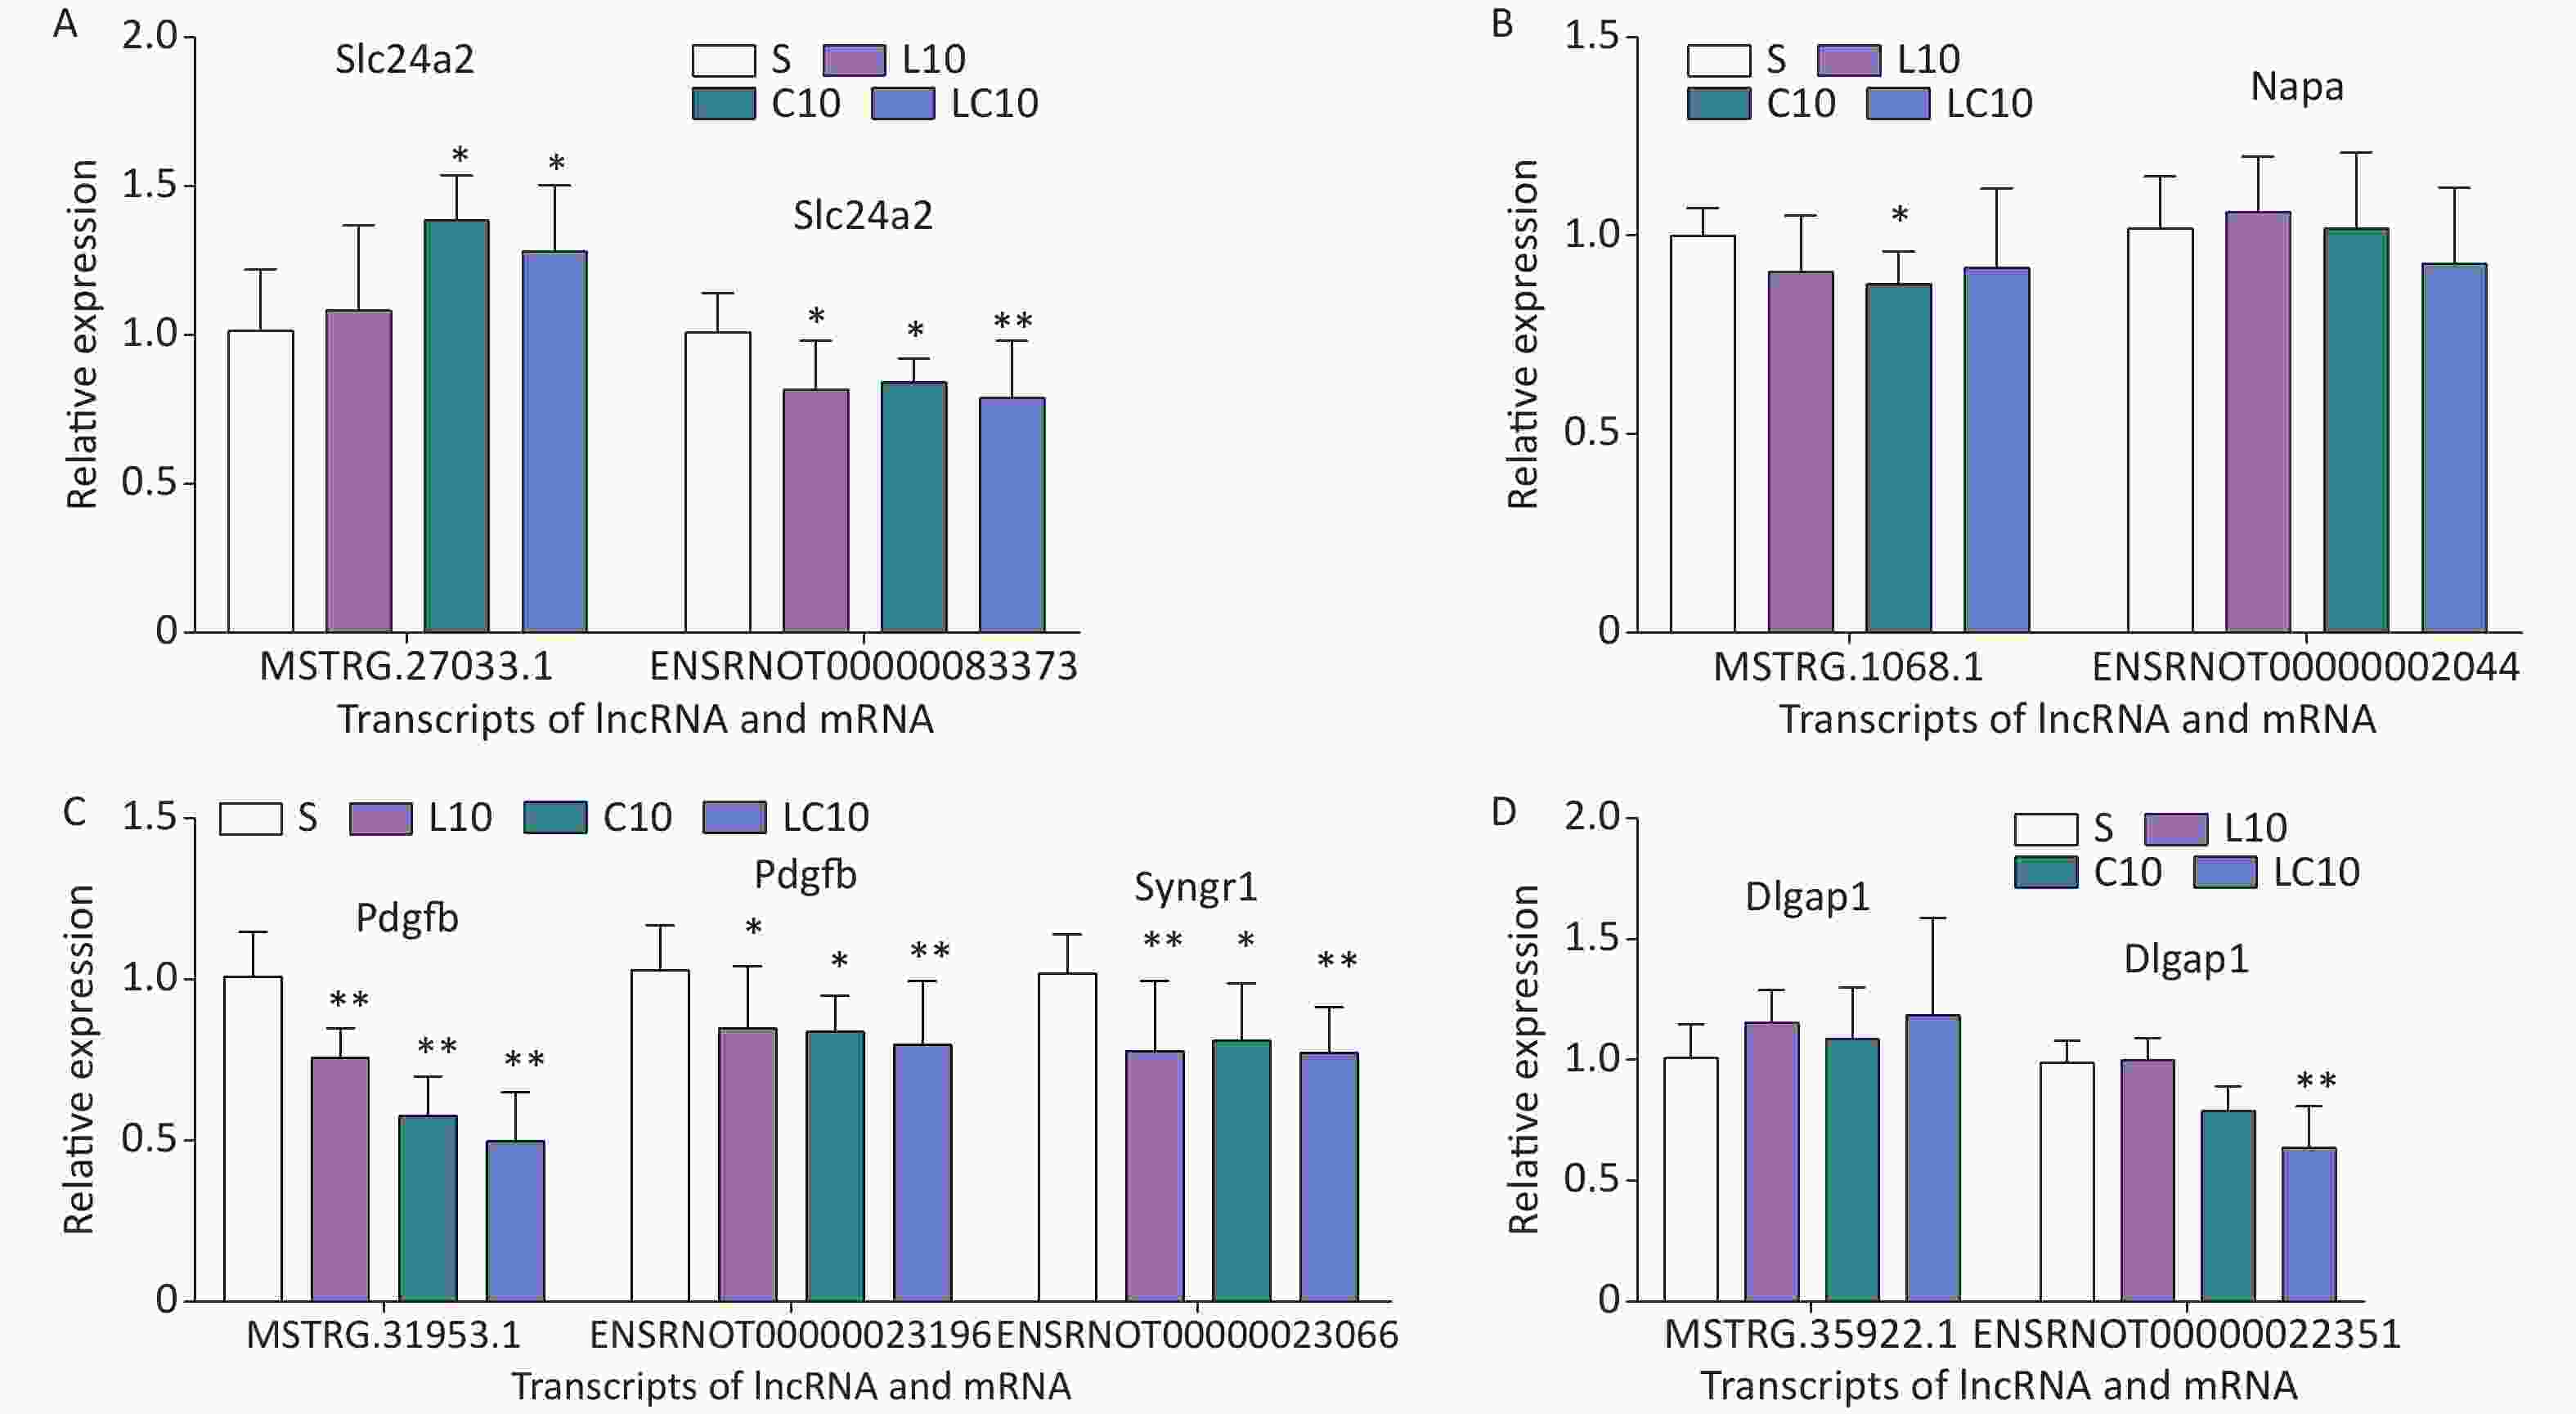
Figure 3. Validation data of the selected genes using qRT-PCR. A: qRT-PCR results of lncRNA (MSTRG.1068.1) and its target mRNA; B: qRT-PCR results of lncRNA (MSTRG.27033.1) and its target mRNA; C: qRT-PCR results of lncRNA (MSTRG.31953.1) and its target mRNA; D: qRT-PCR results of lncRNA (MSTRG.35922.1) and its target mRNA. Compared with the S group, *P < 0.05 and **P < 0.01.
Table S5. Differential genes for validation after microwave exposure
lncRNA mRNA transcripts genes log2 (FC)
L10 vs. Slog2 (FC)
C10 vs. Slog2 (FC)
LC10 vs. Stranscripts genes log2 (FC)
L10 vs. Slog2 (FC)
C10 vs. Slog2 (FC)
LC10 vs. SMSTRG.1068.1 NA −0.4 −0.46 −0.69 ENSRNOT00000002044 Napa −0.17 −0.28 −0.2 MSTRG.27033.1 Slc24a2 0.43 0.38 0.61 ENSRNOT00000083373 Slc24a2 −0.36 −0.66 −0.47 MSTRG.31953.1 Pdgfb −0.52 −0.73 −0.84 ENSRNOT00000023196 Pdgfb −0.2 −0.32 −0.29 MSTRG.31953.1 Pdgfb −0.52 −0.73 −0.84 ENSRNOT00000023066 Syngr1 0.31 −1.01 −1.68 MSTRG.35922.1 Dlgap1 0.05 0.45 0.42 ENSRNOT00000022351 Dlgap1 −0.24 −0.33 −0.17 Note. NA meant not available in the datebase. Recently, lncRNAs have attracted much attention due to their roles in transcriptional, post-transcriptional, and epigenetic networks and in certain physiological and pathological processes. Many lncRNAs are expressed in the central nervous system and play an important role in regulating neural functions such as central nervous system development, synaptic plasticity, and stress response. Changes in the expression levels of specific lncRNAs have been reported[5]. Through the mRNA and lncRNA analyzes, we found that brain development might be the main biological process. The glutamatergic synapse and synaptic vesicle cycle should be considered important pathways for microwave radiation studies. Previous studies have also indicated the important roles of glutamate and glutamatergic synapse in microwave-induced hippocampal injuries[6].
Slc24a2, also named NCKX2, plays a role in the calcium ion transmembrane transport[7]. We have previously reported calcium efflux during microwave exposure in primary hippocampal neurons[8]. The NCKX is another possible reason for microwave-induced calcium changes, which should be given potential attention in future studies.
The lncRNA Pdgfb was targeted to two mRNAs (Pdgfb and Syngr1). The mRNA of Pdgfb plays an essential role in the regulation of embryonic development and cell proliferation. The mRNA of Syngr1 probably plays a role in synaptic-like microvesicle formation and/or maturation[9]. An abnormal number of synaptic vesicles were found in transmission electron microscope pictures of the hippocampus after microwave exposure[10].
In conclusion, exposure to microwaves might affect the biological processes of brain development and ion transport, KEGG pathways of the glutamatergic synapse, and synaptic vesicle cycle, thereby inducing neurological impairment. Exposure to microwaves causes differential expression of lncRNAs (Slc24a2 and Pdgfb) and mRNAs (Slc24a2, Pdgfb, and Syngr1). The response of differentially expressed RNAs in body fluid samples should be further explored.
Table S6. Statistical analysis of differential gene validation results
Differential gene Comparison Significantly different? F value P value MSTRG.1068.1 L-band main effect No F (1,12) = 1.681 0.204 C-band main effect No F (1,12) = 4.107 0.051 Interaction effect No F (1,12) = 0.799 0.378 S vs. L10 No 0.133 S vs. C10 Yes 0.048 S vs. LC10 No 0.194 ENSRNOT00000002044 L-band main effect No F (1,12) = 0.240 0.628 C-band main effect No F (1,12) = 1.533 0.225 Interaction effect No F (1,12) = 1.304 0.262 S vs. L10 No 0.684 S vs. C10 No 0.946 S vs. LC10 No 0.231 MSTRG. 27033.1 L-band main effect No F (1,12) = 0.035 0.853 C-band main effect Yes F (1,12) = 10.011 0.004 Interaction effect No F (1,12) = 0.918 0.358 S vs. L10 No 0.577 S vs. C10 Yes 0.010 S vs. LC10 Yes 0.016 ENSRNOT00000083373 L-band main effect Yes F (1,12) = 4.592 0.040 C-band main effect No F (1,12) = 3.211 0.083 Interaction effect No F (1,12) = 1.67 0.206 S vs. L10 Yes 0.018 S vs. C10 No 0.043 S vs. LC10 Yes 0.007 MSTRG.31953.1 L-band main effect Yes F (1,12) = 10.307 0.004 C-band main effect Yes F (1,12) = 46.186 0.000 Interaction effect No F (1,12) = 2.877 0.102 S vs. L10 Yes 0.002 S vs. C10 Yes 0.000 S vs. LC10 Yes 0.000 ENSRNT00000023196 L-band main effect No F (1,12) = 3.601 0.067 C-band main effect Yes F (1,12) = 4.326 0.046 Interaction effect No F (1,12) = 1.391 0.248 S vs. L10 Yes 0.032 S vs. C10 Yes 0.033 S vs. LC10 Yes 0.007 ENSRNOT000000023066 L-band main effect Yes F (1,12) = 5.545 0.025 C-band main effect No F (1,12) = 3.244 0.081 Interaction effect No F (1,12) = 2.9 0.099 S vs. L10 Yes 0.007 S vs. C10 Yes 0.021 S vs. LC10 Yes 0.006 MSTRG. 35922.1 L-band main effect No F (1,12) = 2.366 0.134 C-band main effect No F (1,12) = 0.395 0.534 Interaction effect No F (1,12) = 0.087 0.770 S vs. L10 No 0.204 S vs. C10 No 0.519 S vs. LC10 No 0.135 ENSRNOT00000022351 L-band main effect No F (1,12) = 3.709 0.065 C-band main effect Yes F (1,12) = 23.21 0.000 Interaction effect No F (1,12) = 4.142 0.052 S vs. L10 No 0.932 S vs. C10 No 0.060 S vs. LC10 Yes 0.000
doi: 10.3967/bes2022.137
Transcriptome Sequencing of mRNA and lncRNA in Hippocampal Tissues of Rats under Microwave Exposure
-
&These authors contributed equally to this work.
注释: -
Figure 1. GO analysis of differentially expressed mRNAs in the sham and microwave exposure groups. A: biological processes (BP), cellular components (CC), and molecular functions (MF) in L10 vs. S; B: biological processes, cellular components, and molecular functions in C10 vs. S; C: biological processes, cellular components, and molecular functions in LC10 vs. S; D: biological processes, cellular components, and molecular functions in LC10 vs. L10; E: biological processes, cellular components, and molecular functions in LC10 vs. C10; F: biological processes, cellular components, and molecular functions in L10 vs. C10.
Figure 2. KEGG pathway analysis of differentially expressed mRNAs in the sham and microwave exposure groups. A: KEGG pathways in L10 vs. S; B: KEGG pathways in C10 vs. S; C: KEGG pathways in LC10 vs. S; D: KEGG pathways in LC10 vs. L10; E: KEGG pathways in LC10 vs. C10; F: KEGG pathways in L10 vs. C10.
Figure 3. Validation data of the selected genes using qRT-PCR. A: qRT-PCR results of lncRNA (MSTRG.1068.1) and its target mRNA; B: qRT-PCR results of lncRNA (MSTRG.27033.1) and its target mRNA; C: qRT-PCR results of lncRNA (MSTRG.31953.1) and its target mRNA; D: qRT-PCR results of lncRNA (MSTRG.35922.1) and its target mRNA. Compared with the S group, *P < 0.05 and **P < 0.01.
S1. Experimental groups and exposure to microwave radiation
Group Average power density of
L-band microwavesAverage power density of
C-band microwavesSAR (W/kg) S* 0 mW/cm2 0 mW/cm2 0 L10 10 mW/cm2 for 6 min 0 mW/cm2 3.7 C10 0 mW/cm2 10 mW/cm2 for 6 min 3.3 LC10# 10 mW/cm2 for 6 min 10 mW/cm2 for 6 min 3.7 for 6 min + 3.3 for 6 min Note. *The rats in the sham radiation group were placed in polypropylene cages and placed on the radiation table for 6 min without microwave exposure. #The rats in the LC10 groups were first radiated with L-band microwave radiation for 6 min and then immediately radiated with C-band microwave radiation for 6 min. The sham group and exposure group. The sham group and exposure groups adopt the same settings, and the sham group did not give microwave exposure. The experiment of the sham group and exposure groups were not conducted in parallel.  下载: 导出CSV
S2. Primer sequences of differentially expressed lncRNAs and mRNAs
Transcripts and gene names Primer sequences MSTRG.1068.1 (NA) Forward (F) CTCGGGAGAAAGGGTATGTGAG Reverse (R) TGGTGAGCGGGCATTTTAG ENSRNOT00000002044 (Napa) Forward (F) TGAAGGAGTGGGTGCAATGT Reverse (R) ATAAATGGCGGGGTGAAGG MSTRG.27033.1 (Slc24a2) Forward (F) GTGTGTGTGTGTGTTCAAGGAATAA Reverse (R) AGCAAGCCAGTCCCTATTAAGAAA ENSRNOT00000083373 (Slc24a2) Forward (F) GTCCACACCCAGTCCACCTT Reverse (R) GGCATCAAACCCTATCAAATCTTC MSTRG.31953.1 (Pdgfb) Forward (F) AGACGCTTGGAGTAGAGACAGGA Reverse (R) TACGTGAGTCTGGGAGGGGTAG ENSRNOT00000023196 (Pdgfb) Forward (F) GAATACTTTCAGGCAGGCTAGGG Reverse (R) AAGGGACAGGGAGAGATGAGTG ENSRNOT00000023066 (Syngr1) Forward (F) TGTCAAGGACCGCAAGAAAG Reverse (R) CAGAAACCCACGAACCAGAAG MSTRG.35922.1 (Dlgap1) Forward (F) GCACCATCGCTCACAGACA Reverse (R) CCTTGTAAACCCCTCCTCCAC ENSRNOT00000022351 (Dlgap1) Forward (F) TCACCAAAGTTCCGCTCCA Reverse (R) CTGTCCGTTCACCTCCATCTC
下载: 导出CSV
S3. GO analysis of differentially expressed lncRNAs and corresponding mRNAs after microwave exposure
Groups mRNA
(transcripts, genes)lncRNA
(transcripts, genes)BP CC MF L10 vs. S ENSRNOT00000000117,
Cplx2MSTRG.14373.2,
Cplx2neurotransmitter transport, synaptic vesicle exocytosis, positive regulation of synaptic plasticity, regulation of neurotransmitter secretion and et al. Dendrite, SNARE complex, mast cell granule, neuronal cell body, terminal bouton, synapse, and et al. SNARE binding, syntaxin-1 binding, syntaxin binding, calcium-dependent protein binding ENSRNOT00000083373,
Slc24a2MSTRG.27033.1,
Slc24a2calcium ion transport, cellular calcium ion homeostasis, learning, memory, long-term synaptic potentiation, long term synaptic depression, calcium ion transmembrane transport integral component of plasma membrane, membrane, integral component of membrane, intrinsic component of plasma membrane calcium channel activity, calcium, potassium: sodium antiporter activity, symporter activity, antiporter activity, protein dimerization activity C10 vs. S ENSRNOT00000002044,
NapaMSTRG.1068.1 brain development, regulation of synaptic protein transport, vesicle-mediated transport, neuron differentiation, glutamatergic, SNARE complex disassembly SNARE complex, terminal bouton, myelin sheath, synaptobrevin 2-SNAP-25-syntaxin-1a complex, presynapse, postsynapse and et al. SNARE binding, syntaxin binding, protein-containing complex binding ENSRNOT00000072973,
Vbp1MSTRG.2384.1 protein folding, microtubule-based process, tubulin complex assembly Cytoplasm, polysome, prefoldin complex tubulin binding ENSRNOT00000031230,
ENSRNOT00000084012,
Agap2MSTRG.31244.1 positive regulation of phosphatidylinositol 3-kinase signaling, negative regulation of apoptotic process, negative regulation of neuron apoptotic process and et al. Nucleus, nucleolus, cytoplasm, mitochondrion, cytosol GTPase activity, GTPase activator activity, protein binding, GTP binding, metal ion binding and et al. ENSRNOT00000023196,
PdgfbMSTRG.31953.1,
Pdgfbpositive regulation of MAPK cascade, positive regulation of ERK1 and ERK2 cascade, positive regulation of calcium ion import and et al. Intracellular, membrane growth factor activity, superoxide-generating NADPH oxidase activator activity, identical protein binding and et al. ENSRNOT00000073079,
TbccMSTRG.34726.1,
Bicralcell morphogenesis, protein folding, tubulin complex assembly, post-chaperonin tubulin folding pathway Cytoplasm, cytosol, photoreceptor connecting cilium nucleotide binding, GTPase activity, GTP binding, tubulin binding ENSRNOT00000022351,
Dlgap1MSTRG.35922.1,
Dlgap1chemical synaptic transmission, signaling, protein localization to synapse, regulation of proteasomal protein catabolic process, maintenance of postsynaptic density structure and et al. postsynaptic density, synapse, postsynaptic membrane, glutamatergic synapse, postsynaptic density, intracellular component and et al. protein binding, protein domain specific binding, protein-containing complex binding, structural constituent of postsynaptic density C10 vs. S ENSRNOT00000012533,
Ccdc47MSTRG.6501.2,
Limd2ER overload response, endoplasmic reticulum organization, post-embryonic development, ubiquitin-dependent ERAD pathway, calcium ion homeostasis endoplasmic reticulum, rough endoplasmic reticulum, membrane, integral component of membrane) calcium ion binding ENSRNOT00000002906,
Atg3MSTRG.7482.1 autophagosome assembly, autophagy of mitochondrion, autophagy, macroautophagy cytoplasmic ubiquitin ligase complex, cytoplasm, cytosol transferase activity, Atg8 ligase activity, Atg12 transferase activity, ubiquitin-like protein transferase activity, enzyme binding LC10 vs. S ENSRNOT00000023066,
Syngr1MSTRG.31953.1,
Pdgfbregulation of long-term neuronal synaptic plasticity, regulation of short-term neuronal synaptic plasticity, synaptic vesicle membrane organization and et al. synaptic vesicle, membrane, integral component of synaptic vesicle membrane, synaptic vesicle membrane, cytoplasmic vesicle, synapse and et al. ENSRNOT00000023196,
PdgfbMSTRG.31953.1,
Pdgfbpositive regulation of MAP kinase activity, positive regulation of calcium ion import, positive regulation of reactive oxygen species metabolic process and et al. Intracellular, membrane identical protein binding, protein homodimerization activity, protein heterodimerization activity, platelet-derived growth factor binding ENSRNOT00000010827,
Slc24a2MSTRG.27033,
Slc24a2calcium ion transport, cellular calcium ion homeostasis, learning, memory, long-term synaptic potentiation, long term synaptic depression and et al. integral component of plasma membrane, membrane, integral component of membrane, intrinsic component of plasma membrane calcium channel activity, calcium, potassium: sodium antiporter activity, and et al. ENSRNOT00000018190,
RalaMSTRG.14864.1 Ras protein signal transduction, exocytosis, regulation of exocytosis and et al. cell surface, membrane, cleavage furrow, myelin sheath, Flemming body GTPase activity, protein tyrosine kinase activity, GTP binding, myosin binding, GDP binding, ATPase binding ENSRNOT00000019340,
Rap2bMSTRG.19020.1,
MSTRG.19019.1Rap protein signal transduction and et al. bicellular tight junction, membrane, recycling endosome, extracellular exosome nucleotide binding, GTP binding, GDP binding, protein domain specific binding LC10 vs. L10 None None None None None LC10 vs. C10 None None None None None L10 vs. C10 ENSRNOT00000043627,
Map2MSTRG.35424.1 Axonogenesis, microtubule binding, dendrite development, central nervous system neuron development, establishment of cell polarity, negative regulation of axon extension, neuron projection development, dendrite morphogenesis, regulation of axonogenesis Microtubule, postsynaptic density, dendrite, nuclear periphery, axon initial segment, dendritic shaft, axon hillock, cell body, CA3 pyramidal cell dendrite, proximal neuron projection dystroglycan binding, tubulin binding
下载: 导出CSV
S4. KEGG pathways of differentially expressed lncRNAs and corresponding mRNAs after microwave exposure
Groups mRNA
(transcripts, genes)lncRNA
(transcripts,genes)KEGG pathways L10 vs. S ENSRNOT00000000117, Cplx2 MSTRG.14373.2, Cplx2 Synaptic vesicle cycle C10 vs. S ENSRNOT00000002044, Napa MSTRG.1068.1 Synaptic vesicle cycle ENSRNOT00000031230, Agap2 MSTRG.31244.1 FoxO signaling pathway, Endocytosis ENSRNOT00000084012, Agap2 MSTRG.31244.1 FoxO signaling pathway, Endocytosis ENSRNOT00000022351, Dlgap1 MSTRG.35922.1, Dlgap1 Glutamatergic synapse LC10 vs. S ENSRNOT00000023196, Pdgfb MSTRG.31953.1, Pdgfb MAPK signaling pathway, Ras signaling pathway, Rap1 signaling pathway, PI3K-Akt signaling pathway, and et al. ENSRNOT00000018190, Rala MSTRG.14864.1 Ras signaling pathway, Rap1 signaling pathway and et al. LC10 vs. L10 None None None LC10 vs. C10 None None None L10 vs. C10 None None None
下载: 导出CSV
S5. Differential genes for validation after microwave exposure
lncRNA mRNA transcripts genes log2 (FC)
L10 vs. Slog2 (FC)
C10 vs. Slog2 (FC)
LC10 vs. Stranscripts genes log2 (FC)
L10 vs. Slog2 (FC)
C10 vs. Slog2 (FC)
LC10 vs. SMSTRG.1068.1 NA −0.4 −0.46 −0.69 ENSRNOT00000002044 Napa −0.17 −0.28 −0.2 MSTRG.27033.1 Slc24a2 0.43 0.38 0.61 ENSRNOT00000083373 Slc24a2 −0.36 −0.66 −0.47 MSTRG.31953.1 Pdgfb −0.52 −0.73 −0.84 ENSRNOT00000023196 Pdgfb −0.2 −0.32 −0.29 MSTRG.31953.1 Pdgfb −0.52 −0.73 −0.84 ENSRNOT00000023066 Syngr1 0.31 −1.01 −1.68 MSTRG.35922.1 Dlgap1 0.05 0.45 0.42 ENSRNOT00000022351 Dlgap1 −0.24 −0.33 −0.17 Note. NA meant not available in the datebase.
下载: 导出CSV
S6. Statistical analysis of differential gene validation results
Differential gene Comparison Significantly different? F value P value MSTRG.1068.1 L-band main effect No F (1,12) = 1.681 0.204 C-band main effect No F (1,12) = 4.107 0.051 Interaction effect No F (1,12) = 0.799 0.378 S vs. L10 No 0.133 S vs. C10 Yes 0.048 S vs. LC10 No 0.194 ENSRNOT00000002044 L-band main effect No F (1,12) = 0.240 0.628 C-band main effect No F (1,12) = 1.533 0.225 Interaction effect No F (1,12) = 1.304 0.262 S vs. L10 No 0.684 S vs. C10 No 0.946 S vs. LC10 No 0.231 MSTRG. 27033.1 L-band main effect No F (1,12) = 0.035 0.853 C-band main effect Yes F (1,12) = 10.011 0.004 Interaction effect No F (1,12) = 0.918 0.358 S vs. L10 No 0.577 S vs. C10 Yes 0.010 S vs. LC10 Yes 0.016 ENSRNOT00000083373 L-band main effect Yes F (1,12) = 4.592 0.040 C-band main effect No F (1,12) = 3.211 0.083 Interaction effect No F (1,12) = 1.67 0.206 S vs. L10 Yes 0.018 S vs. C10 No 0.043 S vs. LC10 Yes 0.007 MSTRG.31953.1 L-band main effect Yes F (1,12) = 10.307 0.004 C-band main effect Yes F (1,12) = 46.186 0.000 Interaction effect No F (1,12) = 2.877 0.102 S vs. L10 Yes 0.002 S vs. C10 Yes 0.000 S vs. LC10 Yes 0.000 ENSRNT00000023196 L-band main effect No F (1,12) = 3.601 0.067 C-band main effect Yes F (1,12) = 4.326 0.046 Interaction effect No F (1,12) = 1.391 0.248 S vs. L10 Yes 0.032 S vs. C10 Yes 0.033 S vs. LC10 Yes 0.007 ENSRNOT000000023066 L-band main effect Yes F (1,12) = 5.545 0.025 C-band main effect No F (1,12) = 3.244 0.081 Interaction effect No F (1,12) = 2.9 0.099 S vs. L10 Yes 0.007 S vs. C10 Yes 0.021 S vs. LC10 Yes 0.006 MSTRG. 35922.1 L-band main effect No F (1,12) = 2.366 0.134 C-band main effect No F (1,12) = 0.395 0.534 Interaction effect No F (1,12) = 0.087 0.770 S vs. L10 No 0.204 S vs. C10 No 0.519 S vs. LC10 No 0.135 ENSRNOT00000022351 L-band main effect No F (1,12) = 3.709 0.065 C-band main effect Yes F (1,12) = 23.21 0.000 Interaction effect No F (1,12) = 4.142 0.052 S vs. L10 No 0.932 S vs. C10 No 0.060 S vs. LC10 Yes 0.000
下载: 导出CSV
-
[1] Wang H, Peng RY, Zhou HM, et al. Impairment of long-term potentiation induction is essential for the disruption of spatial memory after microwave exposure. Int J Radiat Biol, 2013; 89, 1100−7. doi: 10.3109/09553002.2013.817701 [2] Zhu RQ, Wang H, Xu XP, et al. Effects of 1.5 and 4.3 GHz microwave radiation on cognitive function and hippocampal tissue structure in Wistar rats. Sci Rep, 2021; 11, 10061. doi: 10.1038/s41598-021-89348-4 [3] Wang H, Tan SZ, Dong J, et al. iTRAQ quantitatively proteomic analysis of the hippocampus in a rat model of accumulative microwave-induced cognitive impairment. Environ Sci Pollut Res, 2019; 26, 17248−60. doi: 10.1007/s11356-019-04873-0 [4] Wang H, Liu Y, Sun YB, et al. Changes in rat spatial learning and memory as well as serum exosome proteins after simultaneous exposure to 1.5 GHz and 4.3 GHz microwaves. Ecotoxicol Environ Saf, 2022; 243, 113983. doi: 10.1016/j.ecoenv.2022.113983 [5] Ma NN, Tie C, Yu B, et al. Identifying lncRNA-miRNA-mRNA networks to investigate Alzheimer's disease pathogenesis and therapy strategy. Aging (Albany NY), 2020; 12, 2897−920. [6] Wang H, Peng RY, Zhao L, et al. The relationship between NMDA receptors and microwave-induced learning and memory impairment: a long-term observation on Wistar rats. Int J Radiat Biol, 2015; 91, 262−9. doi: 10.3109/09553002.2014.988893 [7] Uehara A, Iwamoto T, Kita S, et al. Different cation sensitivities and binding site domains of Na+-Ca2+-K+ and Na+-Ca2+ exchangers. J Cell Physiol, 2005; 203, 420−8. doi: 10.1002/jcp.20231 [8] Wang H, Zhang J, Hu SH, et al. Real-time microwave exposure induces calcium efflux in primary hippocampal neurons and primary cardiomyocytes. Biomed Environ Sci, 2018; 31, 561−71. [9] Belfort GM, Bakirtzi K, Kandror KV. Cellugyrin induces biogenesis of synaptic-like microvesicles in PC12 cells. J Biol Chem, 2005; 280, 7262−72. doi: 10.1074/jbc.M404851200 [10] Wang H, Tan SZ, Xu XP, et al. Long term impairment of cognitive functions and alterations of NMDAR subunits after continuous microwave exposure. Physiol Behav, 2017; 181, 1−9. doi: 10.1016/j.physbeh.2017.08.022 -
 22212Supplementary Materials.pdf

-

 点击查看大图
计量
- 文章访问数: 812
- HTML全文浏览量: 345
- PDF下载量: 74
- 被引次数: 0

 Quick Links