

 下载:
下载:


-
Alzheimer’s disease (AD) is a primary cause of dementia in senior people affecting more than 35 million individuals globally. Available treatments for AD are symptomatic in nature and are only sufficient to temporarily improve the quality of life of patients in the late stages [1,2]. Before the terminal stage of the disease named dementia of the Alzheimer type (DAT), patients will experience the subjective cognitive decline (SCD) and mild cognitive impairment (MCI) stages. Previous research evidence suggests that the pathophysiological changes associated with AD begin at least 10 to 25 years before dementia onset [3,4]. Unfortunately, most of the drugs against AD were proven to have no effect for DAT. Thus, there is an urgent need to identify early pathophysiological changes and biomarkers for the diagnosis of AD in the pre and early clinical stages such as MCI and even SCD [1,5-7].
However, the real challenge faced in the detection of CSF tau protein and Aβ is that, for patients with AD who have typical symptoms of dementia, there is currently no effective treatment. Patients and their families often do not accept cerebrospinal fluid (CSF) extraction procedure for early diagnosis and screening of AD. As for patients themselves, it is also difficult for them to accept the invasive CSF extraction procedure as an ideal test for diagnosis [6,8]. Therefore, the screening of CSF tau protein and Aβ among patients with AD is still rare in China. With the continuous progress of AD biomarker research, more scholars are looking for non-invasive biomarkers for AD diagnosis, especially for early diagnosis [7,8]. At present, research on the feasibility of small molecule nucleic acids and specific proteins as biomarkers in the diagnosis of AD has emerged as a hot spot.
MicroRNAs (miRs) are a class of small (18–25 nucleotides), single-stranded non-coding RNAs involved in the post-transcriptional regulation of gene expression. In recent years, miRs have been proven to play a suite of important roles in the manifestation of diseases such as cancer, cardiovascular system, diabetes, as well as central nervous system. Furthermore, because of their stability, altered miRs in tissues and organs could cause the deregulation of miRs in the body fluids such as CSF, serum, urine etc., via cell destruction or secretion. Therefore, miRNAs are attractive targets in the search for novel biomarkers [9-11].
In our previous study, we reported that miR-135a is a regulator of beta-site amyloid beta A4 precursor protein-cleavage enzyme 1 (BACE-1) [11]. miR-135a was down-regulated in the hippocampal neurons but was up-regulated in the exosomes from CSF and plasma in the APP/PS1 double-transgenic mice [11,12]. These results indicate that the transport of miR-135a from intracellular to extracellular by particular exosomes was the reason why the intracellular miR-135a level was low and the exosomal miR-135a level was high. However, using specimens from patients with AD, we found that exosomal miR-135a was only elevated in the serum specimens of about 50% of patients, which is very different from the standardized mouse model experiment. Further exosome protein profiling results showed that the expression of CSF and serum exosomal membrane protein ABCA1, an ATP-binding cassette subfamily A 1 exporter in patients with DAT was significantly higher compared to the healthy control group, suggesting the increase of exosomal miR-135a. Due to the complex origin of CSF and peripheral blood exosomes, such as exosome secretion of blood cells, high miR-135a exosomes may not be effectively isolated and detected, contributing to false negative results in the diagnosis of patients with AD. In the present study, ABCA1 protein was used as a specific label to capture specific exosomes, and the level of ABCA1-labeled exosomal miR-135a was evaluated for the diagnosis of AD, especially in patients with early stages of AD.
-
This study has been approved by the ethics committee of Xuanwu Hospital of Capital Medical University, and written informed consents from all subjects were obtained. Total subjects recruited were: 165 for SCD, 143 for MCI, 202 for DAT, and 30 healthy controls (Table 1). Matching CSF and blood specimens were collected from 19 patients with MCI, 13 patients with DAT and seven control subjects. All diagnoses were conducted by the doctors at the Neurology Department, Xuanwu Hospital of Capital Medical University. None of the subjects was diagnosed with any form of cancers. After a fasting period of 10–12 h, specimens of venous blood were collected into vacuum tubes, and the plasma and/or serum was isolated within 1 h. The clotted whole blood specimens were centrifuged at 3,000 ×g for 7 min to harvest serum; the EDTA-blood was centrifuged at 1,200 ×g for 7 min to separate blood cells [11,12]. CSF specimen was drawn within 2 h after the blood collection, and yielded an average total cell amount of approximately 7.5 × 10⁶/L. The CSF and serum specimens were stored in liquid nitrogen until further analysis. To ensure cells are intact in subsequent experiments, all specimens were freeze-thawed only once.
Table 1. Demographics and clinical characteristics of subjects
Variable Control (serum) Control (CSF) SCD (serum) MCI (serum) MCI (CSF) DAT (serum) DAT (CSF) No. of subjects 30 7 165 143 19 202 13 Age (years) 76.5 ± 6.1 69.4 ± 3.3 75.7 ± 4.9 75.2 ± 8.0 68.2 ± 5.1 78.1 ± 7.2 72.1 ± 4.3 Gender (% males) 50.0 57.1 54.5 55.9 57.9 55.0 53.8 Creatinine (mg/dL) 0.81 ± 0.15 0.71 ± 0.13 0.75 ± 0.21 0.78 ± 0.38 0.71 ± 0.31 0.85 ± 0.29 0.81 ± 0.19 Homocysteine (μmol/L) 8.3 ± 2.3 8.2 ± 1.2 8.9 ± 5.6 16.9 ± 5.2 18.9 ± 2.6 18.1 ± 5.4 21.1 ± 6.4 Body Mass Index (BMI, kg/m2) 25.7 ± 2.6 26.1± 3.3 26.3 ± 3.1 26.2 ± 2.9 26.1 ± 3.3 27.1 ± 4.2 25.1 ± 2.5 Heart rate (per min) 75.2 ± 8.1 75.9 ± 5.6 76.3 ± 7.2 73.3 ± 11.2 71.2 ± 7.8 75.5 ± 10.8 76.1 ± 9.3 Systolic blood pressure (mmHg) 122.1 ± 11.2 125.5 ± 7.5 126.0 ± 12.1 128.3 ± 16.1 128.6 ± 10.2 130.0 ± 15.9 125.0 ± 11.1 Diastolic blood pressure (mmHg) 79.5 ± 13.1 80.5 ± 9.8 82.6 ± 12.6 85.1 ± 16.7 88.1 ± 10.0 86.1 ± 16.3 82.7 ± 12.7 Hypertension treatment (%) 10.0 20.0 13.2 14.5 17.6 16.7 27.3 Statins treatment (%) 13.3 0.0 19.7 20.6 29.4 21.2 27.3 -
RBCs and WBCs of SCD, MCI, DAT, and control groups were separated using blood separation medium according to the manufacturer's protocol (Solarbio, Beijing, China). The separated RBCs and WBCs were washed with phosphate buffered saline (PBS) pre-warmed at 37 ˚C for five times and subsequently cultured in a serum-free RPMI 1640 medium (Invitrogen, Carlsbad, USA) at 1 × 10⁷ concentrations for 30 min, 1, 2, 4, and 6 h. The total miR-135a in the cells and culture medium as well as the exosomal miR-135a in medium were detected, respectively. All experiments were conducted in triplicate.
-
APP/PS1 double-transgenic mice of 3, 6, 9, and 12-month-old with a C57BL/6J genetic background were purchased from the Institute of Laboratory Animal Science, Chinese Academy of Medical Sciences and Comparative Medical Center. All animal handling protocols were approved by the ethics committee of Xuanwu Hospital of Capital Medical University. The matching non-transgenic mice were used as wild type (WT) controls. CSF-like fluid was collected as previously described [11]. Briefly, the mice were sacrificed and their brains were removed and placed in 35-mm dishes. The cranial cavity and cerebral ventricles (lateral, third and fourth ventricles) were rinsed with 500 μL PBS to harvest CSF cells; the washing solution resembled CSF-like fluid. Exosomes were isolated using the method described below and resuspended in 200 μL PBS; 100 μL exosomes from the 3, 6, 9, and 12-month-old APP/PS1 double-transgenic and WT mice as well as a PBS control were injected into the third ventricle of WT mice separately, using a brain solid positioner (Stoelting, Illinois, USA). After 1, 2, 4, and 6 h, the blood specimens were collected from the removed eyeballs and centrifuged at 3,000 ×g for 7 min to immediately harvest the serum after blood coagulation. CSF specimens were also harvested. All the serum and CSF specimens were used for exosome extraction and detection. Each group had a sample size of five.
-
Mouse hippocampal neuron cell line HT-22 (Cell bank of the Chinese Academy of Sciences, Shanghai, China) was grown in antibiotic-free DMEM (Invitrogen, Carlsbad, USA) supplemented with 10% exosome-free fetal bovine serum (Umibio, Shanghai, China) at 37 ˚C with 5% CO2. Sixteenth-day pregnant WT and transgenic mice were sacrificed by CO2 inhalation, and the fetal primary mouse hippocampal neurons were isolated as previously described [11,13]. Isolated cells were seeded in 6-well plates coated with 10 mg/mL poly-D-lysine (Sigma, St. Louis, USA) in NEUROBASAL™ media (Invitrogen) enriched with 2% B27 supplement (Invitrogen), 2 mmol/L glutamine (Invitrogen), 1 mmol/L sodium pyruvate (Invitrogen), 5 mg/mL insulin (Sigma), and 40 mg/mL of gentamicin (Invitrogen) at 37 ˚C with 5% CO2 [11-14]. Cells were cultured for 36 h prior to the detection of ABCA1 protein; the cell culture medium was also collected for the capture of ABCA1 protein-labeled exosomes and detection of free ABCA1 protein. Each group had a sample size of five.
-
The exosomes were isolated using the Total Exosome Isolation kit (Invitrogen) according to the manufacturer's instructions [12]. Briefly, the serum, plasma, CSF or medium were centrifuged at 2,000 ×g for 30 min to remove cells and debris. Subsequently, 400 μL of each fractionated specimen was transferred into a new tube and topped up with 0.4 volumes of the Total Exosome Isolation reagent. The serum/reagent solution was mixed gently and then incubated at 4 ˚C for 30 min. After incubation, specimens were centrifuged at 10,000 ×g for 10 min at 25 ˚C. The supernatant was discarded, and the pellet containing the exosomes was re-suspended in 200 μL PBS.
-
Total RNA in a 100 μL of specimen was purified using a spin column method with the miRNeasy Serum/Plasma Kit (QIAGEN, Hilden, Germany) according to the manufacturer's protocol [11,12]. Total RNA yields were ≥ 20 and ≥ 50 ng/mL in CSF and plasma, respectively, as assessed by using the Quant-iT RiboGreen RNA reagent (Invitrogen). Total RNA in blood cells was extracted using a spin column method with miRNeasy Kit (QIAGEN). MiRs were reversed into cDNAs by using miScriptII RTKit (QIAGEN) in a fixed volume of 10 μL reaction system, and were further amplified by using TaqMan qPCR (QIAGEN) according to the manufacturer's protocol. The 10 μL PCR assay comprised 1 μL cDNA, 300 nmol/L TaqMan probe, 300 nmol/L sense primer, and 300 nmol/L anti-sense primer. Cycling parameters were set at: 95 °C for 10 min, followed by 40 cycles of 95 °C for 15 s and 60 °C for 1 min (Roche Light Cycler 480). For body fluid samples, miRNeasy Serum/Plasma Spike-In Control (C. elegans miR-39 miR mimic, QIAGEN) was used as control; for cell specimens, U6 snRNA (RNU6B, QIAGEN) was used as endogenous control. The relative levels of miRs were calculated by using the 2−ΔΔCt method [15].
-
Protein was collected through lysis using a radioimmunoprecipitation assay (RIPA) buffer supplemented with 1:100 protease inhibitor (QIAGEN) and phosphatase inhibitor cocktail I & II (Sigma). Protein was quantified using a Bicinchoninic Acid Protein assay kit (Invitrogen). And samples were separated using SDS-polyacrylamide gel electro-phoresis prior to western blotting analysis. The separated proteins were transferred onto a PVDF membrane (Bio-Rad, Hercules, CA, USA). After blocking the membrane with 5% skimmed milk, the blots were incubated overnight at 4 °C with the appropriate primary antibody: 1:1,000 diluted monoclonal ABCA1 antibody (Invitrogen) and 1:1,000 diluted anti-β actin (System Biosciences, Ely, UK). Subsequently, after washing, the blots were incubated with the HRP-conjugated secondary antibody (Invitrogen) at room temperature for 1 h. After washing, immunoreactive bands were visualized using an Immobilon Western HRP (Millipore; USA) and detected with FluorChem HD2 (proteinsimple; USA) [11,12]. The β actin served as an internal reference, and each group had a sample size of three.
-
A commercially available ELISA coated plate (BIO-SWAMP, Wuhan, China) was used for ABCA1-labeled exosome capture: 100 μL of exosomal PBS solution was added to the reaction wells, and after 30 minutes incubation at 37 °C, the plate was washed three times with PBS and drained; then, the RNA extraction reagent of miRNeasy Serum/Plasma Kit (QIAGEN) was added to the wells, according to the manufacturer’s instructions [16,17]. The ABCA1 (BIO-SWAMP) and CD9 (EXOAB-CD9A-1, System Biosciences) ELISA tests were performed in strict accordance to the manufacturer’s instructions.
-
Statistical analyses and receiver working curve (ROC) analysis were performed using SPSS 18.0 for Windows (SPSS, Inc., Chicago, IL, USA). Since data collected were normally distributed, results are expressed as means ± standard deviations. The differences between groups were assessed using one-way ANOVA. Differences across groups were compared using the Chi-square test. Correlations were determined by computing the Spearman rank correlation coefficient. P < 0.05 was considered to indicate a statistically significant difference.
-
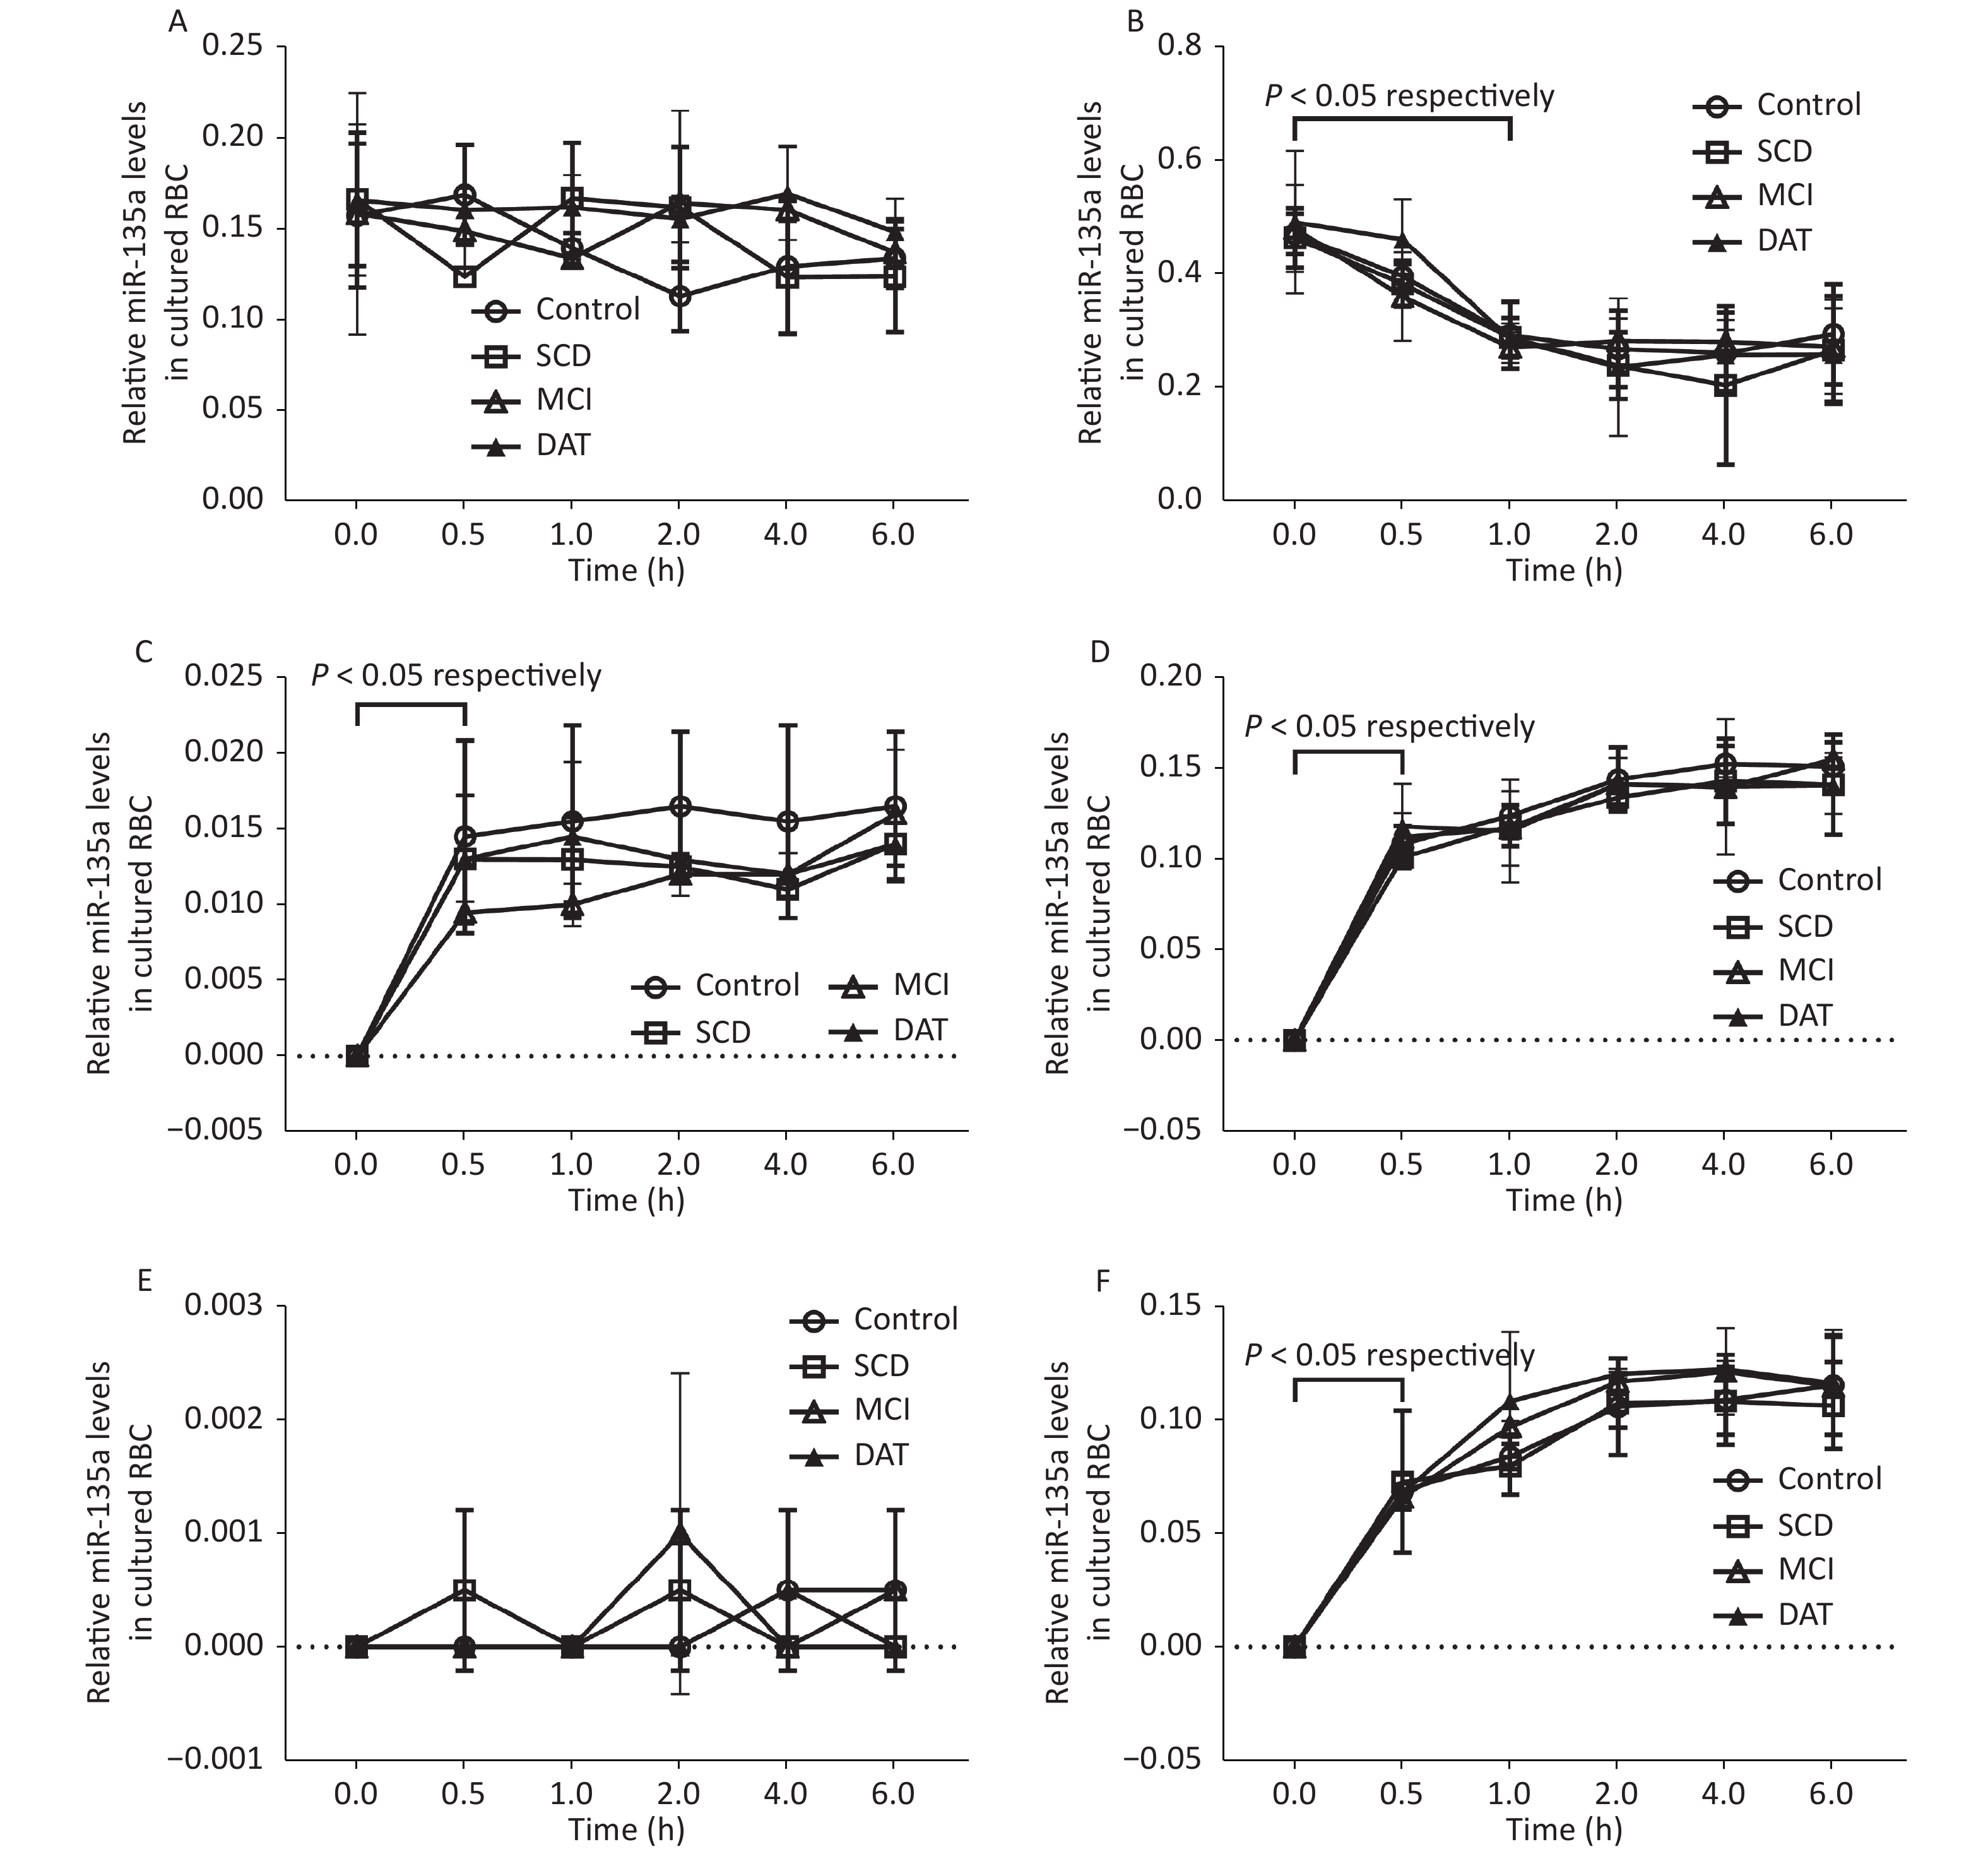
There was no changes observed in total miR-135a in RBCs after 6 h culture (P > 0.05); total miR-135a in WBCs significantly decreased after 1 h culture in all groups (P < 0.05). Total miR-135a in the RBC medium significantly increased after 0.5 h culture (P < 0.05) and subsequently plateaued for all groups (P > 0.05); the exosomal miR-135a did not change at all time points for all groups (P > 0.05). Total miR-135a and exosomal miR-135a in the WBC medium significantly increased after 0.5 h culture (P < 0.05) and continued to increase up to 2 h in all groups (P < 0.05) (Figure 1). The average relative miR-135a level, miR-135a secretion ratio, and miR-135a secretion ratio of WBCs were higher compared to RBCs (P < 0.05, Table 2).
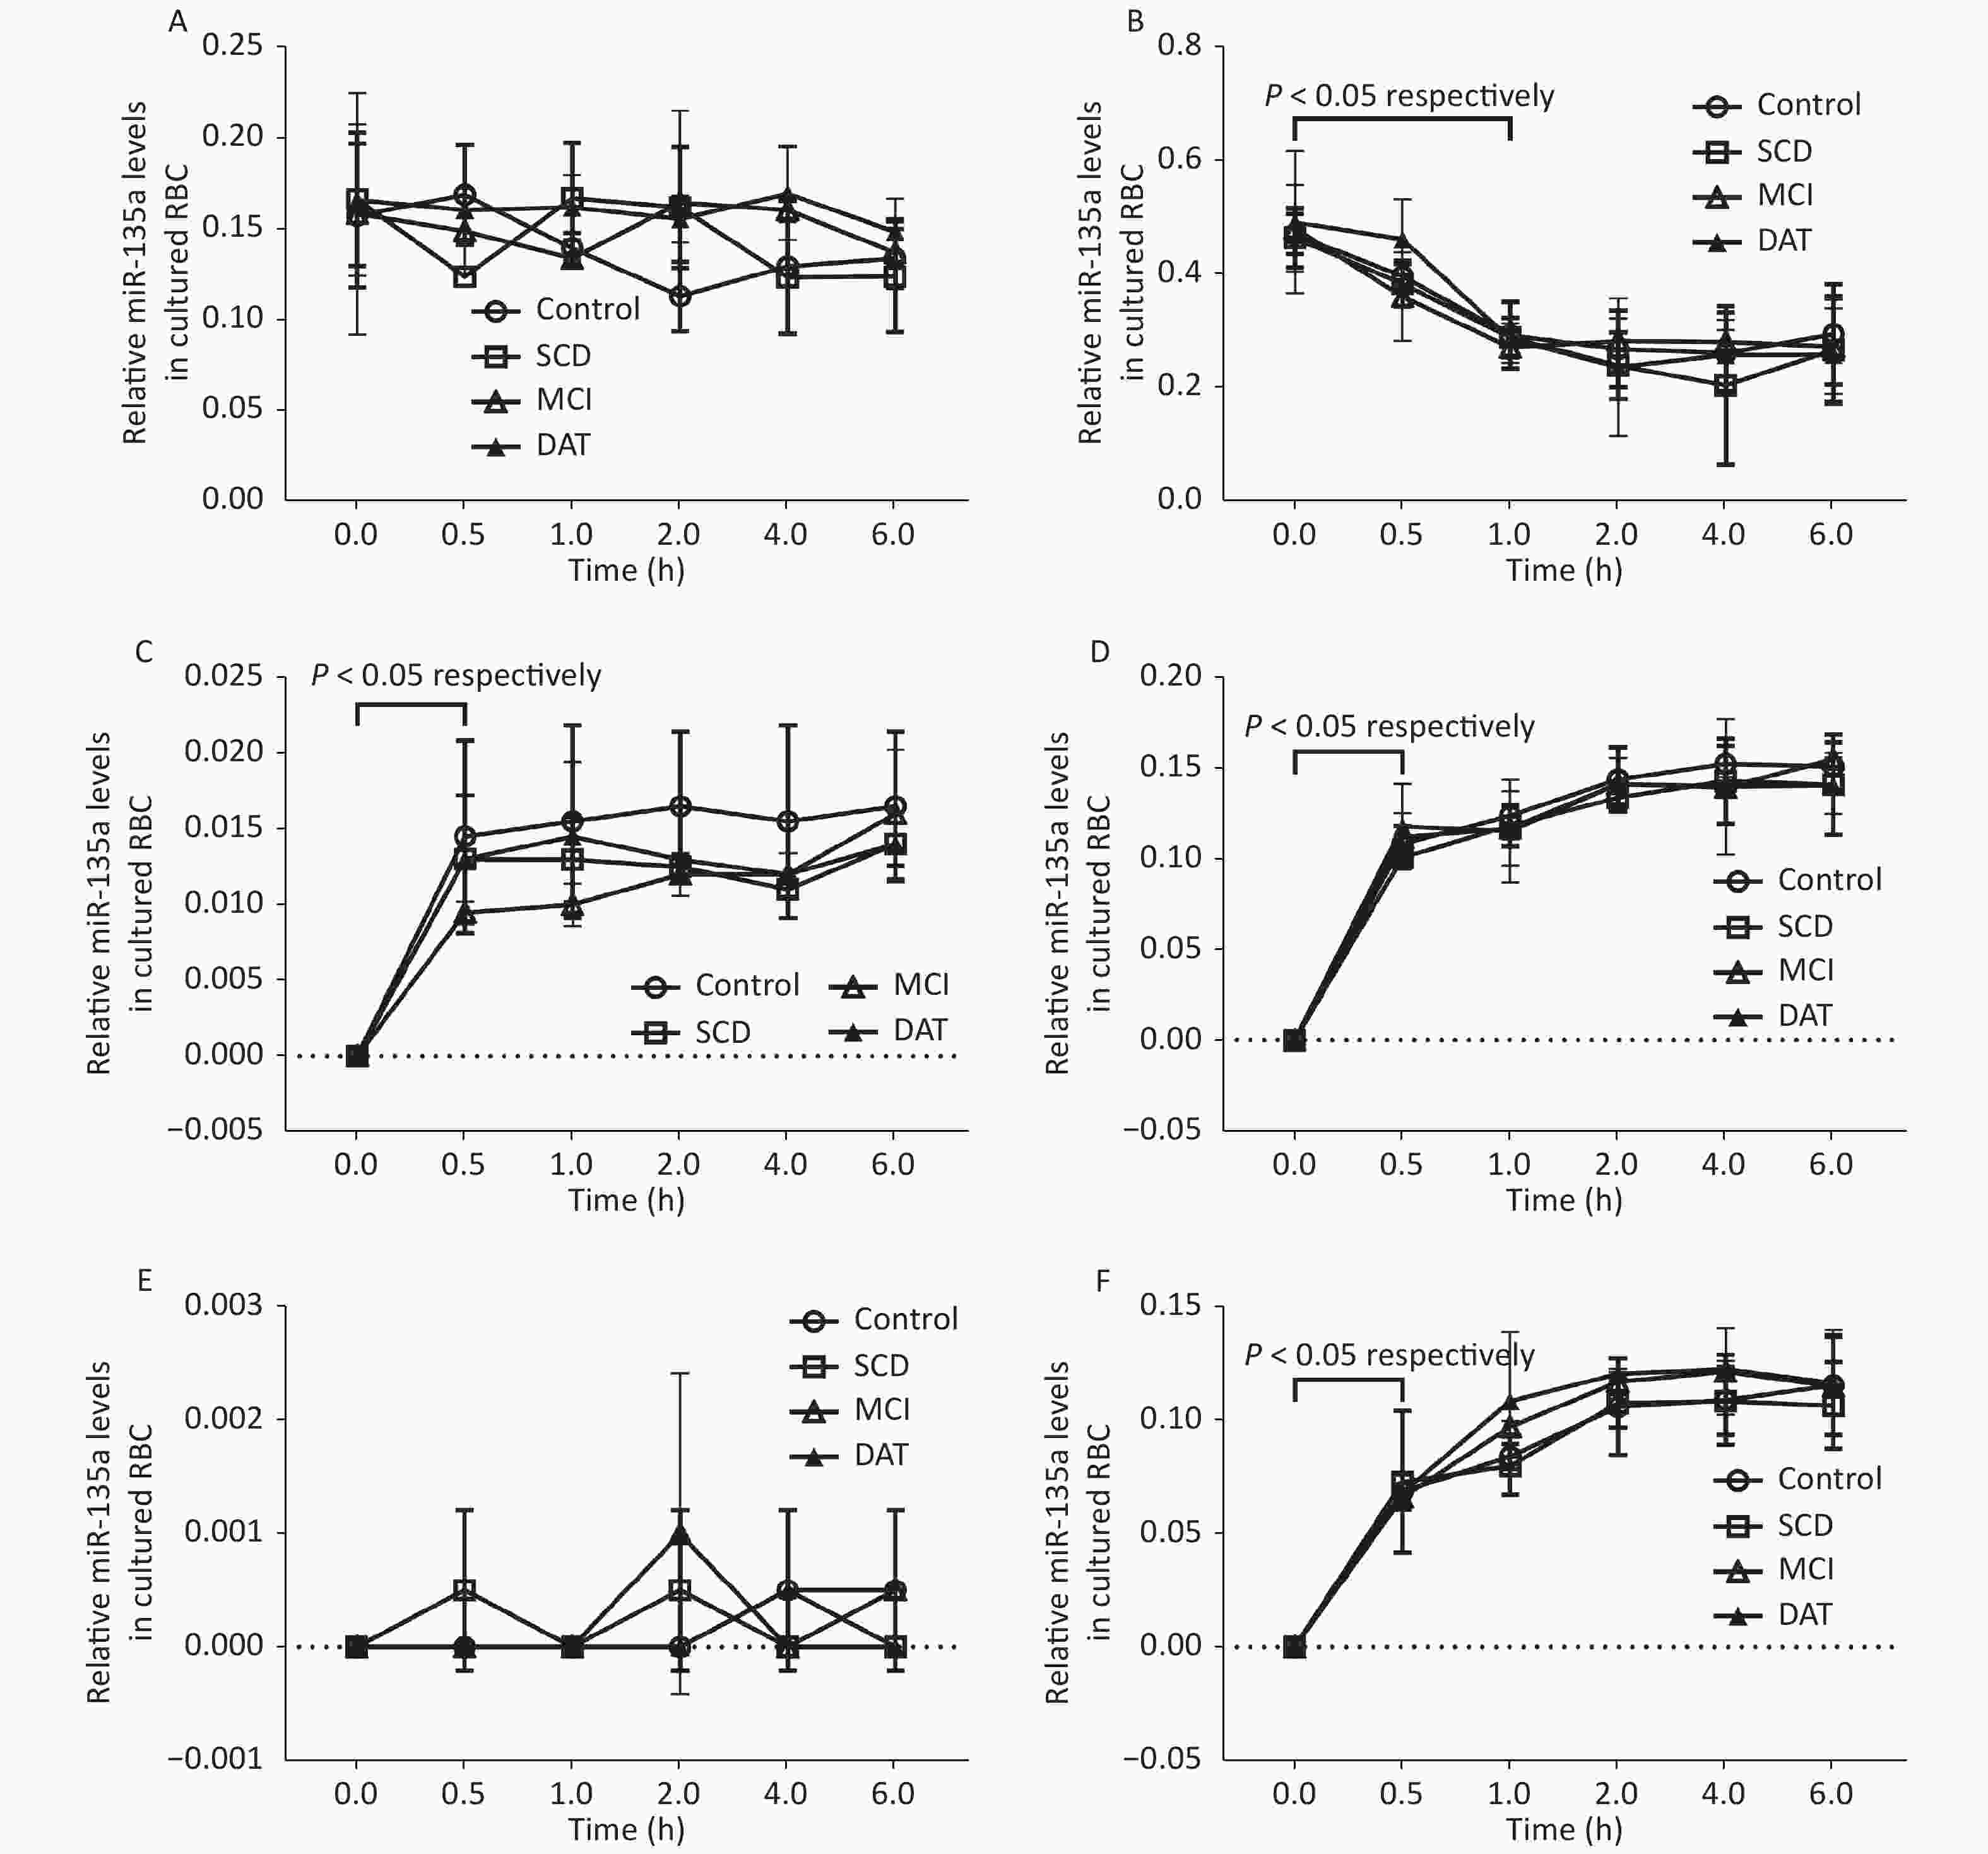
Figure 1. Exosomal miR-135a detection in RBC, WBC, and culture medium. Relative miR-135a levels in cultured RBCs (A) and WBCs (B) at different times. Relative miR-135a levels in the culture medium of RBCs (C) and WBCs (D) at different times. Relative exosomal miR-135a levels in the culture medium of RBCs (E) and WBCs (F) at different times. Experiments were performed in triplicate (n = 3) for all groups
Table 2. Exosomal miR-135a secretion ratio of cultured RBCs and WBCs
Cell type Total relative miR-135a level Total miR-135a secretion ratio (%) Exosomal miR-135a secretion ratio (%) 0.5 h 4 h 0.5 h 4 h RBC 0.136 7.23 8.39 0.00 0.01 WBC 0.435* 30.80* 32.13* 18.39* 22.99* Note. *There were significant differences compared with RBC group (P < 0.05), n = 12. -
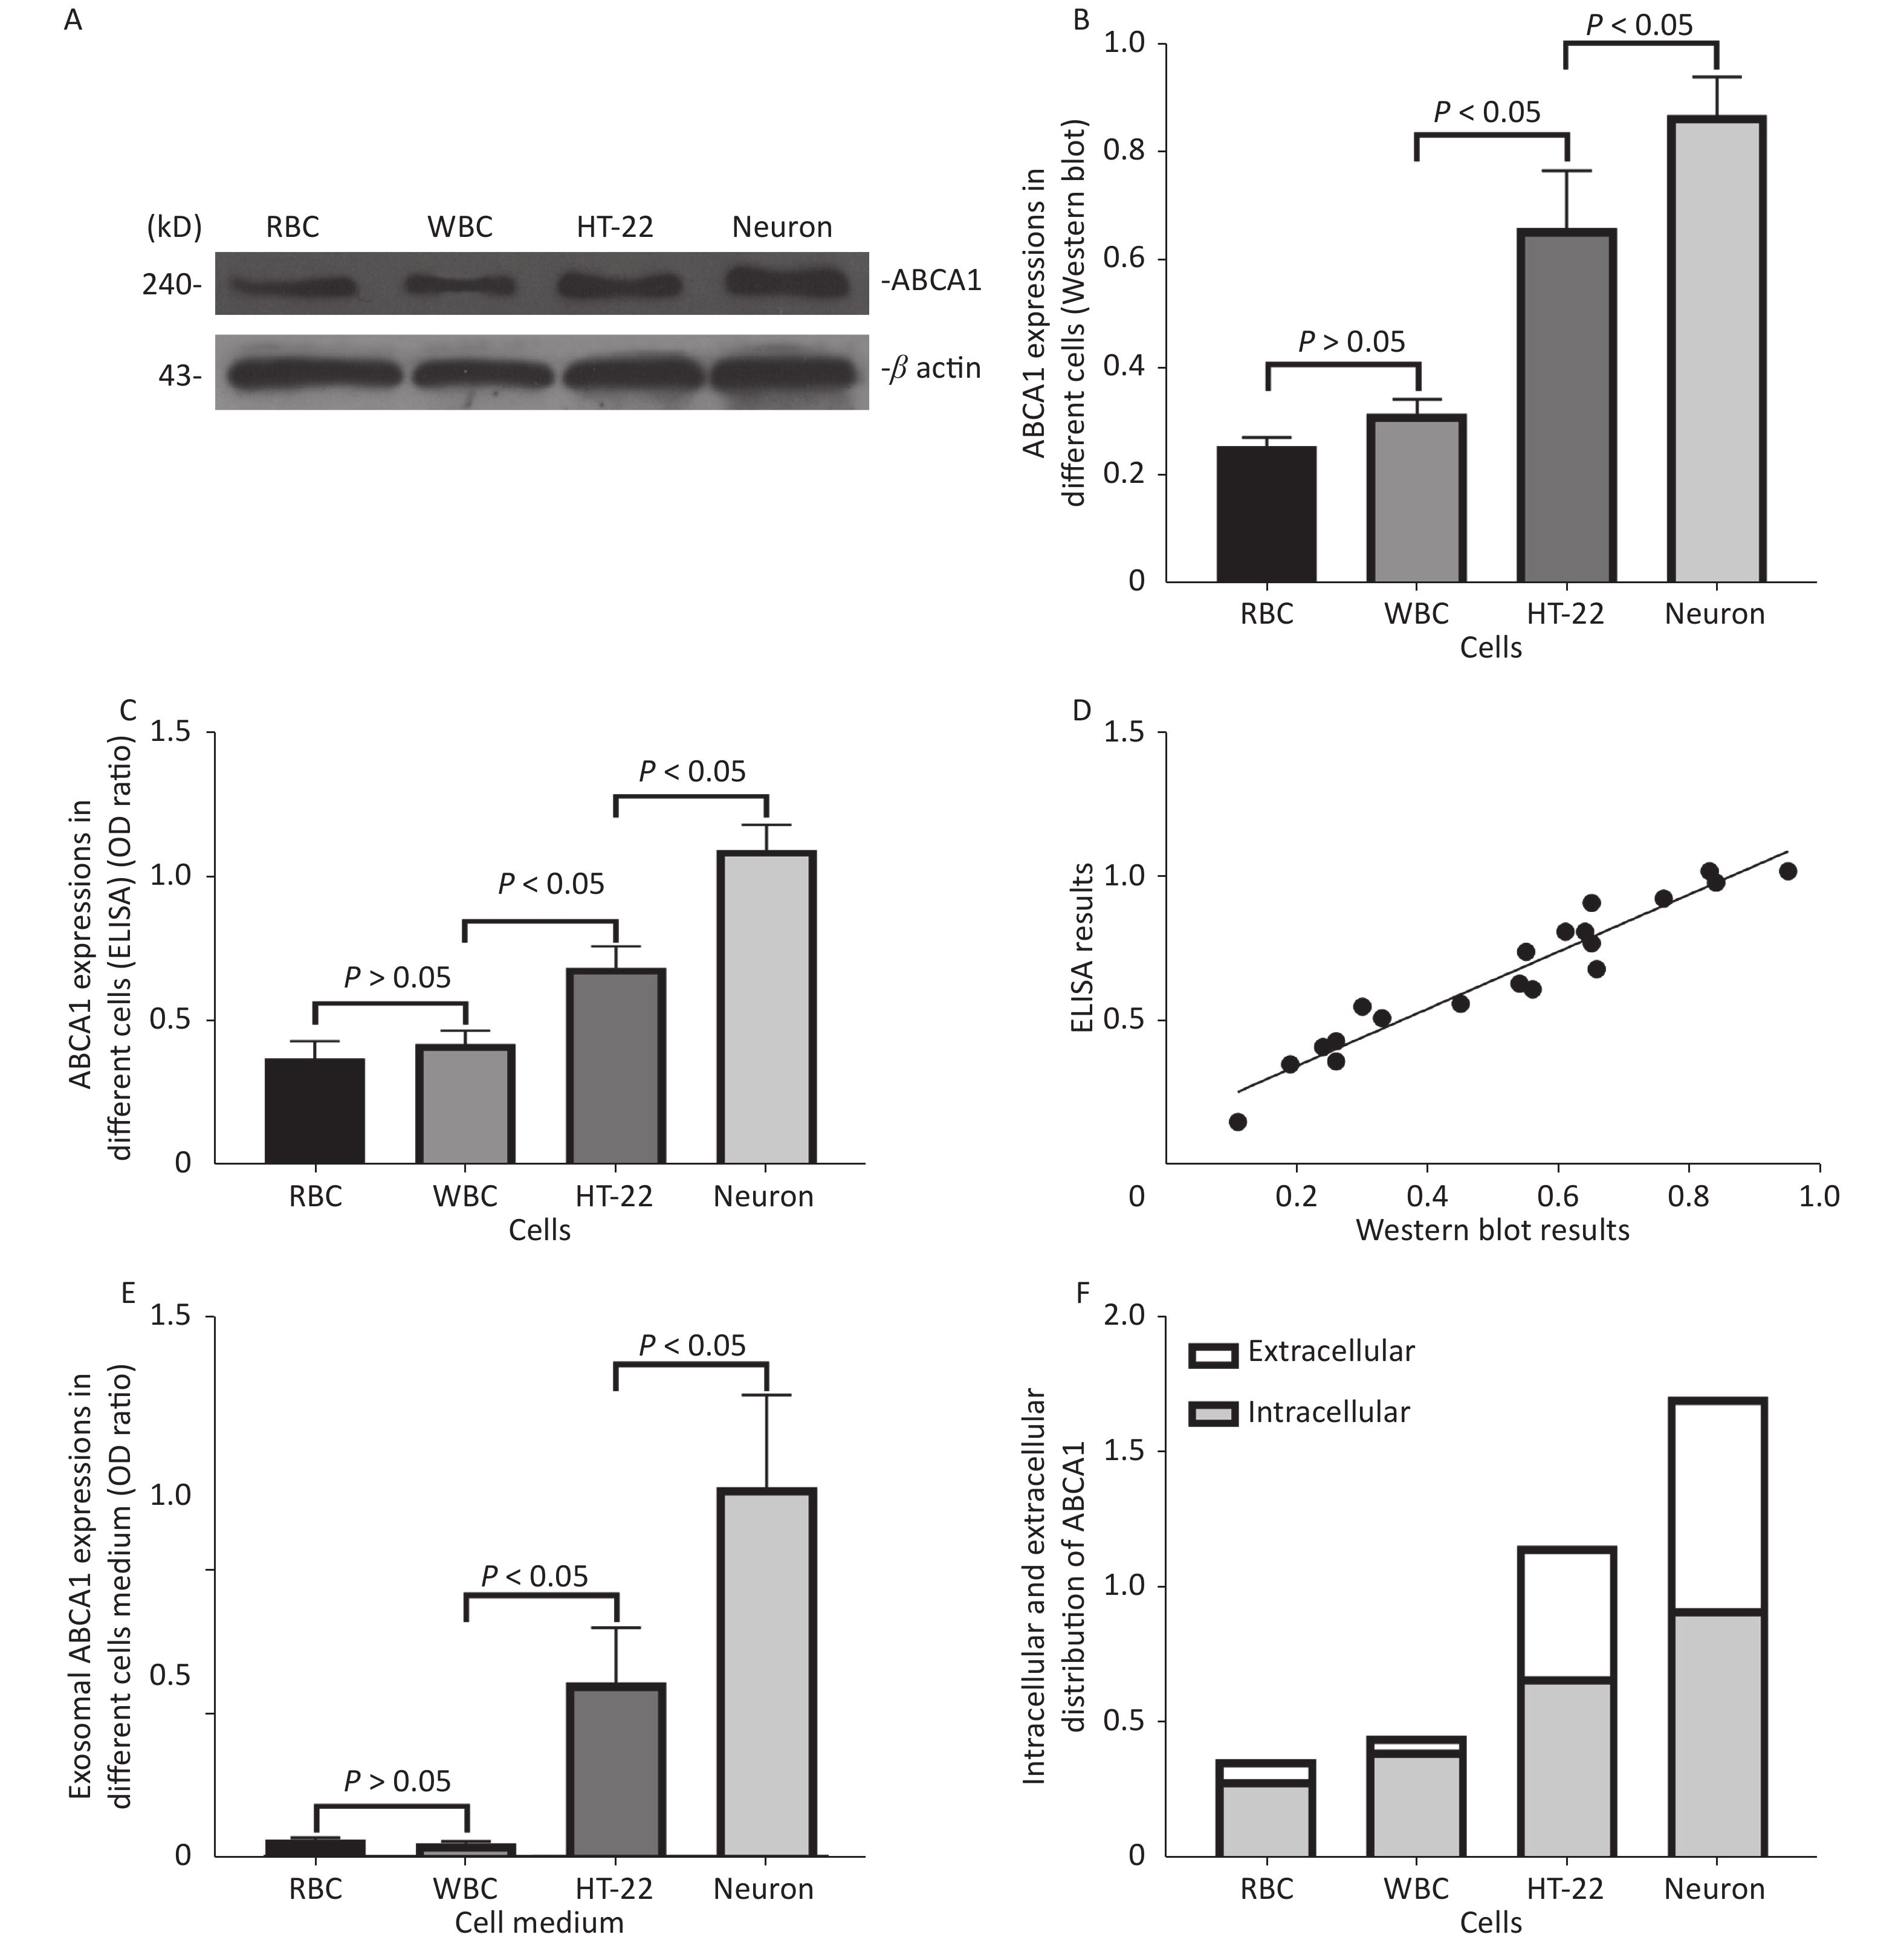
ABCA1 was expressed in RBC, WBC, HT-22 cells, and neurons, with the highest expression detected in neurons (P < 0.05). The ABCA1 levels of exosomes harvested from HT-22 cells and neurons culture medium was significantly higher compared to those of RBCs and WBCs (P < 0.05), with the highest expression in the neurons (P < 0.05). Results of ELISA and western blot revealed a consistent trend and positive correlation (r = 0.833, P < 0.05) (Figure 2).
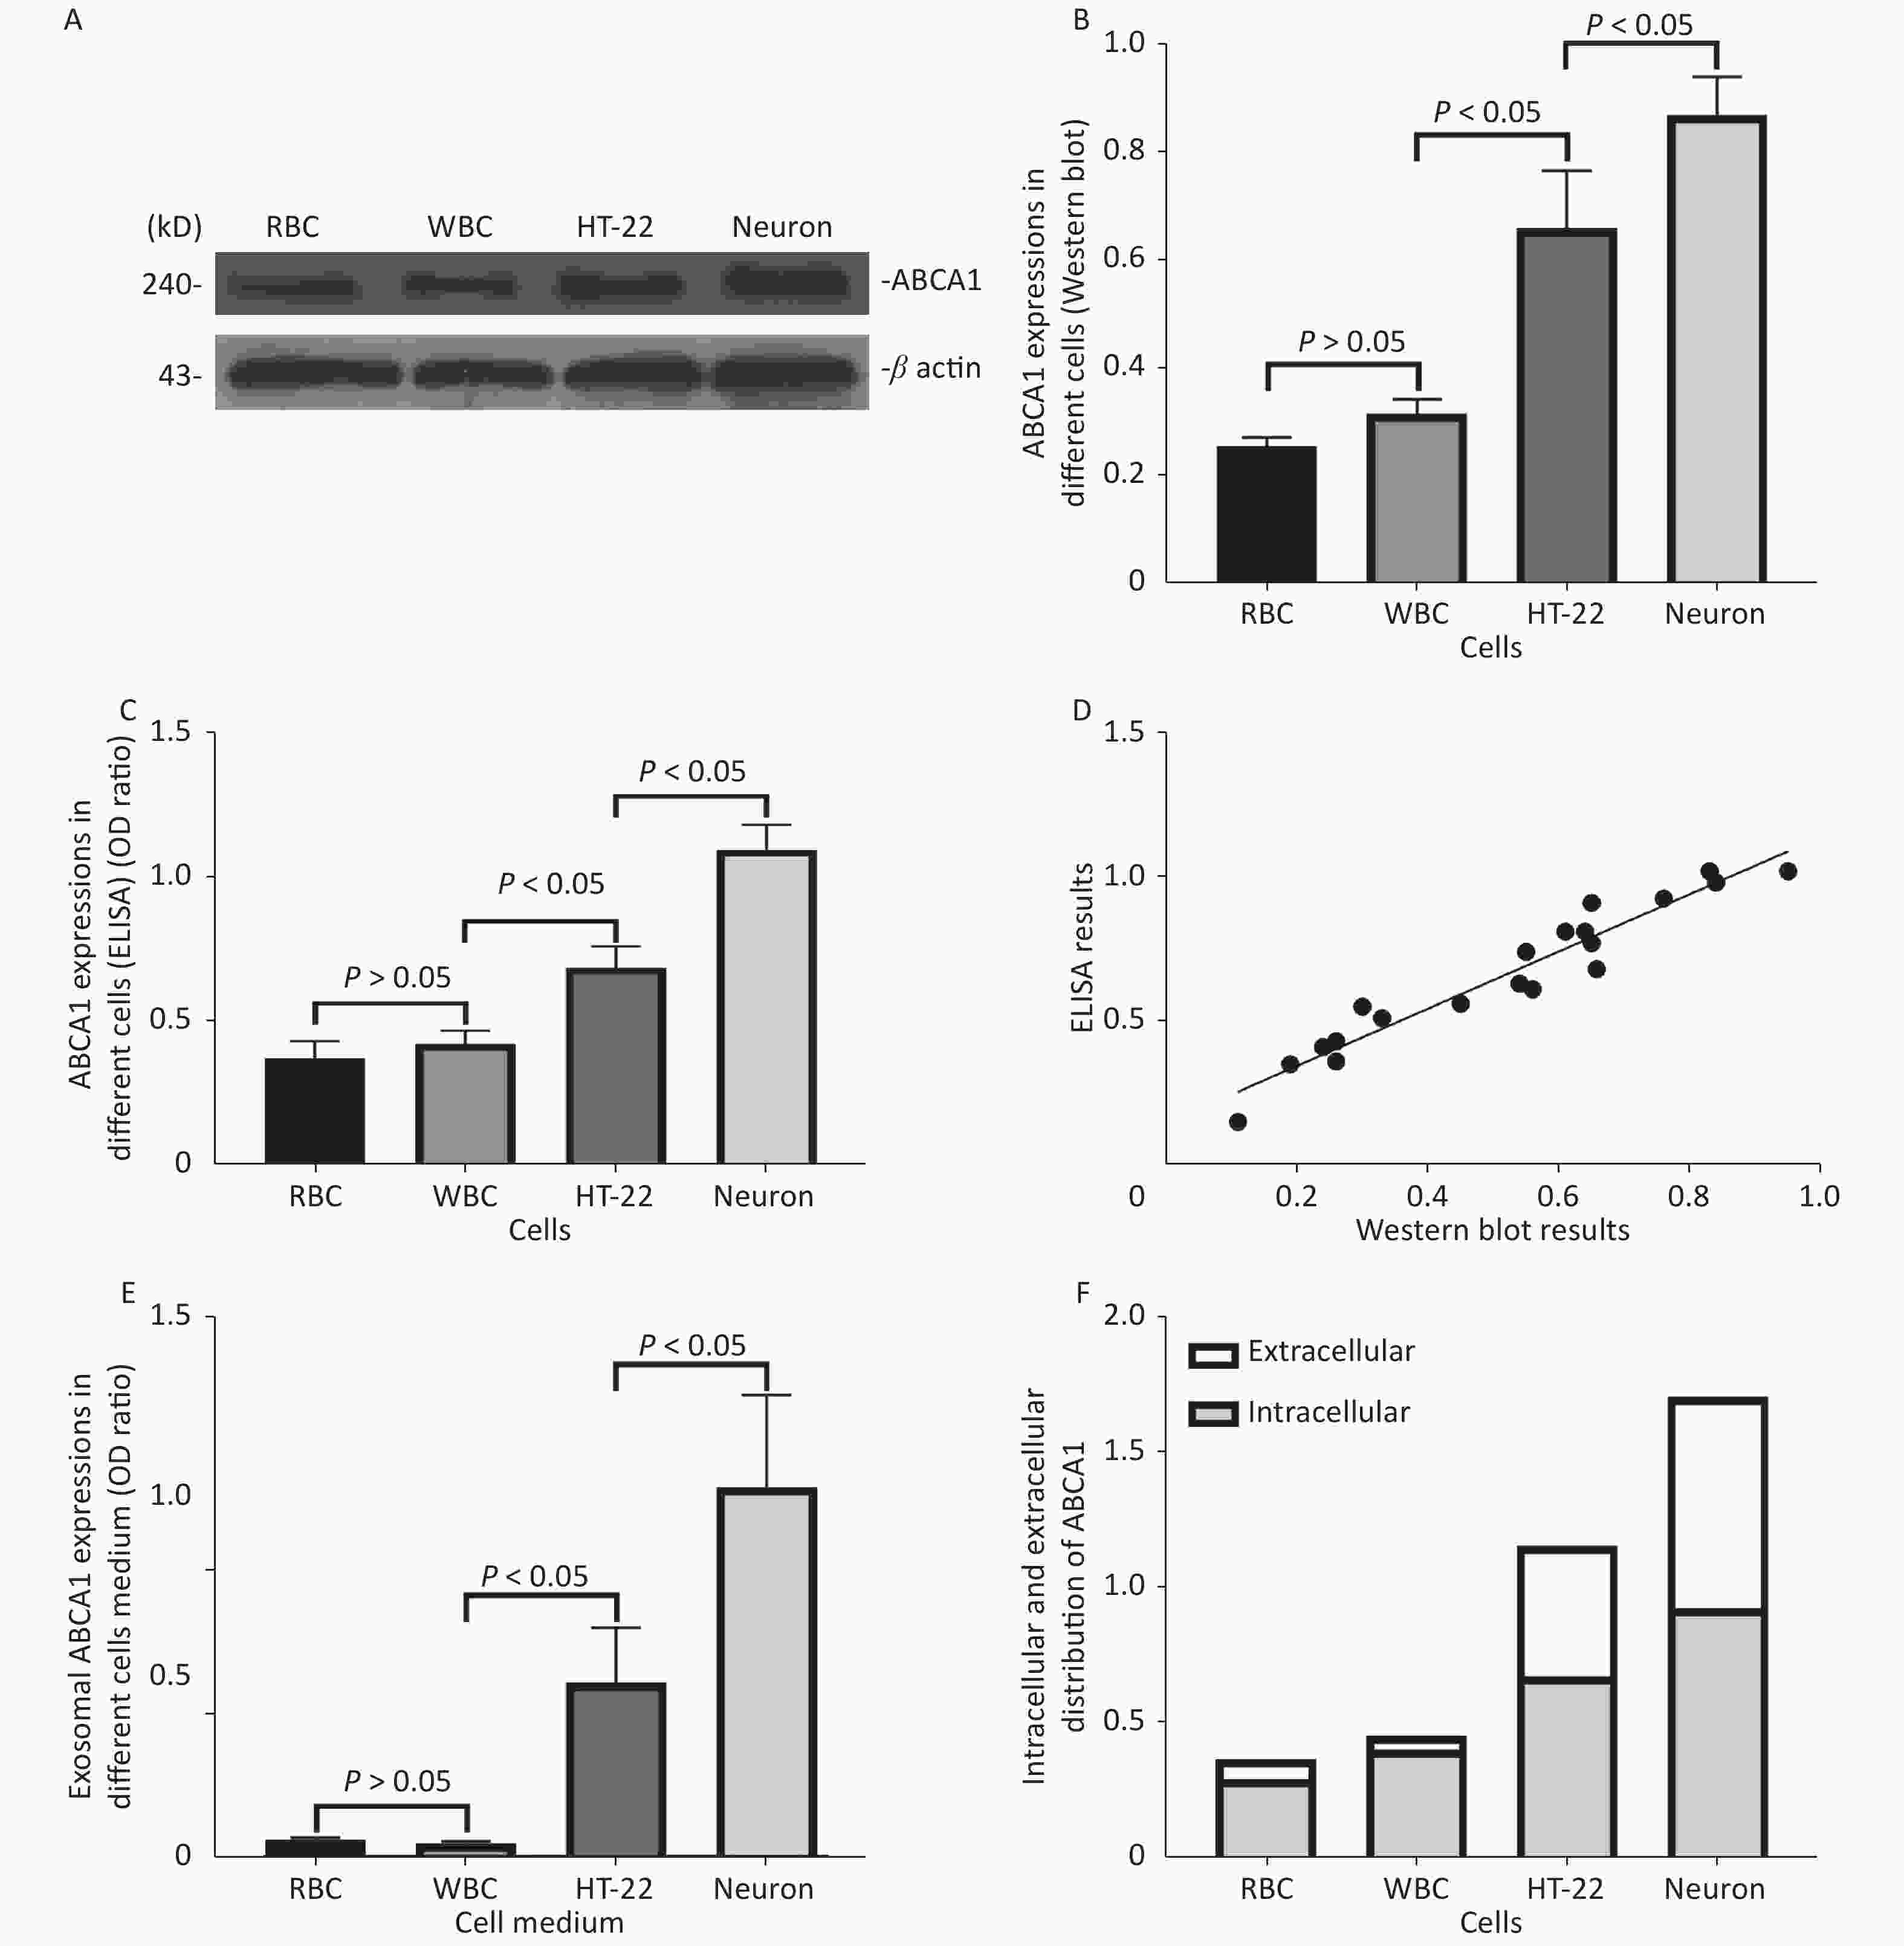
Figure 2. ABCA1 and ABCA1-labeled exosome detection in different cells. The Western blot (A, B) and ELISA (C) results of ABCA1 expressions in different cells, and the correlation between the results of western blot and ELISA (D) of the ABCA1 expressions in different cells. The ELISA results of exosomal ABCA1 levels in medium of different cells (E) and the ratio of intracellular ABCA1 and exosomal ABCA1 (F)
-
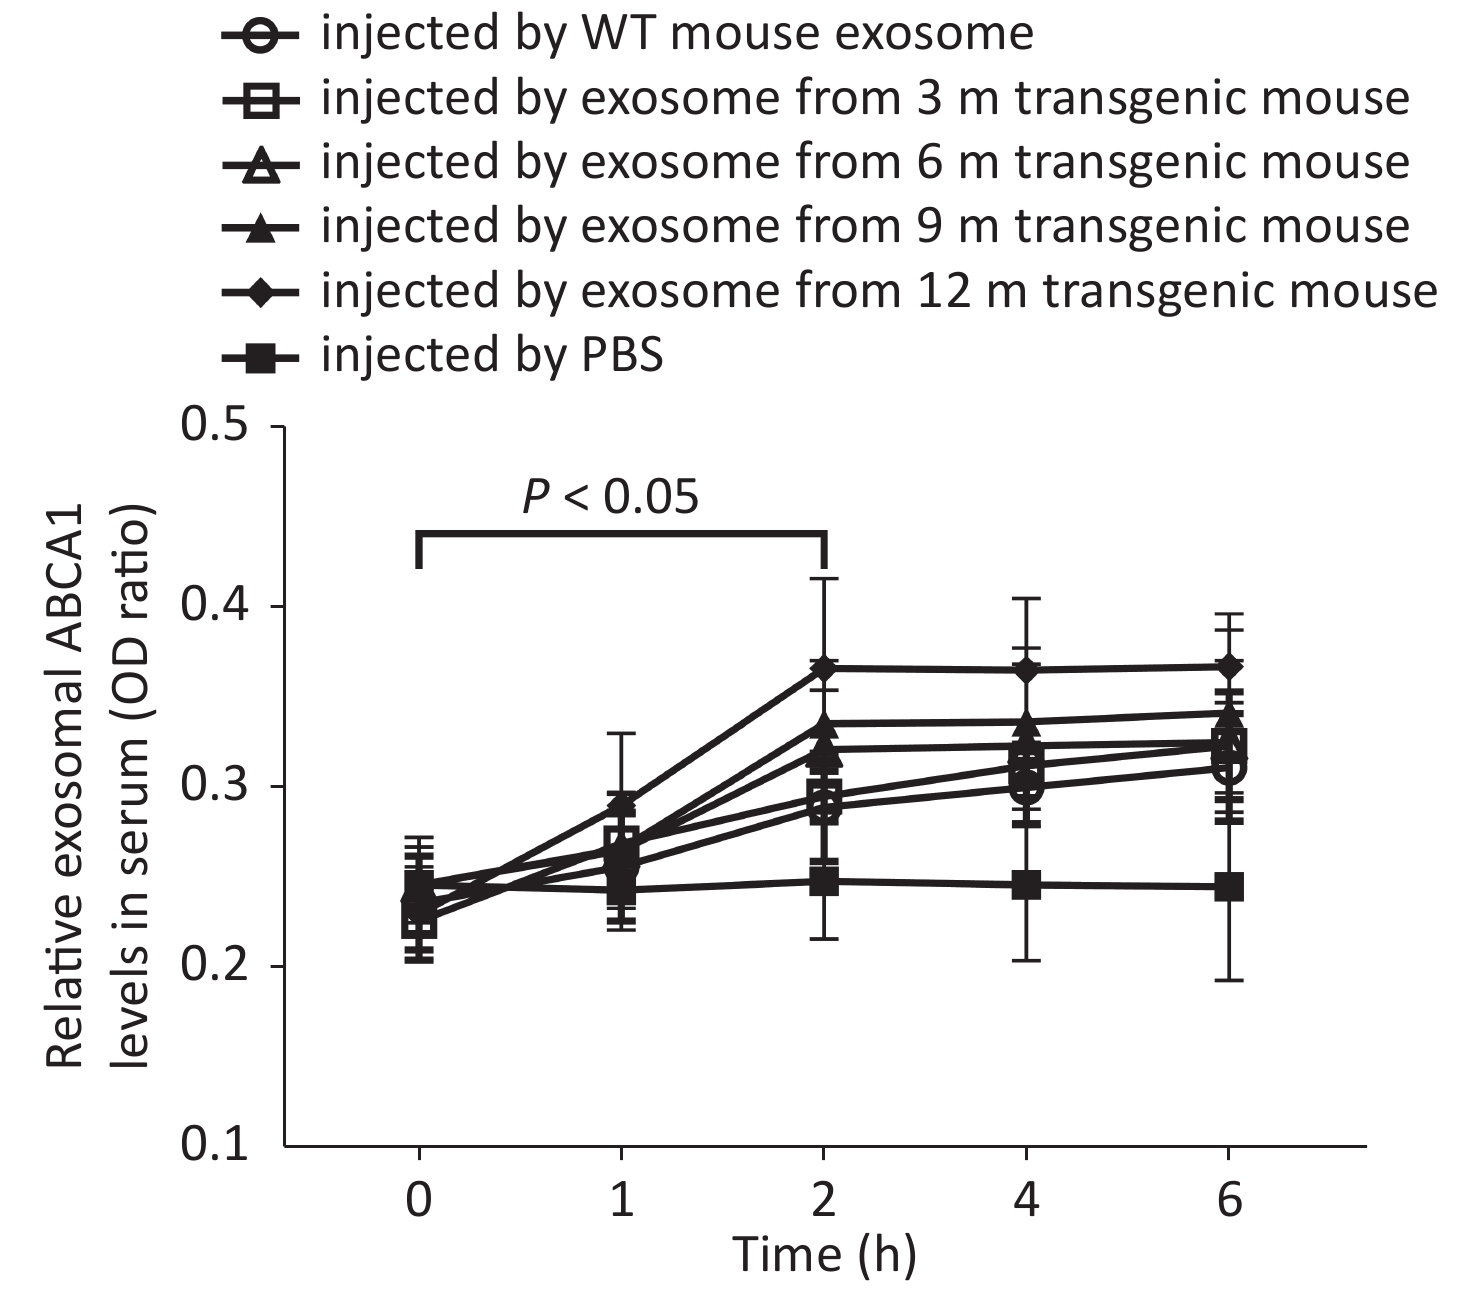
Two hours after APP/PS1-mice-exosome injection, exosomal ABCA1 levels in the serum of WT mice were significantly higher compared to the CSF (P < 0.05), with the highest expression detected in the 12 m-APP/PS1 mice group (Figure 3).
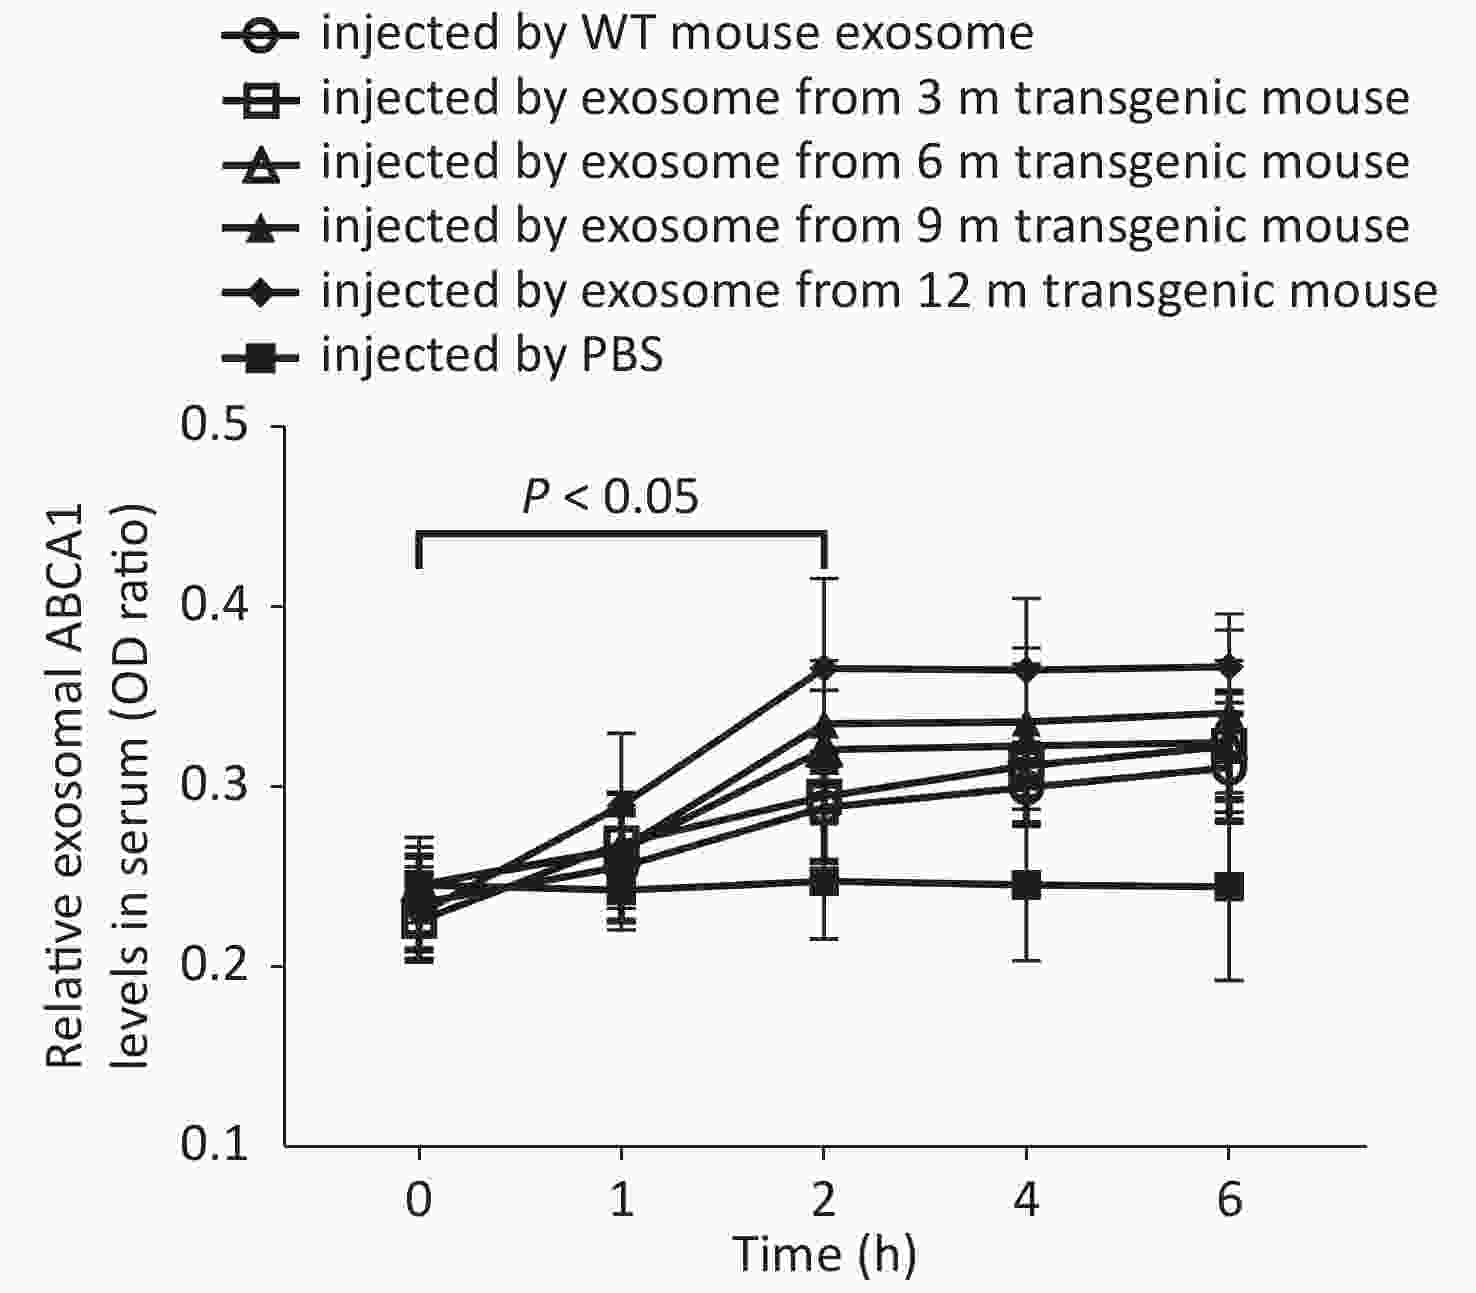
Figure 3. Levels of exosomal ABCA1 in the serum of control (wild-type) mice at different times after injection of exosomes from different transgenic mice CSF. The 12-month injection group had significantly higher levels of exosomal ABCA1 compared to that of PBS group, control group and 3-month group, at 2 h after the injection. There was significant difference between the experimental groups and control group.
-
Exosomal ABCA1 expressions increased remarkably in the CSF and serum of MCI and DAT patient groups compared to the control group (P < 0.05). Slight increase of ABCA1 was observed in the serum of patients with SCD compared to the control group (P > 0.05) (Figure 4).
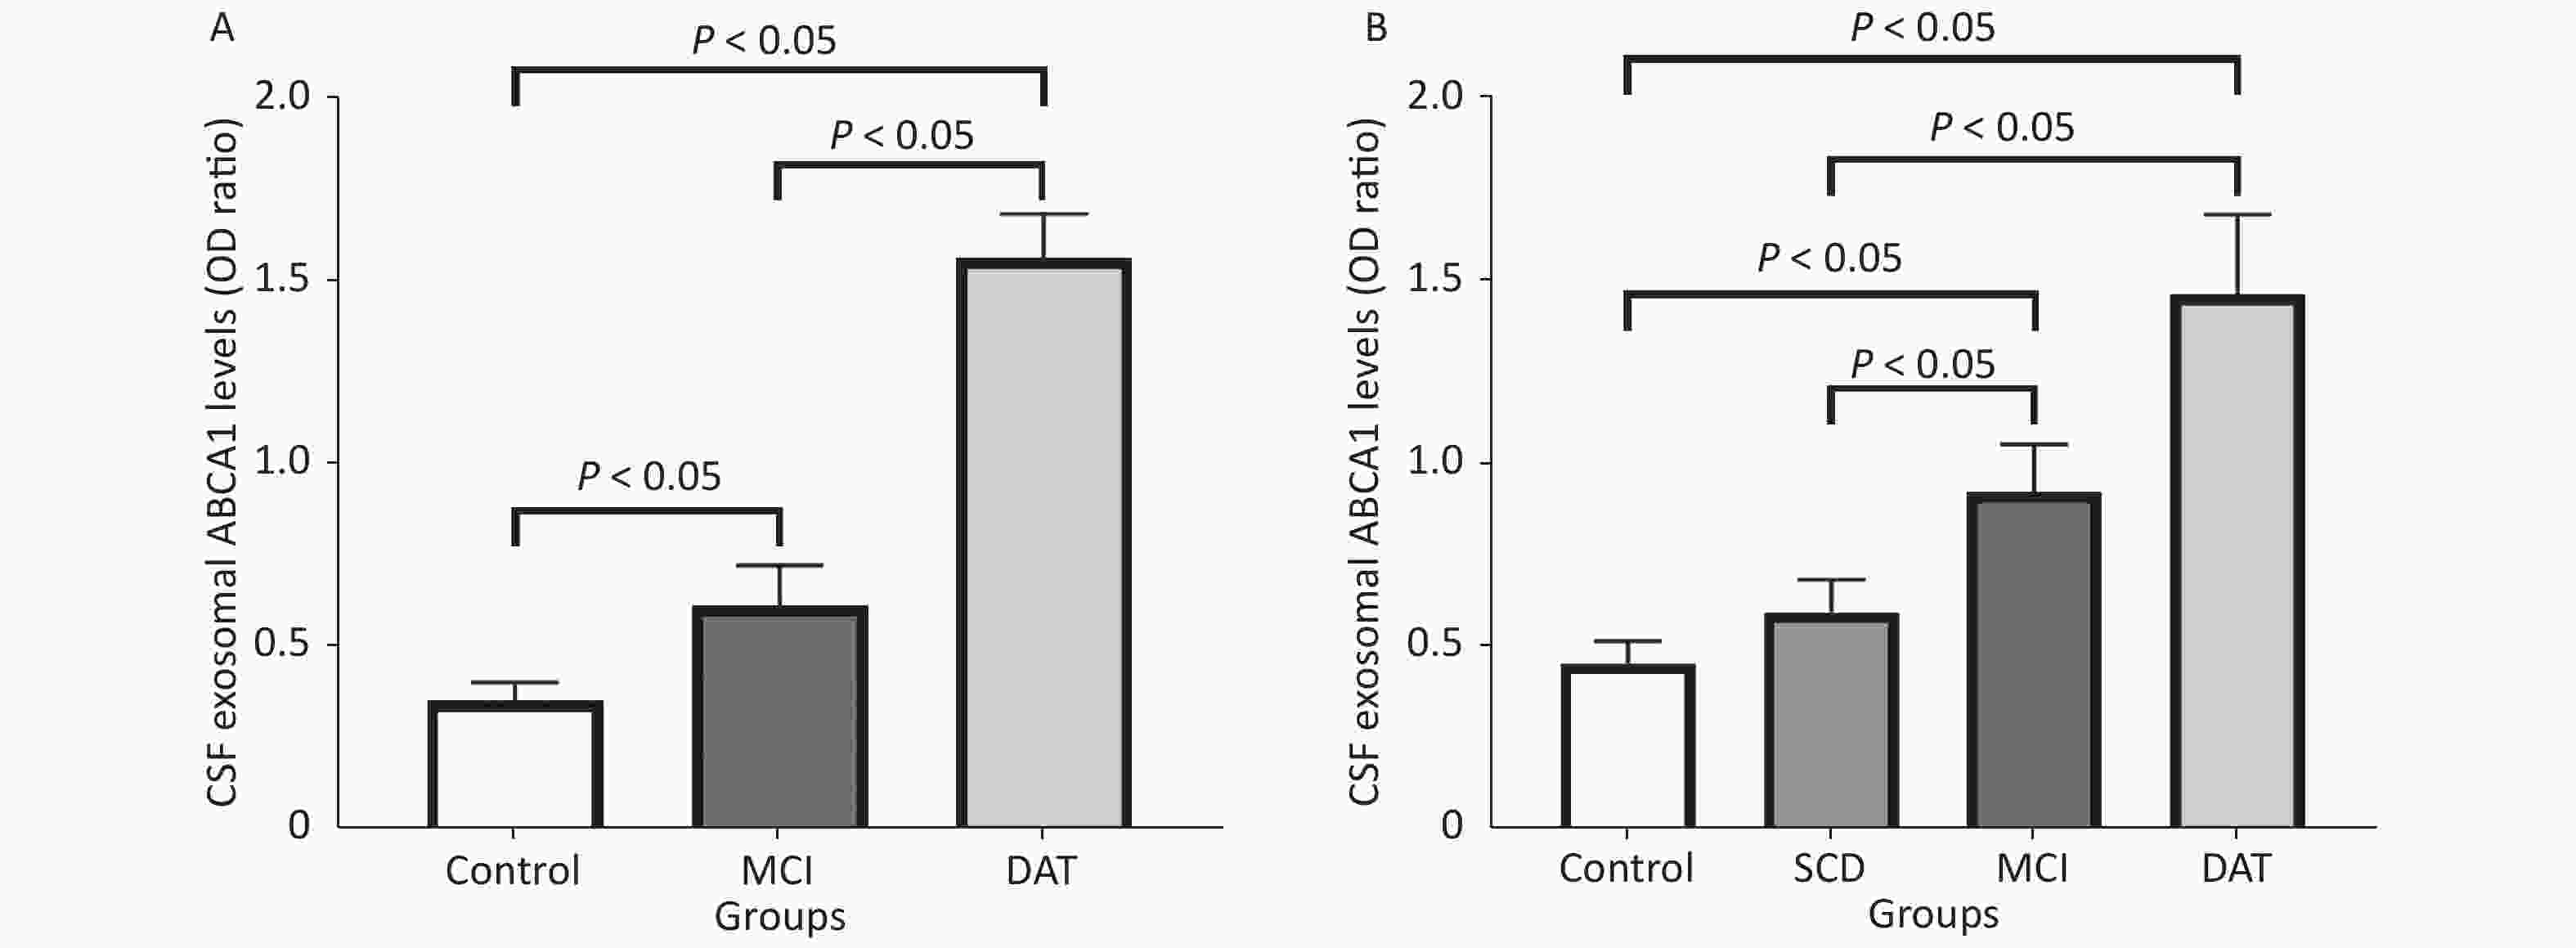
Figure 4. Serum and CSF exosomal ABCA1 levels in patients. The exosomal ABCA1 expressions in the CSF (A) and the serum (B) of different patients and control
-
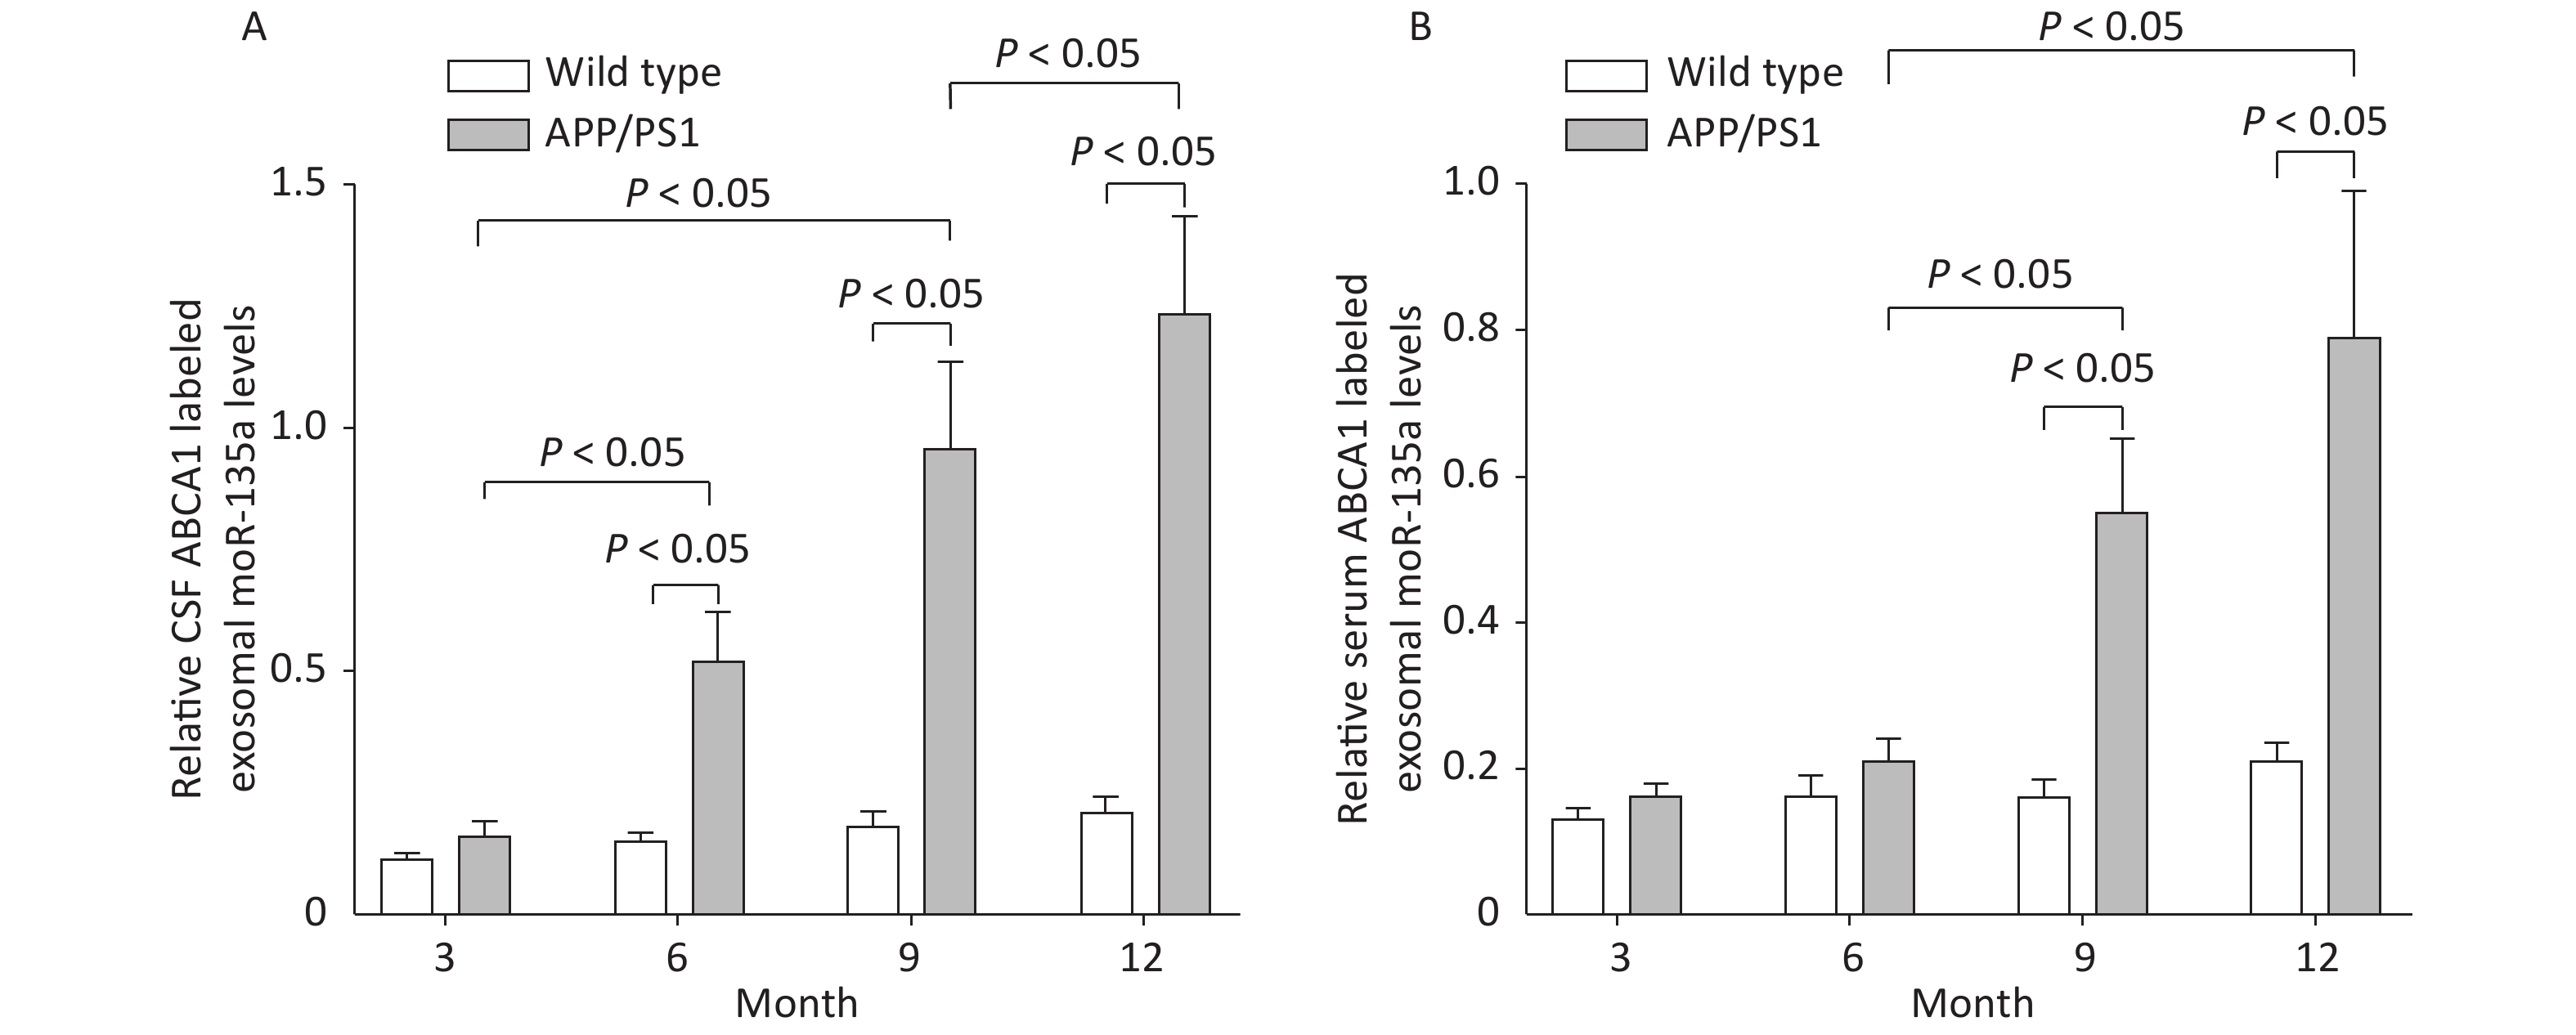
The ABCA1-labeled exosomal miR-135a levels increased in the CSF of 6, 9 and 12 m-APP/PS1 mice compared to WT mice, with the highest expression shown in the 12 m-APP/PS1 mice (P < 0.05). The ABCA1-labeled exosomal miR-135a levels increased in the serums of 9 and 12 m-APP/PS1 mice compared to WT mice, with the highest expression shown in the 12 m-APP/PS1 mice (P < 0.05). The exosomal ABCA1 expression was positively correlated to exosomal miR-135a in the serum (r = 0.521, P < 0.05, n = 20) and CSF (r = 0.688, P < 0.05, n = 20), as shown in Figure 5.
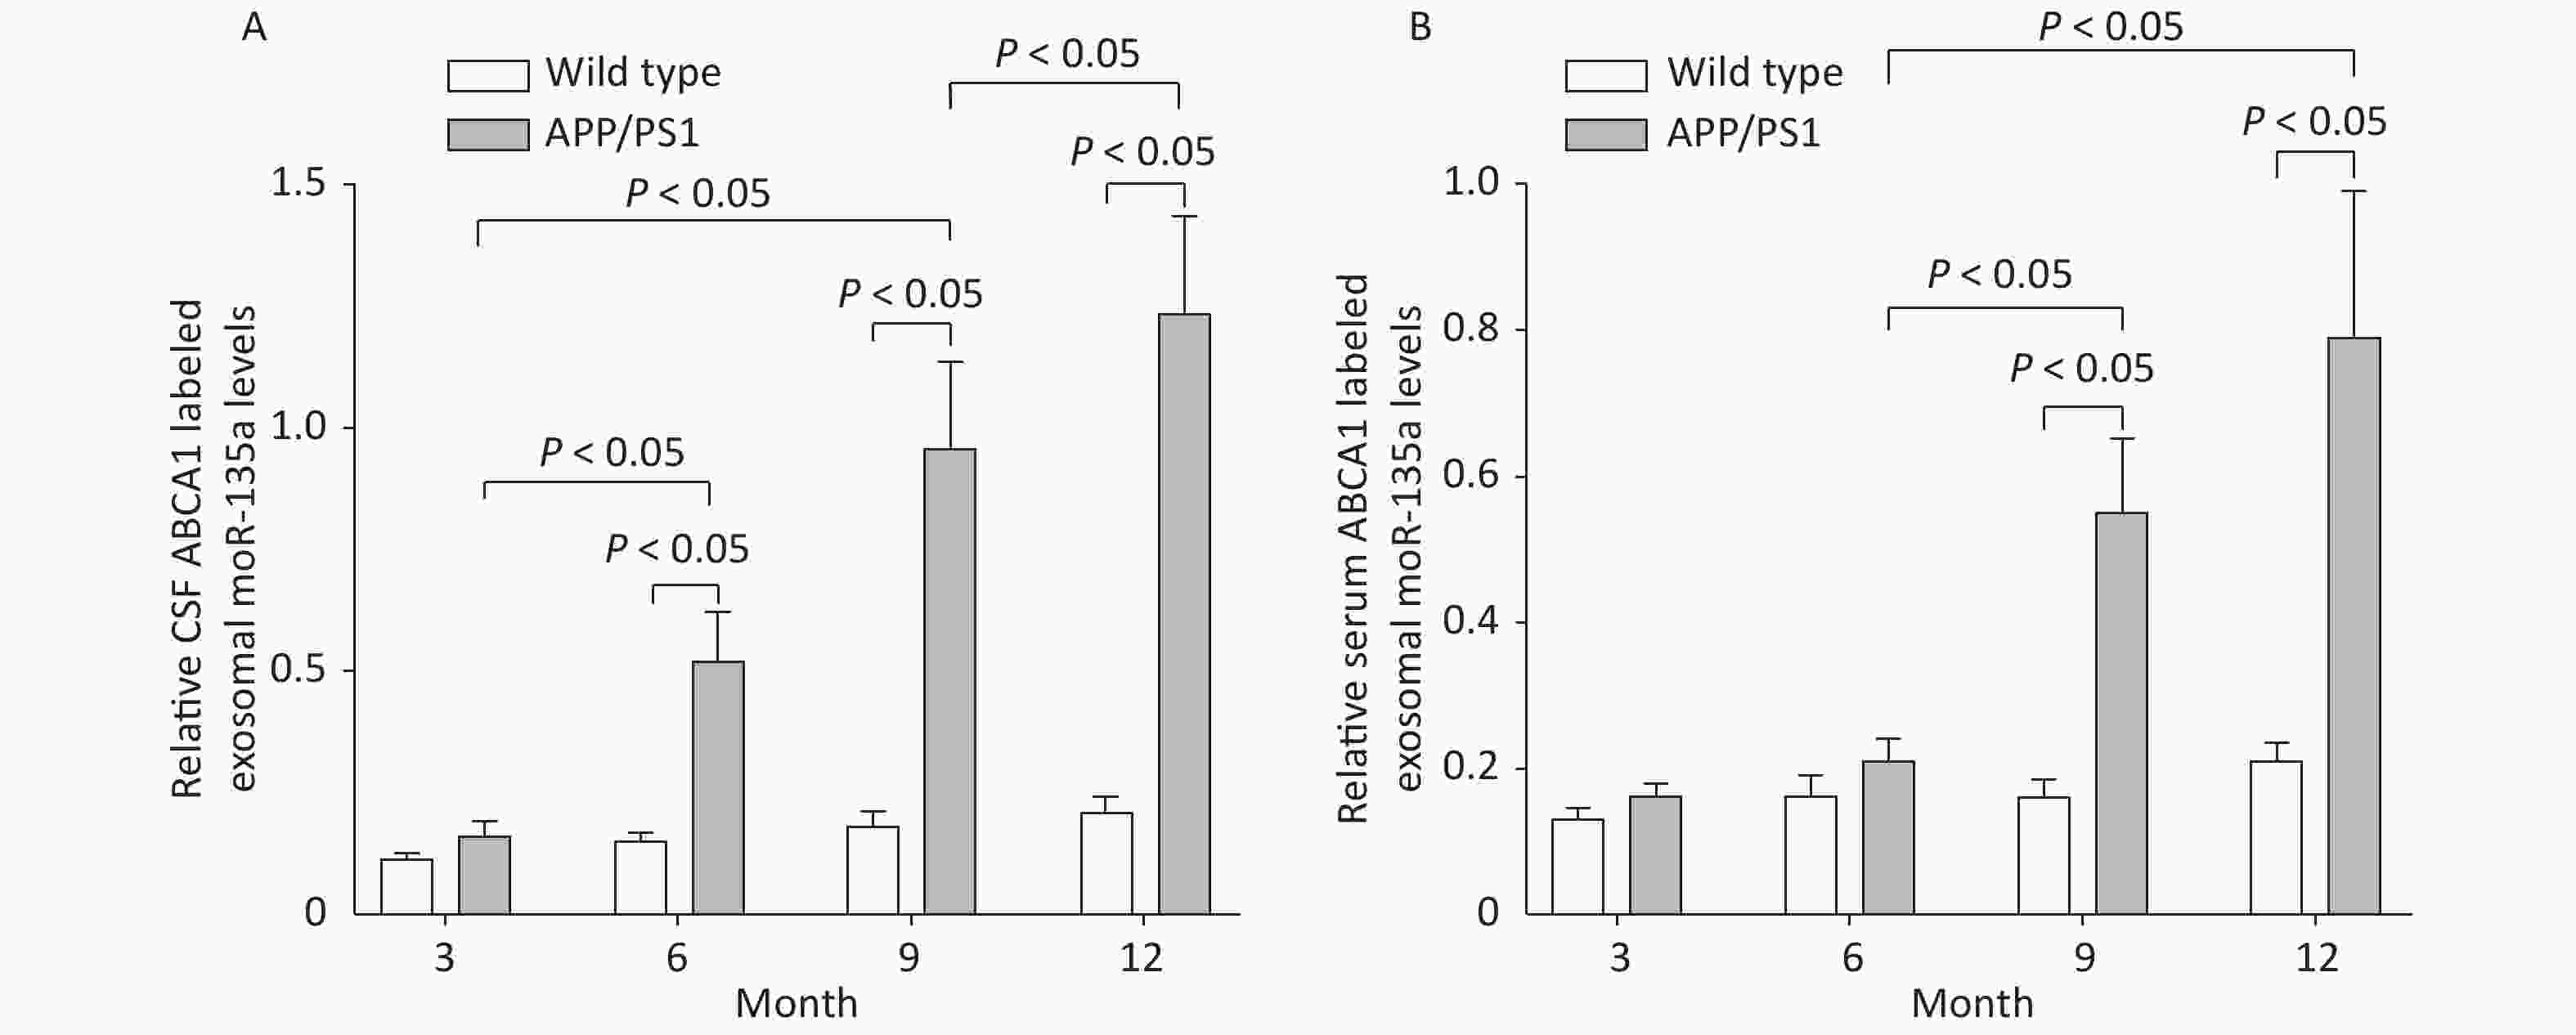
Figure 5. ABCA1-labeled exosomal miR-135a levels in the serum and CSF of mice. The relative ABCA1-labeled exosomal miR-135a levels in the CSF (A) and the serum (B) of different transgenic mice and controls of different ages
-
ABCA1-labeled exosomal miR-135a levels increased in the CSF of MCI and DAT patient groups compared to the control group, with the highest expression was detected in patients with DAT (P < 0.05). ABCA1-labeled exosomal miR-135a levels were slightly increased (P > 0.05) in the serum of SCD patient group and significantly increased (P < 0.05) in MCI and DAT patient groups compared to the control group, with the highest expression shown in patients with DAT (P < 0.05) (Figure 6). The exosomal ABCA1 expression was positively correlated to exosomal miR-135a level in the serum (r = 0.459, P < 0.05) and CSF (r = 0.627, P < 0.05, n = 22), as shown in Figure 6.
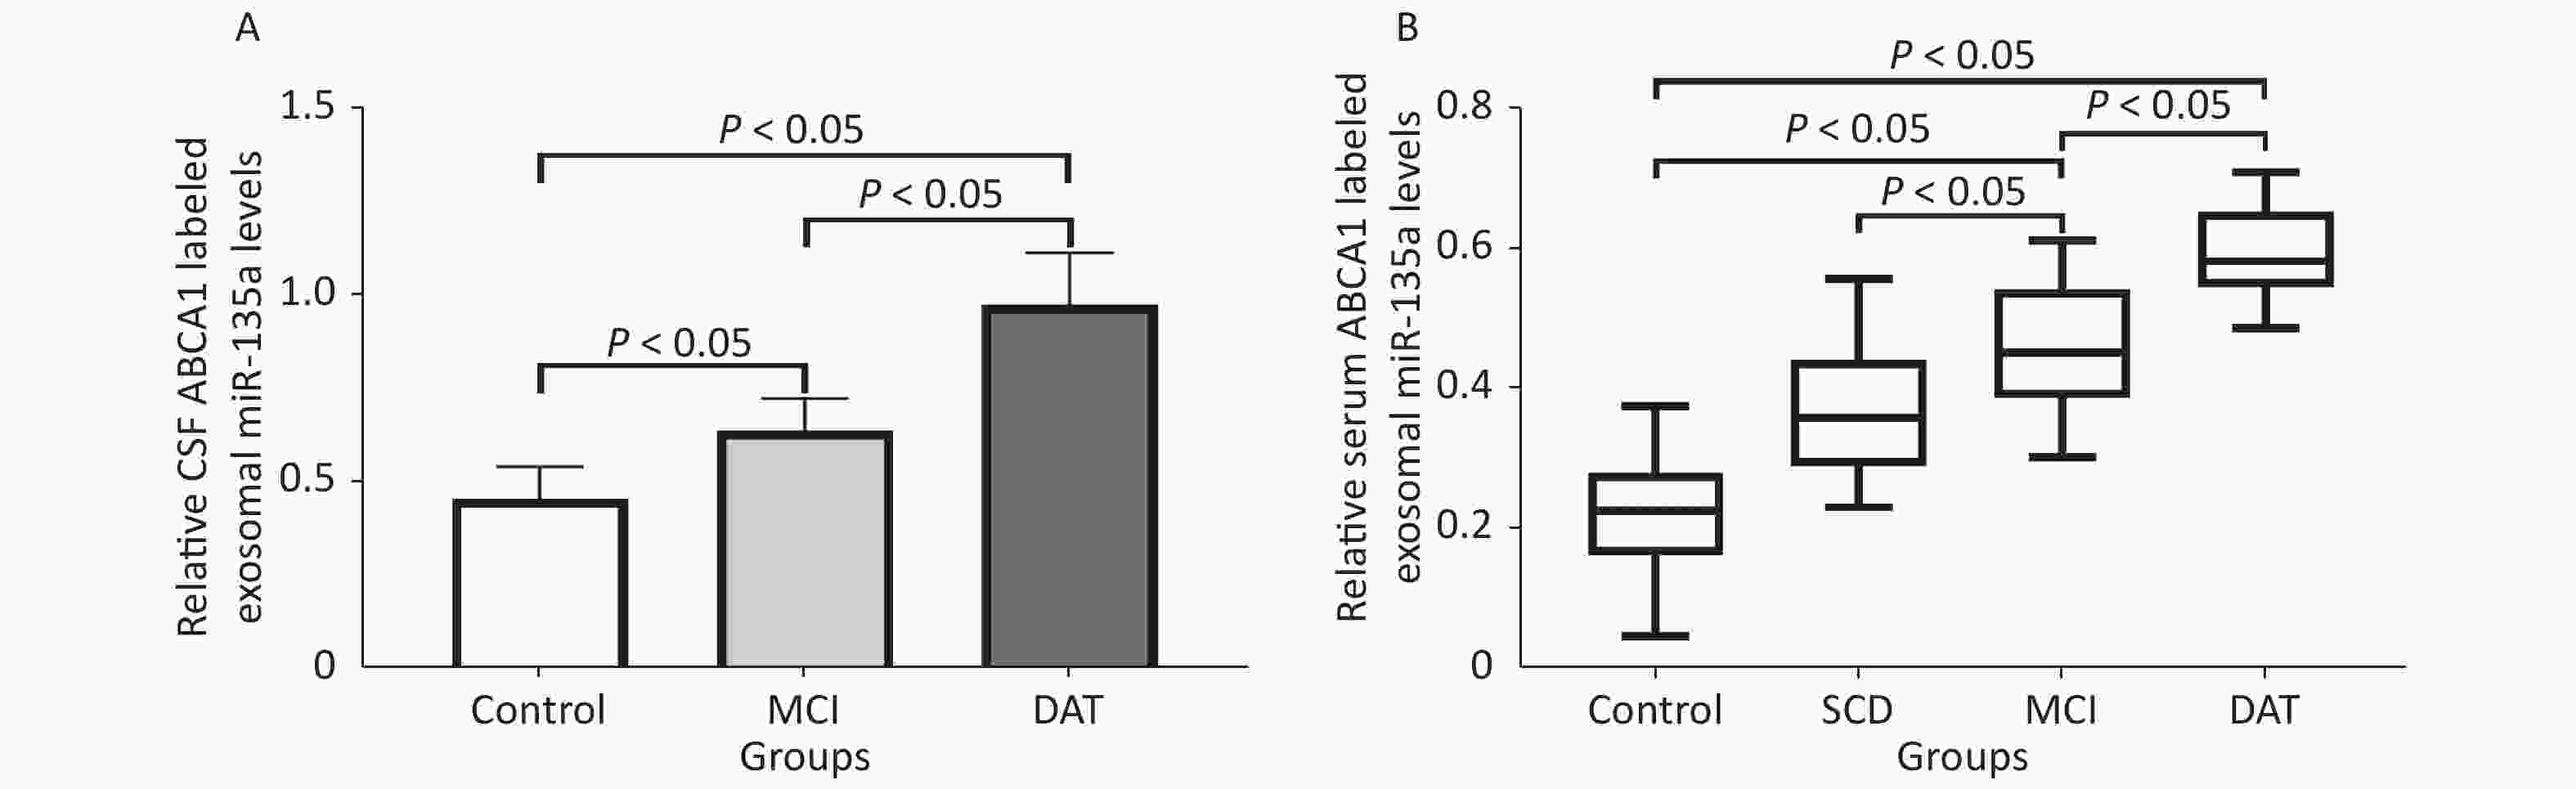
Figure 6. ABCA1-labeled exosomal miR-135a levels in the serum and CSF of patients. The relative ABCA1-labeled exosomal miR-135a levels in the CSF (A) and the serum (B) of different patients and control
-
AD is the fourth leading cause of death in the elderly population after cardiovascular disease, cerebrovascular disease, and cancers. As the population aging trend becomes increasingly apparent, the prevalence of AD in China also increases by the year, and the pathogenesis of AD has not been fully elucidated. There is currently no effective treatment for patients with late DAT [1-5]. Therefore, for the treatment of AD, it is particularly important to detect patients with MCI and SCD as early as possible for effective intervention of AD [18]. Most diagnostic markers for early disease detection are directly or indirectly linked to the occurrence and development of related diseases, including AD, which have received widespread attention globally [19]. This is a preliminary study focused on the traditional method commonly used to detect the excessive false negative results for exosomes miR-135a for the diagnosis of AD. Correspondingly, the level of exosomes captured using ABCA1 labeling and its miR-135a detection is of significant value for the early diagnosis of AD.
There is still no direct evidence showing that miRNAs can move freely across the blood brain barrier (BBB). However, some miRNAs can be selectively packaged into exosomes and actively secreted, as indicated by the microvesicle-mediated secretion pathway in the BBB [11,20]. However, there are many sources of exosomes in the human body, and this study demonstrated that WBCs can produce exosomes containing miR-135a, though in a relatively low content; indicting the possibility that these exosomes could be responsible for the false negative results for the total exosomal miR-135a detection in some patients with AD. This finding also serves to remind medical laboratory staff that exosomes should be separated in a timely manner within half an hour after blood collection to minimize the interference caused by exosomes produced by blood cells. Similar to other high-throughput studies [21], this study did not find that red blood cells can secrete exosomes containing miR-135a in large quantities.
The BBB restricts the movement nucleic acid molecules. The parallel change in the miR-135a levels in serum and CSF remains a mystery. Many reports have suggested that exosomes can act as carriers of information transmission and paracrine signaling between cells [7,18]. In this study, high level of miR-135a exosomes extracted from the CSF of AD model mice were injected into the ventricles of WT mice to investigate whether the injected miR-135a exosomes could transmit the 'high miR-135a biological signals' across the BBB to peripheral blood and detected accurately. Results show that high miR-135a exosomes injected into the ventricle can increase the miR-135a in CSF and serum exosomes in wild-type mice, suggesting that exosomes can cross the BBB, and that high miR-135a, as a biological message is transmitted to the peripheral blood. However, whether this signal can exert further biological effects and what kind of biological role remains to be investigated.
In recent years, a variety of specific exosome capture techniques have been developed, such as the microfluidic chip technology and the immunocapture assay [16,17]. The core principle of immunocapture method is based on the sizes of exosomes, which ranges from 30−200 nm, and those of virus-like particles and viruses which are within 300 nm; thus, all could be captured by using specific antibodies [22]. This method could miss some exosomes with relatively low expression of ABCA1 on the membrane surface, but the specificity of capture is almost guaranteed. The results obtained from this study confirm the feasibility of this method. ABCA1 is a membrane protein that mediates the cellular efflux of phospholipids and cholesterol to the extracellular acceptor apolipoprotein A-I for the generation of nascent high-density lipoprotein [23]. Previous studies have shown that lipid and protein transports can be accompanied by an miR transport in the exosomes, hence, ABCA1 could also actively or passively transport related miRs during lipid transport [24,25]. The ELISA detection method is highly rapid and sensitive. Results of this study also show that in the detection of ABCA1 protein, the results of ELISA and western blot have good consistency. However, for large-scale clinical specimen detection, ELISA should be used instead of western blot.
This study demonstrated that all RBCs, WBCs, HT-22 cells, and cultured primary neuron cells express ABCA1 protein. The release of exosomes containing high ABCA1 protein in the peripheral blood suggests that ABCA1-labeled exosomes can evade the interference of low miR-135a exosomes produced by RBCs and WBCs, thereby increasing the positive rate of AD diagnosis. Clinical research results show that the sensitivity of miR-135a in the diagnosis of AD has been greatly improved after the detection of specific exosomes using the ABCA1-labeled exosome capture technology. In previous studies, specific higher cut-off values were used to better distinguish patients with different AD stages, but there was also a problem of high false negative rate. Although the detection process is more complicated than the direct extraction of total exosomes, the ABCA1-labeled exosome capture method does not consume too much extra labor in laboratories equipped with automated ELISA sample loading and plate washer instruments.
In summary, this study outlines a method to capture specific exosomes and detect them using immunological methods, which is more efficient for the early diagnosis of AD. The limitation of this study is that it is still not possible to determine that ABCA1-labeled exosomes are brain tissue-specific secretions. Using more specific exosomal surface markers for the differentiation and identification of exosomes will enable effective and accurate clinical diagnosis for patients with AD.
-
We would like to thank CHENG Yong, ZHANG Li Chun, LIU Yu, and WANG Hong Yan for their excellent assistance on gathering patient samples and related information.
doi: 10.3967/bes2021.004
MicroRNA-135a in ABCA1-labeled Exosome is a Serum Biomarker Candidate for Alzheimer’s Disease
-
Abstract:
Objective In the present study, the ABCA1 was used as a label to capture specific exosomes, the level of ABCA1-labeled exosomal microRNA-135a (miR-135a) was evaluated for the diagnosis of Alzheimer’s disease (AD), especially in patients with early stages of AD. Methods This is a preliminary research focused on the levels of ABCA1 in WBCs, RBCs, HT-22 cells, and neuron cells. The diagnostic value of ABCA1-labeled exosomal miR-135a was examined using the CSF and serum of APP/PS1 double transgenic mice, and 152 patients with SCD, 131 patients with MCI, 198 patients with DAT, and 30 control subjects. Results The level of ABCA1 exosomes harvested from HT-22 cells and neuron culture medium was significantly higher compared to that of RBCs and WBCs (P < 0.05). The levels of ABCA1-labeled exosomal miR-135a increased in the CSF of MCI and DAT group compared to those of control group (P < 0.05), slightly increased (P > 0.05) in the serum of SCD patient group, and significantly increased in MCI and DAT patient groups compared to those of the control group (P < 0.05). Conclusion This study outlines a method to capture specific exosomes and detect them using immunological methods, which is more efficient for early diagnosis of AD. -
Key words:
- Alzheimer’s disease /
- Exosome /
- MicroRNA /
- Biomarker
-
Figure 1. Exosomal miR-135a detection in RBC, WBC, and culture medium. Relative miR-135a levels in cultured RBCs (A) and WBCs (B) at different times. Relative miR-135a levels in the culture medium of RBCs (C) and WBCs (D) at different times. Relative exosomal miR-135a levels in the culture medium of RBCs (E) and WBCs (F) at different times. Experiments were performed in triplicate (n = 3) for all groups
Figure 2. ABCA1 and ABCA1-labeled exosome detection in different cells. The Western blot (A, B) and ELISA (C) results of ABCA1 expressions in different cells, and the correlation between the results of western blot and ELISA (D) of the ABCA1 expressions in different cells. The ELISA results of exosomal ABCA1 levels in medium of different cells (E) and the ratio of intracellular ABCA1 and exosomal ABCA1 (F)
Figure 3. Levels of exosomal ABCA1 in the serum of control (wild-type) mice at different times after injection of exosomes from different transgenic mice CSF. The 12-month injection group had significantly higher levels of exosomal ABCA1 compared to that of PBS group, control group and 3-month group, at 2 h after the injection. There was significant difference between the experimental groups and control group.
Figure 4. Serum and CSF exosomal ABCA1 levels in patients. The exosomal ABCA1 expressions in the CSF (A) and the serum (B) of different patients and control
Figure 5. ABCA1-labeled exosomal miR-135a levels in the serum and CSF of mice. The relative ABCA1-labeled exosomal miR-135a levels in the CSF (A) and the serum (B) of different transgenic mice and controls of different ages
Figure 6. ABCA1-labeled exosomal miR-135a levels in the serum and CSF of patients. The relative ABCA1-labeled exosomal miR-135a levels in the CSF (A) and the serum (B) of different patients and control
Table 1. Demographics and clinical characteristics of subjects
Variable Control (serum) Control (CSF) SCD (serum) MCI (serum) MCI (CSF) DAT (serum) DAT (CSF) No. of subjects 30 7 165 143 19 202 13 Age (years) 76.5 ± 6.1 69.4 ± 3.3 75.7 ± 4.9 75.2 ± 8.0 68.2 ± 5.1 78.1 ± 7.2 72.1 ± 4.3 Gender (% males) 50.0 57.1 54.5 55.9 57.9 55.0 53.8 Creatinine (mg/dL) 0.81 ± 0.15 0.71 ± 0.13 0.75 ± 0.21 0.78 ± 0.38 0.71 ± 0.31 0.85 ± 0.29 0.81 ± 0.19 Homocysteine (μmol/L) 8.3 ± 2.3 8.2 ± 1.2 8.9 ± 5.6 16.9 ± 5.2 18.9 ± 2.6 18.1 ± 5.4 21.1 ± 6.4 Body Mass Index (BMI, kg/m2) 25.7 ± 2.6 26.1± 3.3 26.3 ± 3.1 26.2 ± 2.9 26.1 ± 3.3 27.1 ± 4.2 25.1 ± 2.5 Heart rate (per min) 75.2 ± 8.1 75.9 ± 5.6 76.3 ± 7.2 73.3 ± 11.2 71.2 ± 7.8 75.5 ± 10.8 76.1 ± 9.3 Systolic blood pressure (mmHg) 122.1 ± 11.2 125.5 ± 7.5 126.0 ± 12.1 128.3 ± 16.1 128.6 ± 10.2 130.0 ± 15.9 125.0 ± 11.1 Diastolic blood pressure (mmHg) 79.5 ± 13.1 80.5 ± 9.8 82.6 ± 12.6 85.1 ± 16.7 88.1 ± 10.0 86.1 ± 16.3 82.7 ± 12.7 Hypertension treatment (%) 10.0 20.0 13.2 14.5 17.6 16.7 27.3 Statins treatment (%) 13.3 0.0 19.7 20.6 29.4 21.2 27.3  下载: 导出CSV
Table 2. Exosomal miR-135a secretion ratio of cultured RBCs and WBCs
Cell type Total relative miR-135a level Total miR-135a secretion ratio (%) Exosomal miR-135a secretion ratio (%) 0.5 h 4 h 0.5 h 4 h RBC 0.136 7.23 8.39 0.00 0.01 WBC 0.435* 30.80* 32.13* 18.39* 22.99* Note. *There were significant differences compared with RBC group (P < 0.05), n = 12.
下载: 导出CSV
-
[1] Cortes-Canteli M, Iadecola C. Alzheimer's disease and vascular aging: JACC focus seminar. J Am Coll Cardiol, 2020; 75, 942−51. [2] Brent RJ. Behavioral versus biological definitions of dementia symptoms: recognizing that worthwhile interventions already exist. OBM Geriat, 2019; 3. doi: 10.21926/obm.geriatr.1904079 [3] Clare L, Kudlicka A, Oyebode JR, et al. Goal-oriented cognitive rehabilitation for early-stage Alzheimer's and related dementias: the GREAT RCT. Health Technol Assess, 2019; 23, 1−242. [4] das Nair R, Bradshaw LE, Carpenter H, et al. A group memory rehabilitation programme for people with traumatic brain injuries: the ReMemBrIn RCT. Health Technol Assess, 2019; 23, 1−194. [5] Zhang S, Huang SY, An XB, et al. Medical histories of control subjects influence the biomarker potential of plasma Aβ in Alzheimer's disease: a meta-analysis. J Mol Neurosci. 2020 Mar 3. doi: 10.1007/s12031-020-01510-1.[Epubaheadofprint] [6] Mantzavinos V, Alexiou A. Biomarkers for Alzheimer's disease diagnosis. Curr Alzheimer Res, 2017; 14, 1149−54. [7] Karlawish J, Jack CR Jr, Rocca WA, et al. Alzheimer's disease: the next frontier-special report 2017. Alzheimers Dement, 2017; 13, 374−80. doi: 10.1016/j.jalz.2017.02.006 [8] Atri A. The Alzheimer's disease clinical spectrum: diagnosis and management. Med Clin North Am, 2019; 103, 263−93. doi: 10.1016/j.mcna.2018.10.009 [9] Dehghani R, Rahmani F, Rezaei N. MicroRNA in Alzheimer's disease revisited: implications for major neuropathological mechanisms. Rev Neurosci, 2018; 29, 161−82. doi: 10.1515/revneuro-2017-0042 [10] Putteeraj M, Fairuz YM, Teoh SL. MicroRNA dysregulation in Alzheimer's disease. CNS Neurol Disord Drug Targets, 2017; 16, 1000−9. [11] Liu CG, Wang JL, Li L, et al. MicroRNA-135a and -200b, potential biomarkers for Alzheimer's disease, regulate β secretase and amyloid precursor protein. Brain Res, 2014; 1583, 55−64. doi: 10.1016/j.brainres.2014.04.026 [12] Yang TT, Liu CG, Gao S, et al. The serum exosome derived microRNA-135a, -193b, and -384 were potential Alzheimer's disease biomarker. Biomed Environ Sci, 2018; 31, 87−96. [13] Lu Z, Piechowicz M, Qiu S. A simplified method for ultra-low density, long-term primary hippocampal neuron culture. J Vis Exp, 2016; 53797. doi: 10.3791/53797 [14] Wingate R, Kwint M. Imagining the brain cell: the neuron in visual culture. Nat Rev Neurosci, 2006; 7, 745−52. [15] Livak KJ, Schmittgen TD. Analysis of relative gene expression data using real-time quantitative PCR and the 2(-Delta Delta C(T)) Method. Methods, 2001; 25, 402−8. doi: 10.1006/meth.2001.1262 [16] Greening DW, Xu R, Ji H, et al. A protocol for exosome isolation and characterization: evaluation of ultracentrifugation, density-gradient separation, and immunoaffinity capture methods. Methods Mol Biol, 2015; 1295, 179−209. [17] Chen W, Yang M, Bai J, et al. Exosome-modified tissue engineered blood vessel for endothelial progenitor cell capture and targeted siRNA delivery. Macromol Biosci, 2018; 18. doi: 10.1002/mabi.201700242 [18] Frisoni GB, Boccardi M, Barkhof F, et al. Strategic roadmap for an early diagnosis of Alzheimer's disease based on biomarkers. Lancet Neurol, 2017; 16, 661−76. doi: 10.1016/S1474-4422(17)30159-X [19] Blennow K, Zetterberg H. The past and the future of Alzheimer's disease fluid biomarkers. J Alzheimers Dis, 2018; 62, 1125−40. doi: 10.3233/JAD-170773 [20] Abbott NJ, Patabendige AA, Dolman DE, et al. Structure and function of the blood-brain barrier. Neurobiol Dis, 2010; 37, 13−25. doi: 10.1016/j.nbd.2009.07.030 [21] Huang H, Zhu J, Fan L, et al. MicroRNA profiling of exosomes derived from red blood cell units: implications in transfusion-related immunomodulation. Biomed Res Int, 2019; 2019, 2045915. [22] Theillet G, Martinez J, Steinbrugger C, et al. Comparative study of chikungunya Virus-like particles and pseudotyped-particles used for serological detection of specific immunoglobulin M. Virology, 2019; 529, 195−204. doi: 10.1016/j.virol.2019.01.027 [23] Qian H, Zhao X, Cao P, et al. Structure of the human lipid exporter ABCA1. Cell, 2017; 169, 1228−39. doi: 10.1016/j.cell.2017.05.020 [24] Deng H, Sun C, Sun Y, et al. Lipid, Protein, and MicroRNA Composition Within Mesenchymal Stem Cell-Derived Exosomes. Cell Reprogram, 2018; 20, 178−86. doi: 10.1089/cell.2017.0047 [25] Toh WS, Lai RC, Zhang B, et al. MSC exosome works through a protein-based mechanism of action. Biochem Soc Trans, 2018; 46, 843−53. doi: 10.1042/BST20180079 -

 点击查看大图
计量
- 文章访问数: 2858
- HTML全文浏览量: 1244
- PDF下载量: 287
- 被引次数: 0

 Quick Links