Sex- and Type-specific Relationship of Childhood Maltreatment with General Obesity and Abdominal Adiposity in Chinese College Students

Tong Yingying Li Min Su Yujie Tang Ting Zhu Ying Ding Han Zhang Xueying Su Puyu Chen Wei Wang Gengfu

Tong Yingying, Li Min, Su Yujie, Tang Ting, Zhu Ying, Ding Han, Zhang Xueying, Su Puyu, Chen Wei, Wang Gengfu. Sex- and Type-specific Relationship of Childhood Maltreatment with General Obesity and Abdominal Adiposity in Chinese College Students[J]. Biomedical and Environmental Sciences. doi: 10.3967/bes2024.132
Citation: Tong Yingying, Li Min, Su Yujie, Tang Ting, Zhu Ying, Ding Han, Zhang Xueying, Su Puyu, Chen Wei, Wang Gengfu. Sex- and Type-specific Relationship of Childhood Maltreatment with General Obesity and Abdominal Adiposity in Chinese College Students[J]. Biomedical and Environmental Sciences. doi: 10.3967/bes2024.132

doi: 10.3967/bes2024.132

Sex- and Type-specific Relationship of Childhood Maltreatment with General Obesity and Abdominal Adiposity in Chinese College Students

Funds: This work was supported by the grant from the National Natural Science Foundation of China (grant no. 82173539, 82204071, 81874268).
More Information
    Author Bio:

    Yingying Tong, female, born in 1998, MPH, majoring in mental health of children and adolescents

    Min Li, female, born in 2000, MPH, majoring in ACEs and adolescent health

    Yujie Su, female, Undergraduate, born in 2004, majoring in adolescent health

    Corresponding author: Wei Chen, E-mail: 446323089@qq.comGengfu Wang, E-mail: wanggenfu@ahmu.edu.cn
  • Yingying Tong: Conceptualization, Methodology, Formal analysis, Data curation. Writing - original draft, Visualization. Min Li: Methodology, Data curation, Writing - review & editing. Ting Tang and Han Ding: Methodology, Writing - review & editing, Datacuration. Ying Zhu: Investigation, Data curation. Yujie Su: Investigation, Methodology, Data curation. Xueying Zhang: Investigation, Methodology, Data curation. Puyu Su: Conceptualization, Investigation, Resources, Supervision, Project administration, Funding acquisition. Wei Chen and Gengfu Wang: Conceptualization, Investigation, Resources, Supervision, Project administration, Funding acquisition.
  • &These authors contributed equally to this work.
  • Yingying Tong: Conceptualization, Methodology, Formal analysis, Data curation. Writing - original draft, Visualization. Min Li: Methodology, Data curation, Writing - review & editing. Ting Tang and Han Ding: Methodology, Writing - review & editing, Datacuration. Ying Zhu: Investigation, Data curation. Yujie Su: Investigation, Methodology, Data curation. Xueying Zhang: Investigation, Methodology, Data curation. Puyu Su: Conceptualization, Investigation, Resources, Supervision, Project administration, Funding acquisition. Wei Chen and Gengfu Wang: Conceptualization, Investigation, Resources, Supervision, Project administration, Funding acquisition.
    &These authors contributed equally to this work.
    注释:
    1) AUTHOR CONTRIBUTIONS:
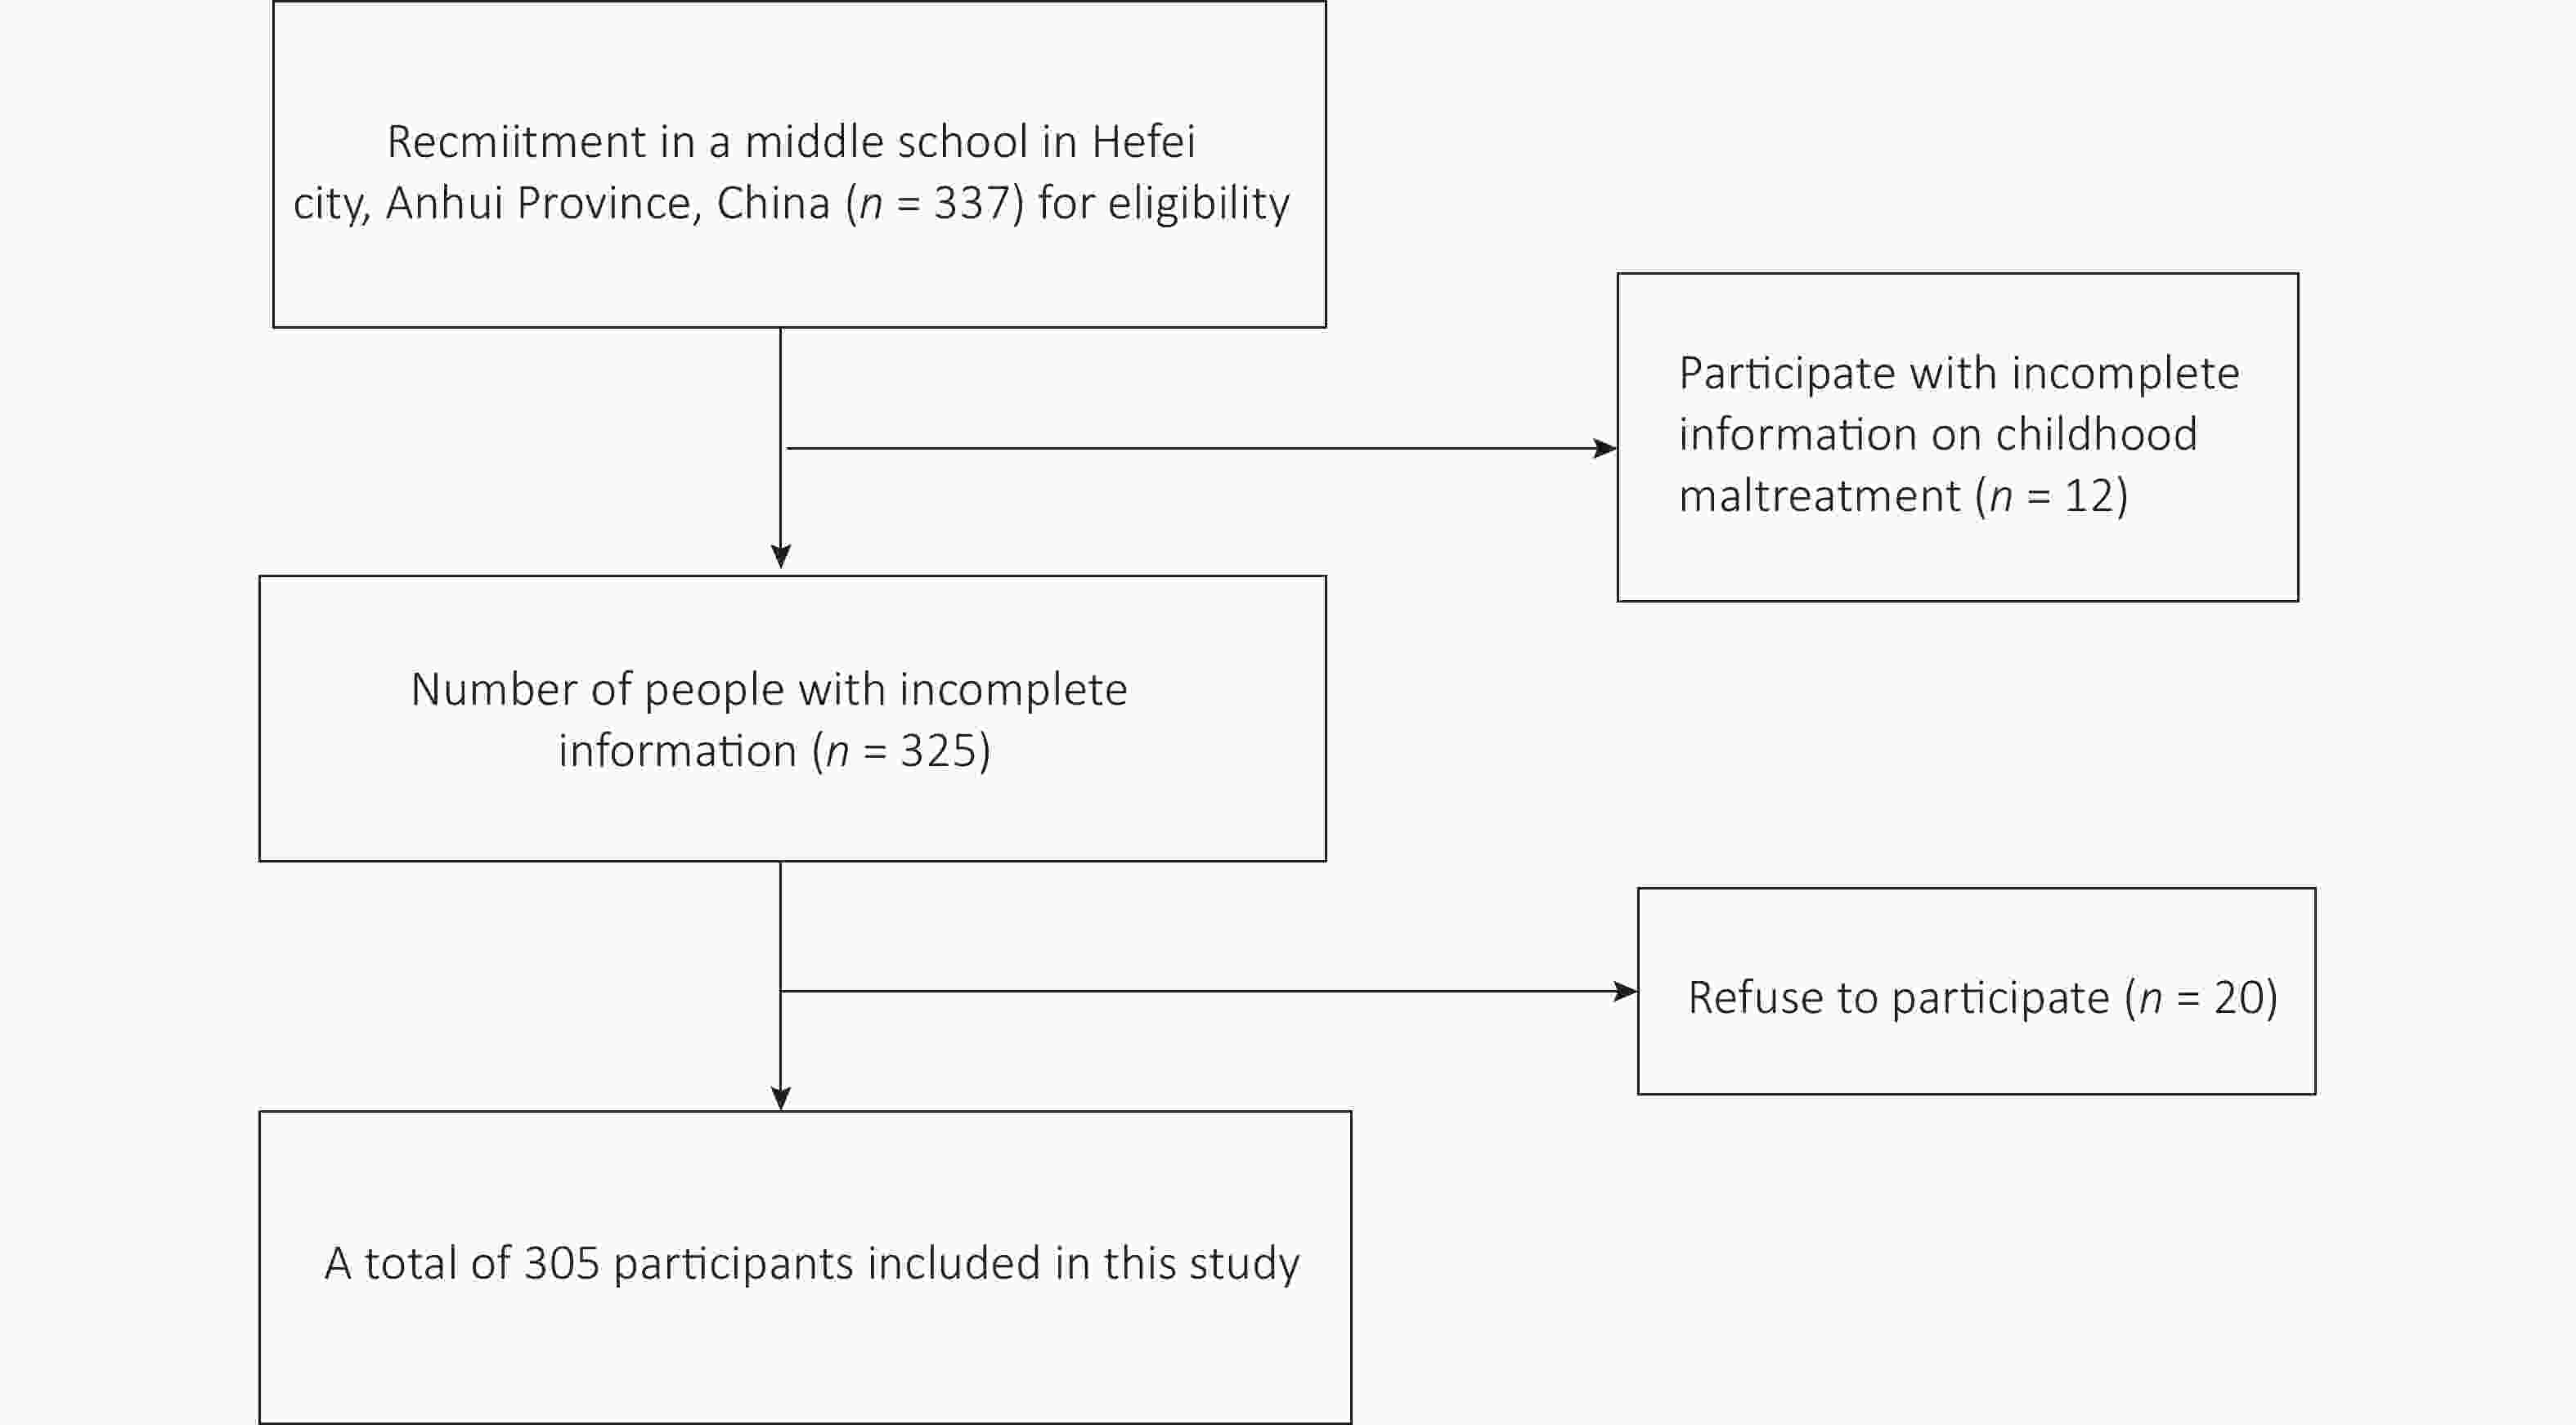
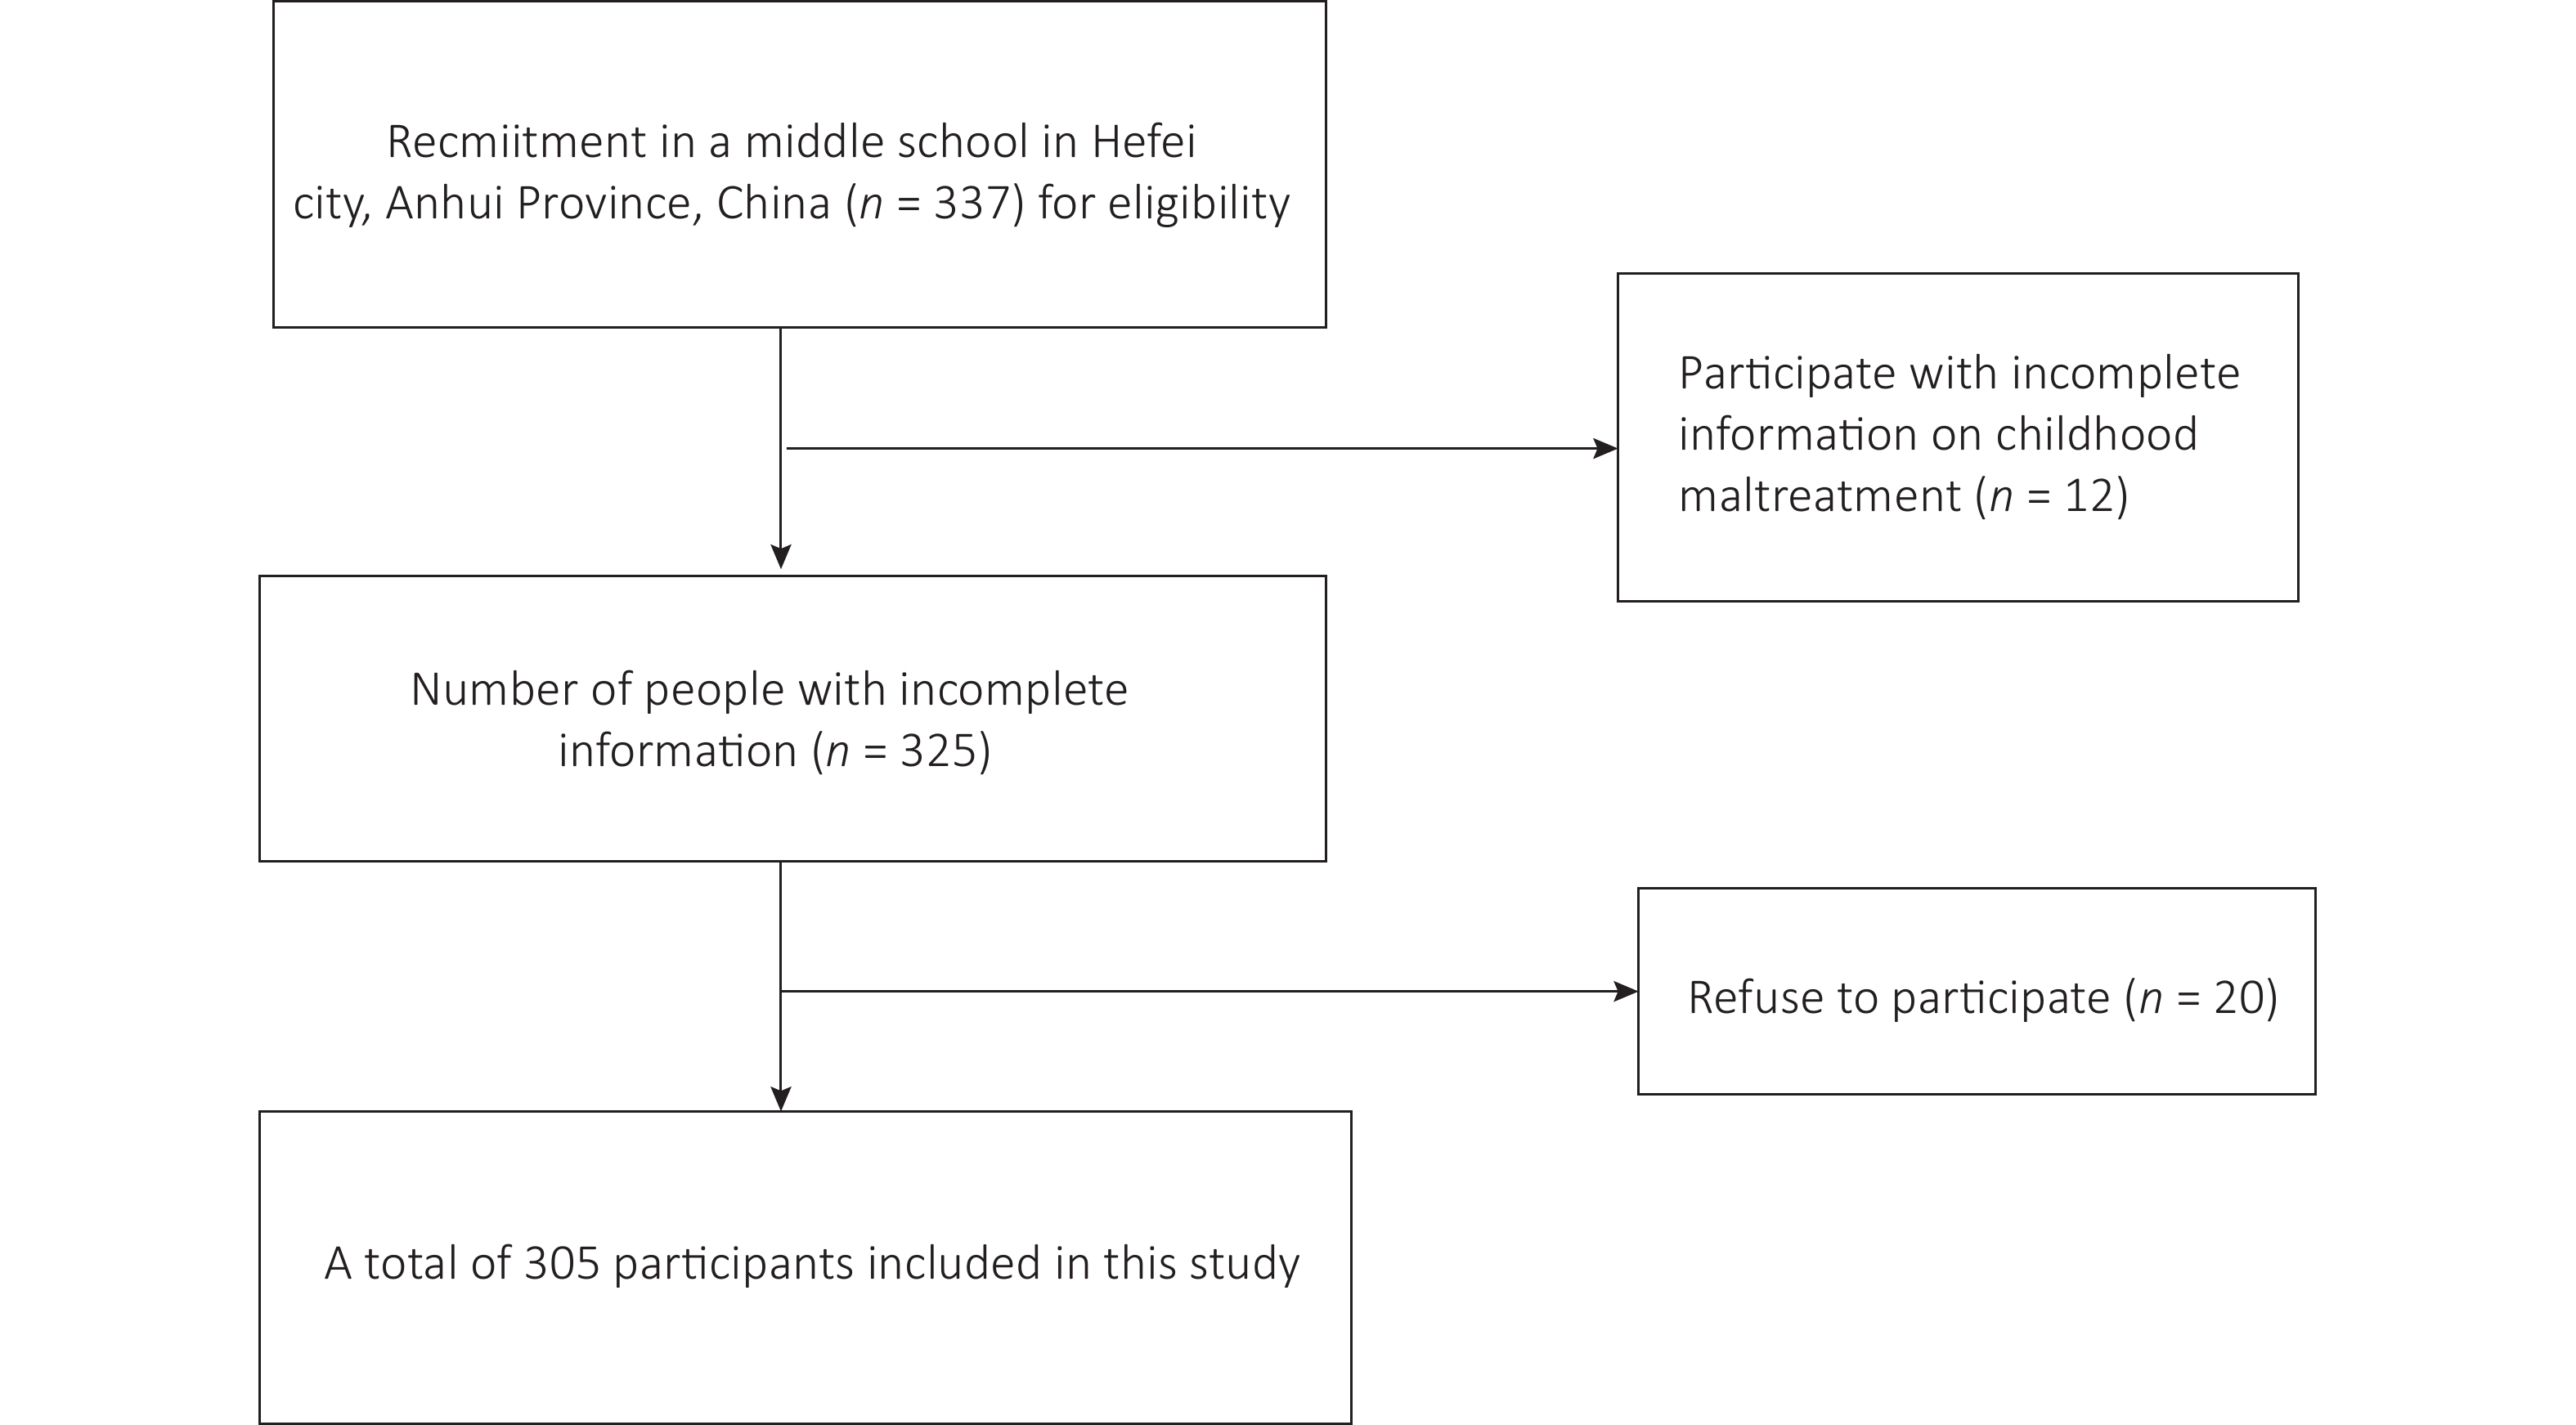
  • S1.  The study follow chart.

    Figure  1.  Relationship between child maltreatment and obesity indicators by sex; abbreviations: EA, Emotional abuse; PA, Physical abuse; SA, Sexual abuse; EN, Emotional neglect; PN, Physical neglect; Models were adjusted for age, sex, drink, smoke, father education, mother education, family type, family economic and recent adolescent self-rating life events. (A two-sided P value of ≤ 0.01 was considered statistically significant).

    S2.  Relationship between child maltreatment and obesity indicators by sex; abbreviations: EA, Emotional abuse; PA, Physical abuse; SA, Sexual abuse; EN, Emotional neglect; PN, Physical neglect; Models were adjusted for age, sex, drink, smoke, father education, mother education, family type, family economic and recent adolescent self-rating life events.

    S3.  Relationship between child maltreatment and obesity indicators by sex; abbreviations: EA, Emotional abuse; PA, Physical abuse; SA, Sexual abuse; EN, Emotional neglect; PN, Physical neglect; Models were adjusted for age, sex, drink, smoke, father education, mother education, family type, family economic and recent adolescent self-rating life events. (A two-sided P value of ≤ 0.05 was considered statistically significant).

    S4.  Language editing and polishing proof

    S1.   Description of the sample characteristics.

    Variables Total (n=305) Males (n=152) Females (n=153)
    Age, Mean (SD) 18.94 (0.71) 18.90 (0.75) 18.98 (0.67)
    Only child
    Yes 89 (29.2) 47 (30.9) 42 (27.5)
    No 216 (70.8) 105 (69.1) 111 (72.5)
    Residential area
    Rural 196 (64.3) 96 (63.2) 100 (65.4)
    Urban 109 (35.7) 56 (36.8) 96 (63.2)
    Family type
    Nuclear family 203 (66.6) 108 (71.1) 95 (62.1)
    Single-parent family 23 (7.5) 11 (7.2) 12 (7.8)
    Extended family 79 (25.9) 33 (21.7) 46 (30.1)
    Family economic
    Less than 5000 80 (26.2) 31 (20.4) 49 (32.0)
    5000-10,000 124 (40.7) 61 (40.1) 63 (41.2)
    More than10,000 101 (33.1) 60 (39.5) 34 (26.8)
    Mother’s education level
    Primary and below 96 (31.5) 52 (34.2) 44 (28.8)
    Junior middle 126 (41.3) 61 (40.1) 65 (42.5)
    Senior middle 83 (27.2) 39 (25.7) 44 (28.8)
    Father’s education level
    Primary and below 58 (19.0) 28 (18.4) 30 (19.6)
    Junior middle 122 (40.0) 61 (40.1) 61 (39.9)
    Senior middle 125 (41.0) 63 (41.4) 62 (40.5)
    Smoke
    Yes 8 (5.3) 8 (2.6) 0 (0)
    No 297 (97.4) 144 (94.7) 153 (100)
    Drink
    Yes 97 (31.8) 73 (48.0) 24 (15.7)
    No 208 (68.2) 79 (52.0) 129 (84.3)
    EA score, Mean (SD) 5.87 (2.30) 6.05 (2.93) 5.70 (1.42)
    PA score, Mean (SD) 5.51 (2.24) 5.79 (3.01) 5.25 (0.92)
    SA score, Mean (SD) 5.34 (1.95) 5.57 (2.70) 5.12 (0.50)
    EN score, Mean (SD) 5.55 (2.26) 5.72 (2.77) 5.38 (1.57)
    PN score, Mean (SD) 5.60 (2.13) 5.71 (2.76) 5.48 (1.22)
    VFA, Mean (SD) 68.89 (35.35) 63.23 (39.52) 74.51 (29.73)
    BMI, Mean (SD) 22.49 (3.92) 23.36 (4.59) 21.63 (2.87)
    PBF, Mean (SD) 25.36 (8.24) 20.77 (7.88) 29.93 (5.67)
    FM, Mean (SD) 16.50 (7.28) 15.66 (8.74) 17.33 (5.37)
    WC, Mean (SD) 80.17 (10.29) 82.98 (12.04) 77.37 (7.21)
    Hipline, Mean (SD) 93.36 (7.48) 94.02 (8.71) 92.70 (5.96)
    WHR, Mean (SD) 0.86 (0.070) 0.88 (0.08) 0.83 (0.04)
    ASLEC, Mean (SD) 41.61 (17.69) 45.42 (21.04) 37.83 (12.53)
      Note. Abbreviations: EA, Emotional abuse; PA, Physical abuse; SA, Sexual abuse; EN, Emotional neglect; PN, Physical neglect; VFA, visceral fat area; BMI, body mass index; PBF, percentage of body fat; FM, fat mass; WHR, Waist hip ratio; WC, waist circumference. ASLEC, Adolescent Self-Rating Life Events Checklist.
    下载: 导出CSV

    S2.   STROBE Statement-checklist of items that should be included in reports of observational studies.

    Item No. Recommendation Page No.
    Title and abstract 1 (a) Indicate the study’s design with a commonly used term in the title or the abstract 1
    (b) Provide in the abstract an informative and balanced summary of what was done and what was found None.
    Introduction
    Background/rationale 2 Explain the scientific background and rationale for the investigation being reported 2
    Objectives 3 State specific objectives, including any prespecified hypotheses 2
    Methods
    Study design 4 Present key elements of study design early in the paper 3-4
    Setting 5 Describe the setting, locations, and relevant dates, including periods of recruitment, exposure, follow-up, and data collection 3-4
    Participants 6 (a) Cohort study—Give the eligibility criteria, and the sources and methods of selection of participants. Describe methods of follow-up
    Case-control study—Give the eligibility criteria, and the sources and methods of case ascertainment and control selection. Give the rationale for the choice of cases and controls
    Cross-sectional study—Give the eligibility criteria, and the sources and methods of selection of participants
    3-4
    (b) Cohort study—For matched studies, give matching criteria and number of exposed and unexposed
    Case-control study—For matched studies, give matching criteria and the number of controls per case
    None.
    Variables 7 Clearly define all outcomes, exposures, predictors, potential confounders, and effect modifiers. Give diagnostic criteria, if applicable 3-4
    Data sources/ measurement 8* For each variable of interest, give sources of data and details of methods of assessment (measurement). Describe comparability of assessment methods if there is more than one group 3-4
    Bias 9 Describe any efforts to address potential sources of bias Not reported
    Study size 10 Explain how the study size was arrived at 3
    Quantitative variables 11 Explain how quantitative variables were handled in the analyses. If applicable, describe which groupings were chosen and why 3-4
    Statistical methods 12 (a) Describe all statistical methods, including those used to control for confounding 4
    (b) Describe any methods used to examine subgroups and interactions 4
    (c) Explain how missing data were addressed 4
    (d) Cohort study—If applicable, explain how loss to follow-up was addressed
    Case-control study—If applicable, explain how matching of cases and controls was addressed
    Cross-sectional study—If applicable, describe analytical methods taking account of sampling strategy
    4
    (e) Describe any sensitivity analyses Not reported
    Results
    Participants 13* (a) Report numbers of individuals at each stage of study—eg numbers potentially eligible, examined for eligibility, confirmed eligible, included in the study, completing follow-up, and analysed 4, Table S1
    (b) Give reasons for non-participation at each stage 3, Figure s1
    (c) Consider use of a flow diagram Figure S1
    Descriptive data 14* (a) Give characteristics of study participants (eg demographic, clinical, social) and information on exposures and potential confounders 4-5
    (b) Indicate number of participants with missing data for each variable of interest Figure S1
    (c) Cohort study—Summarise follow-up time (eg, average and total amount) None,
    Outcome data 15* Cohort study—Report numbers of outcome events or summary measures over time
    Case-control study—Report numbers in each exposure category, or summary measures of exposure
    Cross-sectional study—Report numbers of outcome events or summary measures 4-5
    Main results 16 (a) Give unadjusted estimates and, if applicable, confounder-adjusted estimates and their precision (eg, 95% confidence interval). Make clear which confounders were adjusted for and why they were included Table 2
    (b) Report category boundaries when continuous variables were categorized None.
    (c) If relevant, consider translating estimates of relative risk into absolute risk for a meaningful time period Not reported
    Discussion
    Key results 18 Summarise key results with reference to study objectives 4-5
    Limitations 19 Discuss limitations of the study, taking into account sources of potential bias or imprecision. Discuss both direction and magnitude of any potential bias 4-5
    Interpretation 20 Give a cautious overall interpretation of results considering objectives, limitations, multiplicity of analyses, results from similar studies, and other relevant evidence 4-5
    Generalisability 21 Discuss the generalisability (external validity) of the study results 4-5
    Other information
    Funding 22 Give the source of funding and the role of the funders for the present study and, if applicable, for the original study on which the present article is based 1
      Note. *Give information separately for cases and controls in case-control studies and, if applicable, for exposed and unexposed groups in cohort and cross-sectional studies.
    下载: 导出CSV

    Table  1.   Association of different types of child maltreatment with obesity indicators

    VariablesEAPASAENPN
    β (CI)Pβ (CI)Pβ (CI)Pβ (CI)Pβ (CI)P
    99%CI; P ≤ 0.01
    VFA29.090
    (5.335, 52.845)
    0.00215.223
    (−11.793,42.239)
    0.14519.989
    (−11.518,51.495)
    0.10118.835
    (−7.760,45.430)
    0.0677.688
    (−18.361,33.736)
    0.445
    BMI4.255
    (1.687,6.824)
    < 0.0012.917
    (−0.022,5.857)
    0.0112.884
    (−0.559,6.327)
    0.0313.253
    (0.362,6.144)
    0.0042.176
    (−0.664,5.016)
    0.048
    PBF6.208
    (1.516,10.900)
    < 0.0012.666
    (−2.690,8.022)
    0.1983.729
    (−2.516,9.973)
    0.1233.933
    (−1.331,9.198)
    0.0541.964
    (−3.193,7.120)
    0.324
    FM7.273
    (2.368,12.177)
    < 0.0014.470
    (−1.131,10.071)
    0.0395.295
    (−1.242,11.832)
    0.0375.201
    (−0.308,10.709)
    0.0153.063
    (−2.343,8.468)
    0.143
    WC8.623
    (1.891,15.355)
    0.0015.407
    (−2.246,13.059)
    0.0686.249
    (−2.685,15.183)
    0.0715.926
    (−1.613,13.465)
    0.0422.840
    (−4.548,10.229)
    0.320
    Hipline6.763
    (1.796,11.729)
    < 0.0016.802
    (1.206,12.397)
    0.0026.530
    (−0.039,13.099)
    0.0106.090
    (0.553,11.627)
    0.0054.510
    (−0.920,9.939)
    0.032
    WHR0.025
    (−0.020,0.070)
    0.146−0.011
    (−0.062,0.039)
    0.567−0.002
    (−0.061,0.058)
    0.9470.004
    (−0.046,0.053)
    0.852−0.016
    (−0.065,0.033)
    0.394
    95%CI; P ≤0.05
    VFA29.090
    (11.059,47.121)
    0.00215.223
    (−5.283,35.729)
    0.14519.989
    (−3.926,43.903)
    0.10118.835
    (−1.351,39.021)
    0.0677.688
    (−12.084,27.460)
    0.445
    BMI4.255
    (2.306,6.205)
    < 0.0012.917
    (0.686,5.149)
    0.0112.884
    (0.271,5.498)
    0.0313.253
    (1.059,5.447)
    0.0042.176
    (0.021,4.332)
    0.048
    PBF6.208
    (2.646,9.769)
    < 0.0012.666
    (−1.399,6.731)
    0.1983.729
    (−1.011,8.468)
    0.1233.933
    (−0.063,7.929)
    0.0541.964
    (−1.950,5.878)
    0.324
    FM7.273
    (3.550,10.995)
    < 0.0014.470
    (0.219,8.721)
    0.0395.295
    (0.333,10.257)
    0.0375.201
    (1.019,9.382)
    0.0153.063
    (−1.040,7.166)
    0.143
    WC8.623
    (3.513,13.733)
    0.0015.407
    (−0.402,11.215)
    0.0686.249
    (−0.532,13.031)
    0.0715.926
    (0.204,11.649)
    0.0422.840
    (−2.768,8.449)
    0.320
    Hipline6.763
    (2.993,10.532)
    < 0.0016.802
    (2.554,11.049)
    0.0026.530
    (1.544,11.516)
    0.0106.090
    (1.887,10.293)
    0.0054.510
    (0.389,8.631)
    0.032
    WHR0.025
    (−0.009,0.059)
    0.146−0.011
    (−0.050,0.027)
    0.567−0.002
    (−0.046,0.043)
    0.9470.004
    (−0.034,0.041)
    0.852−0.016
    (−0.053,0.021)
    0.394
      Note. EA, Emotional abuse; PA, Physical abuse; SA, Sexual abuse; EN, Emotional neglect; PN, Physical neglect; VFA, visceral fat area; BMI, body mass index; PBF, percentage of body fat; FM, fat mass; WHR, waist hip ratio; WC, waist circumference. Models were adjusted for age, sex, drink, smoke, father education, mother education, family type, family economic and recent adolescent self−rating life events.
    下载: 导出CSV

    Table  2.   Association between recent adverse life events and cardiovascular indicators.

    Variables β (99%CI) P β (95%CI) P
    VFA 0.011 (−0.341,0.362) 0.938 0.011 (−0.257,0.278) 0.938
    BMI −0.023 (−0.062,0.015) 0.113 −0.023 (−0.052,0.006) 0.113
    PBF −0.015 (−0.084,0.055) 0.586 −0.015 (−0.067,0.038) 0.586
    FM −0.020 (−0.093,0.053) 0.481 −0.020 (−0.075,0.035) 0.481
    WC 0.007 (−0.093,0.107) 0.854 0.007 (−0.069,0.083) 0.854
    Hipline −0.079 (−0.153,−0.006) 0.006 −0.079 (−0.135,−0.024) 0.006
    WHR 0.001 (0.000,0.001) 0.002 0.001 (0.000,0.001) 0.002
      Note. VFA, visceral fat area; BMI, body mass index; PBF, percentage of body fat; FM, fat mass; WHR, waist hip ratio; WC, waist circumference. Models were adjusted for age, sex, drink, smoke, father education, mother education, family type, family economic, emotional abuse; physical abuse; sexual abuse; emotional neglect and physical neglect.
    下载: 导出CSV

    S3.   Relationship between child maltreatment and obesity indicators by sex (A two-sided P value of ≤ 0.01 was considered statistically significant).

    VariablesEAPASAENPN
    β (99%CI)Pβ (99%CI)Pβ (99%CI)Pβ (99%CI)Pβ (99%CI)P
    VFA
    Males40.557
    (7.538,73.576)
    0.002
    23.830
    (−11.462,59.123)
    0.08019.357
    (−20.681,59.395)
    0.20920.694
    (−15.537,56.925)
    0.13816.676
    (−20.189,53.540)
    0.239
    Females5.609
    (−31.811,43.029)
    0.696−32.859
    (−85.825,20.106)
    0.107−14.013
    (−99.683,71.656)
    0.67010.106
    (−34.261,54.430)
    0.552−22.778
    (−65.702,20.146)
    0.168
    BMI
    Males5.631
    (1.799,9.462)
    < 0.0014.056
    (−0.049,8.161)
    0.0113.796
    (−0.871,8.463)
    0.0353.738
    (−0.483,7.958)
    0.0223.115
    (−1.194,7.424)
    0.061
    Females1.634
    (−1.950,5.219)
    0.236−2.218
    (−7.342,2.905)
    0.260−4.791
    (−12.971,3.389)
    0.1281.672
    (−2.584,5.927)
    0.307−1.249
    (−5.400,2.903)
    0.433
    PBF
    Males8.557
    (1.873,15.240)
    0.0014.780
    (−2.387,11.948)
    0.0844.014
    (−4.113,12.141)
    0.1994.038
    (−3.323,11.399)
    0.1543.351
    (−4.135,10.837)
    0.244
    Females1.200
    (−5.977,8.378)
    0.663−7.109
    (−17.244,3.025)
    0.069−2.132
    (−18.571,14.308)
    0.7352.813
    (−5.678,11.304)
    0.388−2.446
    (−10.721,5.829)
    0.441
    FM
    Males9.960
    (2.677,17.244)
    < 0.0016.213
    (−1.605,14.030)
    0.0405.454
    (−3.421,14.329)
    0.1115.928
    (−2.088,13.944)
    0.0554.873
    (−3.297,13.043)
    0.121
    Females1.660
    (−5.132,8.451)
    0.524−5.480
    (−15.117,4.157)
    0.140−3.371
    (−18.926,12.184)
    0.5722.594
    (−5.447,10.635)
    0.401−2.946
    (−10.771,4.880)
    0.327
    WC
    Males12.098
    (2.078,22.119)
    0.0027.491
    (−3.197,18.179)
    0.0696.137
    (−5.993,18.266)
    0.1886.843
    (−4.122,17.808)
    0.1054.932
    (−6.245,16.110)
    0.251
    Females1.612
    (−7.568,10.792)
    0.647−8.823
    (−21.794,4.148)
    0.078−10.001
    (−30.915,10.913)
    0.2142.639
    (−8.235,13.513)
    0.527−5.185
    (−15.728,5.358)
    0.201
    Hipline
    Males8.942
    (1.855,16.029)
    0.0018.326
    (0.882,15.770)
    0.0047.746
    (−0.738,16.229)
    0.0188.046
    (0.403,15.690)
    0.0076.928
    (−0.887,14.743)
    0.022
    Females2.187
    (−5.187,9.560)
    0.440−0.902
    (−11.456,9.653)
    0.824−4.734
    (−21.621,12.153)
    0.465−0.177
    (−8.937,8.583)
    0.958−4.205
    (−12.685,4.275)
    0.197
    WHR
    Males0.039
    (−0.031,0.109)
    0.144−0.004
    (−0.078,0.070)
    0.887−0.013
    (−0.096,0.070)
    0.690−0.008
    (−0.083,−0.067)
    0.780−0.019
    (−0.095,0.057)
    0.522
    Females−0.001
    (−0.055,0.053)
    0.961−0.084
    (−0.056,0.035)
    0.004−0.069
    (−0.192,0.054)
    0.1460.035
    (−0.028,0.099)
    0.150−0.014
    (−0.077,0.048)
    0.554
      Note. Abbreviations: EA, Emotional abuse; PA, Physical abuse; SA, Sexual abuse;EN, Emotional neglect; PN, Physical neglect; VFA, visceral fat area; BMI, body mass index; PBF, percentage of body fat; FM, fat mass; WHR, Waist hip ratio; WC, waist circumference. Models were adjusted for age, drink, smoke, father education, mother education, family type, family economic and recent adolescent self−rating life events. A two−sided P value of ≤ 0.01 was considered statistically significant.
    下载: 导出CSV

    S4.   Relationship between child maltreatment and obesity indicators by sex (A two−sided P value of ≤ 0.05 was considered statistically significant).

    Variables EA PA SA EN PN
    β (95%CI) P β (95%CI) P β (95%CI) P β (95%CI) P β (95%CI) P
    VFA
    Males 40.557
    (15.565,65.550)
    0.002
    23.830
    (−2.883,50.544)
    0.080 19.357
    (−10.948,49.663)
    0.209 20.694
    (−6.729,48.117)
    0.138 16.676
    (−11.228,44.579)
    0.239
    Females 5.609
    (−22.715,33.933)
    0.696 −32.859
    (−72.950,7.231)
    0.107 −14.013
    (−78.857,50.831)
    0.670 10.106
    (−23.443,43.656)
    0.552 −22.778
    (−55.268,9.712)
    0.168
    BMI
    Males 5.631
    (2.730,8.531)
    < 0.001 4.056
    (0.949,7.164)
    0.011 3.796
    (0.263,7.328)
    0.035 3.738
    (0.543,6.932)
    0.022 3.115
    (−0.146,6.376)
    0.061
    Females 1.634
    (−1.079,3.584)
    0.236 −2.218
    (−6.096,1.659)
    0.260 −4.791
    (−10.983,1.401)
    0.128 1.672
    (−1.594,4.892)
    0.307 −1.249
    (−4.391,1.894)
    0.433
    PBF
    Males 8.557
    (3.498,13.616)
    0.001 4.780
    (−0.645,10.206)
    0.084 4.014
    (−2.138,10.166)
    0.199 4.038
    (−1.534,9.610)
    0.154 3.351
    (−2.315,9.017)
    0.244
    Females 1.200
    (−4.233,6.634)
    0.663 −7.109
    (−14.780,0.561)
    0.069 −2.132
    (−14.575,10.311)
    0.735 2.813
    (−3.614,9.240)
    0.388 −2.446
    (−8.710,3.818)
    0.441
    FM
    Males 9.960
    (4.447,15.474)
    < 0.001 6.213
    (0.296,12.130)
    0.040 5.454
    (−1.264,12.172)
    0.111 5.928
    (−0.139,11.996)
    0.055 4.873
    (−1.311,11.057)
    0.121
    Females 1.660
    (−3.481,6.800)
    0.524 −5.480
    (−12.774,1.814)
    0.140 −3.371
    (−15.145,8.403)
    0.572 2.594
    (−3.493,8.681)
    0.401 −2.946
    (−8.869,2.977)
    0.327
    WC
    Males 12.098
    (4.513,19.683)
    0.002 7.491
    (−0.599,15.581)
    0.069 6.137
    (−3.044,15.318)
    0.188 6.843
    (−1.456,15.142)
    0.105 4.932
    (−3.528,13.393)
    0.251
    Females 1.612
    (−5.337,8.560)
    0.647 −8.823
    (−18.641,0.995)
    0.078 −10.001
    (−25.831,5.829)
    0.214 2.639
    (−5.591,10.870)
    0.527 −5.185
    (−13.165,2.795)
    0.201
    Hipline
    Males 8.942
    (3.577,14.306)
    0.001 8.326
    (2.691,13.961)
    0.004 7.746
    (1.324,14.167)
    0.018 8.046
    (2.261,13.832)
    0.007 6.928
    (1.013,12.843)
    0.022
    Females 2.187
    (−3.395,7.768)
    0.440 −0.902
    (−8.891,7.087)
    0.824 −4.734
    (−17.516,8.048)
    0.465 −0.177
    (−6.808,6.454)
    0.958 −4.205
    (−10.624,2.214)
    0.197
    WHR
    Males 0.039
    (−0.014,0.092)
    0.144 −0.004
    (−0.060,0.052)
    0.887 −0.013
    (−0.075,0.050)
    0.690 −0.008
    (−0.065,0.049)
    0.780 −0.019
    (−0.076,0.039)
    0.522
    Females −0.001
    (−0.042,0.040)
    0.961 −0.084
    (−0.141,−0.027)
    0.004 −0.069
    (−0.162,0.024)
    0.146 0.035
    (−0.013,0.084)
    0.150 −0.014
    (−0.062,0.033)
    0.554
      Note. Abbreviations: EA, Emotional abuse; PA, Physical abuse; SA, Sexual abuse;EN, Emotional neglect; PN, Physical neglect; VFA, visceral fat area; BMI, body mass index; PBF, percentage of body fat; FM, fat mass; WHR, Waist hip ratio; WC, waist circumference. Models were adjusted for age, drink, smoke, father education, mother education, family type, family economic and recent adolescent self−rating life events. A two−sided P value of ≤ 0.05 was considered statistically significant.
    下载: 导出CSV

    S5.   Association between childhood adverse life events and recent adverse life events interacting with obesity indicators.

    VariablesEA*ASLECPA*ASLECSA*ASLECEN*ASLECPN*ASLEC
    β (CI)Pβ (CI)Pβ (CI)Pβ (CI)Pβ (CI)P
    99%CI; Pinteraction ≤ 0.01
    VFA−0.372 (−1.320,0.577)0.311−0.525 (−1.375,0.325)0.110−0.580 (−1.414,0.253)0.072−0.797 (−1.720,0.126)0.026−0.582 (−1.481,0.317)0.094
    BMI−0.027 (−0.130,0.076)0.493−0.050 (−0.142,0.043)0.164−0.053 (−0.144,0.038)0.131−0.060 (−0.161,0.041)0.124−0.035 (−0.133,0.063)0.351
    PBF−0.045 (−0.233,0.142)0.533−0.096 (−0.264,0.072)0.138−0.125 (−0.289,0.040)0.050−0.145 (−0.328,0.037)0.040−0.113 (−0.291,0.064)0.099
    FM−0.066 (−0.262,0.130)0.385−0.104 (−0.280,0.071)0.125−0.119 (−0.291,0.053)0.075−0.154 (−0.345,0.036)0.037−0.112 (−0.298,0.073)0.118
    WC−0.147 (−0.416,0.123)0.160−0.174 (−0.416,0.067)0.062−0.176 (−0.413,0.061)0.055−0.247 (−0.510,0.015)0.015−0.208 (−0.464,0.047)0.035
    Hipline−0.041 (−0.240,0.158)0.5940.003 (−0.176,0.182)0.9660.001 (−0.175,0.177)0.993−0.059 (−0.254,0.136)0.4330.008 (−0.181,0.198)0.910
    WHR−0.001 (−0.003,0.001)0.102−0.002 (−0.003,0.000)0.003−0.002 (−0.003,0.000)0.002−0.002 (−0.004,0.000)0.003−0.002 (−0.004,−0.001)0.001
    95%CI; Pinteraction ≤0.05
    VFA−0.372 (−1.092,0.348)0.311−0.525 (−1.170,0.120)0.110−0.580 (−1.213,0.052)0.072−0.797 (−1.497,−0.096)0.026−0.582 (−1.265,0.100)0.094
    BMI−0.027 (−0.106,0.051)0.493−0.050 (−0.120,0.020)0.164−0.053 (−0.122,0.016)0.131−0.060 (−0.136,0.016)0.124−0.035 (−0.110,0.039)0.351
    PBF−0.045 (−0.188,0.097)0.533−0.096 (−0.224,0.031)0.138−0.125 (−0.250,0.000)0.050−0.145 (−0.284,−0.007)0.040−0.113 (−0.248,0.022)0.099
    FM−0.066 (−0.215,0.083)0.385−0.104 (−0.238,0.029)0.125−0.119 (−0.249,0.012)0.075−0.154 (−0.299,−0.010)0.037−0.112 (−0.253,0.029)0.118
    WC−0.147 (−0.351,0.058)0.160−0.174 (−0.358,0.009)0.062−0.176 (−0.356,0.004)0.055−0.247 (−0.446,−0.048)0.015−0.208 (−0.402,−0.014)0.035
    Hipline−0.041 (−0.192,0.110)0.5940.003 (−0.133,0.139)0.9660.001 (−0.133,0.134)0.993−0.059 (−0.207,0.089)0.4330.008 (−0.136,0.152)0.910
    WHR−0.001 (−0.002,0.000)0.102−0.002 (−0.003,−0.001)0.003−0.002 (−0.003,−0.001)0.002−0.002 (−0.003,−0.001)0.003−0.002 (−0.004,−0.001)0.001
      Note. Abbreviations: EA, Emotional abuse; PA, Physical abuse; SA, Sexual abuse;EN, Emotional neglect; PN, Physical neglect; VFA, visceral fat are; BMI, body mass index; PBF, percentage of body fat; FM, fat mass; WHR, Waist hip ratio; WC, waist circumference; ASLEC, Adolescent Self−Rating Life Events Checklist. Models were adjusted for age, sex, drink, smoke, father education, mother education, family type, family economic, emotional abuse; physical abuse; sexual abuse; emotional neglect; physical neglect and recent adverse life events.
    下载: 导出CSV

    S6.   Association of different types of child maltreatment with obesity indicators.

    Variables VFA BMI PBF FM WC Hipline WHR
    βinteraction (CI) βinteraction (CI) βinteraction (CI) β interaction (CI) βinteraction (CI) β interaction (CI) β interaction (CI)
    β, 99%CI
    None CM, Low ASLEC
    None CM, Medium ASLEC 0.537 (−14.694,15.769) 0.201 (−1.458,1.860) −0.508 (−3.524,2.508) 0.025 (−3.116,3.167) 0.244 (−4.108,4.596) 0.200 (−2.991,3.391) 0.000 (−0.029,0.029)
    None CM, High ASLEC −1.935 (−22.540,18.670) 0.228 (−2.016,2.472) −0.268 (−4.348,3.812) −0.359 (−4.610,3.891) −1.183 (−7.070,4.704) −2.200 (−6.517,2.117) 0.006 (−0.034,0.045)
    CM, Low ASLEC −5.819 (−41.791,30.153) −0.695 (−4.613,3.223) −0.435 (−7.558,6.688) −0.752 (−8.172,6.667) −0.964 (−11.241,9.314) −0.285 (−7.822,7.252) −0.007 (−0.076,0.062)
    CM, Medium ASLEC −26.793 (−56.290,2.703) −3.245 (−6.458,−0.032) −5.796 (−11.637,0.044) −6.024 (−12.108,0.060) −7.028 (−15.455,1.399) −5.484 (−11.664,0.697) −0.023 (−0.080,0.033)
    CM,High ASLEC −32.518 (−68.275,3.239) −1.722 (−5.616,2.173) −5.173 (−12.253,1.907) −6.564 (−13.939,0.811) −8.821 (−19.036,1.395) −7.701 (−15.193,−0.209) −0.021 (−0.089,0.048)
    β, 95%CI
    None CM, Low ASLEC
    None CM, Medium ASLEC 0.537 (−11.022,12.097) 0.201 (−1.058,1.460) −0.508 (−2.797,1.781) 0.025 (−2.359,2.410) 0.244 (−3.059,3.547) 0.200 (−2.222,2.622) 0.000 (−0.022,0.022)
    None CM, High ASLEC −1.935 (−17.573,13.704) 0.228 (−1.475,1.931) −0.268 (−3.365,2.828) −0.359 (−3.585,2.866) −1.183 (−5.651,3.285) −2.200 (−5.476,1.077) 0.006 (−0.024,0.036)
    CM, Low ASLEC −5.819 (−33.121,21.483) −0.695 (−3.668,2.279) −0.435 (−5.841,4.971) −0.752 (−6.384,4.879) −0.964 (−8.764,6.837) −0.285 (−6.005,5.435) −0.007 (−0.059,0.045)
    CM, Medium ASLEC −26.793 (−49.180,−4.406) −3.245 (−5.683,−0.807) −5.796 (−10.229.−1.363) −6.024 (−10.641,−1.406) −7.028 (−13.424,−0.632) −5.484 (−10.174,−0.793) −0.023 (−0.066,0.020)
    CM,High ASLEC −32.518 (−59.656,−5.380) −1.722 (−4.678,1.234) −5.173 (−10.547.0.200) −6.564 (−12.162,−0.966) −8.821 (−16.574,−1.067) −7.701 (−13.387,−2.015) −0.021 (−0.073,0.031)
      Note. Abbreviations: EA, Emotional abuse; PA, Physical abuse; SA, Sexual abuse; EN, Emotional neglect; PN, Physical neglect; VFA, visceral fat area; BMI, body mass index; PBF, percentage of body fat; FM, fat mass; WHR, waist hip ratio; WC, waist circumference. Models were adjusted for age, sex, drink, smoke, father education, mother education, family type, family economic and recent adolescent self−rating life events.
    下载: 导出CSV

    S7.   Association of different types of child maltreatment with obesity indicators by type of obesity.

    CM EA PA SA EN PN
    β (99%CI) P β (99%CI) P β (99%CI) P β (99%CI) P β (99%CI) P
    VFA
    Normal 3.686 (−18.630,26.002) 0.668 −7.805 (−34.715,19.105) 0.452 −14.910 (−49.771,19.951) 0.268 −0.502 (−25.757,24.753) 0.959 −14.082 (−38.392,10.228) 0.134
    Obese/
    overweight
    −12.225 (−68.104,43.665) 0.558 −12.252 (−75.811,51.307) 0.605 −9.806 (−88.179,68.567) 0.737 −10.994 (−86.954,64.965) 0.698 1.982 (−62.264,67.228) 0.935
    BMI
    Normal 1.126 (−0.907,3.159) 0.152 0.162 (−2.303,2.627) 0.865 −2.213 (−5.388,0.961) 0.071 0.850 (−1.456,3.156) 0.339 −0.590 (−2.823,1.643) 0.493
    Obese/
    overweight
    −0.061 (−6.184,6.062) 0.979 −3.724 (−10.503,3.054) 0.145 −2.791 (−11.273,5.692) 0.379 −1.954 (−10.216,6.309) 0.527 −0.787 (−7.899,6.325) 0.767
    PBF
    Normal 2.135 (−3.313,7.583) 0.310 −1.619 (−8.203,4.966) 0.524 −2.265 (−10.807,6.276) 0.491 0.994 (−5.181,7.169) 0.676 −2.021 (−7.987,3.944) 0.380
    Obese/
    overweight
    1.322 (−8.190,10.835) 0.709 0.459 (−10.368,11.286) 0.909 1.751 (−11.555,15.058) 0.724 1.988 (−10.907,14.883) 0.679 3.759 (−7.207,14.725) 0.360
    FM
    Normal 1.796 (−2.657,6.248) 0.296 −0.802 (−6.188,4.583) 0.699 −2.460 (−9.436,4.516) 0.360 0.823 (−4.225,5.870) 0.672 −2.129 (−7.000,2.742) 0.257
    Obese/
    overweight
    −1.921 (−14.258,10.416) 0.676 −2.451 (−16.462,11.560) 0.639 −2.850 (−20.099,14.399) 0.658 −1.662 (−18.414,15.090) 0.790 2.144 (−12.203,16.492) 0.689
    WC
    Normal 1.807 (−4.312,7.926) 0.444 −0.211 (−7.606,7.184) 0.941 −2.250 (−11.837,7.336) 0.543 0.755 (−6.175,7.685) 0.777 −3.260 (−9.942,3.422) 0.206
    Obese/
    overweight
    −2.946 (−17.968,12.077) 0.599 −4.719 (−21.732,12.294) 0.458 −3.612 (−24.638,17.415) 0.645 −3.141 (−23.540,17.258) 0.680 2.189 (−15.314,19.692) 0.737
    Hipline
    Normal 1.418 (−3.618,6.455) 0.465 3.414 (−2.643,9.471) 0.145 0.564 (−7.332,8.459) 0.853 1.737 (−3.960,7.433) 0.429 0.285 (−5.234,5.803) 0.894
    Obese/
    overweight
    −2.636 (−14.421,9.150) 0.549 −0.839 (−14.286,12.608) 0.867 −5.571 (−21.959,10.816) 0.364 −2.116 (−18.144,13.9112) 0.723 1.314 (−12.439,15.067) 0.798
    WHR
    Normal 0.007 (−0.048,0.061) 0.750 −0.035 (−0.101,0.030) 0.162 −0.033 (−0.118,0.052) 0.311 −0.006 (−0.067,0.056) 0.813 −0.037 (−0.096,0.022) 0.102
    Obese/
    overweight
    −0.005 (−0.096,0.087) 0.890 −0.040 (−0.143,0.063) 0.300 0.015 (−0.113,0.143) 0.757 −0.012 (−0.136,0.112) 0.798 0.010 (−0.096,0.117) 0.793
    Note: Abbreviations: EA, Emotional abuse; PA, Physical abuse; SA, Sexual abuse; EN, Emotional neglect; PN, Physical neglect; VFA, visceral fat area; BMI, body mass index; PBF, percentage of body fat; FM, fat mass; WHR, waist hip ratio; WC, waist circumference. ASLEC, Adolescent Self−Rating Life Events Checklist. Models were adjusted for age, sex, drink, smoke, father education, mother education, family type, family economic and recent adolescent self−rating life events.
    下载: 导出CSV
  • [1] Wang L, Cheng H, Qu YH, et al. The prevalence of child maltreatment among Chinese primary and middle school students: a systematic review and meta-analysis. Soc Psychiatry Psychiatr Epidemiol, 2020; 55, 1105−19. doi:  10.1007/s00127-020-01916-7
    [2] Zheng WC, Wen LL, Huang YJ, et al. The mediating role of childhood maltreatment in the association between residence migration and adolescent depression. J Affect Disorders, 2024; 346, 42−8. doi:  10.1016/j.jad.2023.10.150
    [3] Zhang YB, Chen GC, Sotres-Alvarez D, et al. General or central obesity and mortality among US Hispanic and Latino Adults. JAMA Netw Open, 2024; 7, e2351070. doi:  10.1001/jamanetworkopen.2023.51070
    [4] Tsujimoto T, Kajio H. Abdominal obesity is associated with an increased risk of all-cause mortality in patients with HFpEF. J Am Coll Cardiol, 2017; 70, 2739−49. doi:  10.1016/j.jacc.2017.09.1111
    [5] Ziobrowski HN, Buka SL, Austin SB, et al. Child and adolescent abuse patterns and incident obesity risk in young adulthood. Am J Prev Med, 2022; 63, 809−17. doi:  10.1016/j.amepre.2022.06.008
    [6] Töpfer P, Siewert-Markus U, Klinger-König J, et al. Sex-specific associations of childhood maltreatment with obesity-related traits - the Study of Health in Pomerania (SHIP). Child Abuse Negl, 2024; 149, 106704. doi:  10.1016/j.chiabu.2024.106704
    [7] He JY, Zhong X, Gao YD, et al. Psychometric properties of the Chinese version of the Childhood Trauma Questionnaire-Short Form (CTQ-SF) among undergraduates and depressive patients. Child Abuse Negl, 2019; 91, 102−8. doi:  10.1016/j.chiabu.2019.03.009
    [8] Yang LS, Sun L, Zhang ZH, et al. Internet addiction, adolescent depression, and the mediating role of life events: finding from a sample of Chinese adolescents. Int J Psychol, 2014; 49, 342−7. doi:  10.1002/ijop.12063
    [9] Xu YX, Zhang AH, Yu Y, et al. Sex-specific association of exposure to bedroom light at night with general and abdominal adiposity in young adults. Ecotoxicol Environ Saf, 2021; 223, 112561. doi:  10.1016/j.ecoenv.2021.112561
    [10] Schroeder K, Schuler BR, Kobulsky JM, et al. The association between adverse childhood experiences and childhood obesity: a systematic review. Obes Rev, 2021; 22, e13204. doi:  10.1111/obr.13204
  • [1] XU Ze, ZHANG Dong Dong, LIU Ya Ping, ZHANG Yu Jing, XUE Yuan, GAO Jiao Jiao, ZHAO Tong, HUANG Hao Yue, LI Wen Jie, LI Xing.  Association of VDR Polymorphisms and Gene–obesity Interaction with Type 2 Diabetes: A Case–control Study among Chinese Rural Population . Biomedical and Environmental Sciences, doi: 10.3967/bes2022.136
    [2] ZHANG Yu Tong, HUANG Tao, ZHOU Fang, HUANG Ao Di, JI Xiao Qi, HE Lu, GENG Qiang, WANG Jia, MEI Can, XU Yu Jia, YANG Ze Long, ZHAN Jian Bo, CHENG Jing.  Correlation between Anxiety, Depression, and Sleep Quality in College Students . Biomedical and Environmental Sciences, doi: 10.3967/bes2022.084
    [3] YANG Jing Li, HUANG Jun Jun, CHENG Ning, ZHANG De Sheng, LIU Si Min, HUANG Wen Ya, LI Na, HUANG Pei Yao, DING Jiao, LIU Nian, BAO Kai Fang, DING Jie, CHEN Xiao Liang, ZHENG Tong Zhang, BAI Ya Na.  Sex-specific and Dose-response Relationship between the Incidence of Gallstones and Components of the Metabolic Syndrome in Jinchang Cohort: A Prospective Study . Biomedical and Environmental Sciences, doi: 10.3967/bes2020.084
    [4] HUANG Li Na, WANG Hui Jun, WANG Zhi Hong, DING Gang Qiang.  Association between Chinese Famine Exposure and the Risk of Overweight/Obesity and Abdominal Obesity in Laterlife: A Cross-sectional Study . Biomedical and Environmental Sciences, doi: 10.3967/bes2020.017
    [5] ZHAI Yi, REN Ze Ping, ZHANG Mei, ZHANG Jian, JIANG Yong, MI Sheng Quan, WANG Zhuo Qun, ZHAO Yan Fang, SONG Peng Kun, YIN Zhao Xue, ZHAO Wen Hua.  Abdominal Obesity and Its Attribution to All-cause Mortality in the General Population with 14 Years Follow-up: Findings from Shanxi Cohort in China . Biomedical and Environmental Sciences, doi: 10.3967/bes2020.032
    [6] LIU Dan, HAO Yun Xia, ZHAO Ting Zhi, SONG Peng Kun, ZHAI Yi, PANG Shao Jie, ZHAO Yan Fang, ZHANG Mei, WANG Zhuo Qun, MI Sheng Quan, WANG Yu Ying, ZHANG Jian, ZHAO Wen Hua.  Childhood BMI and Adult Obesity in a Chinese Sample: A 13-Year Follow-up Study . Biomedical and Environmental Sciences, doi: 10.3967/bes2019.023
    [7] ZHAI Yi, FANG Hong Yun, YU Wen Tao, YU Dong Mei, ZHAO Li Yun, LIANG Xiao Feng, ZHAO Wen Hua.  Changes in Waist Circumference and Abdominal Obesity among Chinese Adults over a Ten-year Period . Biomedical and Environmental Sciences, doi: 10.3967/bes2017.042
    [8] JIN Shan Shan, BU Kai, CHEN Fang Fang, XU Hui Fang, LI Yi, ZHAO Dong Hui, XU Fang, LI Jing Yan, HAN Meng Jie, WANG Ning, WANG Lu.  Correlates of Condom-use Self-efficacy on the EPPM-based Integrated Model among Chinese College Students . Biomedical and Environmental Sciences, doi: 10.3967/bes2017.013
    [9] ZHONG Chong Ke, ZHONG Xiao Yan, XU Tan, ZHANG Yong Hong.  Measures of Abdominal Adiposity and Risk of Stroke:A Dose-Response Meta-analysis of Prospective Studies . Biomedical and Environmental Sciences, doi: 10.3967/bes2016.002
    [10] JI Cheng Ye, CHEN Tian Jiao, Working Group on Obesity in China.  Empirical Changes in the Prevalence of Overweight and Obesity among Chinese Students from 1985 to 2010 and Corresponding Preventive Strategies . Biomedical and Environmental Sciences, doi: 10.3967/0895-3988.2013.01.001
    [11] MENG Li Ping, LIU Ai Ling, HU Xiao Qi, ZHANG Qian, DU Song Ming, FANG Hong Yun, MA Jun, XU Gui Fa, LI Ying, GUO Hong Wei, DU Lin, MA Guan Sheng.  Report on Childhood Obesity in China (10): Association of Sleep Duration with Obesity . Biomedical and Environmental Sciences, doi: 10.3967/0895-3988.2012.02.002
    [12] YAN-PING LI, XIAO-QI HU, EVERT G. SCHOUTEN, AI-LING LIU, SONG-MING DU, LIN-ZHONG LI, ZHAO-HUI CUI, DONG WANG, FRANS J KOK, FRANK B HU, GUAN-SHENG MA.  Report on Childhood Obesity in China (8): Effects and Sustainability of Physical Activity Intervention on Body Composition of Chinese Youth . Biomedical and Environmental Sciences,
    [13] QIN XIAO, MA-XIA DONG, JIE YAO, WEN-XIAN LI, DONG-QING YE.  Parental Alcoholism, Adverse Childhood Experiences, and Later Risk of Personal Alcohol Abuse among Chinese Medical Students . Biomedical and Environmental Sciences,
    [14] YAN-PING LI, GUAN-SHENG MA, EVERT G. SCHOUTEN, XIAO-QI HU, ZHAO-HUI CUI, DONG WANG, FRANS J. KOK.  Report on Childhood Obesity in China (5) Body Weight, Body Dissatisfaction, and Depression Symptoms of Chinese Children Aged 9-10 Years . Biomedical and Environmental Sciences,
    [15] CHENG-YE JI, WORKING GROUP ON OBESITY IN CHINA (WGOC).  Report on Childhood Obesity in China (4) Prevalence and Trends of Overweight and Obesity in Chinese Urban School-age Children and Adolescents, 1985-2000 . Biomedical and Environmental Sciences,
    [16] GUAN-SHENG MA, YAN-PING LI, XIAO-QI HU, ZHAO-HUI CUI, XIAO-GUANG YANG, CHUN-MING CHEN.  Report on Childhood Obesity in China (2)Verification of BMI Classification Reference for Overweight and Obesity in Chinese Children and Adolescents . Biomedical and Environmental Sciences,
    [17] WEI-PING JIA, Ming Yang, XIN-YU SHAO, YU-QIAN BAO, JUN-XI LU, KUN-SAN XIANG.  Resting Energy Expenditure and Its Relationship With Patterns of Obesity and Visceral Fat Area in Chinese Adults . Biomedical and Environmental Sciences,
    [18] YAN-PING LI, XIAO-GUANG YANG, FENG-YING ZHAI, JIAN-HUA PIAO, WEN-HUA ZHAO, JIAN ZHANG, GUAN-SHENG MA.  Disease Risks of Childhood Obesity in China . Biomedical and Environmental Sciences,
    [19] CHENGYE JI, COOPERATIVE STUDY ON CHILDHOOD OBESITY,  WORKING GROUP ON OBESITY IN CHINA (WGOC).  Report on Childhood Obesity in China (1) Body Mass Index Reference for Screening Overweight and Obesity in Chinese School-age Children . Biomedical and Environmental Sciences,
    [20] WEI-PING JIA, JUN-XI LU, KUN-SAN XIANG, YU-QIAN BAO, Hui-Juan LU, Lei CHEN.  Prediction of Abdominal Visceral Obesity From Body Mass Index,Waist Circumference and Waist-hip Ratio in Chinese Adults:Receiver Operating Characteristic Curves Analysis . Biomedical and Environmental Sciences,
  • 加载中
图(5) / 表ll (9)
计量
  • 文章访问数:  72
  • HTML全文浏览量:  33
  • PDF下载量:  9
  • 被引次数: 0
出版历程
  • 收稿日期:  2024-05-20
  • 录用日期:  2024-07-19

Sex- and Type-specific Relationship of Childhood Maltreatment with General Obesity and Abdominal Adiposity in Chinese College Students

doi: 10.3967/bes2024.132
    基金项目:  This work was supported by the grant from the National Natural Science Foundation of China (grant no. 82173539, 82204071, 81874268).
    作者简介:

    Yingying Tong, female, born in 1998, MPH, majoring in mental health of children and adolescents

    Min Li, female, born in 2000, MPH, majoring in ACEs and adolescent health

    Yujie Su, female, Undergraduate, born in 2004, majoring in adolescent health

    通讯作者: Wei Chen, E-mail: 446323089@qq.comGengfu Wang, E-mail: wanggenfu@ahmu.edu.cn
注释:
1) AUTHOR CONTRIBUTIONS:

English Abstract

Tong Yingying, Li Min, Su Yujie, Tang Ting, Zhu Ying, Ding Han, Zhang Xueying, Su Puyu, Chen Wei, Wang Gengfu. Sex- and Type-specific Relationship of Childhood Maltreatment with General Obesity and Abdominal Adiposity in Chinese College Students[J]. Biomedical and Environmental Sciences. doi: 10.3967/bes2024.132
Citation: Tong Yingying, Li Min, Su Yujie, Tang Ting, Zhu Ying, Ding Han, Zhang Xueying, Su Puyu, Chen Wei, Wang Gengfu. Sex- and Type-specific Relationship of Childhood Maltreatment with General Obesity and Abdominal Adiposity in Chinese College Students[J]. Biomedical and Environmental Sciences. doi: 10.3967/bes2024.132
  • Childhood maltreatment (CM) is a serious problem for children’s future development. The incidence of childhood maltreatment (CM) among college students in China was 64.7 percent, with the highest prevalence observed for emotional neglect (60.0%) and the lowest for sexual abuse (15.7%)[1]. A growing body of evidence suggests that CM related to multiple physical and mental health outcomes, such as depression and anxiety, especially in obesity [2].

    Obesity among adults is one of the major health concerns. WHO estimates that more than 1.3 billion adults worldwide are overweight, and a further 600 million are obese[3]. Body mass index (BMI) measures general obesity (ie, abnormal or excessive fat accumulation), abdominal obesity is fat accumulation under the skin of the abdomen or in the internal organs of the abdomen [4]. Measures of abdominal obesity are better predictors of cardiovascular disease and all-cause mortality than is general obesity[4].

    Although numerous previous studies have established a positive correlation between CM and adult obesity, several key questions remain that warrant further exploration. First, whether the effects of the five types of childhood abuse on obesity in adulthood uniform or heterogeneous? Evidence suggests that all five types of CM are positively associated with BMI in adulthood, but others believed there was no significant association between physical neglect or abuse, sexual abuse and adult obesity (BMI), among the various types of child abuse[5]. Second, whether the associations between subtypes of child maltreatment and obesity indexes differ across sexes? Previous studies have shown that childhood physical abuse in girls was not associated with obesity in adulthood, but recent studies have shown the specificity of physical and sexual abuse appeared to be stronger among females[6]. In addition, the social context and cultural background of China differ from those of Western countries, which might impact the relationship between CM and obesity. For example, unlike in Western countries, Chinese parents prefer physically punitive education, which increases the risk of childhood somatic abuse and may affect obesity indicators in adulthood. Third, is there an interaction effect between recent adverse life events and CM on obesity indexes? Previous research indicates a connection between childhood maltreatment and obesity, suggesting that more recent adversities may exert a different influence on health than remote ones, including factors like depressive symptoms, anxiety, and pain[5]. Stressful events occurring in the past six months had a more pronounced impact on neuroticism levels compared to distant events, with neuroticism levels serving as crucial predictors of both mental and physical health issues. There was a close link between early and recent adversity experiences, showing an interaction at the level of recent adverse events which heightened the risk of mental health problems. Nonetheless, limited research has delved into the repercussions of recent adverse life events on obesity.

    In summary, exposure to CM might be associated with obesity in early adulthood. There is a variation in the prevalence of obesity and childhood abuse across different countries, and the relationship between types of CM and obesity indicators has not been validated among individuals in early adulthood in China. To address this gap, our study employed a linear regression model to explore the associations among CM, obesity, and recent adverse life events.

    We recruited college students via flyers and posters between October and November 2023. There were 337 college students from Anhui Medical University (Hefei, Anhui, China) in this study. All enumerators were uniformly trained before the survey. We provided a self-administered questionnaire on adolescent mental health behaviors, which collected information regarding general demographic characteristics (Supplementary Table S1, available in www.besjournal.com). The study protocol was approved by the ethics committee of Anhui Medical University (No. 20210355), and informed consent was obtained from all participants. Moreover, the Strengthening the Reporting of Observational Studies in Epidemiology (STROBE) was used to report observational data (Supplementary Table S2, available in www.besjournal.com).

    Table S1.  Description of the sample characteristics.

    Variables Total (n=305) Males (n=152) Females (n=153)
    Age, Mean (SD) 18.94 (0.71) 18.90 (0.75) 18.98 (0.67)
    Only child
    Yes 89 (29.2) 47 (30.9) 42 (27.5)
    No 216 (70.8) 105 (69.1) 111 (72.5)
    Residential area
    Rural 196 (64.3) 96 (63.2) 100 (65.4)
    Urban 109 (35.7) 56 (36.8) 96 (63.2)
    Family type
    Nuclear family 203 (66.6) 108 (71.1) 95 (62.1)
    Single-parent family 23 (7.5) 11 (7.2) 12 (7.8)
    Extended family 79 (25.9) 33 (21.7) 46 (30.1)
    Family economic
    Less than 5000 80 (26.2) 31 (20.4) 49 (32.0)
    5000-10,000 124 (40.7) 61 (40.1) 63 (41.2)
    More than10,000 101 (33.1) 60 (39.5) 34 (26.8)
    Mother’s education level
    Primary and below 96 (31.5) 52 (34.2) 44 (28.8)
    Junior middle 126 (41.3) 61 (40.1) 65 (42.5)
    Senior middle 83 (27.2) 39 (25.7) 44 (28.8)
    Father’s education level
    Primary and below 58 (19.0) 28 (18.4) 30 (19.6)
    Junior middle 122 (40.0) 61 (40.1) 61 (39.9)
    Senior middle 125 (41.0) 63 (41.4) 62 (40.5)
    Smoke
    Yes 8 (5.3) 8 (2.6) 0 (0)
    No 297 (97.4) 144 (94.7) 153 (100)
    Drink
    Yes 97 (31.8) 73 (48.0) 24 (15.7)
    No 208 (68.2) 79 (52.0) 129 (84.3)
    EA score, Mean (SD) 5.87 (2.30) 6.05 (2.93) 5.70 (1.42)
    PA score, Mean (SD) 5.51 (2.24) 5.79 (3.01) 5.25 (0.92)
    SA score, Mean (SD) 5.34 (1.95) 5.57 (2.70) 5.12 (0.50)
    EN score, Mean (SD) 5.55 (2.26) 5.72 (2.77) 5.38 (1.57)
    PN score, Mean (SD) 5.60 (2.13) 5.71 (2.76) 5.48 (1.22)
    VFA, Mean (SD) 68.89 (35.35) 63.23 (39.52) 74.51 (29.73)
    BMI, Mean (SD) 22.49 (3.92) 23.36 (4.59) 21.63 (2.87)
    PBF, Mean (SD) 25.36 (8.24) 20.77 (7.88) 29.93 (5.67)
    FM, Mean (SD) 16.50 (7.28) 15.66 (8.74) 17.33 (5.37)
    WC, Mean (SD) 80.17 (10.29) 82.98 (12.04) 77.37 (7.21)
    Hipline, Mean (SD) 93.36 (7.48) 94.02 (8.71) 92.70 (5.96)
    WHR, Mean (SD) 0.86 (0.070) 0.88 (0.08) 0.83 (0.04)
    ASLEC, Mean (SD) 41.61 (17.69) 45.42 (21.04) 37.83 (12.53)
      Note. Abbreviations: EA, Emotional abuse; PA, Physical abuse; SA, Sexual abuse; EN, Emotional neglect; PN, Physical neglect; VFA, visceral fat area; BMI, body mass index; PBF, percentage of body fat; FM, fat mass; WHR, Waist hip ratio; WC, waist circumference. ASLEC, Adolescent Self-Rating Life Events Checklist.

    Table S2.  STROBE Statement-checklist of items that should be included in reports of observational studies.

    Item No. Recommendation Page No.
    Title and abstract 1 (a) Indicate the study’s design with a commonly used term in the title or the abstract 1
    (b) Provide in the abstract an informative and balanced summary of what was done and what was found None.
    Introduction
    Background/rationale 2 Explain the scientific background and rationale for the investigation being reported 2
    Objectives 3 State specific objectives, including any prespecified hypotheses 2
    Methods
    Study design 4 Present key elements of study design early in the paper 3-4
    Setting 5 Describe the setting, locations, and relevant dates, including periods of recruitment, exposure, follow-up, and data collection 3-4
    Participants 6 (a) Cohort study—Give the eligibility criteria, and the sources and methods of selection of participants. Describe methods of follow-up
    Case-control study—Give the eligibility criteria, and the sources and methods of case ascertainment and control selection. Give the rationale for the choice of cases and controls
    Cross-sectional study—Give the eligibility criteria, and the sources and methods of selection of participants
    3-4
    (b) Cohort study—For matched studies, give matching criteria and number of exposed and unexposed
    Case-control study—For matched studies, give matching criteria and the number of controls per case
    None.
    Variables 7 Clearly define all outcomes, exposures, predictors, potential confounders, and effect modifiers. Give diagnostic criteria, if applicable 3-4
    Data sources/ measurement 8* For each variable of interest, give sources of data and details of methods of assessment (measurement). Describe comparability of assessment methods if there is more than one group 3-4
    Bias 9 Describe any efforts to address potential sources of bias Not reported
    Study size 10 Explain how the study size was arrived at 3
    Quantitative variables 11 Explain how quantitative variables were handled in the analyses. If applicable, describe which groupings were chosen and why 3-4
    Statistical methods 12 (a) Describe all statistical methods, including those used to control for confounding 4
    (b) Describe any methods used to examine subgroups and interactions 4
    (c) Explain how missing data were addressed 4
    (d) Cohort study—If applicable, explain how loss to follow-up was addressed
    Case-control study—If applicable, explain how matching of cases and controls was addressed
    Cross-sectional study—If applicable, describe analytical methods taking account of sampling strategy
    4
    (e) Describe any sensitivity analyses Not reported
    Results
    Participants 13* (a) Report numbers of individuals at each stage of study—eg numbers potentially eligible, examined for eligibility, confirmed eligible, included in the study, completing follow-up, and analysed 4, Table S1
    (b) Give reasons for non-participation at each stage 3, Figure s1
    (c) Consider use of a flow diagram Figure S1
    Descriptive data 14* (a) Give characteristics of study participants (eg demographic, clinical, social) and information on exposures and potential confounders 4-5
    (b) Indicate number of participants with missing data for each variable of interest Figure S1
    (c) Cohort study—Summarise follow-up time (eg, average and total amount) None,
    Outcome data 15* Cohort study—Report numbers of outcome events or summary measures over time
    Case-control study—Report numbers in each exposure category, or summary measures of exposure
    Cross-sectional study—Report numbers of outcome events or summary measures 4-5
    Main results 16 (a) Give unadjusted estimates and, if applicable, confounder-adjusted estimates and their precision (eg, 95% confidence interval). Make clear which confounders were adjusted for and why they were included Table 2
    (b) Report category boundaries when continuous variables were categorized None.
    (c) If relevant, consider translating estimates of relative risk into absolute risk for a meaningful time period Not reported
    Discussion
    Key results 18 Summarise key results with reference to study objectives 4-5
    Limitations 19 Discuss limitations of the study, taking into account sources of potential bias or imprecision. Discuss both direction and magnitude of any potential bias 4-5
    Interpretation 20 Give a cautious overall interpretation of results considering objectives, limitations, multiplicity of analyses, results from similar studies, and other relevant evidence 4-5
    Generalisability 21 Discuss the generalisability (external validity) of the study results 4-5
    Other information
    Funding 22 Give the source of funding and the role of the funders for the present study and, if applicable, for the original study on which the present article is based 1
      Note. *Give information separately for cases and controls in case-control studies and, if applicable, for exposed and unexposed groups in cohort and cross-sectional studies.

    The inclusion criterion was as follows: freshmen of the School of Public Health, Anhui Medical University, China (aged ≥ 18 years). Exclusion criteria included severe liver/kidney disease, physical disability, serious injury or infection, use of psychotropic drugs, and incomplete questionnaire data. Individuals with incomplete information on CM (n = 12) and those with missing body composition measurements (n = 20) were excluded from this study. Finally, 305 participants (aged ≥ 18 years) were included in this study (Supplementary Figure S1, available in www.besjournal.com).

    Figure S1.  The study follow chart.

    The Chinese version of the Childhood Trauma Questionnaire-Short Form (CTQ-SF) was used to assess CM[7]. The CTQ-SF evaluates five dimensions, encompassing emotional abuse, physical abuse, sexual abuse, emotional neglect and physical neglect. Participants rated their responses to each question on a 5-point Likert scale, yielding total scores on the five dimensions ranging from 25 to 125. Higher scores indicate that participants have experienced severe child maltreatment (Cronbach α = 0.86).

    Two research assistants guided participants through the questionnaire. Height and weight were measured using appropriate devices, with participants asked to remove their shoes before measurement. Height readings were expressed in centimeters and weight in kilograms. The result is averaged twice. Waist circumference (WC) was measured by the researchers at the fullest part of the buttocks. Participants were instructed to stand upright with legs together and arms naturally hanging down, and a tape measure was placed horizontally from the pubic symphysis to the most convex point of the gluteus maximus muscle.

    Trained researchers carefully measured participants’ body composition using the InBody S10 (InBody Corp., Seoul, Korea), a medical grade body composition analyzer, that utilizes advanced technology, including an 8-point tactile electrode system, direct segmented measurement, and multifrequency analysis. Data on abdominal obesity indexes, including fat mass (FM), body fat percentage (PBF), WC, abdominal visceral fat area (VFA), waist-hip ratio (WHR), and general obesity index such as body mass index (BMI) were recorded by the monitor, which is seamlessly integrated with telemedicine software for efficient storage in each participant’s electronic health record.

    The Chinese version of the Adolescent Self-Rating Life Events Checklist (ASLEC) comprises 27 negative life events specifically tailored to evaluate recent mental experiences in adolescents[8]. The ASLEC scale encompasses 6 factors, including interpersonal relationships, academic pressure, punishment, loss, health adaptation, and other factors. Each item is rated on a six-point Likert scale, ranging from 0 to 5. By summing up all experienced events, the total number of negative life events encountered by the respondent can be calculated, with a higher total score indicating elevated stress levels (Cronbach α = 0.93).

    Drawing from prior research[9], we incorporated the following covariates into our analysis: age, gender (male, female), family type (nuclear family, single-parent family or extended family), family economic status (< 5,000 yuan, 5,000–10,000 yuan, or > 10,000 yuan), parental educational attainment (primary school and below, junior high school, or senior high school), smoking habits (≥ 1 smoking episodes in the last 30 days, yes or no), and drinking habits (≥1 incidents of alcohol consumption in the last 30 days, yes or no).

    The data is depicted as mean ± SD or median (interquartile range). For discrete variables, absolute frequency, percentage, and 95% confidence intervals were computed. Variances in different parameters between two groups were assessed using the unpaired t-test, while the Fisher exact test was employed to compare frequencies between the two groups. To test for a potential association between CM and adiposity indicators, linear regression models were used to obtain β coefficients and 95% CIs for changes in adiposity indicators. Sex-stratified linear regression analyses were conducted to assess the correlation between CM and indicators of obesity in early adulthood after adjusting for covariates. To assess the effect of recent adverse life events on this relationship, linear regression analyses were performed to assess the correlation between CM, recent adverse life events, and indicators of obesity in adulthood after adjusting for covariates and to calculate the β-value. All analyses were performed with SPSS (version 27.0; IBM Corp). A two-sided P value of ≤ 0.05 was considered statistically significant.

    This study assessed the association between five dimensions of CM and obesity indicators through multiple comparisons. To reduce the risk of a type I error, a 99% CI was used for the effect size of each dimension analyzed. After adjusting for covariates, emotional abuse demonstrated a stronger association with obesity indicators (VFA, BMI, PBF, FM, WC, and hipline). Physical abuse and emotional neglect were associated with two obesity indicators each (physical abuse: FM and hipline; emotional neglect: BMI and hipline). Sexual abuse showed an association only with hipline, however, no significant associations were found between somatic neglect and obesity indicators. Table 1 provides further details. It is well established that individuals who have experienced CM often adopt unhealthy lifestyle behaviors, such as detrimental exercise patterns and poor dietary habits, which can substantially contribute to obesity.

    Table 1.  Association of different types of child maltreatment with obesity indicators

    VariablesEAPASAENPN
    β (CI)Pβ (CI)Pβ (CI)Pβ (CI)Pβ (CI)P
    99%CI; P ≤ 0.01
    VFA29.090
    (5.335, 52.845)
    0.00215.223
    (−11.793,42.239)
    0.14519.989
    (−11.518,51.495)
    0.10118.835
    (−7.760,45.430)
    0.0677.688
    (−18.361,33.736)
    0.445
    BMI4.255
    (1.687,6.824)
    < 0.0012.917
    (−0.022,5.857)
    0.0112.884
    (−0.559,6.327)
    0.0313.253
    (0.362,6.144)
    0.0042.176
    (−0.664,5.016)
    0.048
    PBF6.208
    (1.516,10.900)
    < 0.0012.666
    (−2.690,8.022)
    0.1983.729
    (−2.516,9.973)
    0.1233.933
    (−1.331,9.198)
    0.0541.964
    (−3.193,7.120)
    0.324
    FM7.273
    (2.368,12.177)
    < 0.0014.470
    (−1.131,10.071)
    0.0395.295
    (−1.242,11.832)
    0.0375.201
    (−0.308,10.709)
    0.0153.063
    (−2.343,8.468)
    0.143
    WC8.623
    (1.891,15.355)
    0.0015.407
    (−2.246,13.059)
    0.0686.249
    (−2.685,15.183)
    0.0715.926
    (−1.613,13.465)
    0.0422.840
    (−4.548,10.229)
    0.320
    Hipline6.763
    (1.796,11.729)
    < 0.0016.802
    (1.206,12.397)
    0.0026.530
    (−0.039,13.099)
    0.0106.090
    (0.553,11.627)
    0.0054.510
    (−0.920,9.939)
    0.032
    WHR0.025
    (−0.020,0.070)
    0.146−0.011
    (−0.062,0.039)
    0.567−0.002
    (−0.061,0.058)
    0.9470.004
    (−0.046,0.053)
    0.852−0.016
    (−0.065,0.033)
    0.394
    95%CI; P ≤0.05
    VFA29.090
    (11.059,47.121)
    0.00215.223
    (−5.283,35.729)
    0.14519.989
    (−3.926,43.903)
    0.10118.835
    (−1.351,39.021)
    0.0677.688
    (−12.084,27.460)
    0.445
    BMI4.255
    (2.306,6.205)
    < 0.0012.917
    (0.686,5.149)
    0.0112.884
    (0.271,5.498)
    0.0313.253
    (1.059,5.447)
    0.0042.176
    (0.021,4.332)
    0.048
    PBF6.208
    (2.646,9.769)
    < 0.0012.666
    (−1.399,6.731)
    0.1983.729
    (−1.011,8.468)
    0.1233.933
    (−0.063,7.929)
    0.0541.964
    (−1.950,5.878)
    0.324
    FM7.273
    (3.550,10.995)
    < 0.0014.470
    (0.219,8.721)
    0.0395.295
    (0.333,10.257)
    0.0375.201
    (1.019,9.382)
    0.0153.063
    (−1.040,7.166)
    0.143
    WC8.623
    (3.513,13.733)
    0.0015.407
    (−0.402,11.215)
    0.0686.249
    (−0.532,13.031)
    0.0715.926
    (0.204,11.649)
    0.0422.840
    (−2.768,8.449)
    0.320
    Hipline6.763
    (2.993,10.532)
    < 0.0016.802
    (2.554,11.049)
    0.0026.530
    (1.544,11.516)
    0.0106.090
    (1.887,10.293)
    0.0054.510
    (0.389,8.631)
    0.032
    WHR0.025
    (−0.009,0.059)
    0.146−0.011
    (−0.050,0.027)
    0.567−0.002
    (−0.046,0.043)
    0.9470.004
    (−0.034,0.041)
    0.852−0.016
    (−0.053,0.021)
    0.394
      Note. EA, Emotional abuse; PA, Physical abuse; SA, Sexual abuse; EN, Emotional neglect; PN, Physical neglect; VFA, visceral fat area; BMI, body mass index; PBF, percentage of body fat; FM, fat mass; WHR, waist hip ratio; WC, waist circumference. Models were adjusted for age, sex, drink, smoke, father education, mother education, family type, family economic and recent adolescent self−rating life events.

    In addition, we performed sex-stratified linear regression models to explore the relationships between different types of CM and obesity indicators. The results indicated that none of the five types of CM were associated with obesity indicators in females. However, in males, emotional abuse showed a stronger association with obesity indicators (VFA, BMI, PBF, FM, WC, and hipline). Moreover, both physical abuse and emotional neglect exhibited significant associations (see Figure 1, Supplementary Figure S2, Supplementary Table S3, and Supplementary Table S4, available in www.besjournal.com). One plausible explanation for these findings is that males are more prone to experiencing the adverse effects of childhood abuse. Furthermore, in China, higher education is associated with an increased risk of overall obesity and abdominal obesity in males, whereas this risk is lower among females. Therefore, maltreated male college students may experience more psychological and behavioral problems, such as poor sleep and reduced physical activity, which contribute to obesity in early adulthood. However, a recent study in Germany reported contrasting findings[6]. This difference may be explained by the fact that the German study focused on a middle-aged population, whereas our study focused on university students in China. The impact of CM on the onset of obesity in adolescents may manifest over 2-5 years[10], or possibly even longer. Given that this study was conducted within the Chinese cultural context, the cultural and social context unique to China may influence the extrapolation of the results to other countries.
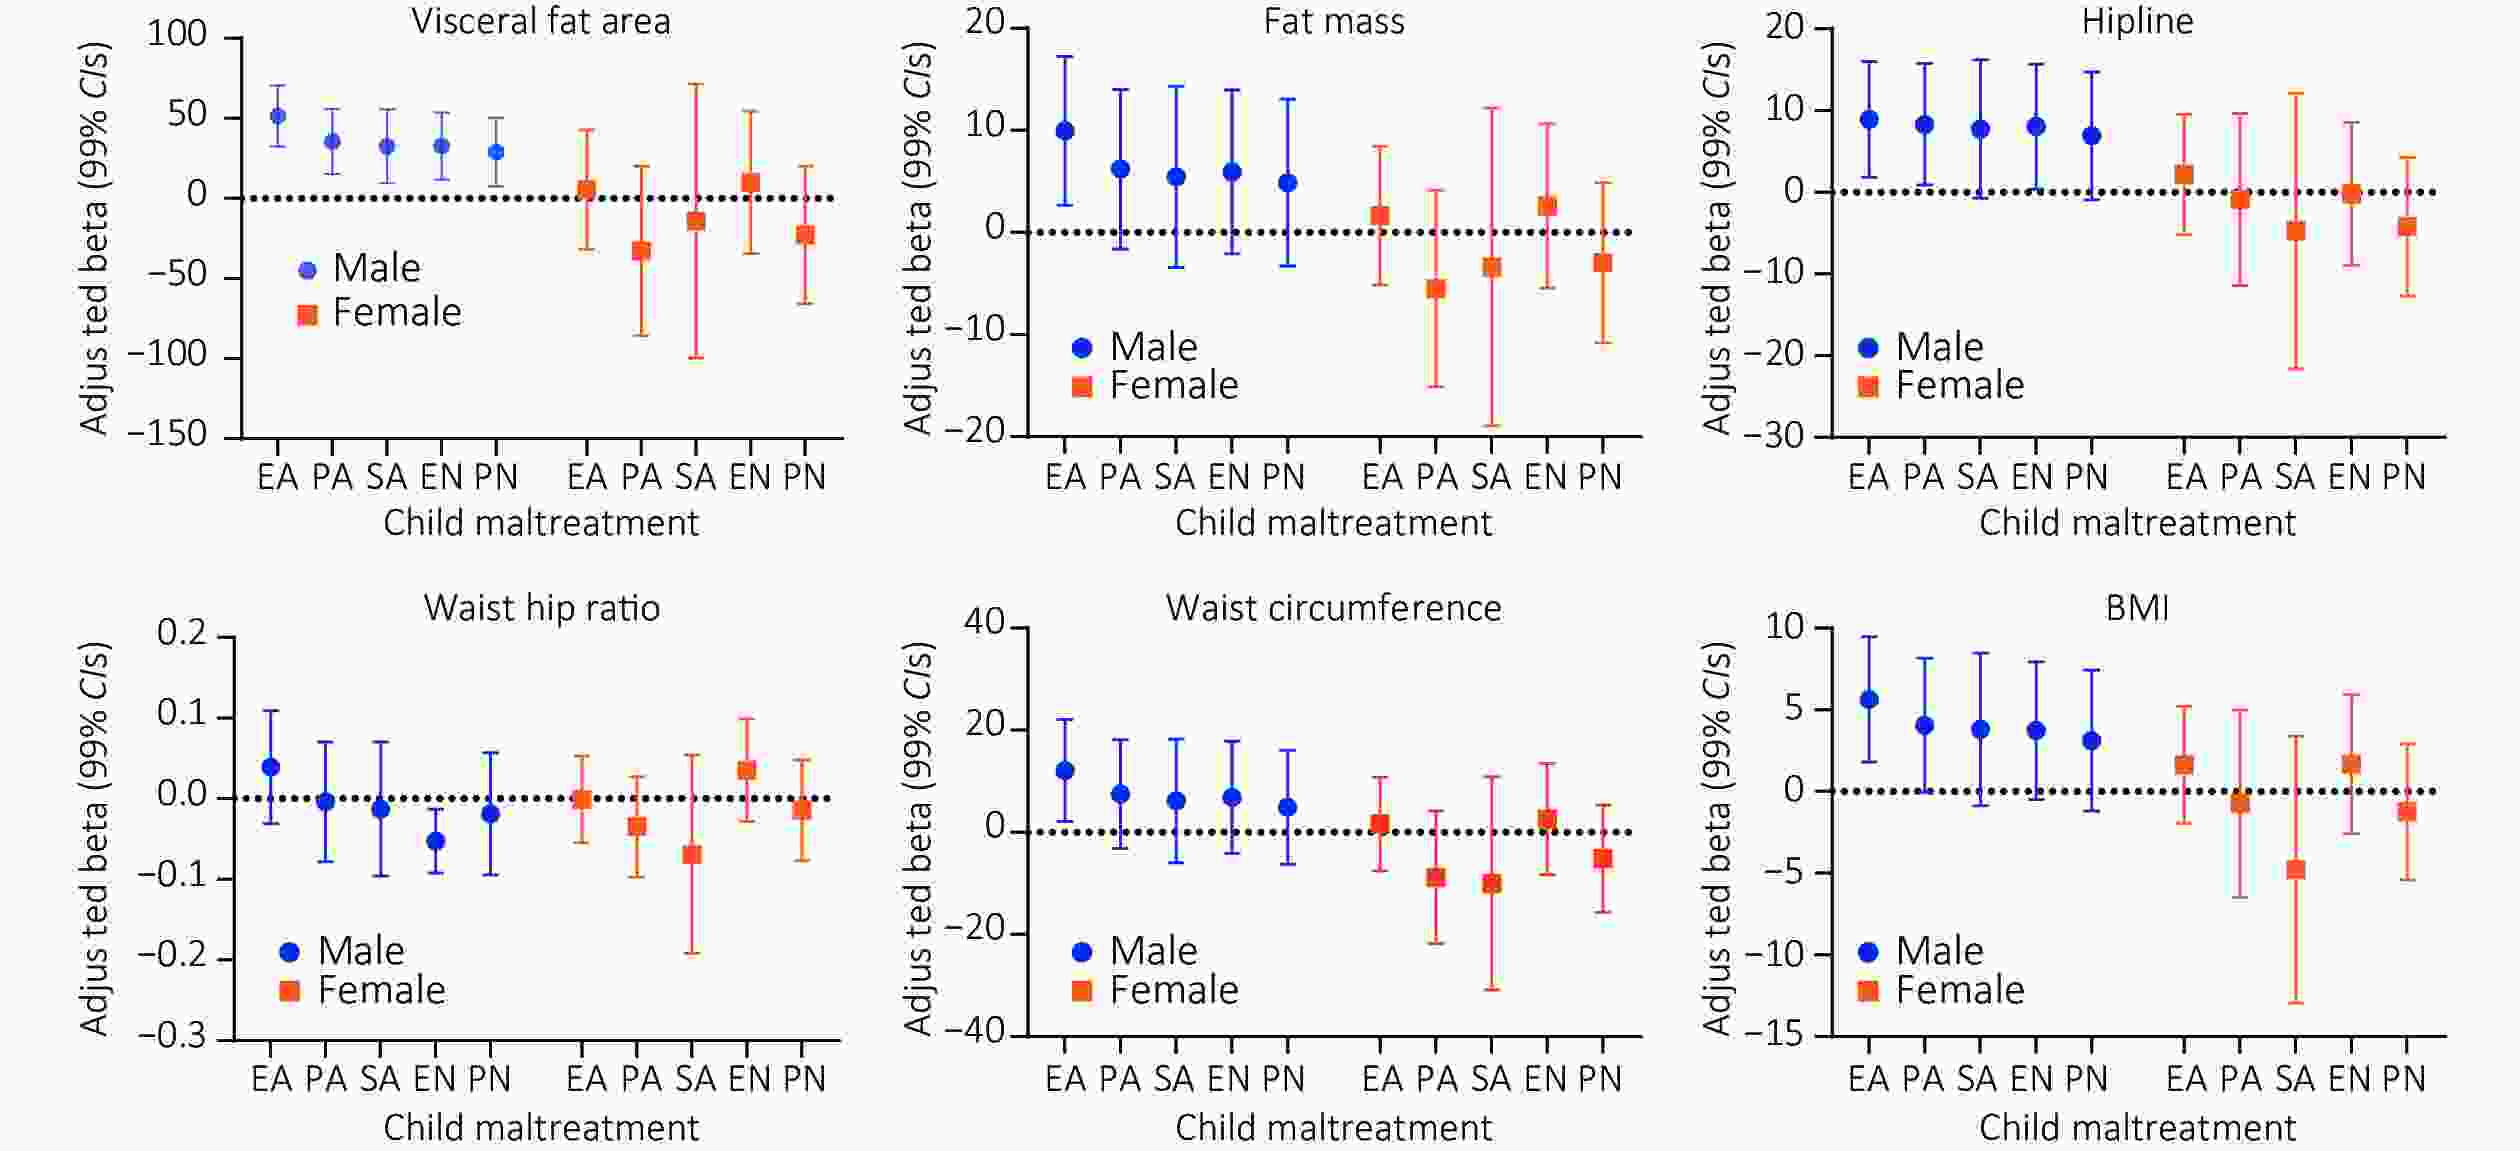
    Figure 1.  Relationship between child maltreatment and obesity indicators by sex; abbreviations: EA, Emotional abuse; PA, Physical abuse; SA, Sexual abuse; EN, Emotional neglect; PN, Physical neglect; Models were adjusted for age, sex, drink, smoke, father education, mother education, family type, family economic and recent adolescent self-rating life events. (A two-sided P value of ≤ 0.01 was considered statistically significant).

    The results further indicated that recent adverse life events were significantly associated with hipline (β=–0.079; 99% CI: –0.153 to –0.006) and WHR (β=0.001; 99% CI: 0.000 to 0.001). In addition, we explored whether there was an interaction between recent adversarial life events and childhood abuse on obesity metrics. The results of the multiplicative interaction effects showed that physical abuse and neglect, sexual abuse, and emotional neglect interacted with recent adverse life events on the hip circumference. However, the results regarding joint effects did not show statistical significance. They revealed that participants who experienced childhood abuse and also recently encountered moderate levels of adverse life events tended to exhibit lower levels of BMI. One plausible explanation is that children who experienced childhood abuse may be more susceptible to adversities in adulthood. Furthermore, persistent stress may affect the brain’s response to food, thus predisposing individuals to poor eating habits, which, if prolonged, could increase the risk of obesity. Therefore, it is crucial to address the impact of recent adverse life events on abdominal obesity in early adulthood. Further details can be found in Table 2, Supplementary Table S5, and Supplementary Table S6, available in www.besjournal.com.

    Table 2.  Association between recent adverse life events and cardiovascular indicators.

    Variables β (99%CI) P β (95%CI) P
    VFA 0.011 (−0.341,0.362) 0.938 0.011 (−0.257,0.278) 0.938
    BMI −0.023 (−0.062,0.015) 0.113 −0.023 (−0.052,0.006) 0.113
    PBF −0.015 (−0.084,0.055) 0.586 −0.015 (−0.067,0.038) 0.586
    FM −0.020 (−0.093,0.053) 0.481 −0.020 (−0.075,0.035) 0.481
    WC 0.007 (−0.093,0.107) 0.854 0.007 (−0.069,0.083) 0.854
    Hipline −0.079 (−0.153,−0.006) 0.006 −0.079 (−0.135,−0.024) 0.006
    WHR 0.001 (0.000,0.001) 0.002 0.001 (0.000,0.001) 0.002
      Note. VFA, visceral fat area; BMI, body mass index; PBF, percentage of body fat; FM, fat mass; WHR, waist hip ratio; WC, waist circumference. Models were adjusted for age, sex, drink, smoke, father education, mother education, family type, family economic, emotional abuse; physical abuse; sexual abuse; emotional neglect and physical neglect.

    Childhood maltreatment affects obesity indicators in adulthood, the effects of this adverse experience are long-lasting, and intervention strategies to prevent obesity should consider addressing adverse forms of maltreatment in childhood. In addition, it is recommended that relevant authorities conduct routine screening for CM in order to reduce the risk of CM on obesity.

    This study has several limitations. First, data on early childhood maltreatment were gathered through a retrospective self-report questionnaire, potentially introducing recall bias. Second, the participants were exclusively recruited from a single college in China, restricting the broader applicability of our results to young adults from varied demographic backgrounds. Third, the indicators of obesity in this study were somewhat limited, and future studies could include objectively measured indicators that more accurately reflect obesity. Fourth, this study did not consider the influence of several potential confounders (such as physical activity and dietary patterns) on the outcomes. Fifth, the obesity detection rate in this study was low and the sample size was small, which could impact the reliability of the findings. Therefore, our results remain preliminary, and future studies in China should aim to include a larger sample size to further validate our findings.

    In summary, four subtypes of CM (except for physical neglect) are associated with obesity indicators in early adulthood, especially in emotional abuse. The associations between exposure to CM and obesity-related traits in early adulthood are predominantly observed in males. Furthermore, recent adverse life events were significantly associated with obesity. Overall, this study highlights the importance of addressing both distant (CM) and recent adverse life events to alleviate obesity in early adulthood.

    • The authors declare that they have no conflict of interest.

    • Table S3.  Relationship between child maltreatment and obesity indicators by sex (A two-sided P value of ≤ 0.01 was considered statistically significant).

      VariablesEAPASAENPN
      β (99%CI)Pβ (99%CI)Pβ (99%CI)Pβ (99%CI)Pβ (99%CI)P
      VFA
      Males40.557
      (7.538,73.576)
      0.002
      23.830
      (−11.462,59.123)
      0.08019.357
      (−20.681,59.395)
      0.20920.694
      (−15.537,56.925)
      0.13816.676
      (−20.189,53.540)
      0.239
      Females5.609
      (−31.811,43.029)
      0.696−32.859
      (−85.825,20.106)
      0.107−14.013
      (−99.683,71.656)
      0.67010.106
      (−34.261,54.430)
      0.552−22.778
      (−65.702,20.146)
      0.168
      BMI
      Males5.631
      (1.799,9.462)
      < 0.0014.056
      (−0.049,8.161)
      0.0113.796
      (−0.871,8.463)
      0.0353.738
      (−0.483,7.958)
      0.0223.115
      (−1.194,7.424)
      0.061
      Females1.634
      (−1.950,5.219)
      0.236−2.218
      (−7.342,2.905)
      0.260−4.791
      (−12.971,3.389)
      0.1281.672
      (−2.584,5.927)
      0.307−1.249
      (−5.400,2.903)
      0.433
      PBF
      Males8.557
      (1.873,15.240)
      0.0014.780
      (−2.387,11.948)
      0.0844.014
      (−4.113,12.141)
      0.1994.038
      (−3.323,11.399)
      0.1543.351
      (−4.135,10.837)
      0.244
      Females1.200
      (−5.977,8.378)
      0.663−7.109
      (−17.244,3.025)
      0.069−2.132
      (−18.571,14.308)
      0.7352.813
      (−5.678,11.304)
      0.388−2.446
      (−10.721,5.829)
      0.441
      FM
      Males9.960
      (2.677,17.244)
      < 0.0016.213
      (−1.605,14.030)
      0.0405.454
      (−3.421,14.329)
      0.1115.928
      (−2.088,13.944)
      0.0554.873
      (−3.297,13.043)
      0.121
      Females1.660
      (−5.132,8.451)
      0.524−5.480
      (−15.117,4.157)
      0.140−3.371
      (−18.926,12.184)
      0.5722.594
      (−5.447,10.635)
      0.401−2.946
      (−10.771,4.880)
      0.327
      WC
      Males12.098
      (2.078,22.119)
      0.0027.491
      (−3.197,18.179)
      0.0696.137
      (−5.993,18.266)
      0.1886.843
      (−4.122,17.808)
      0.1054.932
      (−6.245,16.110)
      0.251
      Females1.612
      (−7.568,10.792)
      0.647−8.823
      (−21.794,4.148)
      0.078−10.001
      (−30.915,10.913)
      0.2142.639
      (−8.235,13.513)
      0.527−5.185
      (−15.728,5.358)
      0.201
      Hipline
      Males8.942
      (1.855,16.029)
      0.0018.326
      (0.882,15.770)
      0.0047.746
      (−0.738,16.229)
      0.0188.046
      (0.403,15.690)
      0.0076.928
      (−0.887,14.743)
      0.022
      Females2.187
      (−5.187,9.560)
      0.440−0.902
      (−11.456,9.653)
      0.824−4.734
      (−21.621,12.153)
      0.465−0.177
      (−8.937,8.583)
      0.958−4.205
      (−12.685,4.275)
      0.197
      WHR
      Males0.039
      (−0.031,0.109)
      0.144−0.004
      (−0.078,0.070)
      0.887−0.013
      (−0.096,0.070)
      0.690−0.008
      (−0.083,−0.067)
      0.780−0.019
      (−0.095,0.057)
      0.522
      Females−0.001
      (−0.055,0.053)
      0.961−0.084
      (−0.056,0.035)
      0.004−0.069
      (−0.192,0.054)
      0.1460.035
      (−0.028,0.099)
      0.150−0.014
      (−0.077,0.048)
      0.554
        Note. Abbreviations: EA, Emotional abuse; PA, Physical abuse; SA, Sexual abuse;EN, Emotional neglect; PN, Physical neglect; VFA, visceral fat area; BMI, body mass index; PBF, percentage of body fat; FM, fat mass; WHR, Waist hip ratio; WC, waist circumference. Models were adjusted for age, drink, smoke, father education, mother education, family type, family economic and recent adolescent self−rating life events. A two−sided P value of ≤ 0.01 was considered statistically significant.

      Table S4.  Relationship between child maltreatment and obesity indicators by sex (A two−sided P value of ≤ 0.05 was considered statistically significant).

      Variables EA PA SA EN PN
      β (95%CI) P β (95%CI) P β (95%CI) P β (95%CI) P β (95%CI) P
      VFA
      Males 40.557
      (15.565,65.550)
      0.002
      23.830
      (−2.883,50.544)
      0.080 19.357
      (−10.948,49.663)
      0.209 20.694
      (−6.729,48.117)
      0.138 16.676
      (−11.228,44.579)
      0.239
      Females 5.609
      (−22.715,33.933)
      0.696 −32.859
      (−72.950,7.231)
      0.107 −14.013
      (−78.857,50.831)
      0.670 10.106
      (−23.443,43.656)
      0.552 −22.778
      (−55.268,9.712)
      0.168
      BMI
      Males 5.631
      (2.730,8.531)
      < 0.001 4.056
      (0.949,7.164)
      0.011 3.796
      (0.263,7.328)
      0.035 3.738
      (0.543,6.932)
      0.022 3.115
      (−0.146,6.376)
      0.061
      Females 1.634
      (−1.079,3.584)
      0.236 −2.218
      (−6.096,1.659)
      0.260 −4.791
      (−10.983,1.401)
      0.128 1.672
      (−1.594,4.892)
      0.307 −1.249
      (−4.391,1.894)
      0.433
      PBF
      Males 8.557
      (3.498,13.616)
      0.001 4.780
      (−0.645,10.206)
      0.084 4.014
      (−2.138,10.166)
      0.199 4.038
      (−1.534,9.610)
      0.154 3.351
      (−2.315,9.017)
      0.244
      Females 1.200
      (−4.233,6.634)
      0.663 −7.109
      (−14.780,0.561)
      0.069 −2.132
      (−14.575,10.311)
      0.735 2.813
      (−3.614,9.240)
      0.388 −2.446
      (−8.710,3.818)
      0.441
      FM
      Males 9.960
      (4.447,15.474)
      < 0.001 6.213
      (0.296,12.130)
      0.040 5.454
      (−1.264,12.172)
      0.111 5.928
      (−0.139,11.996)
      0.055 4.873
      (−1.311,11.057)
      0.121
      Females 1.660
      (−3.481,6.800)
      0.524 −5.480
      (−12.774,1.814)
      0.140 −3.371
      (−15.145,8.403)
      0.572 2.594
      (−3.493,8.681)
      0.401 −2.946
      (−8.869,2.977)
      0.327
      WC
      Males 12.098
      (4.513,19.683)
      0.002 7.491
      (−0.599,15.581)
      0.069 6.137
      (−3.044,15.318)
      0.188 6.843
      (−1.456,15.142)
      0.105 4.932
      (−3.528,13.393)
      0.251
      Females 1.612
      (−5.337,8.560)
      0.647 −8.823
      (−18.641,0.995)
      0.078 −10.001
      (−25.831,5.829)
      0.214 2.639
      (−5.591,10.870)
      0.527 −5.185
      (−13.165,2.795)
      0.201
      Hipline
      Males 8.942
      (3.577,14.306)
      0.001 8.326
      (2.691,13.961)
      0.004 7.746
      (1.324,14.167)
      0.018 8.046
      (2.261,13.832)
      0.007 6.928
      (1.013,12.843)
      0.022
      Females 2.187
      (−3.395,7.768)
      0.440 −0.902
      (−8.891,7.087)
      0.824 −4.734
      (−17.516,8.048)
      0.465 −0.177
      (−6.808,6.454)
      0.958 −4.205
      (−10.624,2.214)
      0.197
      WHR
      Males 0.039
      (−0.014,0.092)
      0.144 −0.004
      (−0.060,0.052)
      0.887 −0.013
      (−0.075,0.050)
      0.690 −0.008
      (−0.065,0.049)
      0.780 −0.019
      (−0.076,0.039)
      0.522
      Females −0.001
      (−0.042,0.040)
      0.961 −0.084
      (−0.141,−0.027)
      0.004 −0.069
      (−0.162,0.024)
      0.146 0.035
      (−0.013,0.084)
      0.150 −0.014
      (−0.062,0.033)
      0.554
        Note. Abbreviations: EA, Emotional abuse; PA, Physical abuse; SA, Sexual abuse;EN, Emotional neglect; PN, Physical neglect; VFA, visceral fat area; BMI, body mass index; PBF, percentage of body fat; FM, fat mass; WHR, Waist hip ratio; WC, waist circumference. Models were adjusted for age, drink, smoke, father education, mother education, family type, family economic and recent adolescent self−rating life events. A two−sided P value of ≤ 0.05 was considered statistically significant.

      Table S5.  Association between childhood adverse life events and recent adverse life events interacting with obesity indicators.

      VariablesEA*ASLECPA*ASLECSA*ASLECEN*ASLECPN*ASLEC
      β (CI)Pβ (CI)Pβ (CI)Pβ (CI)Pβ (CI)P
      99%CI; Pinteraction ≤ 0.01
      VFA−0.372 (−1.320,0.577)0.311−0.525 (−1.375,0.325)0.110−0.580 (−1.414,0.253)0.072−0.797 (−1.720,0.126)0.026−0.582 (−1.481,0.317)0.094
      BMI−0.027 (−0.130,0.076)0.493−0.050 (−0.142,0.043)0.164−0.053 (−0.144,0.038)0.131−0.060 (−0.161,0.041)0.124−0.035 (−0.133,0.063)0.351
      PBF−0.045 (−0.233,0.142)0.533−0.096 (−0.264,0.072)0.138−0.125 (−0.289,0.040)0.050−0.145 (−0.328,0.037)0.040−0.113 (−0.291,0.064)0.099
      FM−0.066 (−0.262,0.130)0.385−0.104 (−0.280,0.071)0.125−0.119 (−0.291,0.053)0.075−0.154 (−0.345,0.036)0.037−0.112 (−0.298,0.073)0.118
      WC−0.147 (−0.416,0.123)0.160−0.174 (−0.416,0.067)0.062−0.176 (−0.413,0.061)0.055−0.247 (−0.510,0.015)0.015−0.208 (−0.464,0.047)0.035
      Hipline−0.041 (−0.240,0.158)0.5940.003 (−0.176,0.182)0.9660.001 (−0.175,0.177)0.993−0.059 (−0.254,0.136)0.4330.008 (−0.181,0.198)0.910
      WHR−0.001 (−0.003,0.001)0.102−0.002 (−0.003,0.000)0.003−0.002 (−0.003,0.000)0.002−0.002 (−0.004,0.000)0.003−0.002 (−0.004,−0.001)0.001
      95%CI; Pinteraction ≤0.05
      VFA−0.372 (−1.092,0.348)0.311−0.525 (−1.170,0.120)0.110−0.580 (−1.213,0.052)0.072−0.797 (−1.497,−0.096)0.026−0.582 (−1.265,0.100)0.094
      BMI−0.027 (−0.106,0.051)0.493−0.050 (−0.120,0.020)0.164−0.053 (−0.122,0.016)0.131−0.060 (−0.136,0.016)0.124−0.035 (−0.110,0.039)0.351
      PBF−0.045 (−0.188,0.097)0.533−0.096 (−0.224,0.031)0.138−0.125 (−0.250,0.000)0.050−0.145 (−0.284,−0.007)0.040−0.113 (−0.248,0.022)0.099
      FM−0.066 (−0.215,0.083)0.385−0.104 (−0.238,0.029)0.125−0.119 (−0.249,0.012)0.075−0.154 (−0.299,−0.010)0.037−0.112 (−0.253,0.029)0.118
      WC−0.147 (−0.351,0.058)0.160−0.174 (−0.358,0.009)0.062−0.176 (−0.356,0.004)0.055−0.247 (−0.446,−0.048)0.015−0.208 (−0.402,−0.014)0.035
      Hipline−0.041 (−0.192,0.110)0.5940.003 (−0.133,0.139)0.9660.001 (−0.133,0.134)0.993−0.059 (−0.207,0.089)0.4330.008 (−0.136,0.152)0.910
      WHR−0.001 (−0.002,0.000)0.102−0.002 (−0.003,−0.001)0.003−0.002 (−0.003,−0.001)0.002−0.002 (−0.003,−0.001)0.003−0.002 (−0.004,−0.001)0.001
        Note. Abbreviations: EA, Emotional abuse; PA, Physical abuse; SA, Sexual abuse;EN, Emotional neglect; PN, Physical neglect; VFA, visceral fat are; BMI, body mass index; PBF, percentage of body fat; FM, fat mass; WHR, Waist hip ratio; WC, waist circumference; ASLEC, Adolescent Self−Rating Life Events Checklist. Models were adjusted for age, sex, drink, smoke, father education, mother education, family type, family economic, emotional abuse; physical abuse; sexual abuse; emotional neglect; physical neglect and recent adverse life events.

      Table S6.  Association of different types of child maltreatment with obesity indicators.

      Variables VFA BMI PBF FM WC Hipline WHR
      βinteraction (CI) βinteraction (CI) βinteraction (CI) β interaction (CI) βinteraction (CI) β interaction (CI) β interaction (CI)
      β, 99%CI
      None CM, Low ASLEC
      None CM, Medium ASLEC 0.537 (−14.694,15.769) 0.201 (−1.458,1.860) −0.508 (−3.524,2.508) 0.025 (−3.116,3.167) 0.244 (−4.108,4.596) 0.200 (−2.991,3.391) 0.000 (−0.029,0.029)
      None CM, High ASLEC −1.935 (−22.540,18.670) 0.228 (−2.016,2.472) −0.268 (−4.348,3.812) −0.359 (−4.610,3.891) −1.183 (−7.070,4.704) −2.200 (−6.517,2.117) 0.006 (−0.034,0.045)
      CM, Low ASLEC −5.819 (−41.791,30.153) −0.695 (−4.613,3.223) −0.435 (−7.558,6.688) −0.752 (−8.172,6.667) −0.964 (−11.241,9.314) −0.285 (−7.822,7.252) −0.007 (−0.076,0.062)
      CM, Medium ASLEC −26.793 (−56.290,2.703) −3.245 (−6.458,−0.032) −5.796 (−11.637,0.044) −6.024 (−12.108,0.060) −7.028 (−15.455,1.399) −5.484 (−11.664,0.697) −0.023 (−0.080,0.033)
      CM,High ASLEC −32.518 (−68.275,3.239) −1.722 (−5.616,2.173) −5.173 (−12.253,1.907) −6.564 (−13.939,0.811) −8.821 (−19.036,1.395) −7.701 (−15.193,−0.209) −0.021 (−0.089,0.048)
      β, 95%CI
      None CM, Low ASLEC
      None CM, Medium ASLEC 0.537 (−11.022,12.097) 0.201 (−1.058,1.460) −0.508 (−2.797,1.781) 0.025 (−2.359,2.410) 0.244 (−3.059,3.547) 0.200 (−2.222,2.622) 0.000 (−0.022,0.022)
      None CM, High ASLEC −1.935 (−17.573,13.704) 0.228 (−1.475,1.931) −0.268 (−3.365,2.828) −0.359 (−3.585,2.866) −1.183 (−5.651,3.285) −2.200 (−5.476,1.077) 0.006 (−0.024,0.036)
      CM, Low ASLEC −5.819 (−33.121,21.483) −0.695 (−3.668,2.279) −0.435 (−5.841,4.971) −0.752 (−6.384,4.879) −0.964 (−8.764,6.837) −0.285 (−6.005,5.435) −0.007 (−0.059,0.045)
      CM, Medium ASLEC −26.793 (−49.180,−4.406) −3.245 (−5.683,−0.807) −5.796 (−10.229.−1.363) −6.024 (−10.641,−1.406) −7.028 (−13.424,−0.632) −5.484 (−10.174,−0.793) −0.023 (−0.066,0.020)
      CM,High ASLEC −32.518 (−59.656,−5.380) −1.722 (−4.678,1.234) −5.173 (−10.547.0.200) −6.564 (−12.162,−0.966) −8.821 (−16.574,−1.067) −7.701 (−13.387,−2.015) −0.021 (−0.073,0.031)
        Note. Abbreviations: EA, Emotional abuse; PA, Physical abuse; SA, Sexual abuse; EN, Emotional neglect; PN, Physical neglect; VFA, visceral fat area; BMI, body mass index; PBF, percentage of body fat; FM, fat mass; WHR, waist hip ratio; WC, waist circumference. Models were adjusted for age, sex, drink, smoke, father education, mother education, family type, family economic and recent adolescent self−rating life events.

      Table S7.  Association of different types of child maltreatment with obesity indicators by type of obesity.

      CM EA PA SA EN PN
      β (99%CI) P β (99%CI) P β (99%CI) P β (99%CI) P β (99%CI) P
      VFA
      Normal 3.686 (−18.630,26.002) 0.668 −7.805 (−34.715,19.105) 0.452 −14.910 (−49.771,19.951) 0.268 −0.502 (−25.757,24.753) 0.959 −14.082 (−38.392,10.228) 0.134
      Obese/
      overweight
      −12.225 (−68.104,43.665) 0.558 −12.252 (−75.811,51.307) 0.605 −9.806 (−88.179,68.567) 0.737 −10.994 (−86.954,64.965) 0.698 1.982 (−62.264,67.228) 0.935
      BMI
      Normal 1.126 (−0.907,3.159) 0.152 0.162 (−2.303,2.627) 0.865 −2.213 (−5.388,0.961) 0.071 0.850 (−1.456,3.156) 0.339 −0.590 (−2.823,1.643) 0.493
      Obese/
      overweight
      −0.061 (−6.184,6.062) 0.979 −3.724 (−10.503,3.054) 0.145 −2.791 (−11.273,5.692) 0.379 −1.954 (−10.216,6.309) 0.527 −0.787 (−7.899,6.325) 0.767
      PBF
      Normal 2.135 (−3.313,7.583) 0.310 −1.619 (−8.203,4.966) 0.524 −2.265 (−10.807,6.276) 0.491 0.994 (−5.181,7.169) 0.676 −2.021 (−7.987,3.944) 0.380
      Obese/
      overweight
      1.322 (−8.190,10.835) 0.709 0.459 (−10.368,11.286) 0.909 1.751 (−11.555,15.058) 0.724 1.988 (−10.907,14.883) 0.679 3.759 (−7.207,14.725) 0.360
      FM
      Normal 1.796 (−2.657,6.248) 0.296 −0.802 (−6.188,4.583) 0.699 −2.460 (−9.436,4.516) 0.360 0.823 (−4.225,5.870) 0.672 −2.129 (−7.000,2.742) 0.257
      Obese/
      overweight
      −1.921 (−14.258,10.416) 0.676 −2.451 (−16.462,11.560) 0.639 −2.850 (−20.099,14.399) 0.658 −1.662 (−18.414,15.090) 0.790 2.144 (−12.203,16.492) 0.689
      WC
      Normal 1.807 (−4.312,7.926) 0.444 −0.211 (−7.606,7.184) 0.941 −2.250 (−11.837,7.336) 0.543 0.755 (−6.175,7.685) 0.777 −3.260 (−9.942,3.422) 0.206
      Obese/
      overweight
      −2.946 (−17.968,12.077) 0.599 −4.719 (−21.732,12.294) 0.458 −3.612 (−24.638,17.415) 0.645 −3.141 (−23.540,17.258) 0.680 2.189 (−15.314,19.692) 0.737
      Hipline
      Normal 1.418 (−3.618,6.455) 0.465 3.414 (−2.643,9.471) 0.145 0.564 (−7.332,8.459) 0.853 1.737 (−3.960,7.433) 0.429 0.285 (−5.234,5.803) 0.894
      Obese/
      overweight
      −2.636 (−14.421,9.150) 0.549 −0.839 (−14.286,12.608) 0.867 −5.571 (−21.959,10.816) 0.364 −2.116 (−18.144,13.9112) 0.723 1.314 (−12.439,15.067) 0.798
      WHR
      Normal 0.007 (−0.048,0.061) 0.750 −0.035 (−0.101,0.030) 0.162 −0.033 (−0.118,0.052) 0.311 −0.006 (−0.067,0.056) 0.813 −0.037 (−0.096,0.022) 0.102
      Obese/
      overweight
      −0.005 (−0.096,0.087) 0.890 −0.040 (−0.143,0.063) 0.300 0.015 (−0.113,0.143) 0.757 −0.012 (−0.136,0.112) 0.798 0.010 (−0.096,0.117) 0.793
      Note: Abbreviations: EA, Emotional abuse; PA, Physical abuse; SA, Sexual abuse; EN, Emotional neglect; PN, Physical neglect; VFA, visceral fat area; BMI, body mass index; PBF, percentage of body fat; FM, fat mass; WHR, waist hip ratio; WC, waist circumference. ASLEC, Adolescent Self−Rating Life Events Checklist. Models were adjusted for age, sex, drink, smoke, father education, mother education, family type, family economic and recent adolescent self−rating life events.

      Figure S2.  Relationship between child maltreatment and obesity indicators by sex; abbreviations: EA, Emotional abuse; PA, Physical abuse; SA, Sexual abuse; EN, Emotional neglect; PN, Physical neglect; Models were adjusted for age, sex, drink, smoke, father education, mother education, family type, family economic and recent adolescent self-rating life events.

      Figure S3.  Relationship between child maltreatment and obesity indicators by sex; abbreviations: EA, Emotional abuse; PA, Physical abuse; SA, Sexual abuse; EN, Emotional neglect; PN, Physical neglect; Models were adjusted for age, sex, drink, smoke, father education, mother education, family type, family economic and recent adolescent self-rating life events. (A two-sided P value of ≤ 0.05 was considered statistically significant).

      Figure S4.  Language editing and polishing proof

参考文献 (10)

目录

    /

    返回文章
    返回