

 下载:
下载:


-
Extreme air temperature and increased weather oscillations caused by climate change have been threatening global health. Meteorological conditions are external inducers that may trigger the onset of gastrointestinal diseases, in addition to bacterial infection or behavioral factors including smoking, alcohol consumption, and hot food consumption[1,2]. The global age-standardised incidence and prevalence of digestive diseases during 1990–2019 showed little to no decrease, with 95,582 and 35,106 cases per 100,000 individuals in 2019, respectively[2]. In China, digestive diseases ranked seven in the disease spectrum of death in 2021, which has maintained an overall rising trend since 2015 (China Health Statistics Yearbook 2022, www.zgtjnj.org). The susceptibilities of gastrointestinal diseases to climate alterations and weather changes have gained wide recognition. Higher morbidities of peptic ulcer and gastrointestinal bleeding in winter or during cold weather have been reported in Europe and China[3,4]. However, quantitative evidence on the effects of universal temperature indicators, obtained from routine monitoring, is still very limited. The daily minimum temperature (Tmin) reveals the effects of the coldest climate condition in a day instead of the 24-hour means. To large extent, it represents the coldest thermal stress. Further, weather instability or temperature fluctuation could be another trigger for gastrointestinal diseases. It has been shown that the diurnal temperature range (DTR) added an additional risk of multiple chronic diseases[5]. Large temperature variations may also lead to a decrease in digestive function, the abnormal secretion of digestive enzymes, as well as decreased human immunity. However, the quantitative evidence on relations between DTR and digestive morbidity was insufficient, particularly in northwest China. As the capital of Gansu Province, Lanzhou is on the Loess Plateau and has a semi-arid continental climate, with distinct seasons and prominent weather changes. Therefore, the objectives of the current study were: i) explore the exposure-response associations between digestive risk and typical temperature indicators (Tmin and DTR) in Lanzhou, Gansu; ii) compare temperature effects in the warm (April to September) and cold (October to March) seasons; and iii) investigate the synergistic effects of Tmin and DTR.
Daily data on hospitalizations for digestive disease from March 1, 2016 to May 1, 2021, were collected from the Lanzhou First People’s Hospital, which covered all records in the Department of Gastroenterology and the Department of Infectious Diseases. The admission date, age, sex, and primary diagnosis were obtained, and a continuous time-series of daily admissions was established. Patients with incomplete data and those who lived outside Lanzhou were excluded. For quality control, logical checks were implemented in the medical data to identify data entry errors and missing information. A total of 10,944 cases classified by the tenth revision of the International Classification of Diseases (K00-K93) were analyzed. A confidentiality agreement has been signed and submitted to the hospital. The surface meteorological observations of Lanzhou were obtained from the National Meteorological Science Data Center of China (http://data.cma.cn/). In temperate cities, such as Lanzhou, the six months (April - September) dominated by warm temperature were defined as the warm season, and the remaining half-year was defined as the cold season (October - March).
A generalized additive model (GAM) with a quasi-Poisson family of distributions and a distributed-lag nonlinear model (DLNM) were used to estimate temperature effects on digestive risk[6]. First, the model was adjusted for trends by including a counter variable for each day of the time series and a smoothing spline was fitted. As long-term trends were usually controlled with seven degrees of freedom (df) per year, three df for time was selected in each half-year. Holidays and day of the week (DOW) were marked by dummy categorical variables. Second, the cross-basis functions of Tmin and DTR were built by the DLNMs, a natural cubic spline was employed for daily Tmin and DTR (df = 4), and a polynomial spline (df = 4) was used to capture their lag effects. The maximum lags of Tmin and DTR were set to 14 d and 10 d in the warm season, respectively, to capture all the effects and achieve maximum model stability. Meanwhile, the lags of Tmin and DTR in the cold season were adjusted to 20 d and 14 d, respectively. Given the potential impacts on human physiology, confounders including relative humidity and wind speed were controlled in the GAMs through the fitting of spline functions (df = 4). To avoid collinearity among climate variables, their correlation coefficients were checked before being adopted in the models (Supplementary Table S1, available in www.besjournal.com). Finally, non-parametric binary models were built to explore the co-effects of Tmin and DTR. Tmin was smoothed on varied lags (0–3 d, 0–6 d, and 0–9 d) to capture its lag effects. Relative risk (RR) was defined as the risk of onset caused by a unit change in Tmin (or DTR), relative to its reference value, along with 95% confidence intervals. R 3.6.1 software (http://www.r-project.org) was used for model fitting. The “mgcv” and “dlnm” packages in R were used.
Table S1. The correlation coefficients among meteorological factors
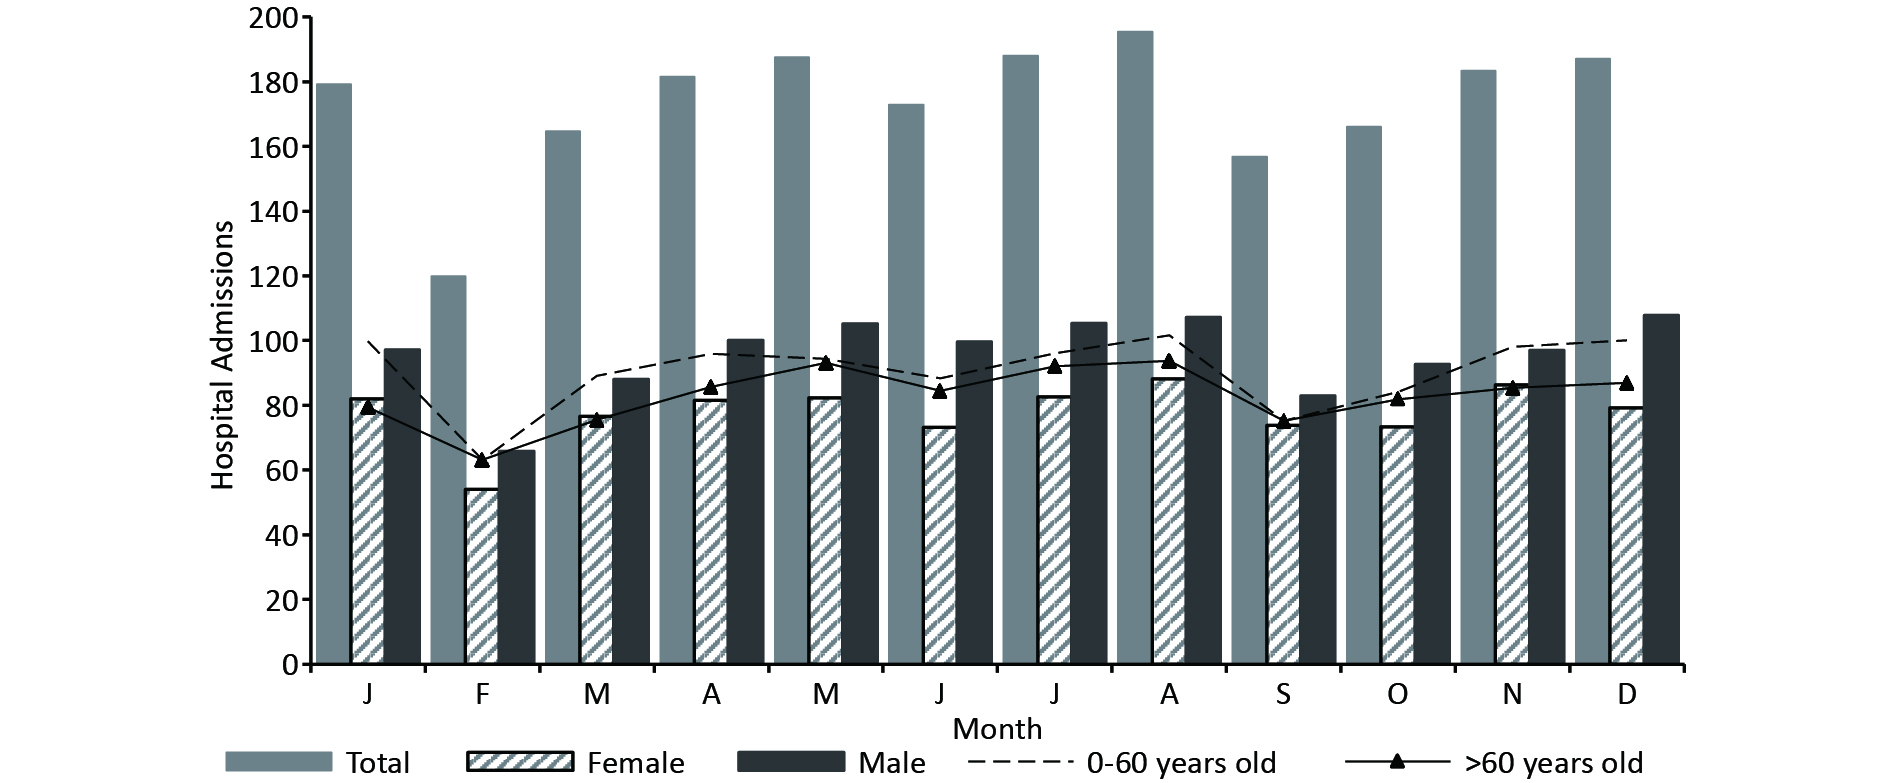
Variables Diurnal temperature range Vapor pressure Relative humidity Wind velocity Atmospheric pressure Mean temperature R 0.180** 0.820** −0.016 0.242** −0.926** P 0.000 0.000 0.314 0.000 0.000 Maximum temperature R 0.411** 0.740** −0.111** 0.175** −0.903** P 0.000 0.000 0.000 0.000 0.000 Minimum temperature R −0.027 0.871** 0.112** 0.255** −0.884** P 0.244 0.000 0.000 0.000 0.000 Note. R, correlation coefficient; P, the significance level. The number of patients admitted daily ranged from 0 to 25, with a mean of 5.8. There were more males than females (1.23 vs. 1) (Supplementary Table S2, available in www.besjournal.com). The annual mean temperature in Lanzhou was 11.4 °C, with an annual variety up to 42 °C (-12.4 °C–30.8 °C). In this plateau-valley city, the mean DTR was large (11.3 °C), mean humidity was moderately low (48.3%), and mean wind speed was low (1.1 m/s). There were more morbidities from November to January and from April to August, while there were lower admission rates in February and September (Supplementary Figure S1, available in www.besjournal.com). The lowest hospitalisation rate in February, was probably due to the Chinese Spring Festival and the return of migrant workers[7]. The complex pathogenesis of digestive disease and non-meteorological confounders may also contribute to the insignificant seasonal variations[3].
Table S2. Descriptive statistics of hospital admissions for digestive disease and meteorological variables in Lanzhou, China, from March 1, 2016 to May 1, 2021
Statistical variables x s Min P10 P25 P50 P75 P90 Max Total 5.8 4.8 0.0 1.0 2.0 5.0 9.0 12.6 25.0 0−60 years 3.0 2.8 0.0 0.0 1.0 2.0 5.0 7.0 14.0 > 60 years 2.8 2.6 0.0 0.0 1.0 2.0 4.0 6.0 14.0 Male 3.2 2.9 0.0 0.0 1.0 3.0 5.0 7.0 18.0 Female 2.6 2.4 0.0 0.0 1.0 2.0 4.0 6.0 14.0 Mean temperature (°C) 11.4 9.8 −12.4 −2.6 2.7 12.6 19.9 23.6 30.8 Maximum temperature (°C) 17.7 10.2 −7.6 3.2 9.1 18.9 26.2 30.7 37.7 Minimum temperature (°C) 6.4 9.3 −15.7 −6.8 −1.5 7.2 14.1 18.1 25.4 Diurnal temperature range (°C) 11.3 4.4 0.9 5.3 8.0 11.4 14.4 17.2 25.8 Wind velocity (m/s) 1.1 0.4 0.0 0.7 1.0 1.0 1.3 1.5 3.2 Vapor pressure (hPa) 7.7 5.1 0.7 2.1 3.1 6.4 11.4 15.5 21.7 Relative humidity (%) 48.3 16.0 11.0 27.4 35.7 48.1 59.8 69.7 95.8 Sea surface pressure (hPa) 1012.7 48.6 0.0 999.0 1005.8 1015.8 1024.8 1031.4 1044.8 Note. x, the mean; s, the standard deviation. P10, P25, P50, P75, and P90 represent the 10th, 25th, 50th, 75th, and 90th percentiles, respectively. 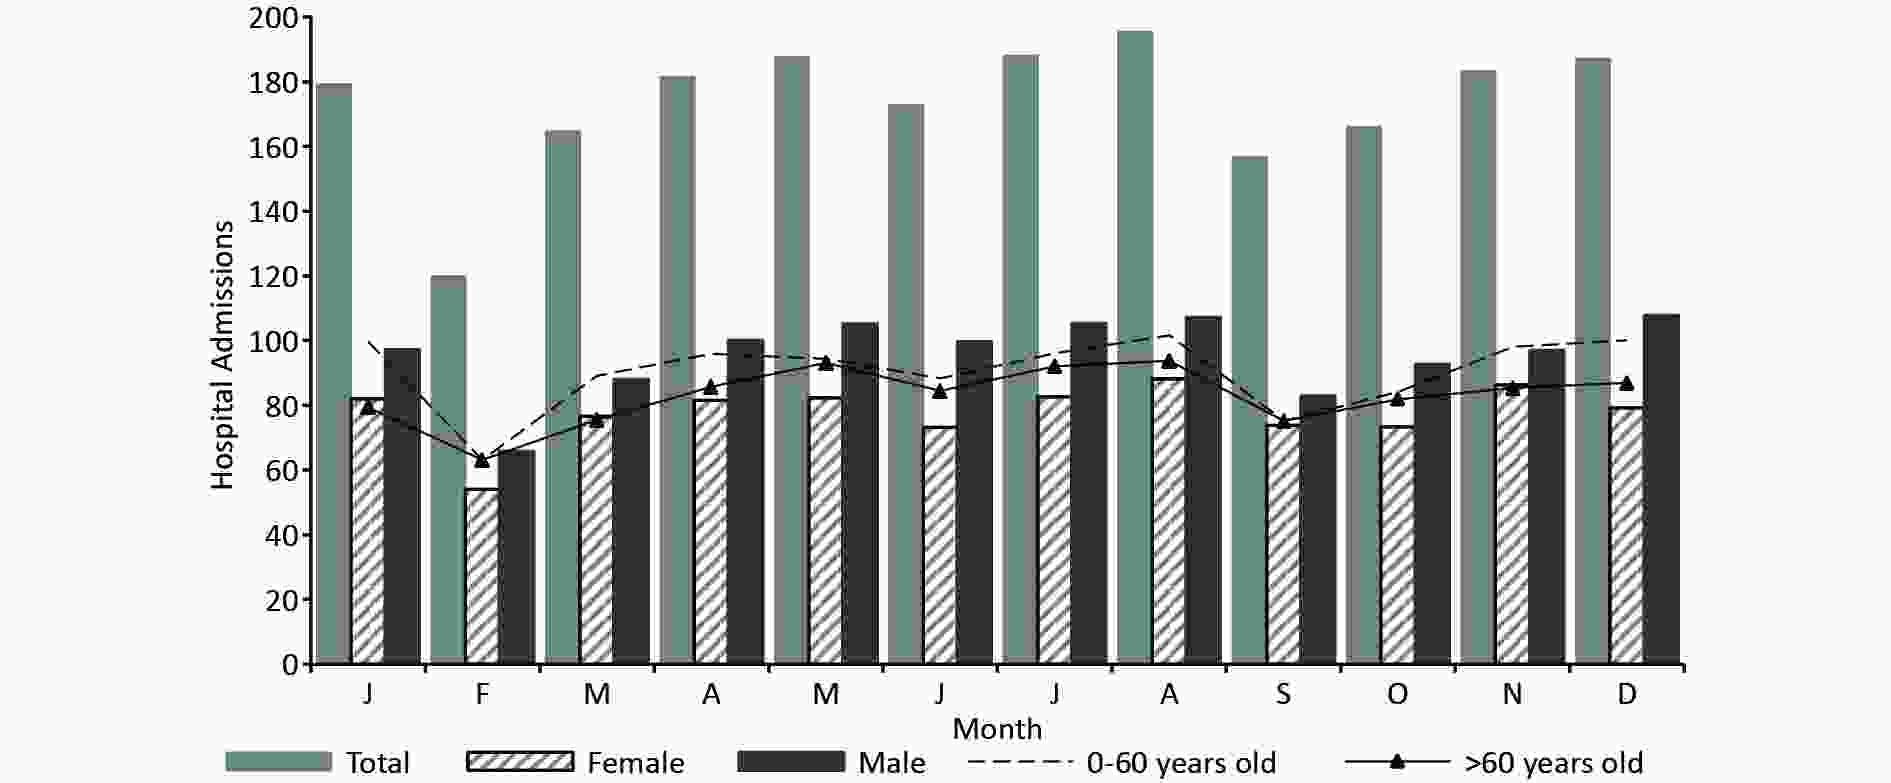
Figure S1. The seasonal distribution of hospitalized patients suffering from digestive diseases in Lanzhou, China, from March 1, 2016 to May 1, 2021.
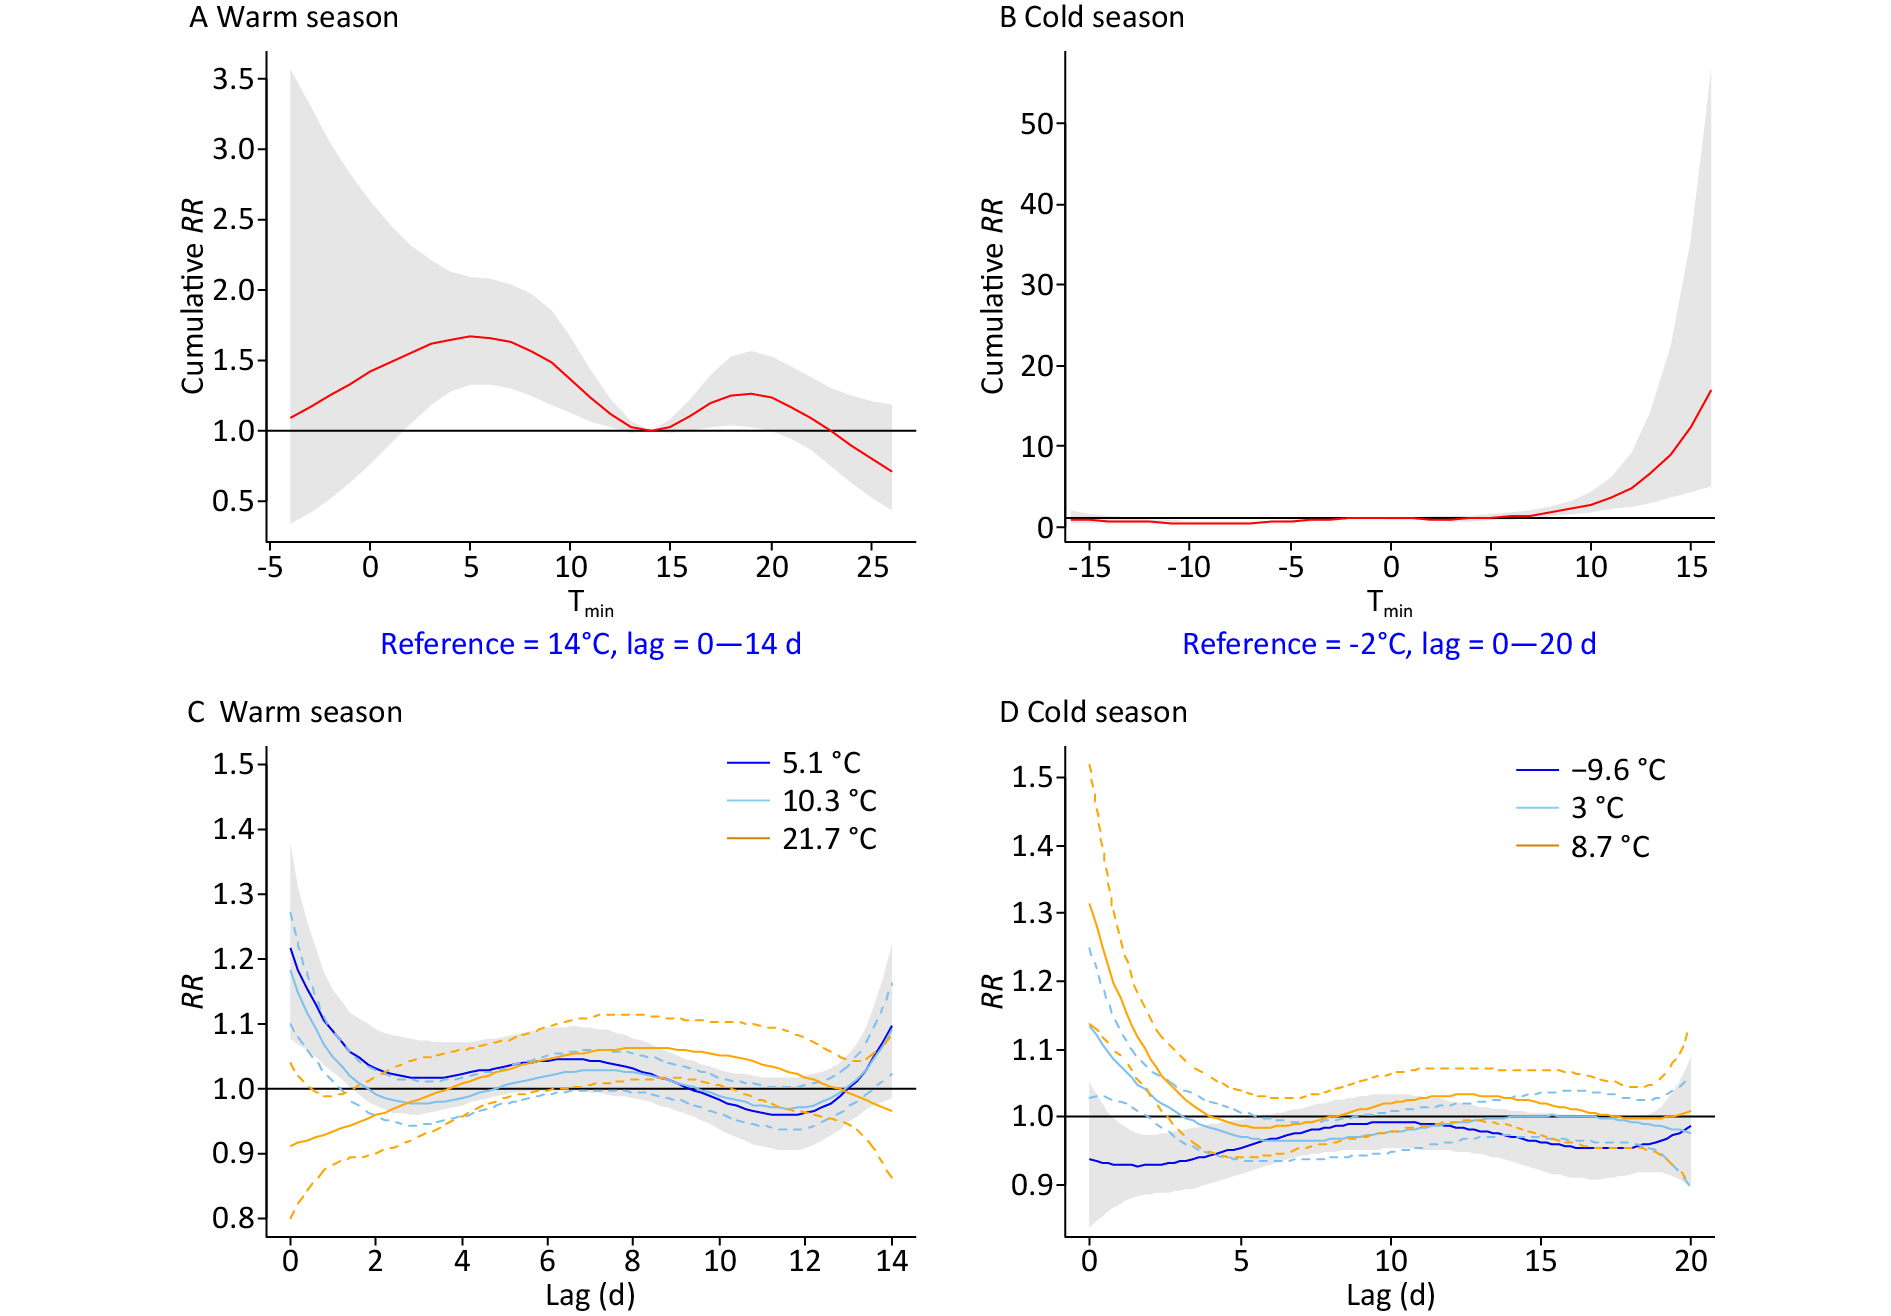
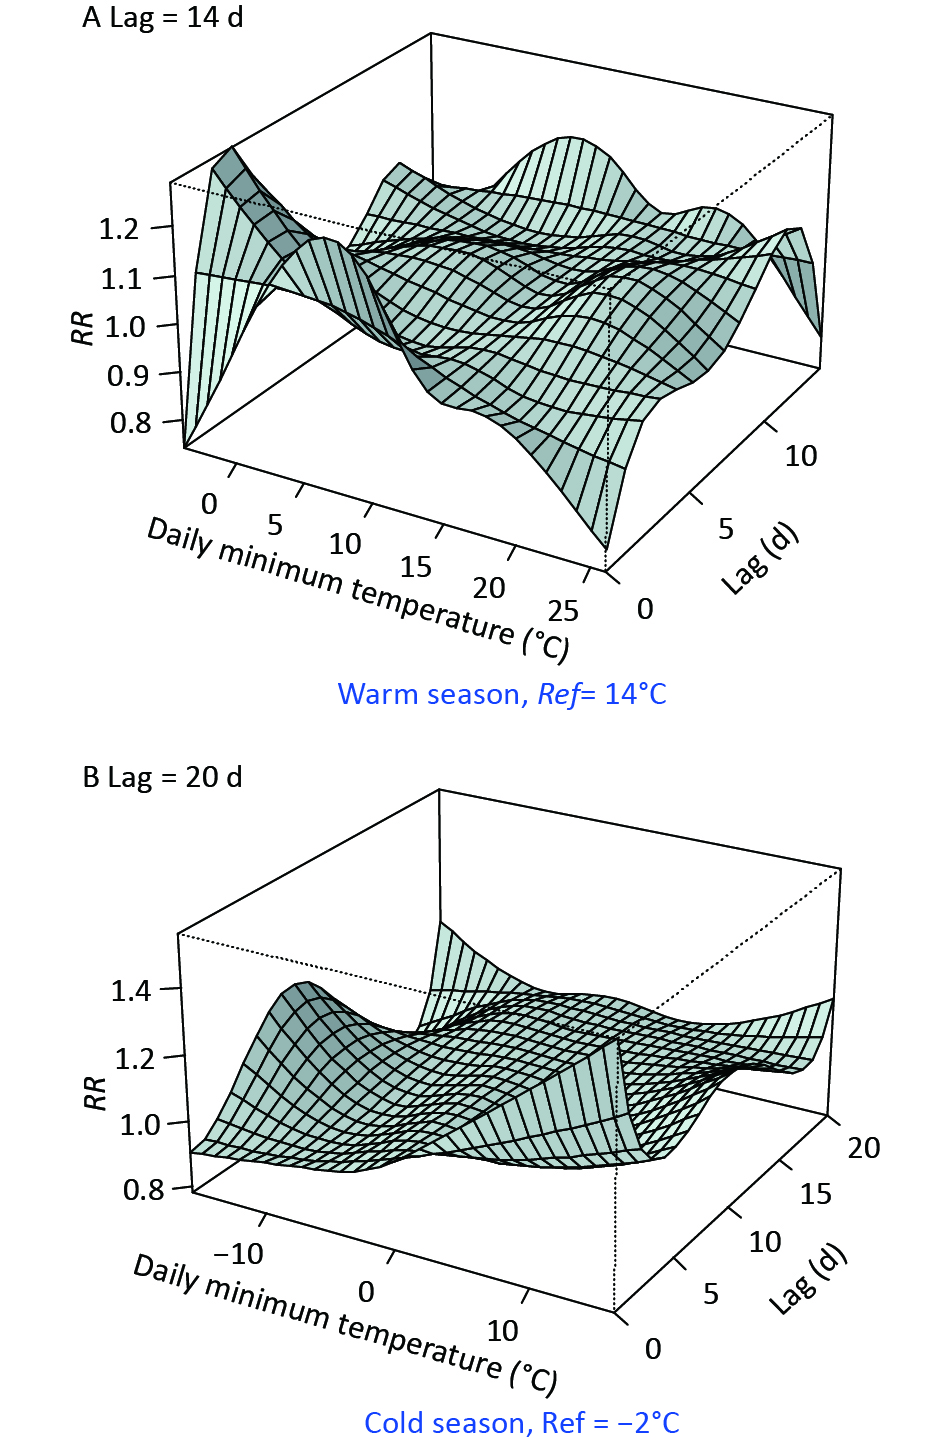
Figure 1 and Supplementary Table S3 (available in www.besjournal.com) show the comparison of temperature effects under opposite background climates, by typical percentiles of Tmin. Tmin ranged from -4 °C–26 °C and -16 °C–16 °C in the warm and cold seasons, respectively. Supplementary Figure S2 (available in www.besjournal.com) displays the detailed three-dimensional Tmin-morbidity associations. The cumulative RR was bimodal in the warm season, with the highest digestive risks occurring at 3 °C–10 °C and 17 °C–21 °C, respectively (Figure 1A). A strong and immediate effect was revealed for cold Tmin (e.g., 5.1 °C, P5), while a delayed effect of high Tmin (21.7 °C, P95) was found (Figure 1C, Supplementary Table S3). In the cold season, an unexpected higher risk at warm Tmin was found (Figure 1B), which was inconsistent with previous studies[3,4]. Besides, prominently high RRs were observed for moderate (3 °C, P75) and relatively high (8.7 °C, P95) temperatures (Figure 1D, Supplementary Table S3). In northwest China, the sudden enhancement and northward movement of warm air masses, is common in spring and autumn. Abnormal warming processes could lead to increased superficial blood circulation, weak gastrointestinal peristalsis, and reduced secretion of gastric juice[8,9]. Increased water demand may also dilute stomach acid and lead to indigestion. We previously revealed high-temperature effects on the number of emergency room visits for digestive disease in Beijing[9]. The low humidity of inland Lanzhou may effectively reduce the heat stress of hotter weather.
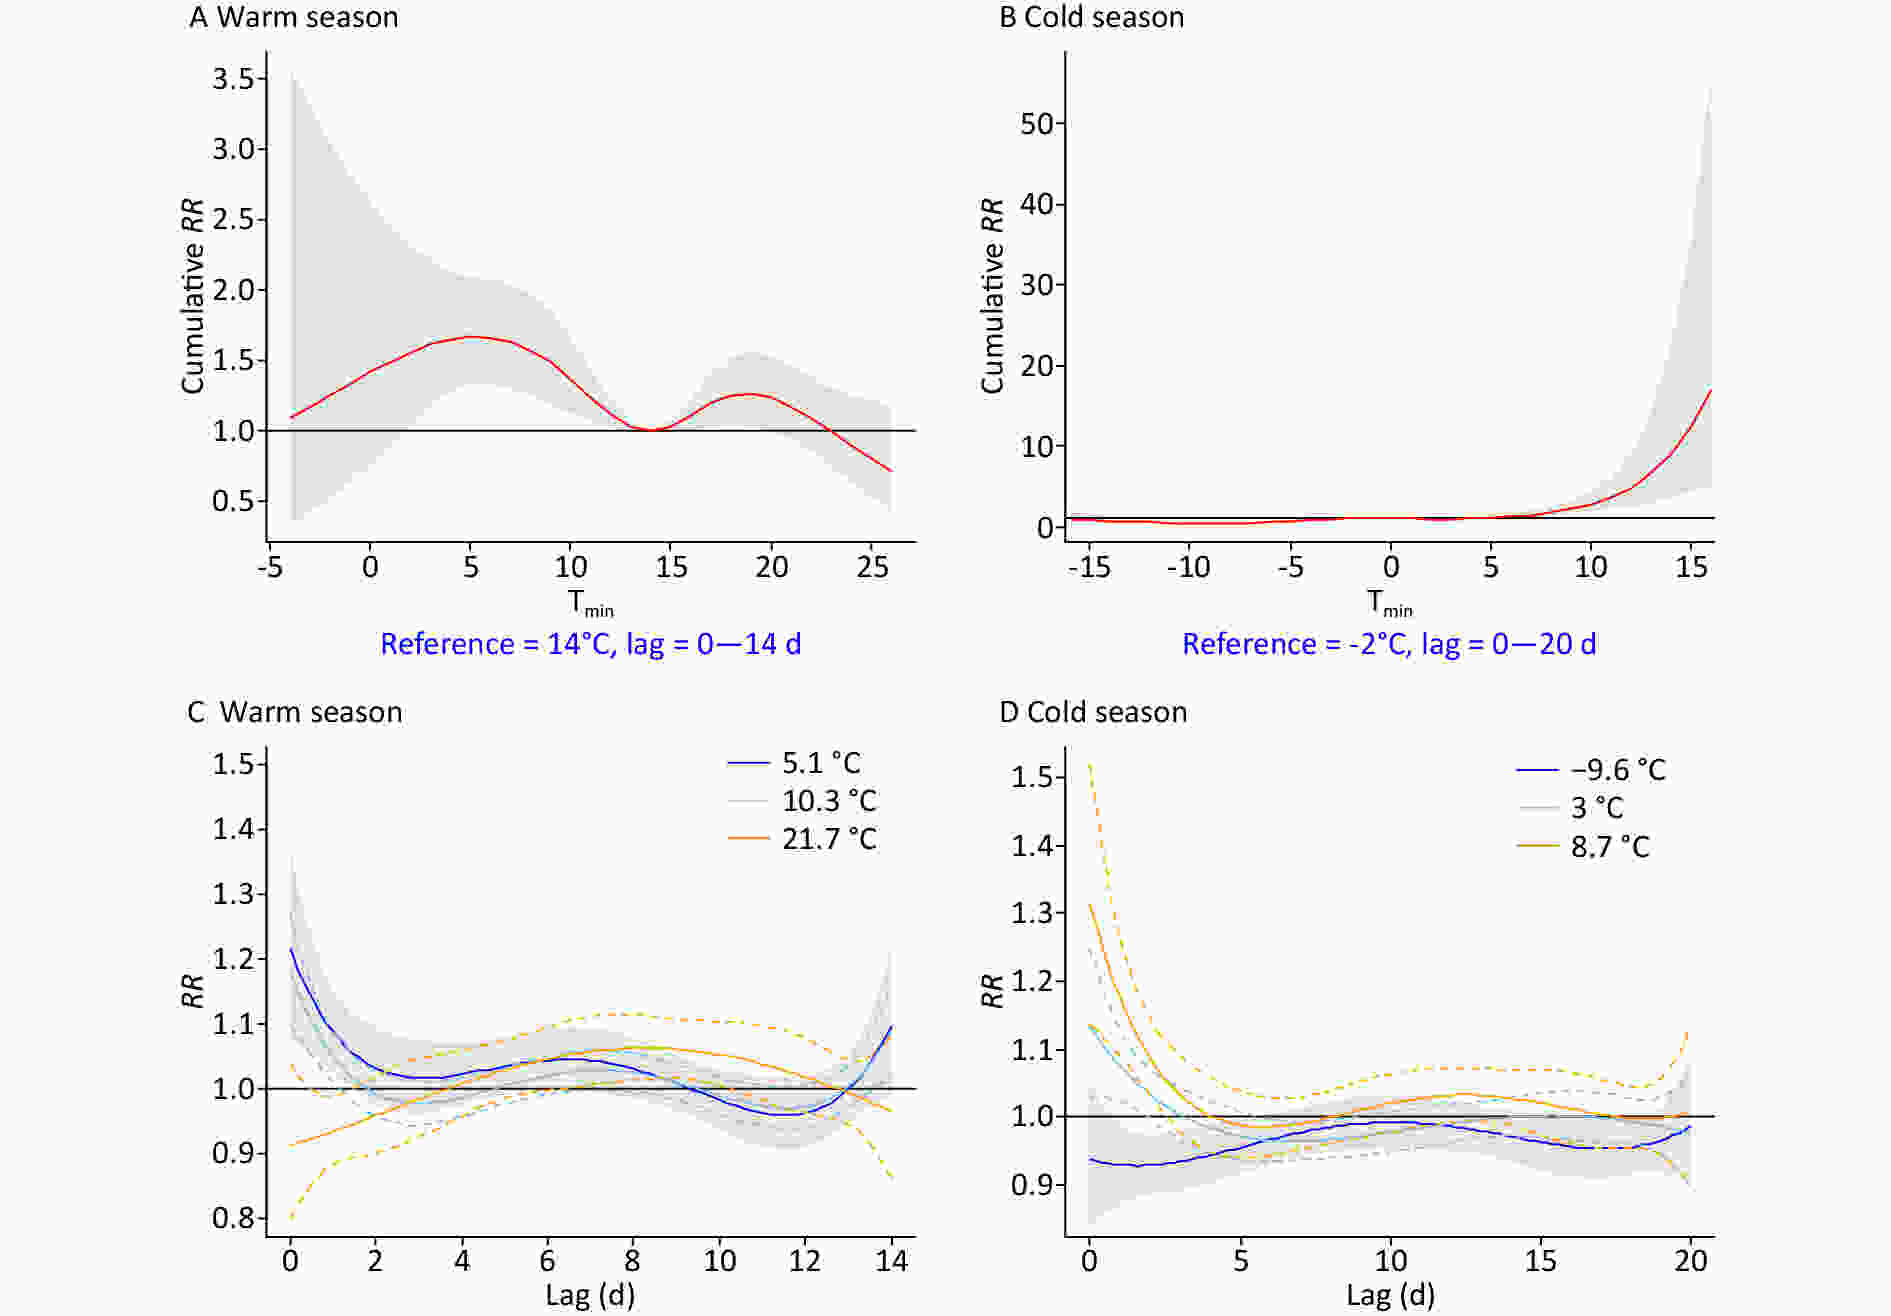
Figure 1. The overall and specific effects of the daily minimum temperature (Tmin) on digestive morbidity under opposite climate backgrounds. P5, P25, and P95 in the warm season, P5, P75, and P95 in the cold season were selected, respectively. RR, relative risk.
Before or after the period when central heating is used, frequent weather changes accompanied by significant cooling, might explain the increased risk at moderately low Tmin. Physiologically, cold stimulation could excite the sympathetic nervous system, increase the secretion of catecholamines, cause constriction of peripheral blood vessels in the abdominal organs and the skin, and reduce the secretory functions of the digestive glands[3,4,10]. Nonetheless, the effects of extremely low Tmin were significantly reduced by the use of central heating (from October to March), the climate adaptability of the human body, reduced outdoor exposure, and the limited stability of the model under severe conditions[9].
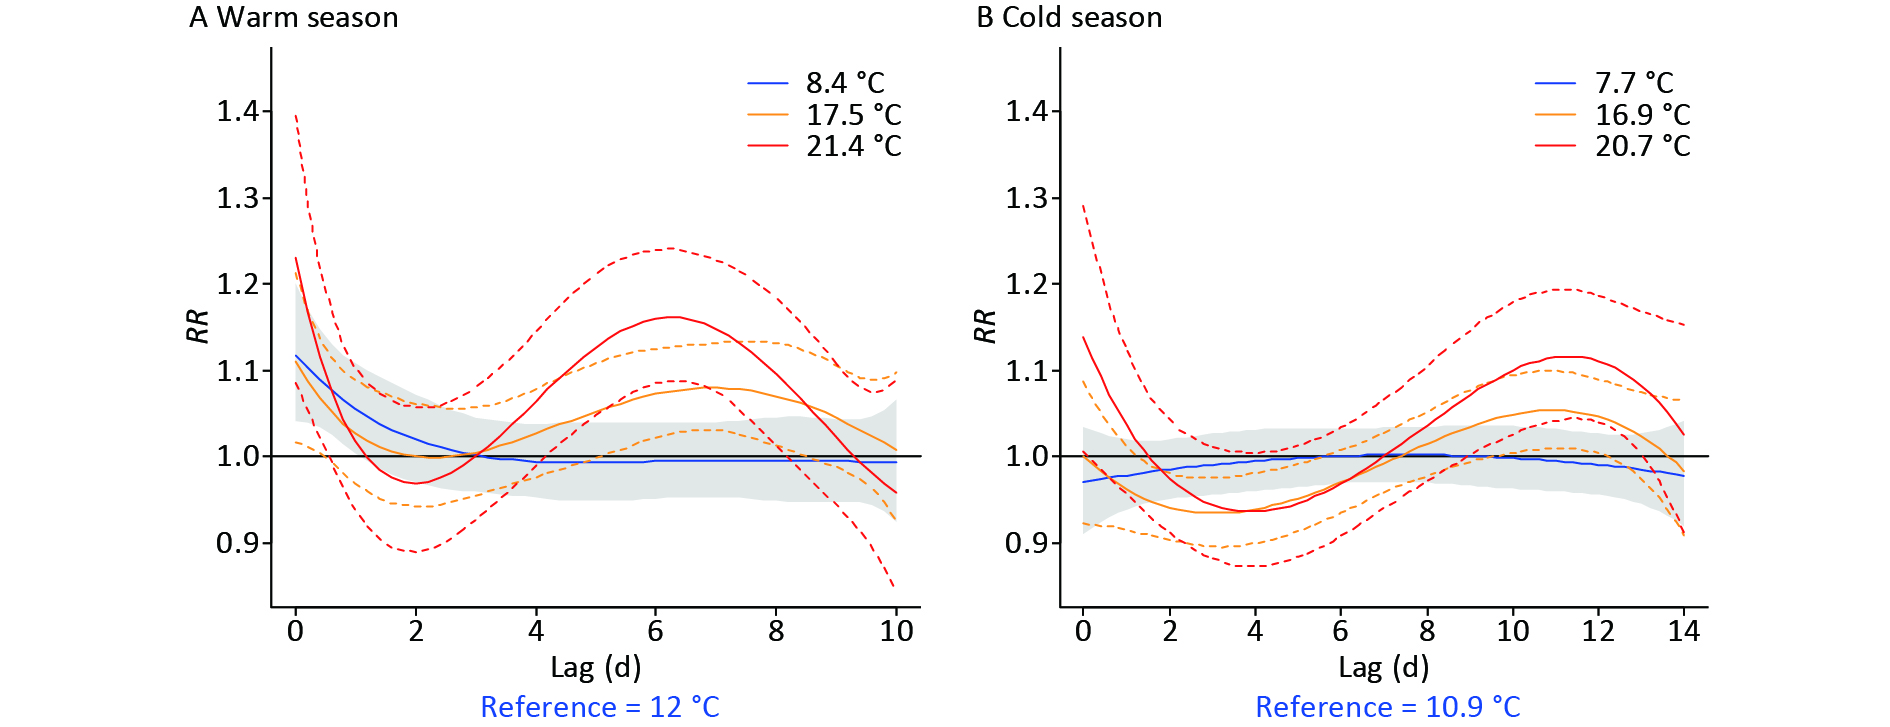
Figure 2 shows the effects of small, large, and extreme DTRs (the 25th, 90th, and 99th percentiles) on digestive morbidity, for both half-years. Supplementary Table S4 (available in www.besjournal.com) lists corresponding RRs for specific DTRs. Acute gastrointestinal risks were identified at both minor and major DTRs in the warm season, while weaker and more delayed DTR effects were found in the cold season (Figure 2). Overall, higher DTRs with more severe health impacts were identified in the warm season than in the cold season (Supplementary Table S4).
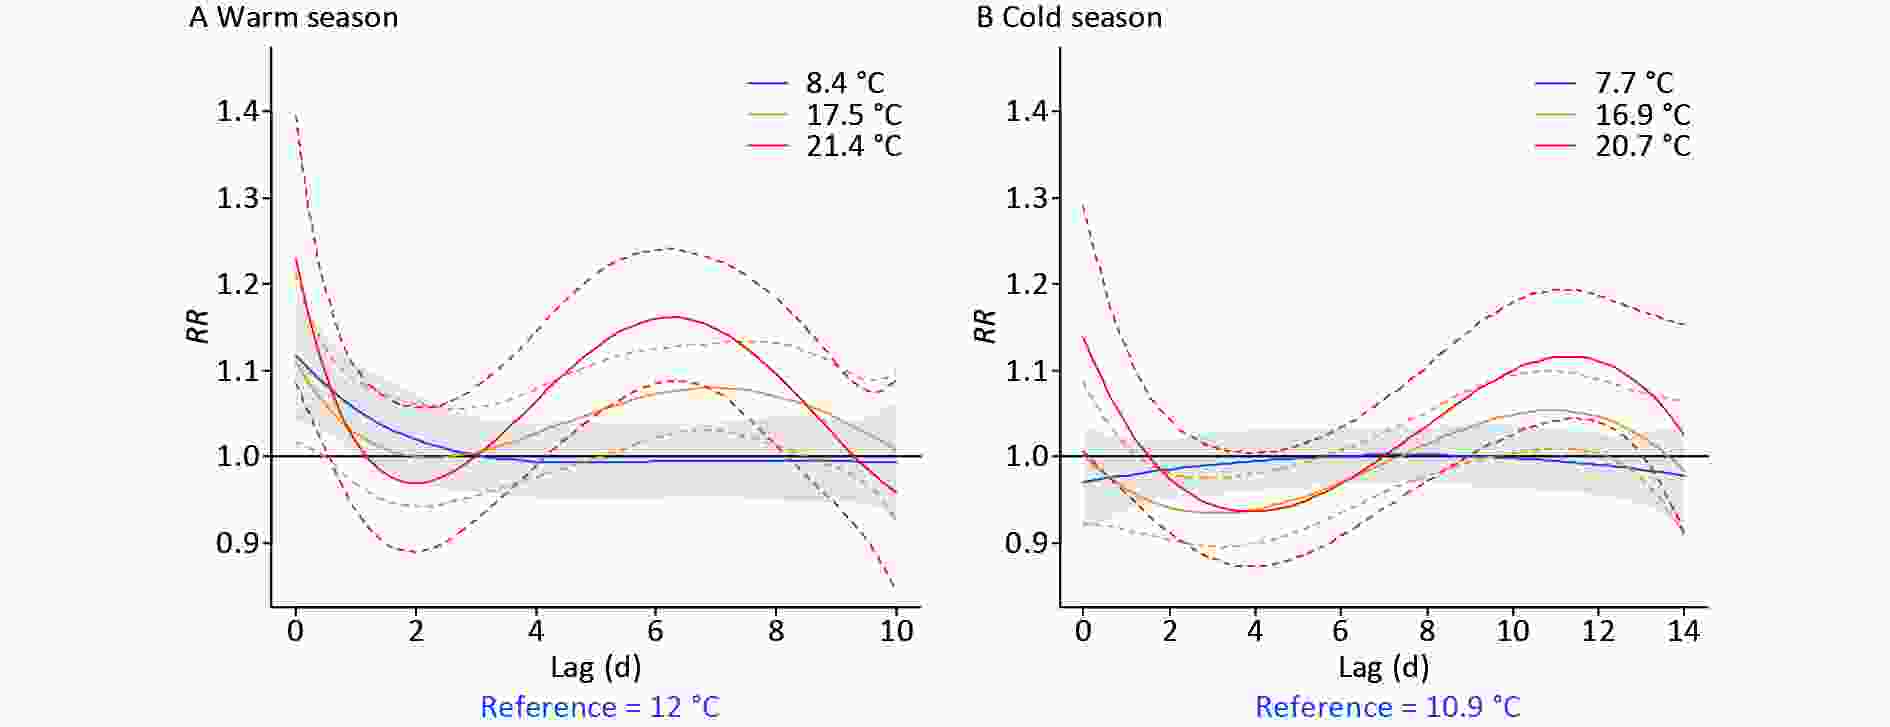
Figure 2. The lag effect of typical percentiles of diurnal temperature range (DTR) (P25, P90, and P99) on digestive morbidity under opposite climate backgrounds. RR, relative risk.
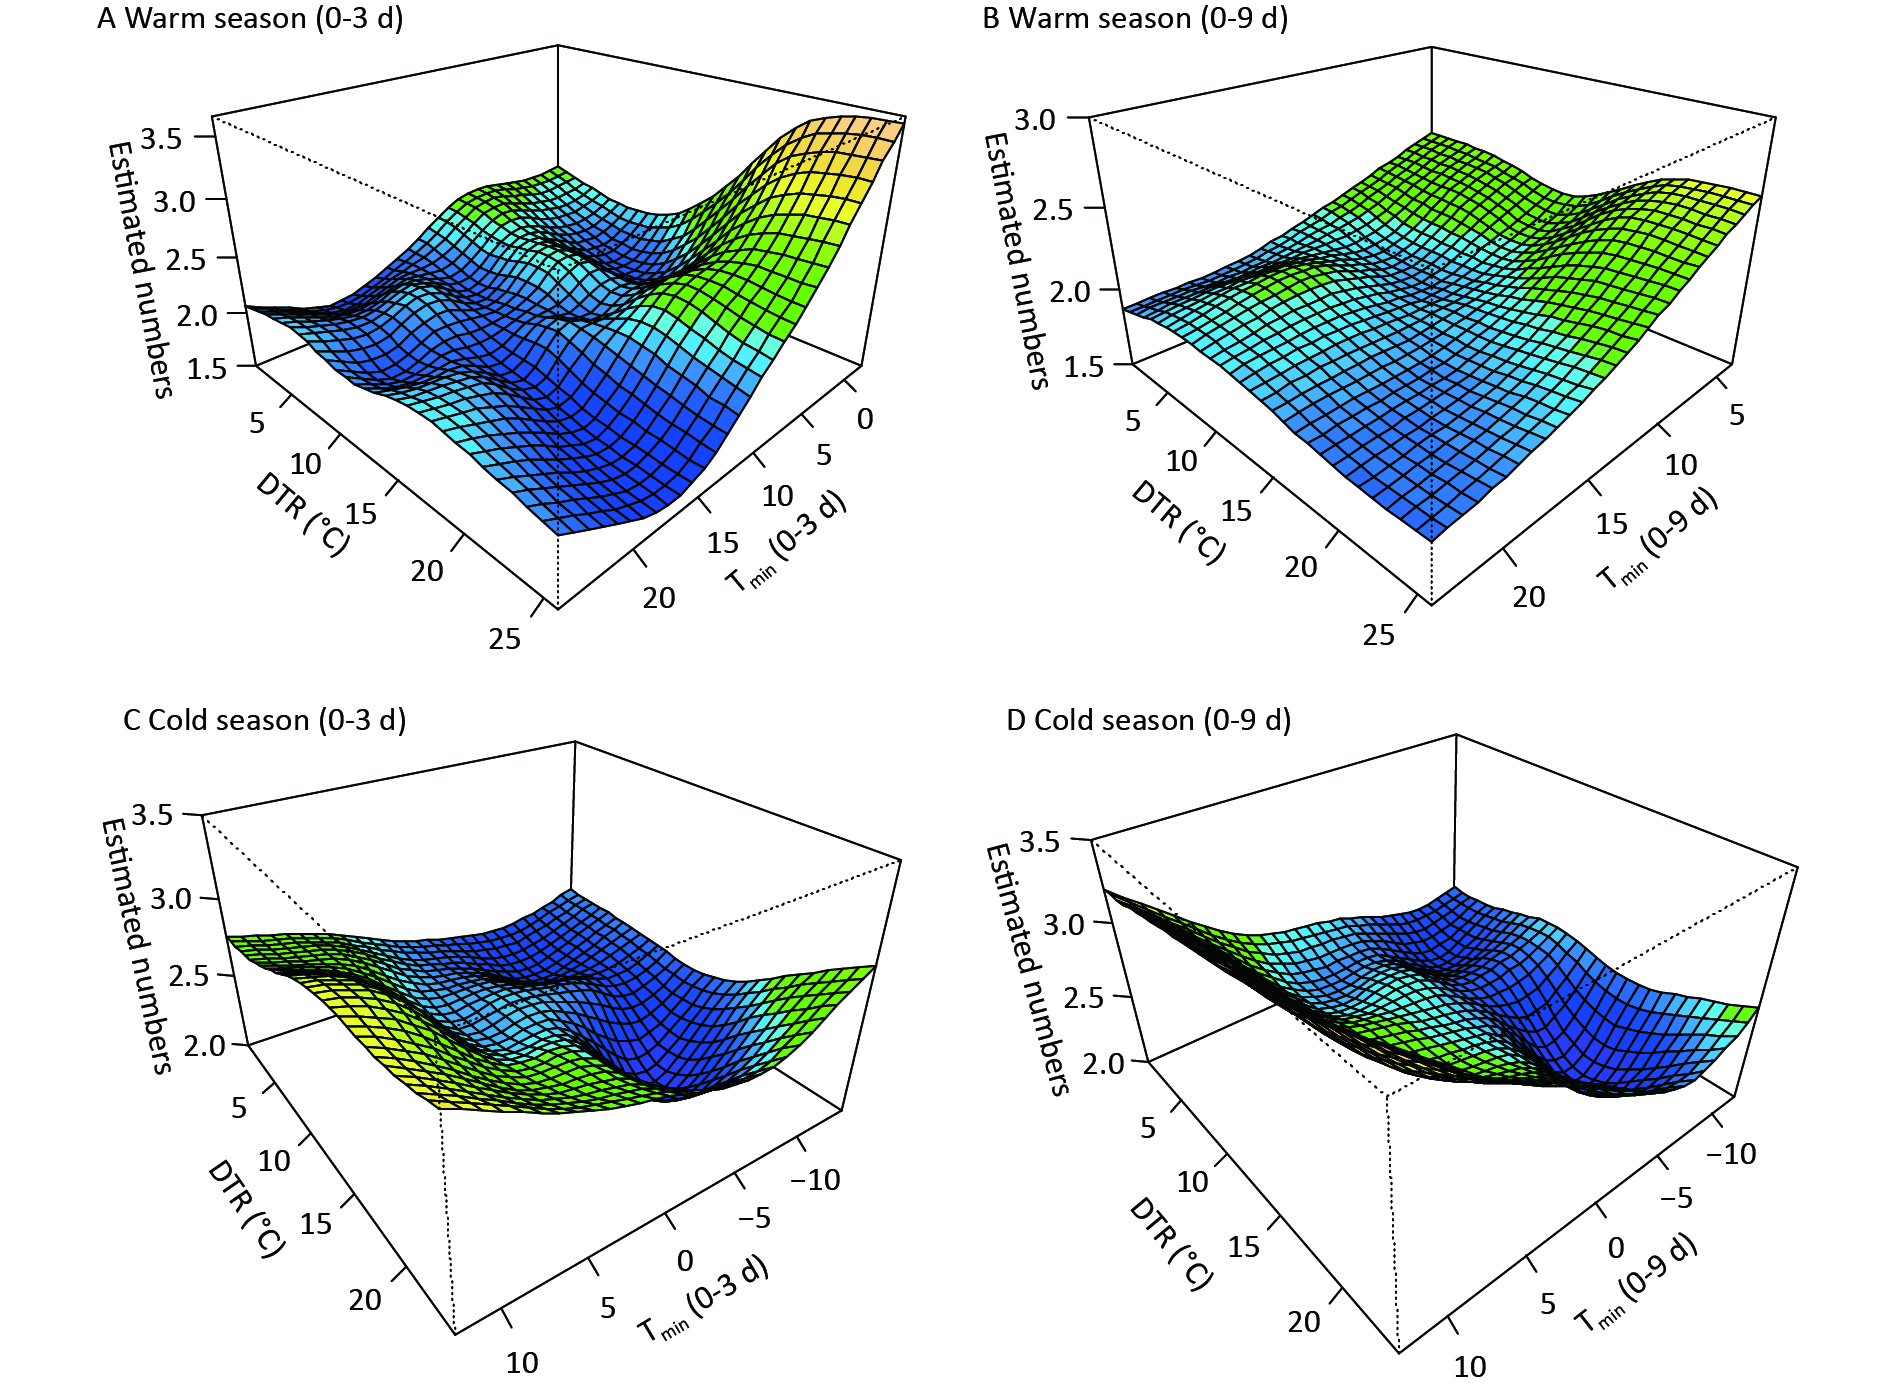
Figure 3 shows the comprehensive effects of two temperature metrics. In the warm season, the coexistence of moderately low Tmin and large DTRs immediately increased digestive morbidity, whereas very low Tmin accompanying by large DTRs induced increased risk at diverse lags (Figure 3, Supplementary Figure S3). This further reflects the persistent effects of low temperature and demonstrates a more dominant effect of Tmin than of DTR. In the cold season, increased risk on lag 0d was observed at low Tmin with high DTRs, while at varied lags, warm Tmin had a strong influence (Figure 3, Supplementary Figure S3). Abnormal warm weather with significant temperature fluctuations generally occurs in transitional periods from autumn to winter. A sharp peak in the mortality of variceal bleeding was also found in early winter in French public hospitals[4]. In the northwest of China, the DTR is generally larger in the transition of seasons than in summer or midwinter, due to the north‒south shift of the subsolar point and intensified activity of air masses. Moreover, due to thinner clouds and shorter atmospheric columns, the influence of solar radiation on surface temperature is stronger on plateaus than on the eastern plain areas. Therefore, a dramatic change in diurnal temperature could amplify the adverse effects of air temperature, thus more targeted preventive measures should be taken to reduce the burden of digestive diseases.
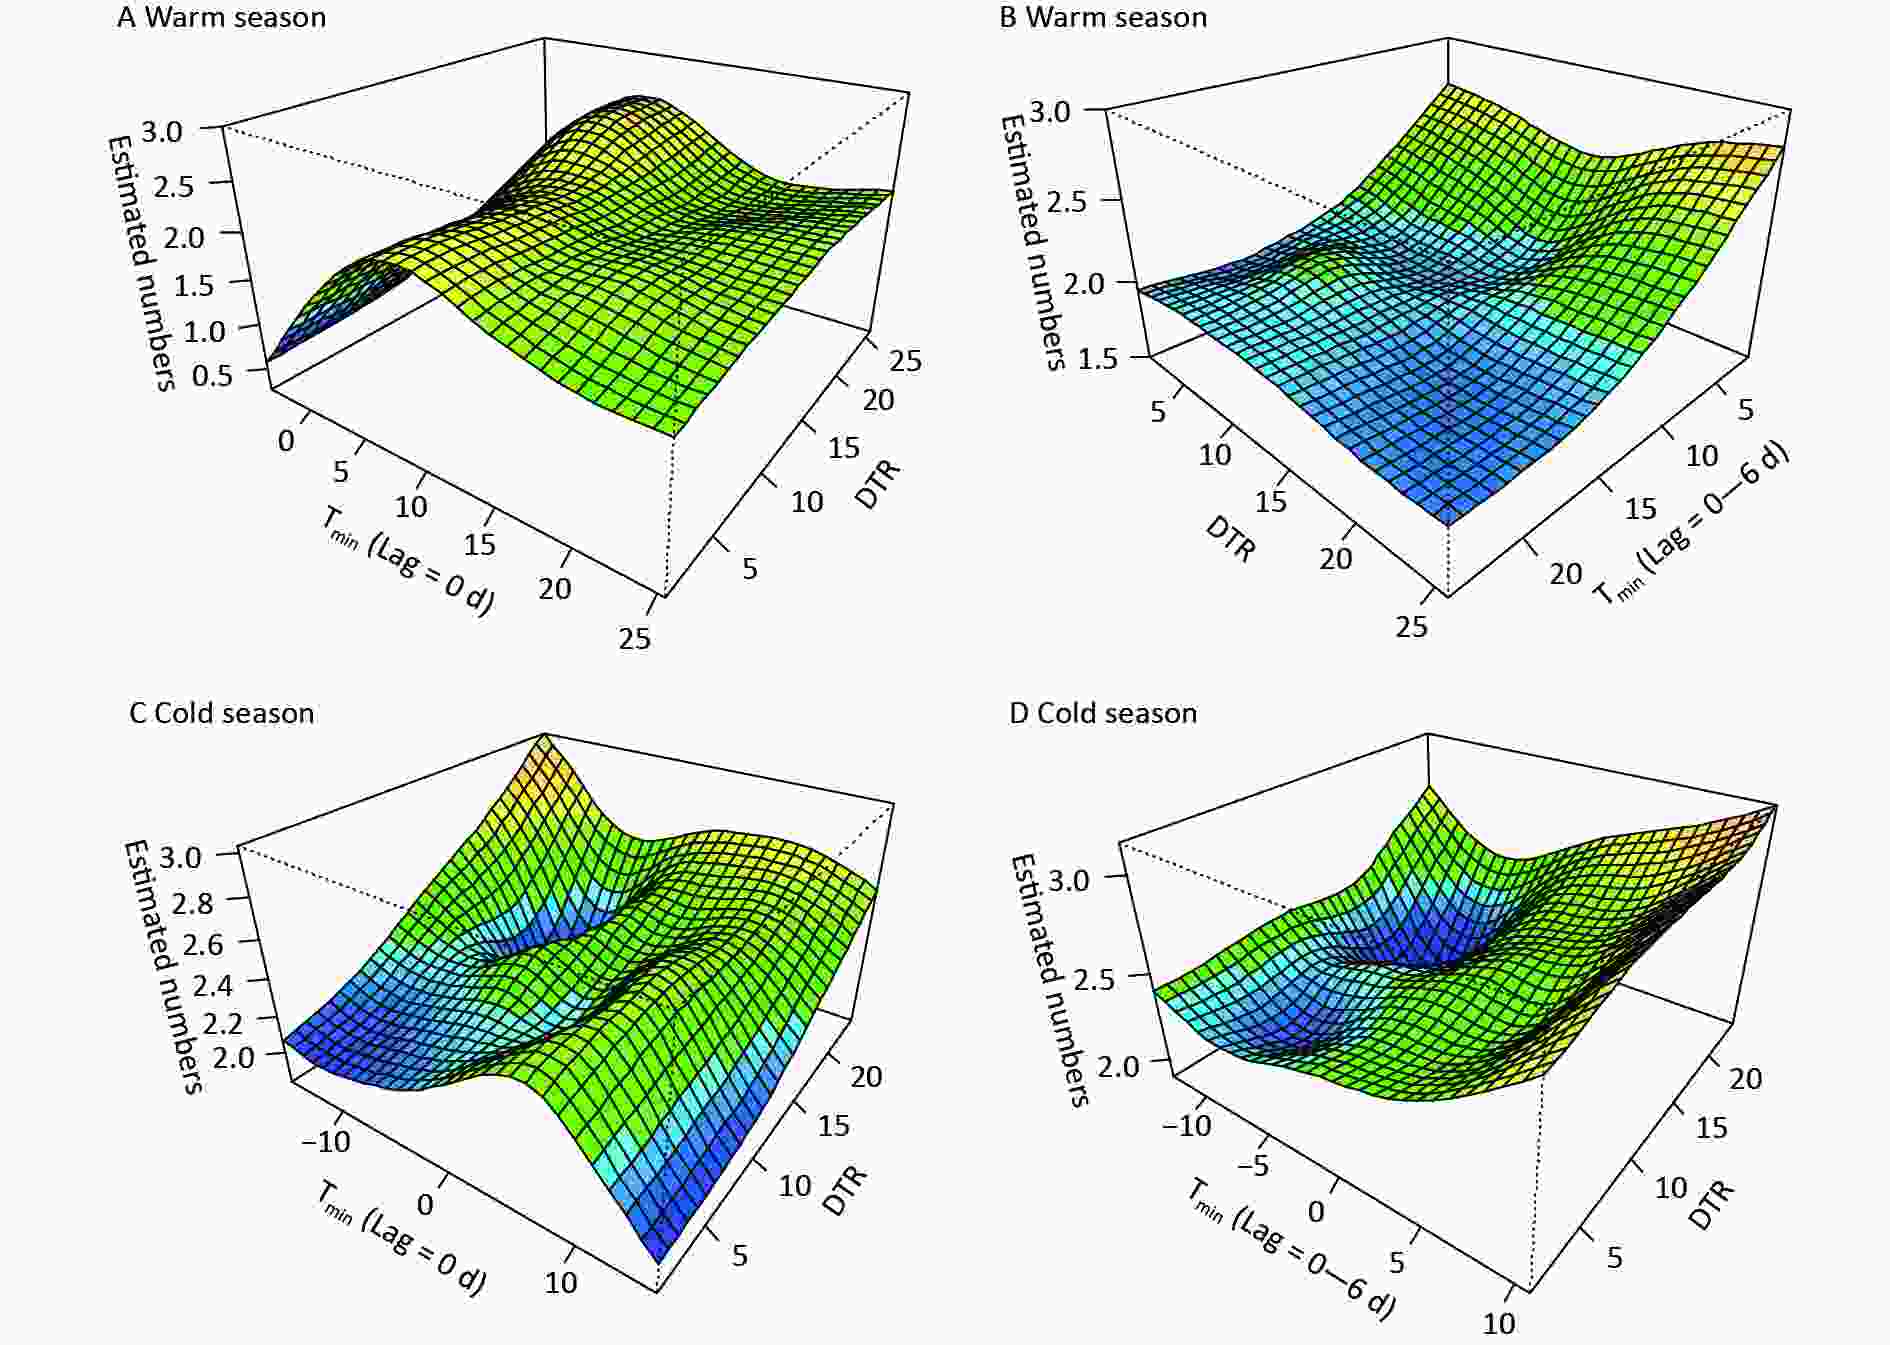
Figure 3. The synergistic effects of the daily minimum temperature (Tmin) and diurnal temperature range (DTR) on digestive risk. (A) and (C) indicate the immediate effects, (B) and (D) refer to the lag (0–6 d) effects of Tmin.
This study offers fresh perspectives on preventing digestive diseases and will enlighten future studies on the impact of climate on health in inland plateau areas. The study has some limitations. First, the collected medical data were confined to one hospital and the population coverage was relatively limited, therefore, the impacts of temperature on morbidity might be biased. Larger sample sizes and further investigations are required to ascertain how generalizable these results are to other regions. Second, the current study specifically explored the influence of daily Tmin and DTR on digestive admissions, but the effect of temperature fluctuations between days was not analysed, which is worthy for further study. Future studies could also examine the effects of temperature on the infection and virulence of Helicobacter pylori, levels of inflammatory factors, hormone secretion, etc. Finally, there might be some deviations between the temperature exposure of individuals and the meteorological data observed at fixed locations.
-
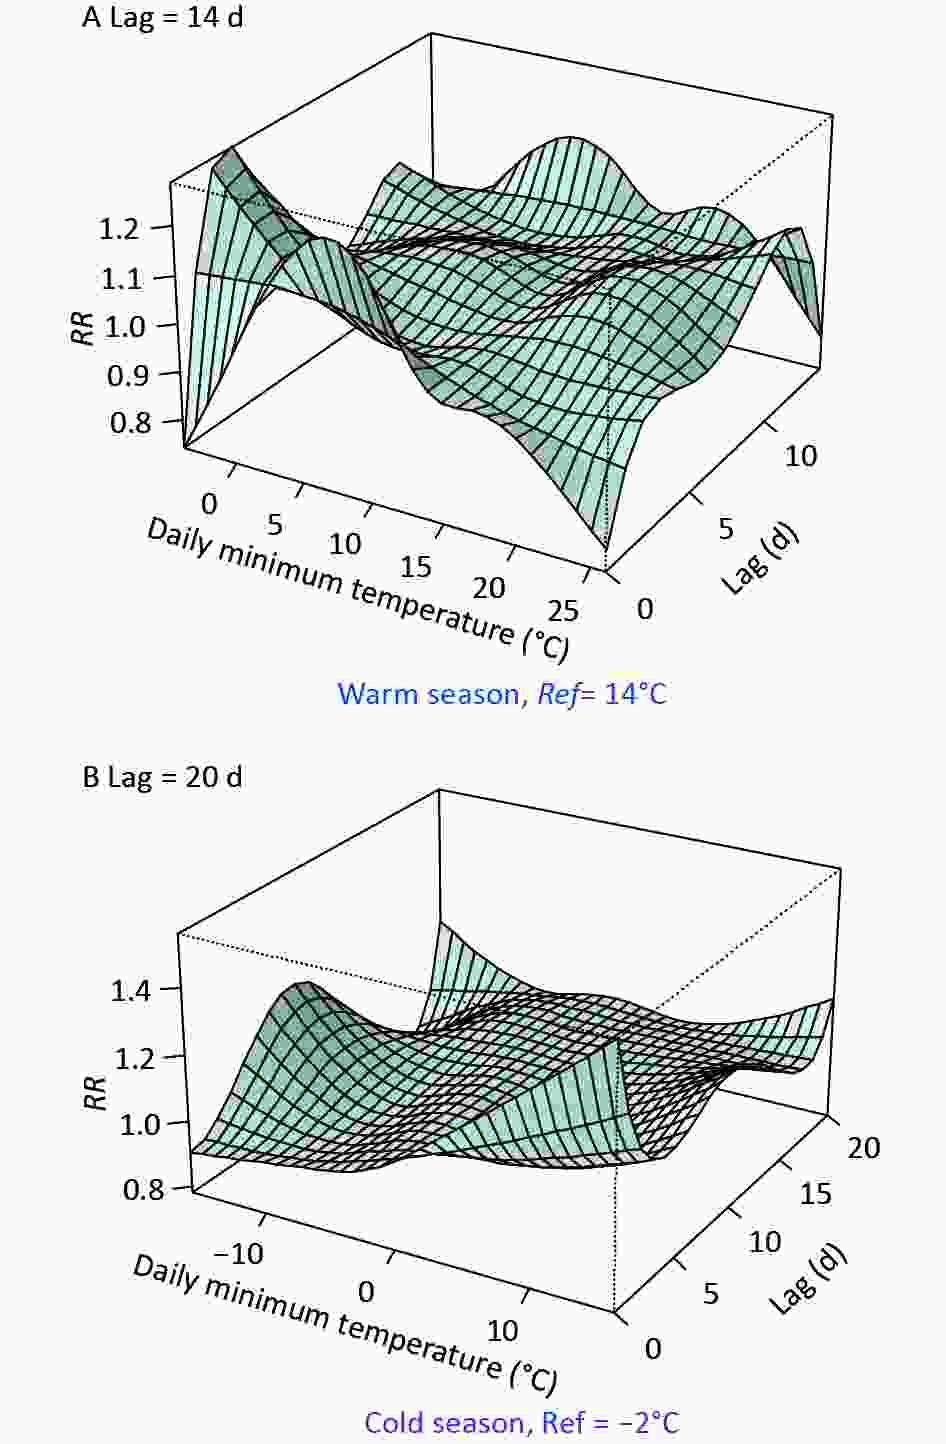
Figure S2. The exposure-lag-response associations between Tmin and digestive disease risk in the (A) warm and (B) cold seasons, respectively.
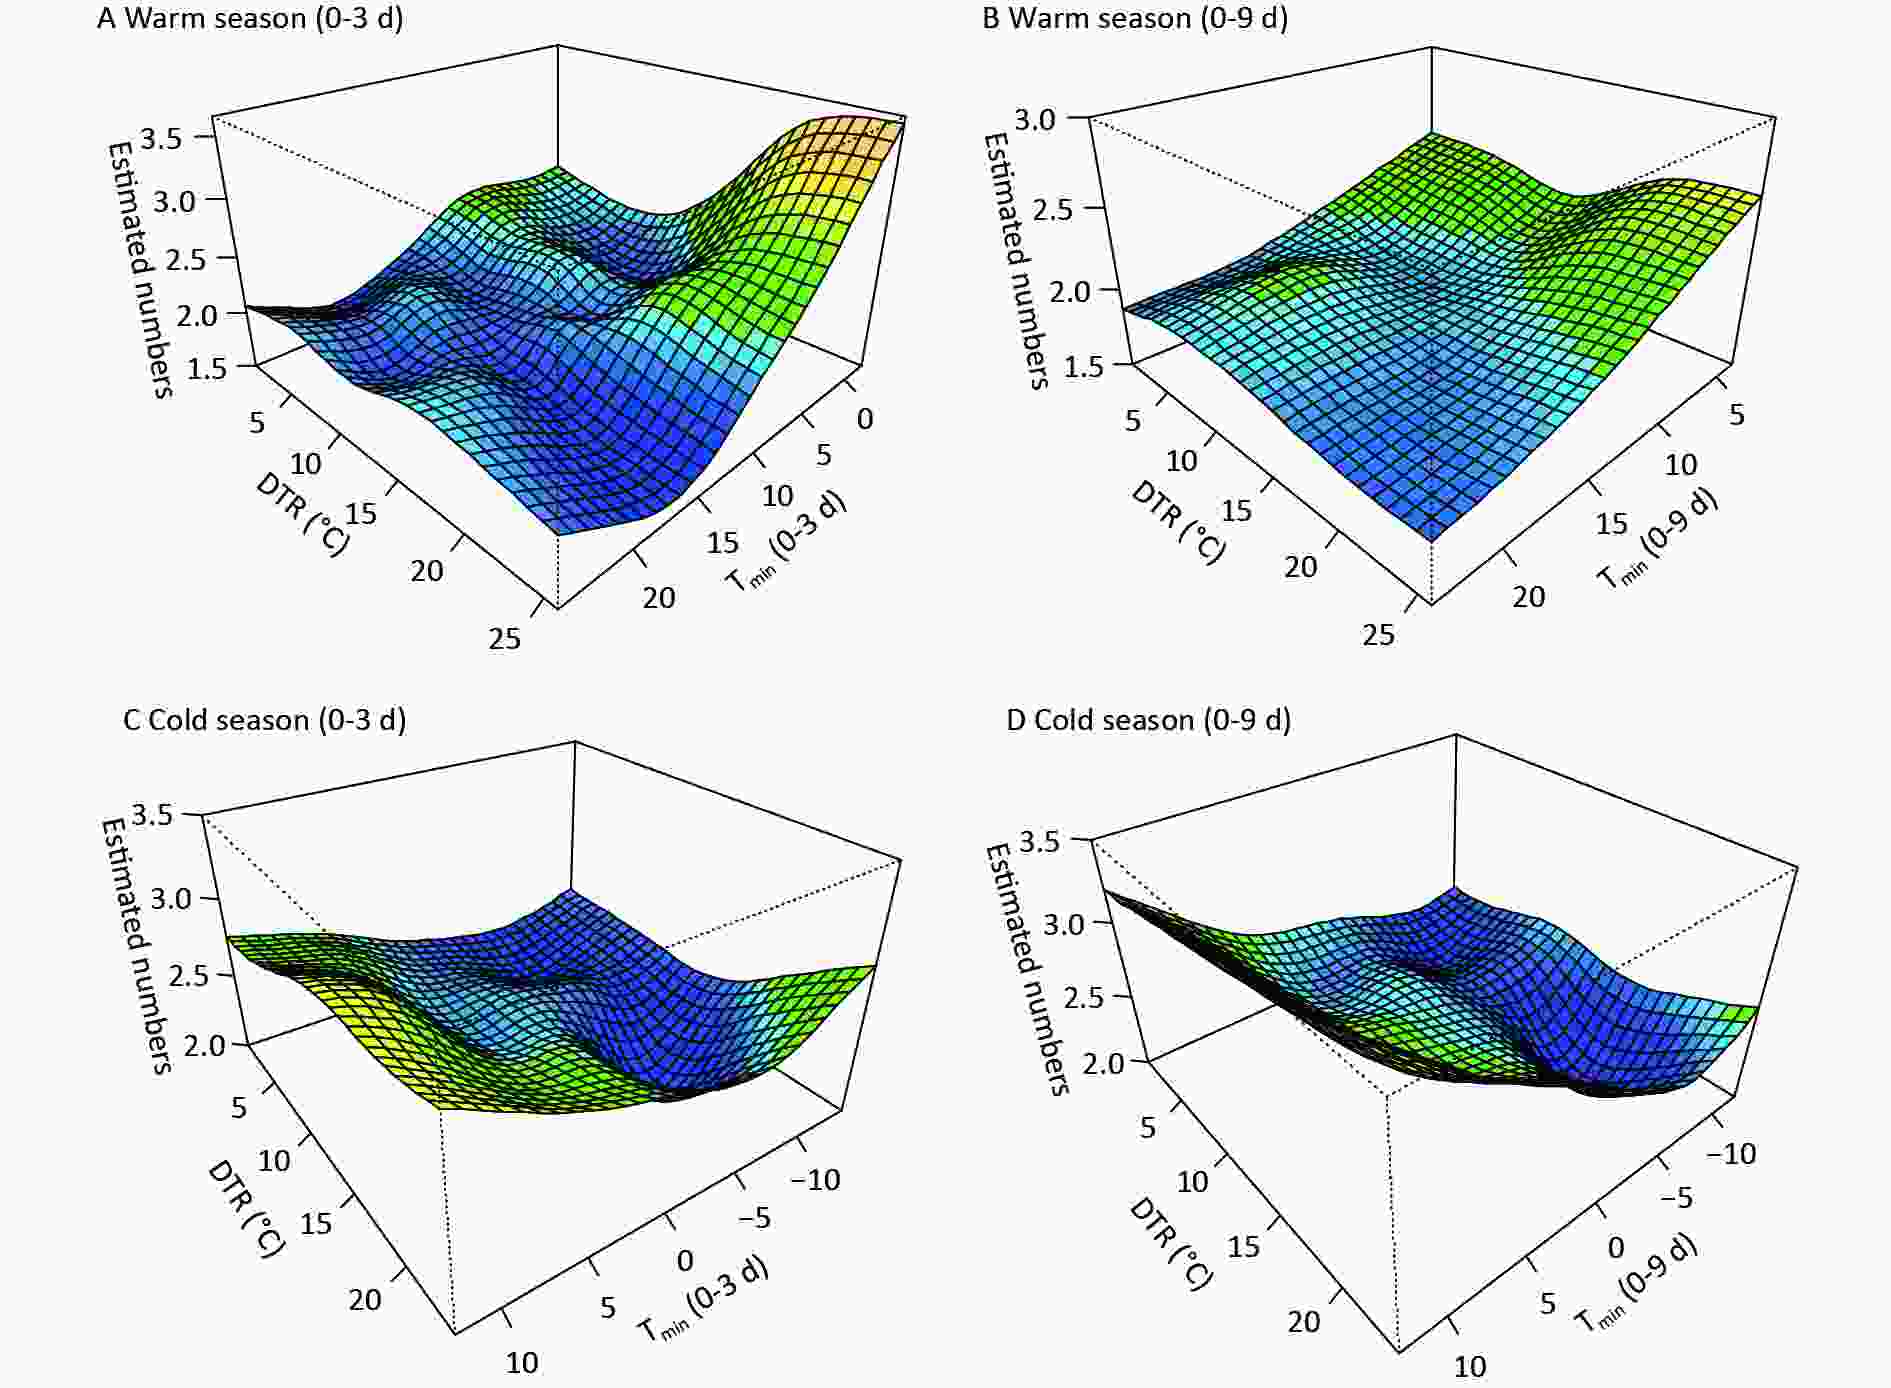
Figure S3. The synergistic effects of Tmin and DTR on digestive risk at varied lags in the (A)-(B) warm and (C)-(D) cold seasons.
Table S3. Relative risks with 95% confidence intervals for typical Tmin quantiles during the lag period in both the warm and cold periods
Tmin Warm season Lag 0d Lag 2d Lag 6d Lag 0−14d 5.1°C 1.21 (95% CI: 1.07−1.37) 1.03 (95% CI: 0.98−1.09) 1.04 (95% CI: 1.00−1.09) 1.67 (95% CI: 1.34−2.10) 10.3°C 1.20 (95% CI: 1.11−1.29) 0.99 (95% CI: 0.95−1.03) 1.02 (95% CI: 0.99−1.06) 1.37 (95% CI: 1.13−1.67) 17.3°C 0.99 (95% CI: 0.92−1.06) 0.97 (95% CI: 0.94−1.01) 1.05 (95% CI: 1.02−1.08) 1.20 (95% CI: 1.03−1.40) 21.7°C 0.91 (95% CI: 0.79−1.04) 0.96 (95% CI: 0.90−1.02) 1.04 (95% CI: 0.99−1.09) 1.09 (95% CI: 0.87−1.38) Tmin Cold season Lag 0d Lag 2d Lag 6d Lag 0−20d −9.6°C 0.94 (95% CI: 0.83−1.05) 0.93 (95% CI: 0.88−1.00) 0.97 (95% CI: 0.94−1.01) 0.48 (95% CI: 0.32−0.70) −6.1°C 0.96 (95% CI: 0.89−1.03) 0.95 (95% CI: 0.92−0.98) 0.95 (95% CI: 0.91−0.97) 0.55 (95% CI: 0.41−0.75) 3°C 1.13 (95% CI: 1.03−1.25) 1.03 (95% CI: 1.00−1.07) 0.97 (95% CI: 0.94−1.00) 0.97 (95% CI: 0.74−1.27) 8.7°C 1.32 (95% CI: 1.14−1.53) 1.09 (95% CI: 1.03−1.15) 0.99 (95% CI: 0.95−1.04) 2.18 (95% CI: 1.51−3.15) Note. RRs of the 5th, 25th, 75th, and 95th percentiles of Tmin are listed. Bold indicates statistical significance. Table S4. Relative risk and 95% CIs of digestive risk for specific DTRs at varied lags in both semi−years
DTR Warm season Lag 0d Lag 2d Lag 6d Lag 10d 4.0°C 1.10 (95% CI: 1.01−1.20) 0.94 (95% CI: 0.88−0.99) 1.04 (95% CI: 0.99−1.09) 0.94 (95% CI: 0.86−1.03) 8.4°C 1.13 (95% CI: 1.04−1.22) 1.02 (95% CI: 0.96−1.07) 1.00 (95% CI: 0.95−1.04) 0.99 (95% CI: 0.94−1.07) 15.1°C 1.04 (95% CI: 0.98−1.11) 1.00 (95% CI: 0.96−1.05) 1.03 (95% CI: 1.00−1.07) 1.01 (95% CI: 0.94−1.08) 19.0°C 1.15 (95% CI: 1.05−1.27) 0.99 (95% CI: 0.93−1.06) 1.10 (95% CI: 1.05−1.16) 0.99 (95% CI: 0.91−1.09) 21.4°C 1.22 (95% CI: 1.08−1.44) 0.97 (95% CI: 0.90−1.06) 1.15 (95% CI: 1.08−1.26) 0.96 (95% CI: 0.86−1.10) DTR Cold season Lag 0d Lag 2d Lag 6d Lag 10d 3.9°C 0.94 (95% CI: 0.88−1.02) 0.94 (95% CI: 0.90−0.98) 0.97 (95% CI: 0.94−1.01) 1.01 (95% CI: 0.97−1.05) 7.7°C 0.97 (95% CI: 0.92−1.03) 0.99 (95% CI: 0.96−1.02) 1.00 (95% CI: 0.97−1.03) 1.00 (95% CI: 0.96−1.03) 13.6°C 0.97 (95% CI: 0.91−1.03) 0.95 (95% CI: 0.92−0.98) 0.98 (95% CI: 0.95−1.01) 1.02 (95% CI: 0.99−1.05) 18.1°C 1.03 (95% CI: 0.95−1.12) 0.95 (95% CI: 0.91−1.03) 0.97 (95% CI: 0.93−1.01) 1.06 (95% CI: 1.02−1.11) 20.7°C 1.15 (95% CI: 1.01−1.32) 0.98 (95% CI: 0.91−1.05) 0.97 (95% CI: 0.93−1.04) 1.10 (95% CI: 1.03−1.19) Note. RRs of the 5th, 25th, 75th, 95th, and 99th percentiles of DTR are listed. Bold indicates statistical significance.
doi: 10.3967/bes2024.140
Quantifying the Temperature Effects on the Morbidity of Digestive Diseases In an Inland Plateau-Valley City
-
Pan Ma: Conceptualization, methodology, formal analysis, writing- original draft, visualization, and funding acquisition. Yang Yang: Methodology, data curation, and writing- review & editing. Ning Zhou: Datacuration, writing- review & editing, and funding acquisition. Xinzi Wang: Investigation, data curation, and visualization. Yulu Wang and Wenjuan Feng: Investigation, methodology, and data curation. Zhaoqin Bai: Investigation, resources, and supervision. Shigong Wang: Conceptualization, resources, and project administration.
The authors declare no competing interests in connection with the work submitted.
注释:1) Author Contribution: 2) Conflict of interests: -
S1. The seasonal distribution of hospitalized patients suffering from digestive diseases in Lanzhou, China, from March 1, 2016 to May 1, 2021.
Figure 1. The overall and specific effects of the daily minimum temperature (Tmin) on digestive morbidity under opposite climate backgrounds. P5, P25, and P95 in the warm season, P5, P75, and P95 in the cold season were selected, respectively. RR, relative risk.
Figure 2. The lag effect of typical percentiles of diurnal temperature range (DTR) (P25, P90, and P99) on digestive morbidity under opposite climate backgrounds. RR, relative risk.
Figure 3. The synergistic effects of the daily minimum temperature (Tmin) and diurnal temperature range (DTR) on digestive risk. (A) and (C) indicate the immediate effects, (B) and (D) refer to the lag (0–6 d) effects of Tmin.
S2. The exposure-lag-response associations between Tmin and digestive disease risk in the (A) warm and (B) cold seasons, respectively.
S3. The synergistic effects of Tmin and DTR on digestive risk at varied lags in the (A)-(B) warm and (C)-(D) cold seasons.
S1. The correlation coefficients among meteorological factors
Variables Diurnal temperature range Vapor pressure Relative humidity Wind velocity Atmospheric pressure Mean temperature R 0.180** 0.820** −0.016 0.242** −0.926** P 0.000 0.000 0.314 0.000 0.000 Maximum temperature R 0.411** 0.740** −0.111** 0.175** −0.903** P 0.000 0.000 0.000 0.000 0.000 Minimum temperature R −0.027 0.871** 0.112** 0.255** −0.884** P 0.244 0.000 0.000 0.000 0.000 Note. R, correlation coefficient; P, the significance level.  下载: 导出CSV
S2. Descriptive statistics of hospital admissions for digestive disease and meteorological variables in Lanzhou, China, from March 1, 2016 to May 1, 2021
Statistical variables x s Min P10 P25 P50 P75 P90 Max Total 5.8 4.8 0.0 1.0 2.0 5.0 9.0 12.6 25.0 0−60 years 3.0 2.8 0.0 0.0 1.0 2.0 5.0 7.0 14.0 > 60 years 2.8 2.6 0.0 0.0 1.0 2.0 4.0 6.0 14.0 Male 3.2 2.9 0.0 0.0 1.0 3.0 5.0 7.0 18.0 Female 2.6 2.4 0.0 0.0 1.0 2.0 4.0 6.0 14.0 Mean temperature (°C) 11.4 9.8 −12.4 −2.6 2.7 12.6 19.9 23.6 30.8 Maximum temperature (°C) 17.7 10.2 −7.6 3.2 9.1 18.9 26.2 30.7 37.7 Minimum temperature (°C) 6.4 9.3 −15.7 −6.8 −1.5 7.2 14.1 18.1 25.4 Diurnal temperature range (°C) 11.3 4.4 0.9 5.3 8.0 11.4 14.4 17.2 25.8 Wind velocity (m/s) 1.1 0.4 0.0 0.7 1.0 1.0 1.3 1.5 3.2 Vapor pressure (hPa) 7.7 5.1 0.7 2.1 3.1 6.4 11.4 15.5 21.7 Relative humidity (%) 48.3 16.0 11.0 27.4 35.7 48.1 59.8 69.7 95.8 Sea surface pressure (hPa) 1012.7 48.6 0.0 999.0 1005.8 1015.8 1024.8 1031.4 1044.8 Note. x, the mean; s, the standard deviation. P10, P25, P50, P75, and P90 represent the 10th, 25th, 50th, 75th, and 90th percentiles, respectively.
下载: 导出CSV
S3. Relative risks with 95% confidence intervals for typical Tmin quantiles during the lag period in both the warm and cold periods
Tmin Warm season Lag 0d Lag 2d Lag 6d Lag 0−14d 5.1°C 1.21 (95% CI: 1.07−1.37) 1.03 (95% CI: 0.98−1.09) 1.04 (95% CI: 1.00−1.09) 1.67 (95% CI: 1.34−2.10) 10.3°C 1.20 (95% CI: 1.11−1.29) 0.99 (95% CI: 0.95−1.03) 1.02 (95% CI: 0.99−1.06) 1.37 (95% CI: 1.13−1.67) 17.3°C 0.99 (95% CI: 0.92−1.06) 0.97 (95% CI: 0.94−1.01) 1.05 (95% CI: 1.02−1.08) 1.20 (95% CI: 1.03−1.40) 21.7°C 0.91 (95% CI: 0.79−1.04) 0.96 (95% CI: 0.90−1.02) 1.04 (95% CI: 0.99−1.09) 1.09 (95% CI: 0.87−1.38) Tmin Cold season Lag 0d Lag 2d Lag 6d Lag 0−20d −9.6°C 0.94 (95% CI: 0.83−1.05) 0.93 (95% CI: 0.88−1.00) 0.97 (95% CI: 0.94−1.01) 0.48 (95% CI: 0.32−0.70) −6.1°C 0.96 (95% CI: 0.89−1.03) 0.95 (95% CI: 0.92−0.98) 0.95 (95% CI: 0.91−0.97) 0.55 (95% CI: 0.41−0.75) 3°C 1.13 (95% CI: 1.03−1.25) 1.03 (95% CI: 1.00−1.07) 0.97 (95% CI: 0.94−1.00) 0.97 (95% CI: 0.74−1.27) 8.7°C 1.32 (95% CI: 1.14−1.53) 1.09 (95% CI: 1.03−1.15) 0.99 (95% CI: 0.95−1.04) 2.18 (95% CI: 1.51−3.15) Note. RRs of the 5th, 25th, 75th, and 95th percentiles of Tmin are listed. Bold indicates statistical significance.
下载: 导出CSV
S4. Relative risk and 95% CIs of digestive risk for specific DTRs at varied lags in both semi−years
DTR Warm season Lag 0d Lag 2d Lag 6d Lag 10d 4.0°C 1.10 (95% CI: 1.01−1.20) 0.94 (95% CI: 0.88−0.99) 1.04 (95% CI: 0.99−1.09) 0.94 (95% CI: 0.86−1.03) 8.4°C 1.13 (95% CI: 1.04−1.22) 1.02 (95% CI: 0.96−1.07) 1.00 (95% CI: 0.95−1.04) 0.99 (95% CI: 0.94−1.07) 15.1°C 1.04 (95% CI: 0.98−1.11) 1.00 (95% CI: 0.96−1.05) 1.03 (95% CI: 1.00−1.07) 1.01 (95% CI: 0.94−1.08) 19.0°C 1.15 (95% CI: 1.05−1.27) 0.99 (95% CI: 0.93−1.06) 1.10 (95% CI: 1.05−1.16) 0.99 (95% CI: 0.91−1.09) 21.4°C 1.22 (95% CI: 1.08−1.44) 0.97 (95% CI: 0.90−1.06) 1.15 (95% CI: 1.08−1.26) 0.96 (95% CI: 0.86−1.10) DTR Cold season Lag 0d Lag 2d Lag 6d Lag 10d 3.9°C 0.94 (95% CI: 0.88−1.02) 0.94 (95% CI: 0.90−0.98) 0.97 (95% CI: 0.94−1.01) 1.01 (95% CI: 0.97−1.05) 7.7°C 0.97 (95% CI: 0.92−1.03) 0.99 (95% CI: 0.96−1.02) 1.00 (95% CI: 0.97−1.03) 1.00 (95% CI: 0.96−1.03) 13.6°C 0.97 (95% CI: 0.91−1.03) 0.95 (95% CI: 0.92−0.98) 0.98 (95% CI: 0.95−1.01) 1.02 (95% CI: 0.99−1.05) 18.1°C 1.03 (95% CI: 0.95−1.12) 0.95 (95% CI: 0.91−1.03) 0.97 (95% CI: 0.93−1.01) 1.06 (95% CI: 1.02−1.11) 20.7°C 1.15 (95% CI: 1.01−1.32) 0.98 (95% CI: 0.91−1.05) 0.97 (95% CI: 0.93−1.04) 1.10 (95% CI: 1.03−1.19) Note. RRs of the 5th, 25th, 75th, 95th, and 99th percentiles of DTR are listed. Bold indicates statistical significance.
下载: 导出CSV
-
[1] Kamangar F, Nasrollahzadeh D, Safiri S, et al. The global, regional, and national burden of oesophageal cancer and its attributable risk factors in 195 countries and territories, 1990-2017: a systematic analysis for the global burden of disease study 2017. Lancet Gastroenterol Hepatol, 2020; 5, 582−97. doi: 10.1016/S2468-1253(20)30007-8 [2] Wang YC, Huang YT, Chase RC, et al. Global burden of digestive diseases: a systematic analysis of the global burden of diseases study, 1990 to 2019. Gastroenterology, 2023; 165, 773-83. e15. [3] Liu DY, Gao AN, Tang GD, et al. Relationship between onset of peptic ulcer and meteorological factors. World J Gastroenterol, 2006; 12, 1463−7. doi: 10.3748/wjg.v12.i9.1463 [4] Boulay F, Berthier F, Dahan C, et al. Seasonal variations in variceal bleeding mortality and hospitalization in France. Am J Gastroenterol, 2001; 96, 1881−7. doi: 10.1111/j.1572-0241.2001.03889.x [5] Cheng J, Xu ZW, Zhu R, et al. Impact of diurnal temperature range on human health: a systematic review. Int J Biometeorol, 2014; 58, 2011−24. doi: 10.1007/s00484-014-0797-5 [6] Gasparrini A. Distributed lag linear and non-linear models in R: the package dlnm. J Stat Softw, 2011; 43, 1−20. [7] Ma P, Wang SG, Shang KZ, et al. The impact of meteorological comfort conditions on respiratory disease. China Environ Sci, 2018; 38, 374−82. (In Chinese) [8] Zhao Q, Li SS, Coelho MSZS, et al. High ambient temperature and risk of hospitalization for gastrointestinal infection in Brazil: a nationwide case-crossover study during 2000-2015. Sci Total Environ, 2022; 849, 157836. doi: 10.1016/j.scitotenv.2022.157836 [9] Ma P, Li RL, Yue M, et al. Impacts of meteorological factors and environmental pollutants on digestive diseases in Beijing. China Environ Sci, 2016; 36, 1589−600. (In Chinese) [10] Wang MZ, Zheng S, He SL, et al. The association between diurnal temperature range and emergency room admissions for cardiovascular, respiratory, digestive and genitourinary disease among the elderly: a time series study. Sci Total Environ, 2013; 456−457, 370−5. -
 23419+Supplementary Materials.pdf

-

 点击查看大图
计量
- 文章访问数: 314
- HTML全文浏览量: 138
- PDF下载量: 26
- 被引次数: 0

 Quick Links