

 下载:
下载:


-
Eczema is a common dermatological disease with a prevalence of 15%–30% among children and up to 10% among adults, causing great disease burden worldwide[1]. Meteorological factors play important roles in the development of eczema. For instance, a U.S. cohort study in children indicated that the odds of poorly controlled eczema increased by 15% for every 5°F increase in temperature and that the odds of poorly controlled eczema increased by 10% for every 10% increase in relative humidity (RH)[2]. Other similar studies indicated that eczema may be affected by high temperature and low RH. A study conducted in Shanghai, a city with moist climate, observed that each 10 °C elevation in temperature was accompanied by a 8.44% increase in eczema visits on the same day, whereas a 10 unit decrease in RH over 7 days was associated with a 10.86% increase in eczema visits[3]. Therefore, both the temperature and the RH are related to skin health. Specifically, abnormal skin health may increase the incidence of eczema.
RH represents the extent to which air is saturated depending on humidity and temperature. Recent studies have suggested that absolute humidity (AH), the actual water vapor content of air irrespective of temperature, is a more important parameter than RH in heat-related and infectious epidemiological studies because it is associated with greater biological significance for many organisms[4, 5]. Although several studies have investigated the associations between AH and health outcomes[6, 7], none of them reported the impact of AH on eczema. Therefore, the present study aimed to estimate the short-term effects of temperature, AH and RH on eczema outpatient visits in Lanzhou from 2014 to 2016 and to estimate the incidence burden of eczema using attributable fraction (AF) and attributable number (AN).
This study protocol was approved by the ethics committee of Lanzhou University (Project identification code: IRB190712–1). Daily counts of outpatients for eczema between 2014 and 2016 were collected from 14 major hospitals in Lanzhou. Outpatient visit data were screened using the 10th Revision of the International Classification of Diseases (ICD-10) Code of eczema (L30.9). Daily outpatients without age or ICD-10 Code were excluded. The simultaneous daily air pollutant data and meteorological variables were obtained from Lanzhou air quality monitoring stations and Lanzhou Meteorological administration, respectively. Meteorological variables included daily average temperature and RH, and air pollutants included particulate matter with aerodynamic diameter ≤ 10 μm (PM10), particulate matter with aerodynamic diameter ≤ 2.5 μm (PM2.5), nitrogen dioxide (NO2), carbon monoxide (CO), ozone (O3) and sulfur dioxide (SO2). The AH was calculated as previously described[4, 8], and the detailed content was presented in our previous study’s Methods section[9].
The Quasi–Poisson regression with the distributed lag nonlinear model (DLNM) was used to analyze the nonlinear and delayed effects between daily eczema visits and meteorological factors (including temperature, AH, and RH) after adjusting for long-term time trends, day of week, and holidays[10, 11]. The lag effects were estimated up to 21 days. The basic DLNM functions for temperature, AH, and RH are listed as follows, respectively:
$$\begin{split} {\rm{E}}\left({Y}_{t}\right)=\;&{{\alpha }}+\beta Temp/cb.Temp+ ns\left({X}_{l}\text{, }df\right)+\quad\;\\ &ns\left(T\text{, } df\right)+ns\left({AH}_{l}\text{, }df\right)+DOW+Hol \end{split}$$ (1) $$\begin{split} {\rm{E}}\left({Y}_{t}\right)=\;&{{\alpha }}+\beta AH/cb.AH+ns\left({X}_{l}\text{, }df\right)+\\ &ns\left(T\text{, } df\right)+ns\left({Temp}_{l}\text{, }df\right)+DOW+Hol \end{split}$$ (2) $$\begin{split} {\rm{E}}\left({Y}_{t}\right)=\;&{{\alpha }}+cb.RH+ns\left({X}_{l}\text{, }df\right)+ns\left(T\text{, } df\right)+\quad\\ &ns\left({Temp}_{l}\text{, }df\right)+DOW+Hol \end{split}$$ (3) where t is the day of the observation; Yt is the number of daily outpatients with eczema on day t; α is the intercept; cb. represents two-dimensional natural splines for temperature (Temp)/AH/RH and lag days; Xl is the three-day moving average (lag 02) concentrations of pollutants (PM10, PM2.5, NO2, SO2, O3, CO); AHl and Templ are the three-day moving average (lag 02) of AH and temperature, respectively. Based on Akaike’s information criterion, the degree of Templ was set as 5 and the degree of Xl or AHl was set as 3; time (T) is the B-spline basis-matrix for a natural cubic spline of the time trends for long-term changes with 7 degrees of freedom (df) per year; DOW is a categorical variable indicating the date of the week; and holiday (Hol) is a binary variable for national holidays in China.
The 5.41 g/m3, 12.9 °C, and 50% (median values of AH, temperature, and RH of the 3 years, respectively)[12-14] were considered as the reference values, respectively. The high and low levels of AH, temperature, and RH were based on their reference values (above and below of their median values)[12, 15, 16]. Then, the AF and AN were calculated by the effect estimates of temperature and AH according to the parametric model (1) and (2)[17], respectively, using the following equations:
$$ AF=1-exp[-\beta \times\left({X}_{t}-{X}_{0}\right)] $$ (4) $$ AN=n\times AF $$ (5) where AF is the attributable fraction due to temperature/AH; AN is the number of eczema outpatients attributed to temperature/AH; n is the reported number of total/subgroups eczema outpatients during 2014–2016;
$\beta $ is effect estimate of temperature/AH in models (1) and (2); Xt is the observed temperature/AH at the maximum effect, and X0 is the reference temperature/AH. The 95% confidence intervals (CIs) of$\beta $ were used to calculate the 95% CIs of AF and AN with the above equation[18].A sensitivity analysis was conducted to evaluate how results changed with lag days for temperature (lag 15–21 days), df (6–9 per year) for time, and df (3–6) for AH. We also assessed results with and without the adjustment of air pollutants. For all statistical tests, value of P < 0.05 was considered statistically significant. The main statistical analyses were conducted using the R statistical software (version 3.5.2) and the ‘dlnm’ package (version 2.3.6).
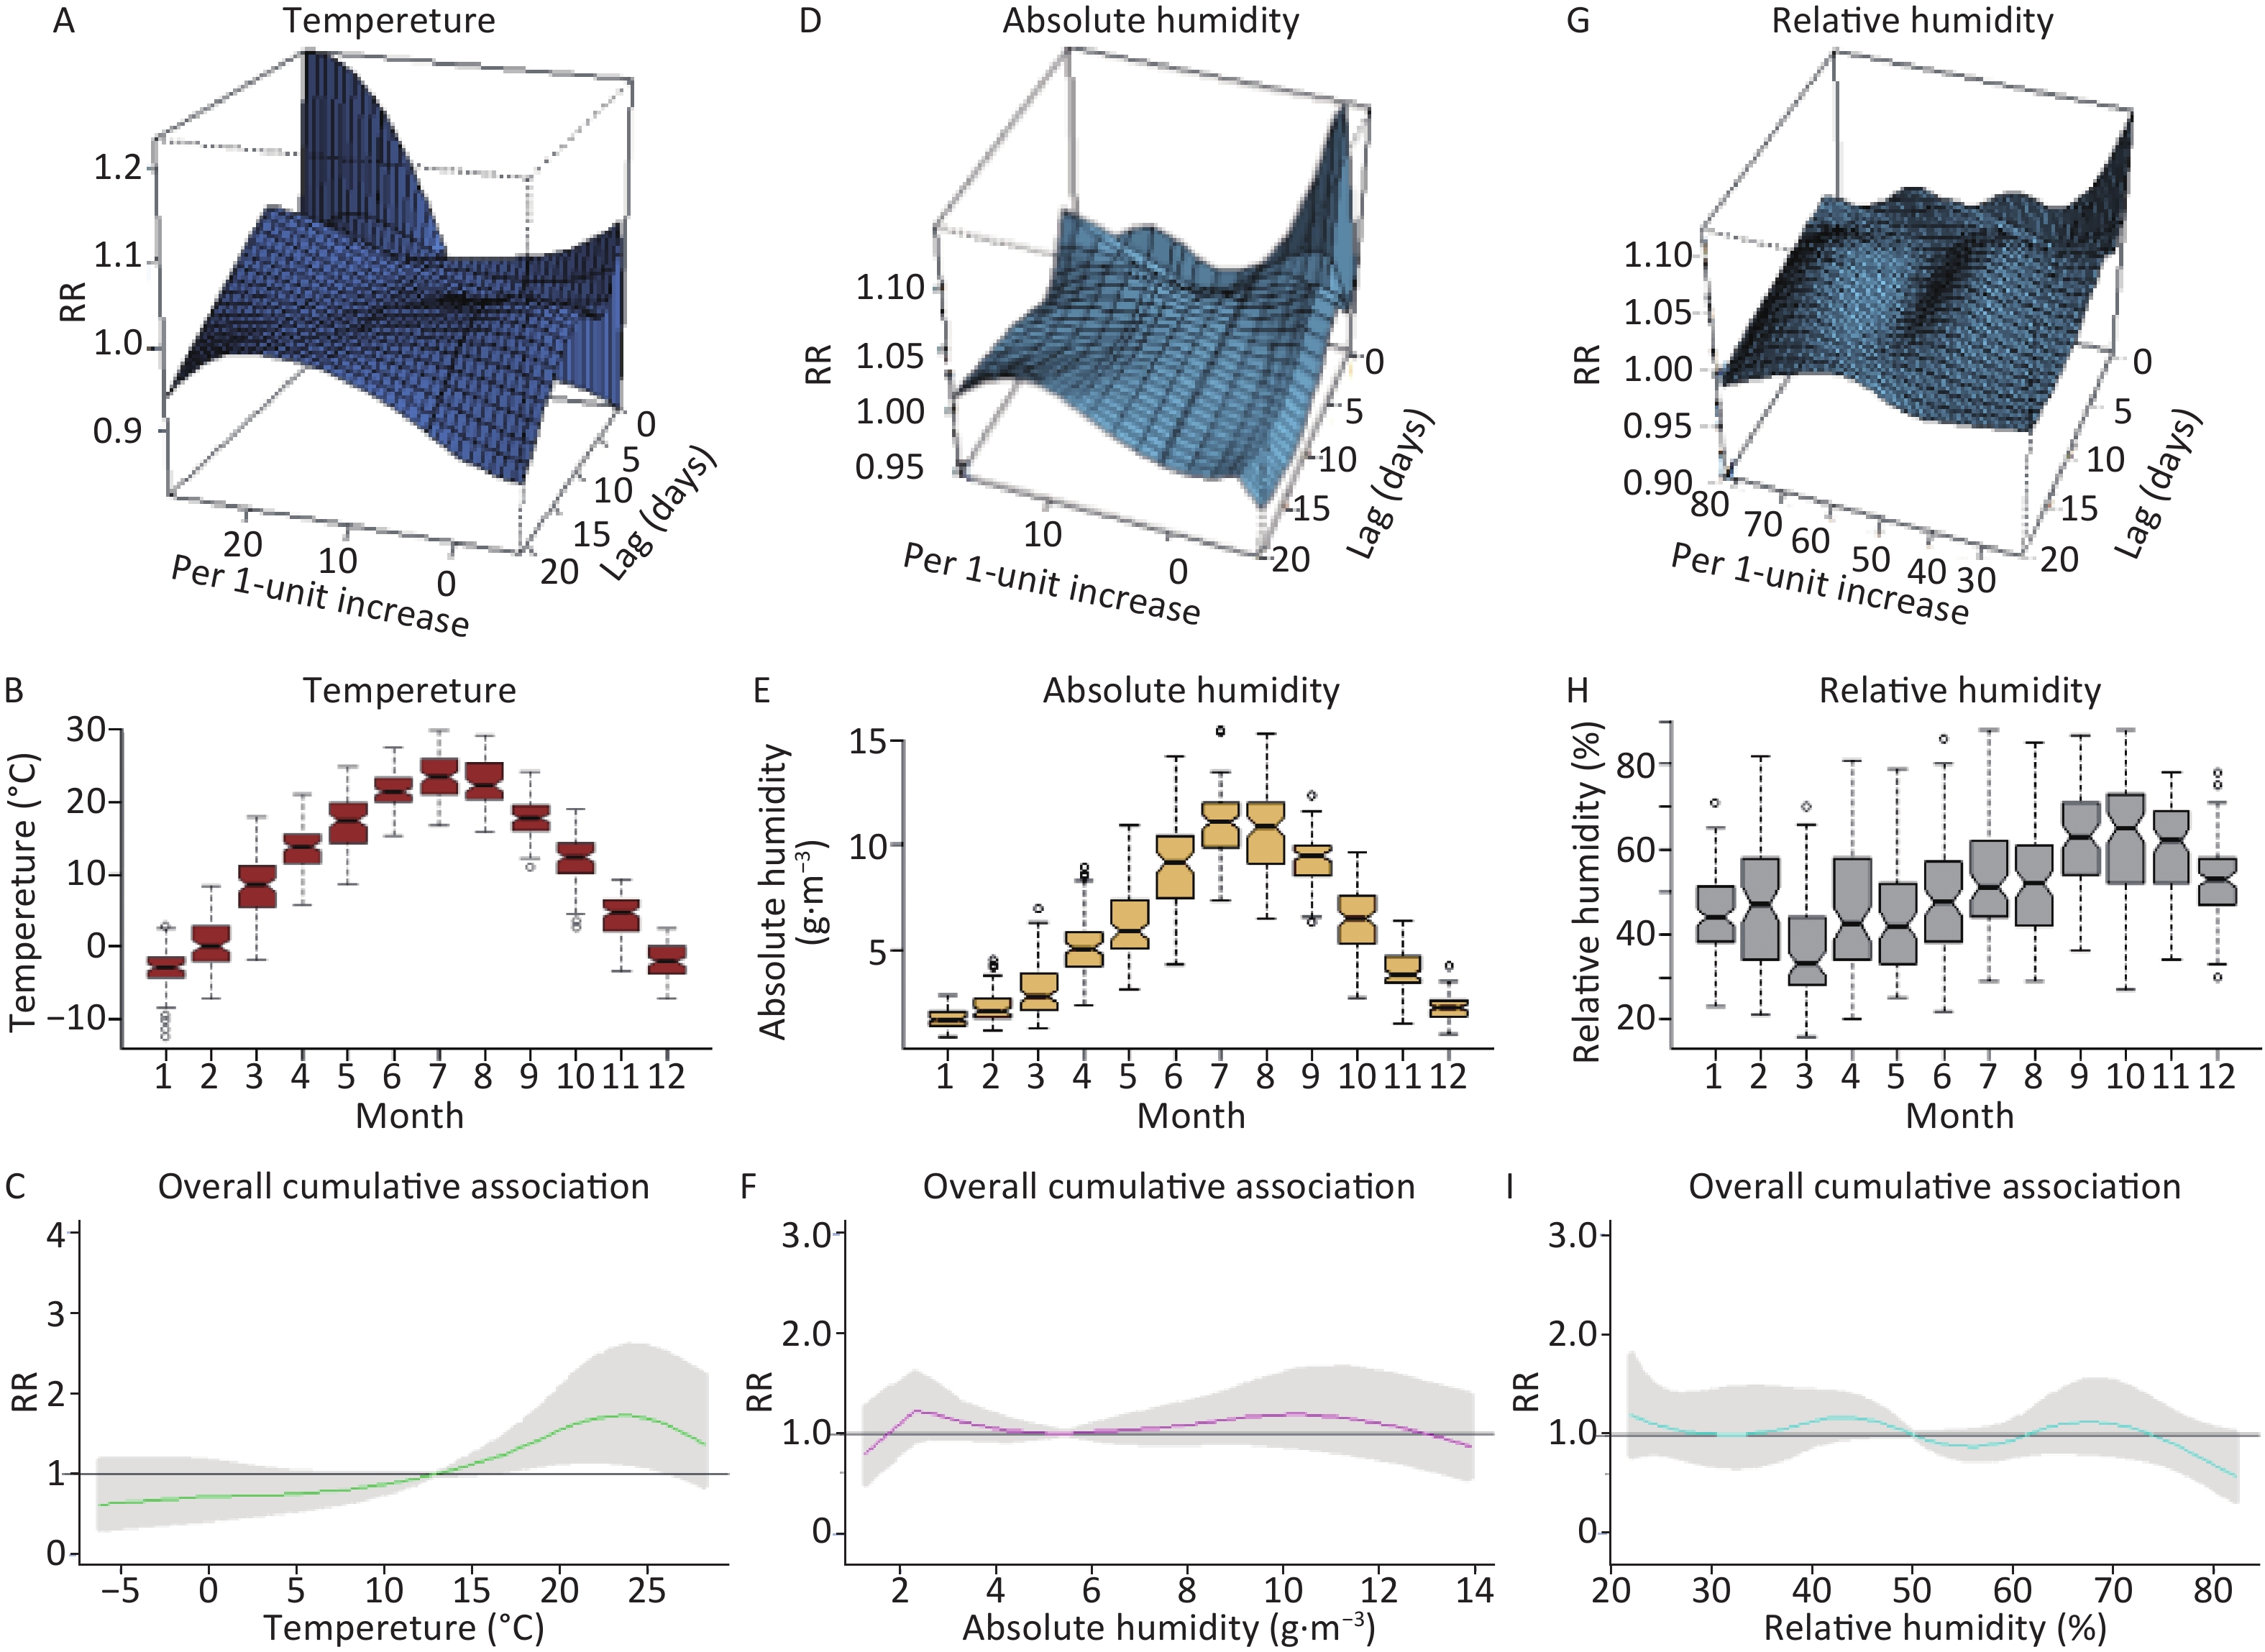
A total of 29,820 eczema outpatient visits were recorded from January 1st, 2014 through December 31st, 2016 in major hospitals of Lanzhou. Supplementary Table S1 (available in www.besjournal.com) showed the descriptive statistics for daily visits of eczema outpatients, air pollutants, and meteorological variables. Supplementary Figure S1 (available in www.besjournal.com) presented the overall effects and cumulative effects of temperature, AH, and RH on the relative risk (RR) of eczema. Supplementary Figure S2 (available in www.besjournal.com) showed the monthly total of all eczema outpatients and various subgroups. Obvious associations were found among the environmental factors in Lanzhou (Supplementary Table S2 available in www.besjournal.com).
Table S1. Summary of meteorological data, air pollutants, and eczema outpatient visits
Variables Daily mean values Mean ± SD Min P25 Median P75 Max Daily meteorological measures Temperature (°C) 11.40 ± 9.75 −12.40 2.58 12.90 19.70 29.80 Absolute humidity (g/m3) 5.96 ± 3.52 0.91 2.62 5.41 8.89 15.44 Relative humidity (%) 50.58 ± 14.57 16.00 39.00 50.00 61.00 88.00 Daily concentrations of air pollutants PM2.5 (μg/m3) 54.52 ± 28.42 7.15 36.01 46.60 66.52 299.06 PM10 (μg/m3) 123.35 ± 75.69 19.72 82.39 108.36 144.88 1207.13 NO2 (μg/m3) 51.80 ± 21.26 12.25 36.07 49.34 63.26 138.15 SO2 (μg/m3) 22.97 ± 15.06 3.47 11.47 19.06 31.12 130.59 CO (mg/m3) 1.37 ± 0.72 0.44 0.88 1.13 1.66 4.34 O3 (μg/m3) 46.09 ± 20.32 1.85 30.41 44.30 60.43 125.05 Daily outpatient visits for eczema All 27.21 ± 14.56 0.00 15.00 27.00 38.00 74.00 Male 12.26 ± 6.98 0.00 7.00 12.00 17.00 35.00 Female 15.00 ± 8.50 0.00 8.00 15.00 21.00 43.00 < 15 years 3.18 ± 2.38 0.00 1.00 3.00 5.00 14.00 15–34 years 5.82 ± 3.59 0.00 3.00 5.00 8.00 18.00 35–60 years 11.83 ± 6.99 0.00 6.00 11.00 16.00 34.00 > 60 years 6.38 ± 4.59 0.00 2.00 6.00 9.00 24.00 Note. SD, standard deviance; Min, Minimum; P25, 25th percentile; P75, 75th percentile; Max, Maximum; PM2.5, particulate matter with aerodynamic diameter ≤ 2.5 μm; PM10, particulate matter with aerodynamic diameter ≤ 10 μm; NO2, nitrogen dioxide; SO2, sulfur dioxide; CO, carbon monoxide; O3, ozone. 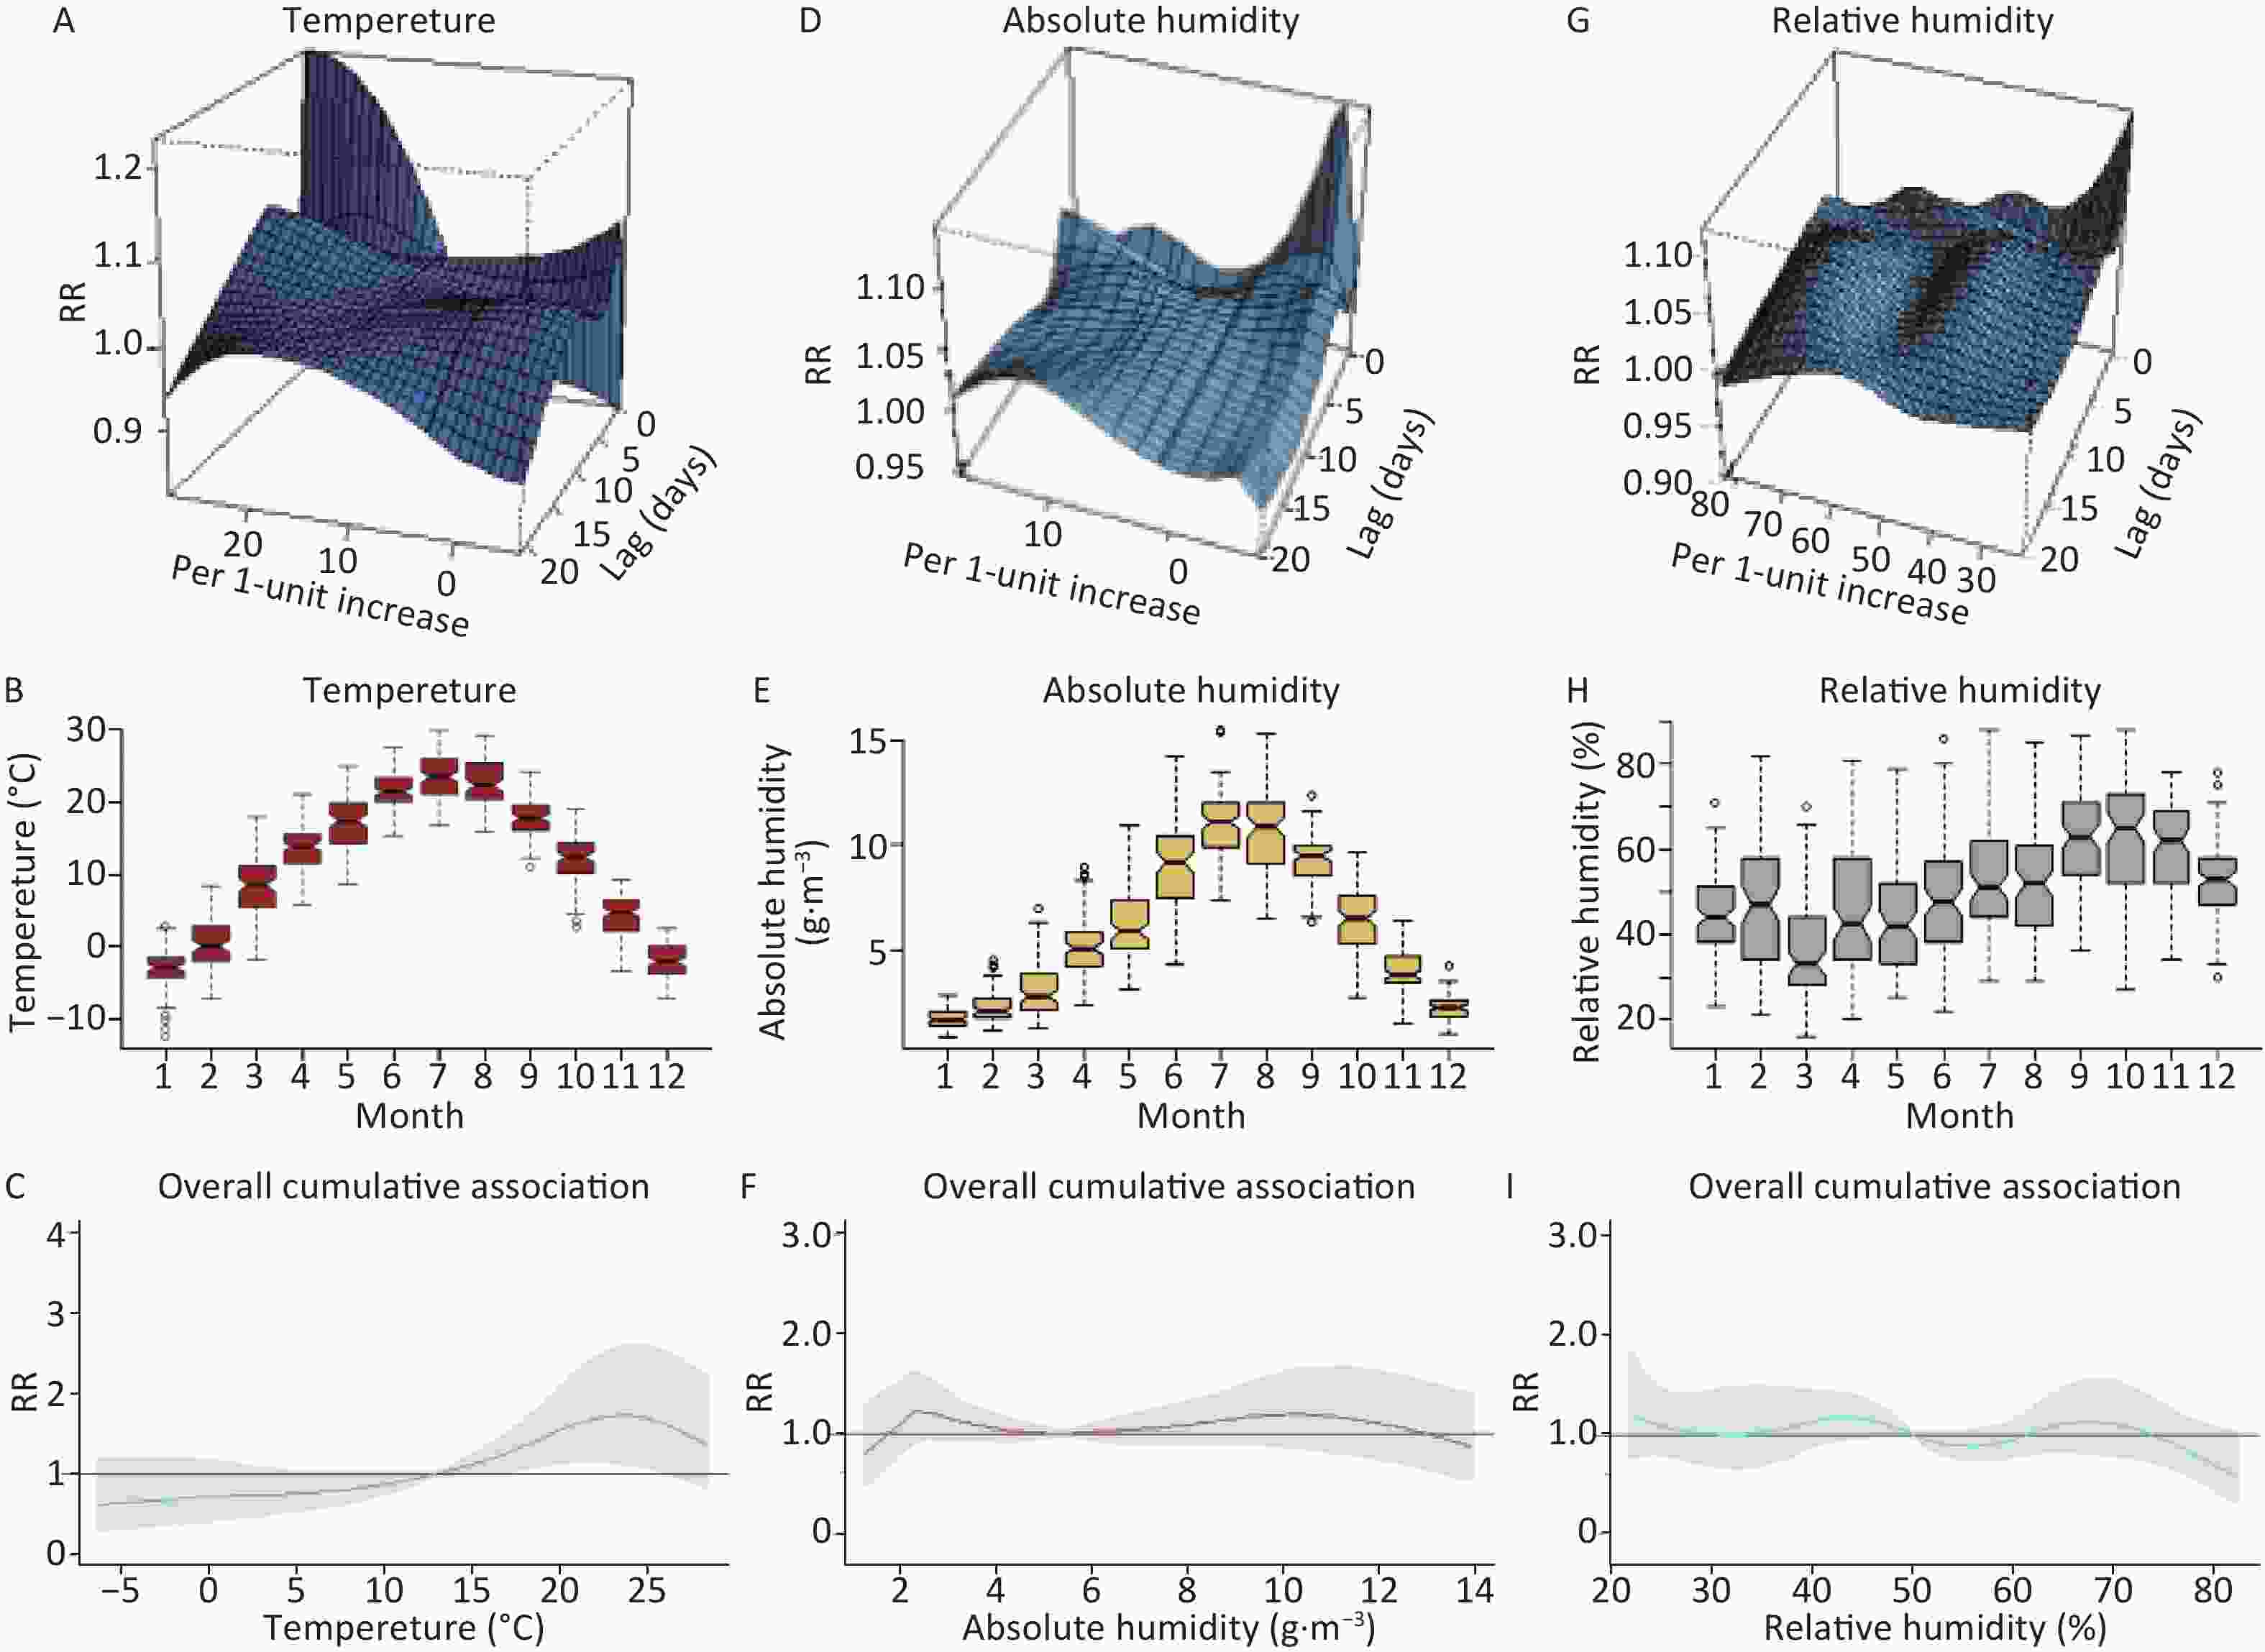
Figure S1. Overall effects of temperature (°C) (A–C), absolute humidity (g/m3) (D–F) and relative humidity (%) (G–I) on the daily counts of outpatients due to eczema in Lanzhou, China with references at 12.9 °C, 5.41 g/m3, and 50% (Median temperature, absolute humidity, and relative humidity during 2014–2016). RR, relative risk.
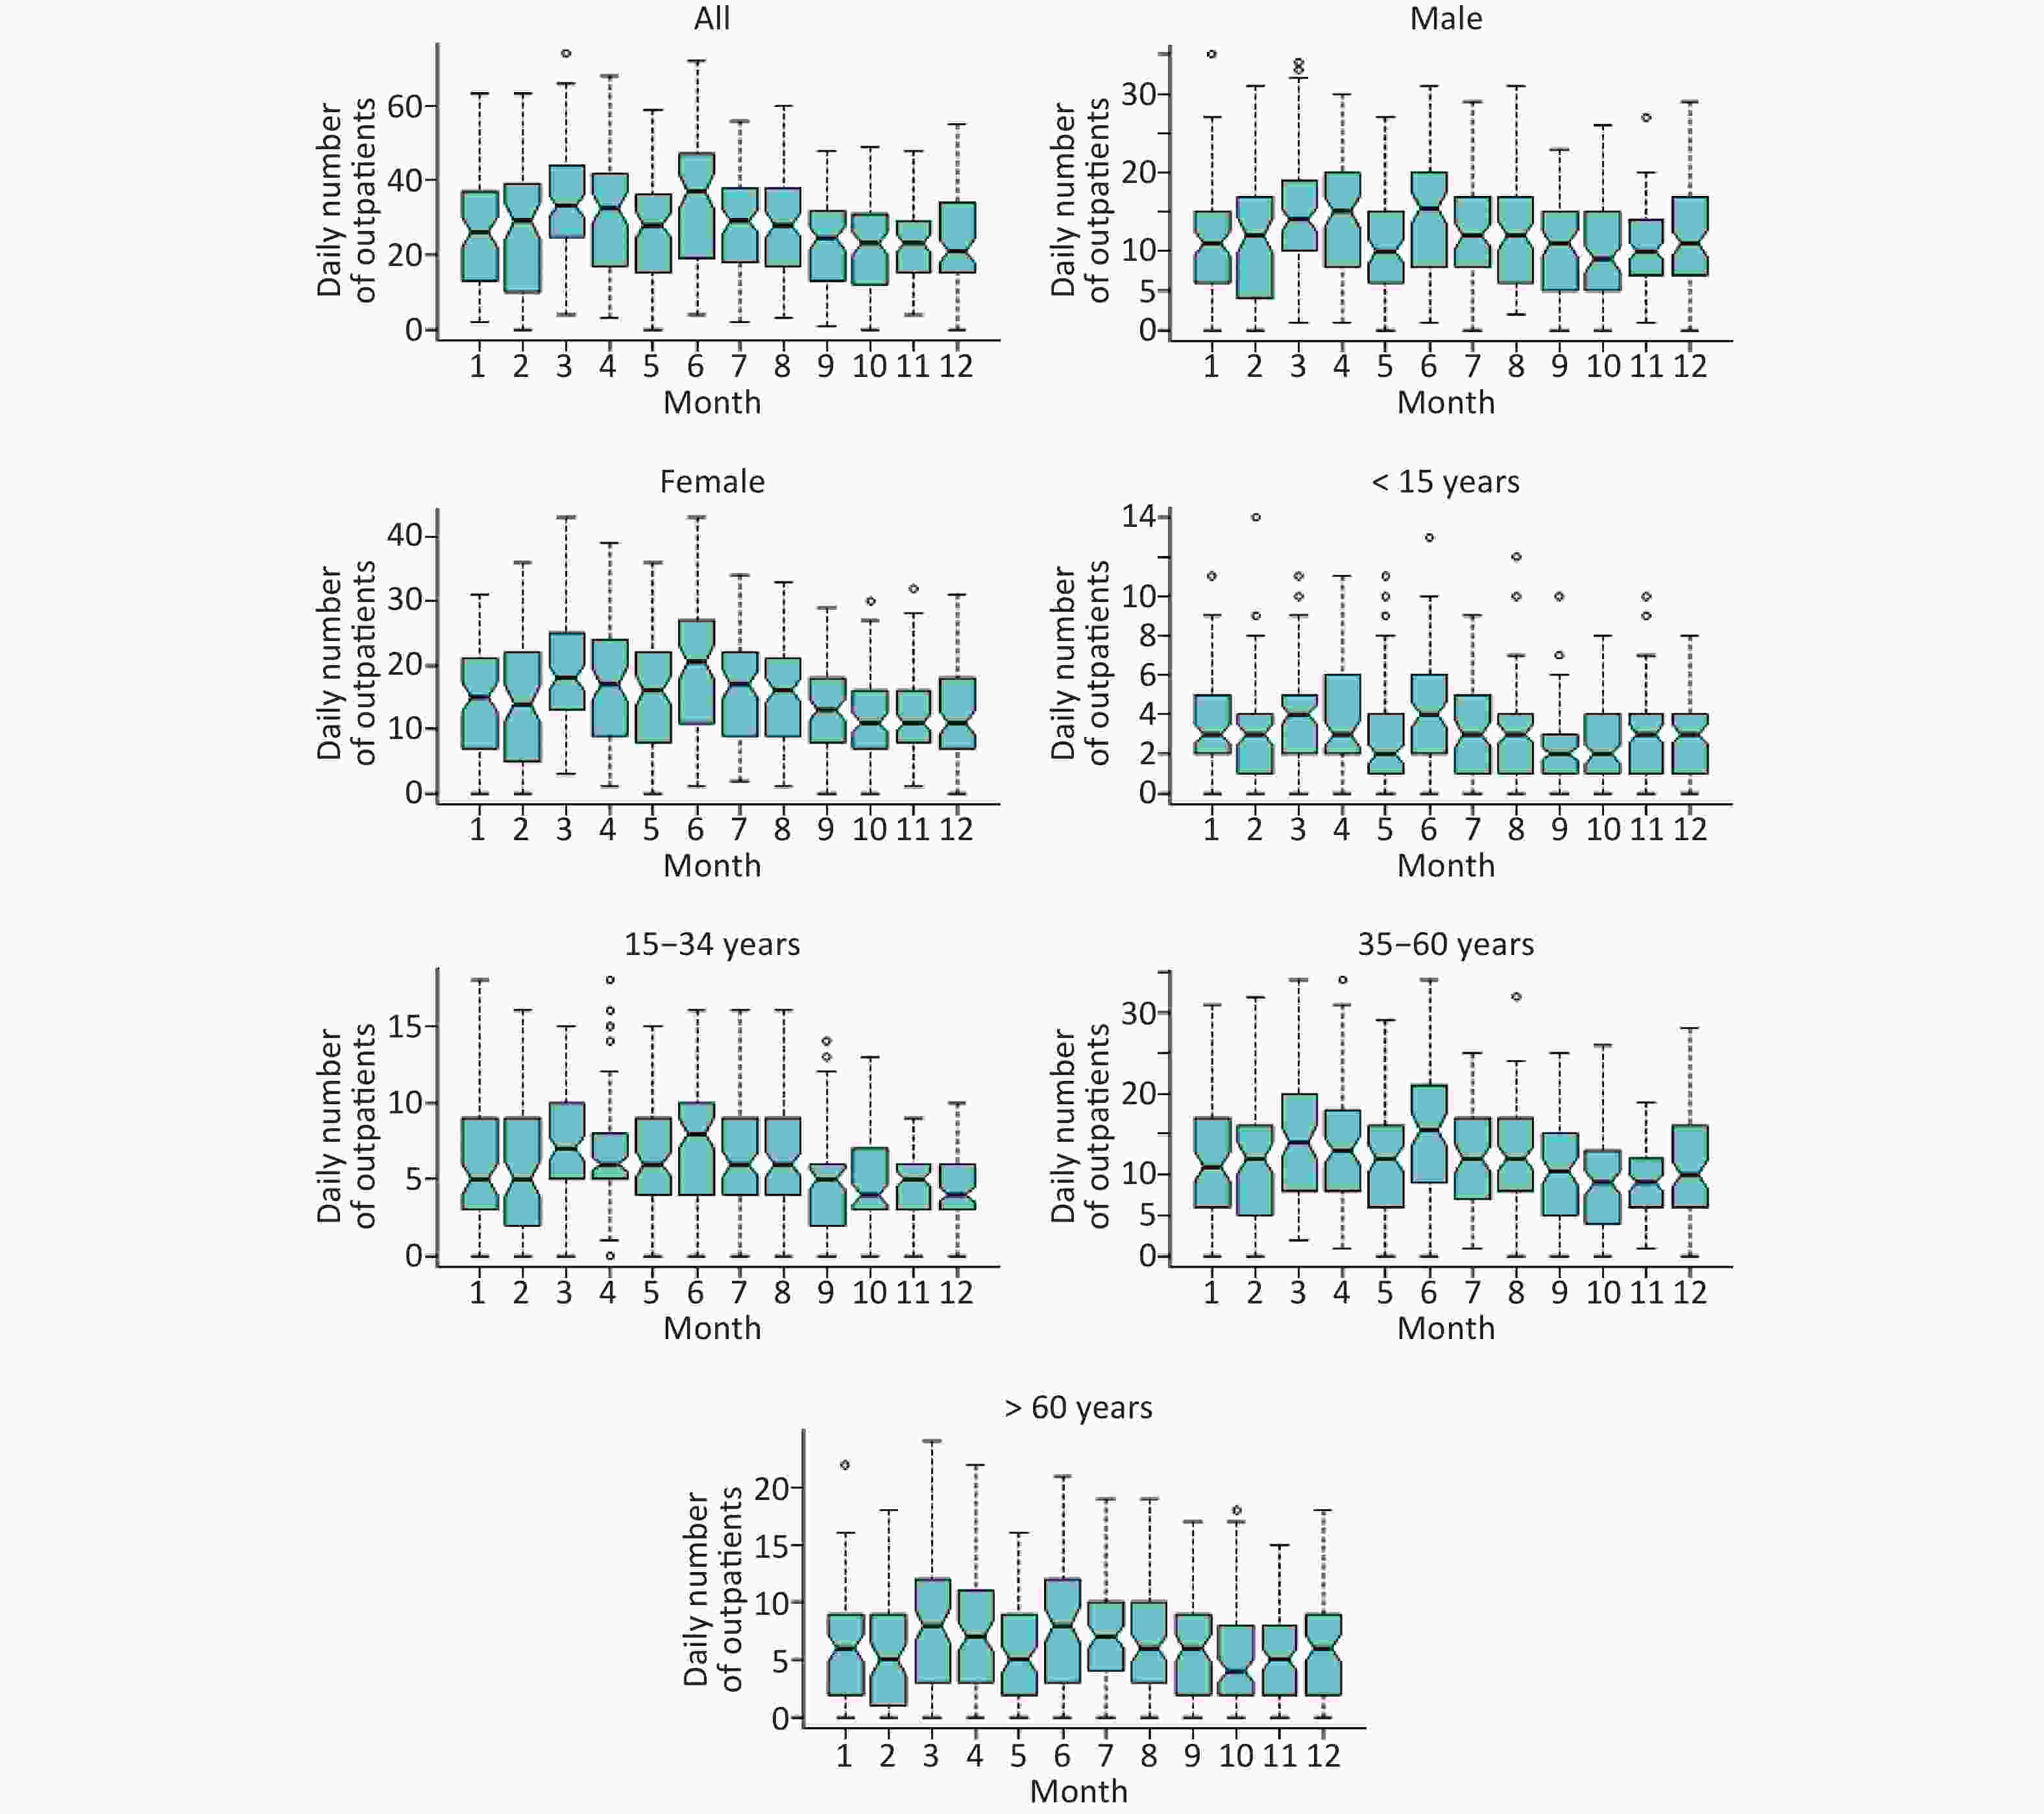
Figure S2. Box plots of monthly eczema outpatients in Lanzhou, China by sex and age groups during 2014–2016.
Table S2. Spearman correlation of meteorological factors and air pollutants in Lanzhou
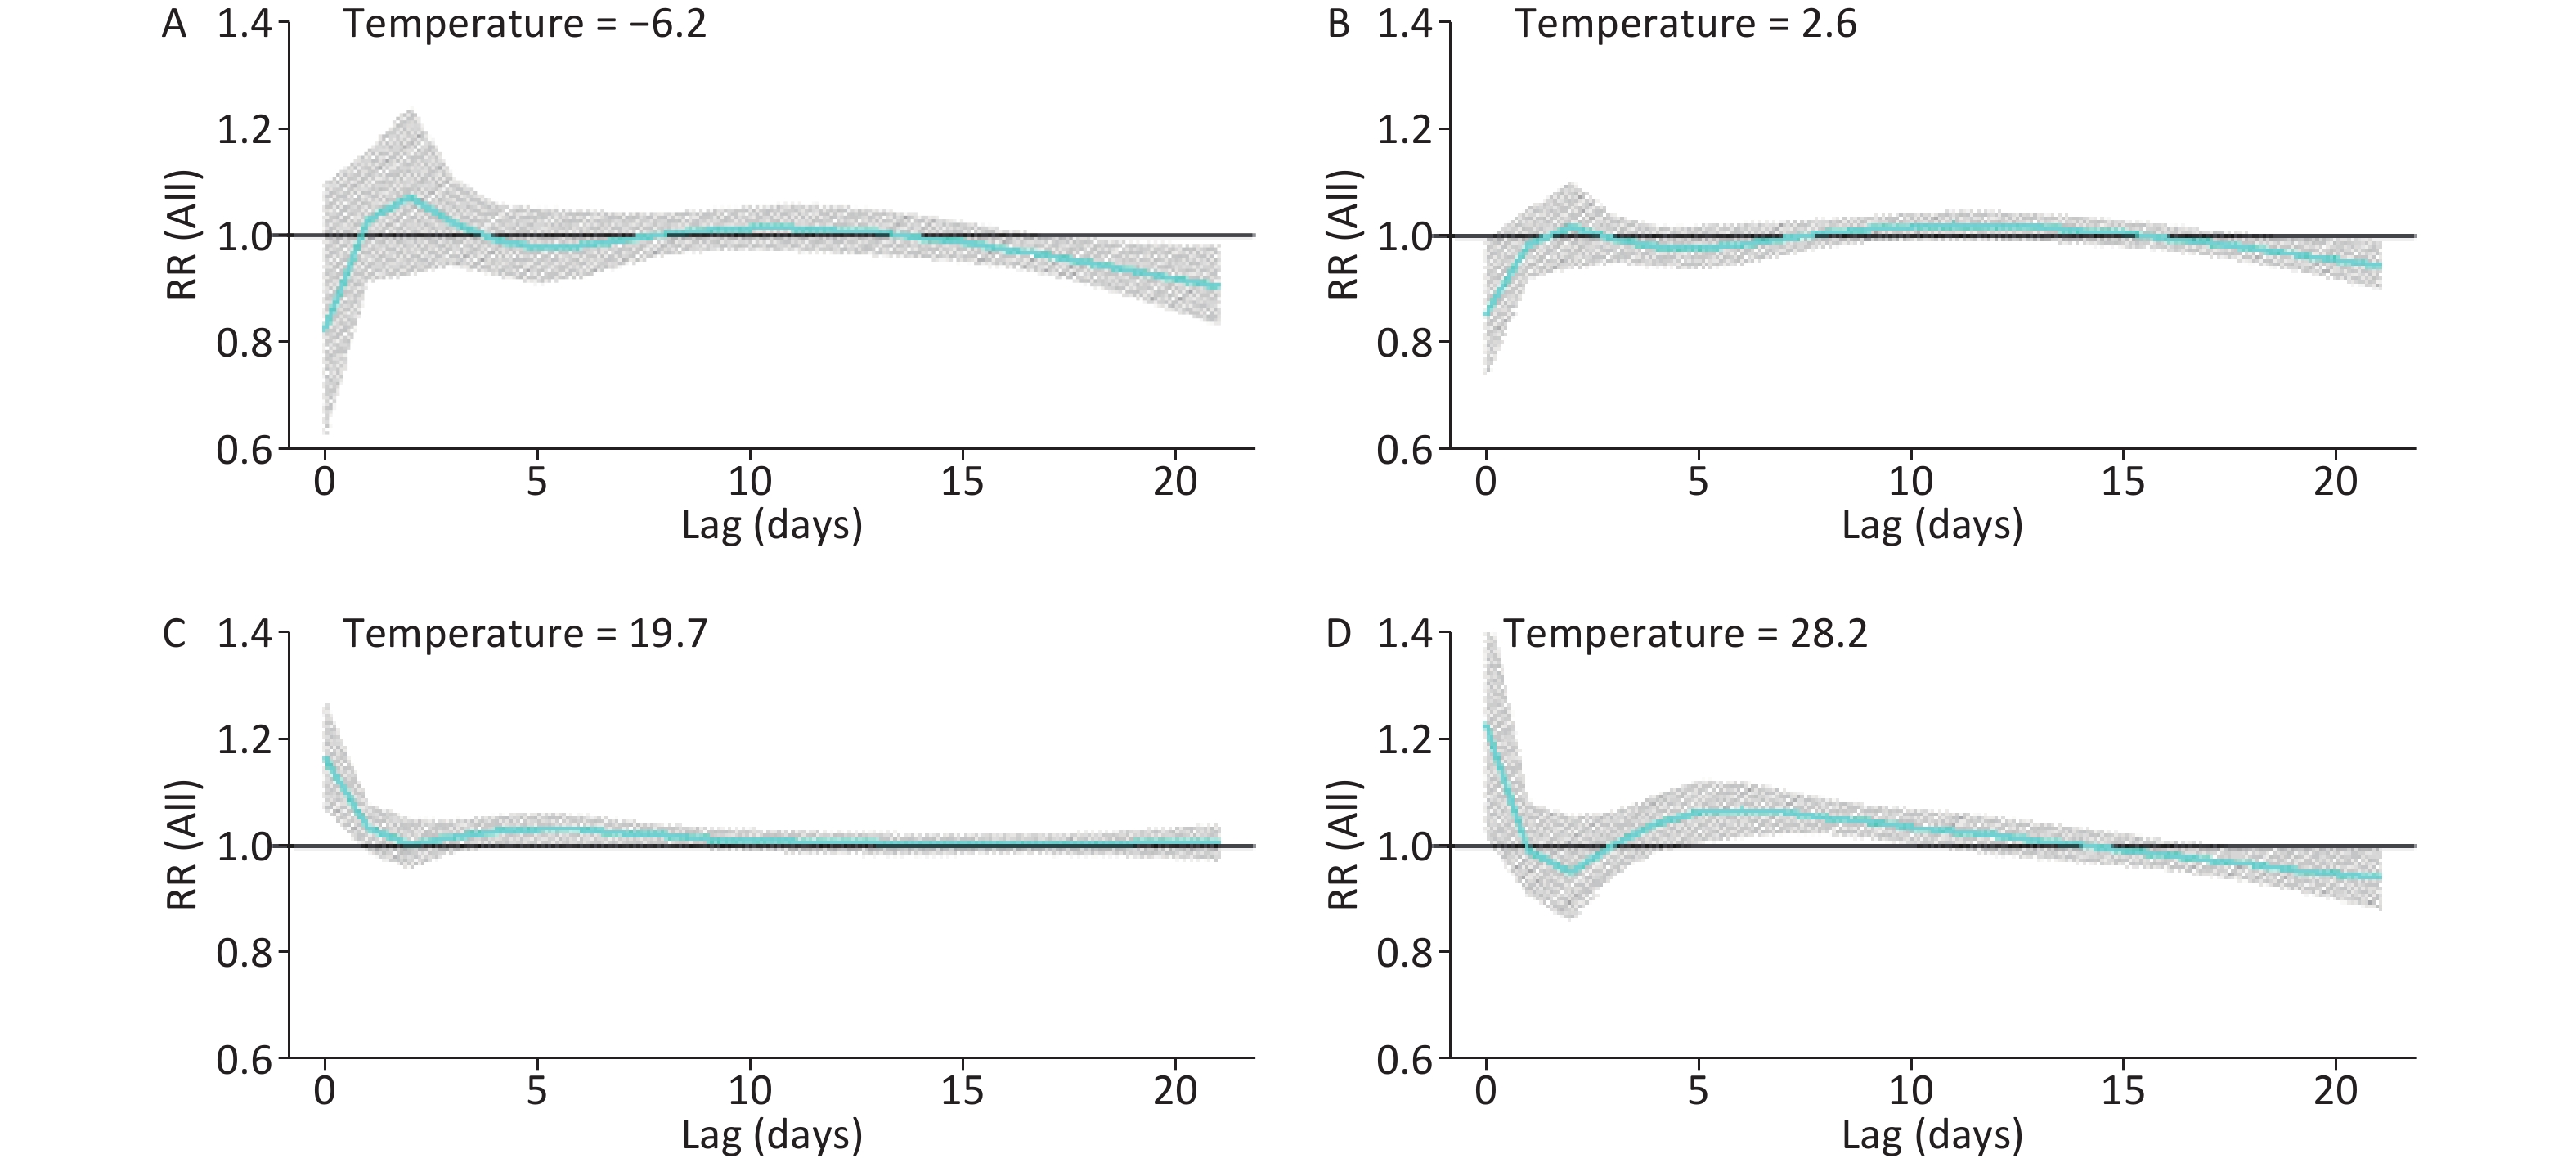
Variables Temperature RH AH PM10 PM2.5 SO2 NO2 CO O3 Temperature 1.00 RH −0.05 1.00 AH 0.88* 0.42* 1.00 PM10 −0.30* −0.31* −0.43* 1.00 PM2.5 −0.42* −0.01 −0.39* 0.80* 1.00 SO2 −0.64* −0.17* −0.67* 0.55* 0.66* 1.00 NO2 −0.26* −0.08* −0.29* 0.57* 0.58* 0.53* 1.00 CO −0.52* 0.05 −0.46* 0.51* 0.70* 0.79* 0.67* 1.00 O3 0.63* −0.32* 0.42* −0.33* −0.52* −0.63* −0.43* −0.66* 1.00 Note. *P < 0.05. RH, relative humidity; AH, absolute humidity; PM2.5, particulate matter with aerodynamic diameter ≤ 2.5 μm; PM10, particulate matter with aerodynamic diameter ≤ 10 μm; NO2, nitrogen dioxide; SO2, sulfur dioxide; CO, carbon monoxide; O3, ozone. For total eczema outpatients, the maximum effect [1.23 (95% CI: 1.02, 1.48)] occurred for higher temperature (28.2 °C) at lag 0 (Figure 1D), which was similar to those studies that were carried out in other cities of China, such as Shanghai and Chengdu, with different climates. High temperature possibly increases sweating, which is one of the triggers to itch mediated by the acidic pH of sweat, that possibly promotes the Th-2 inflammation and neuroanatomic stimulation of C nerve fiber[19]. High temperature may also suppress the gut microbiota and decrease their diversity[20] to alternate the immune system and thereby increase inflammation[21], which may contribute to the occurrence of eczema.
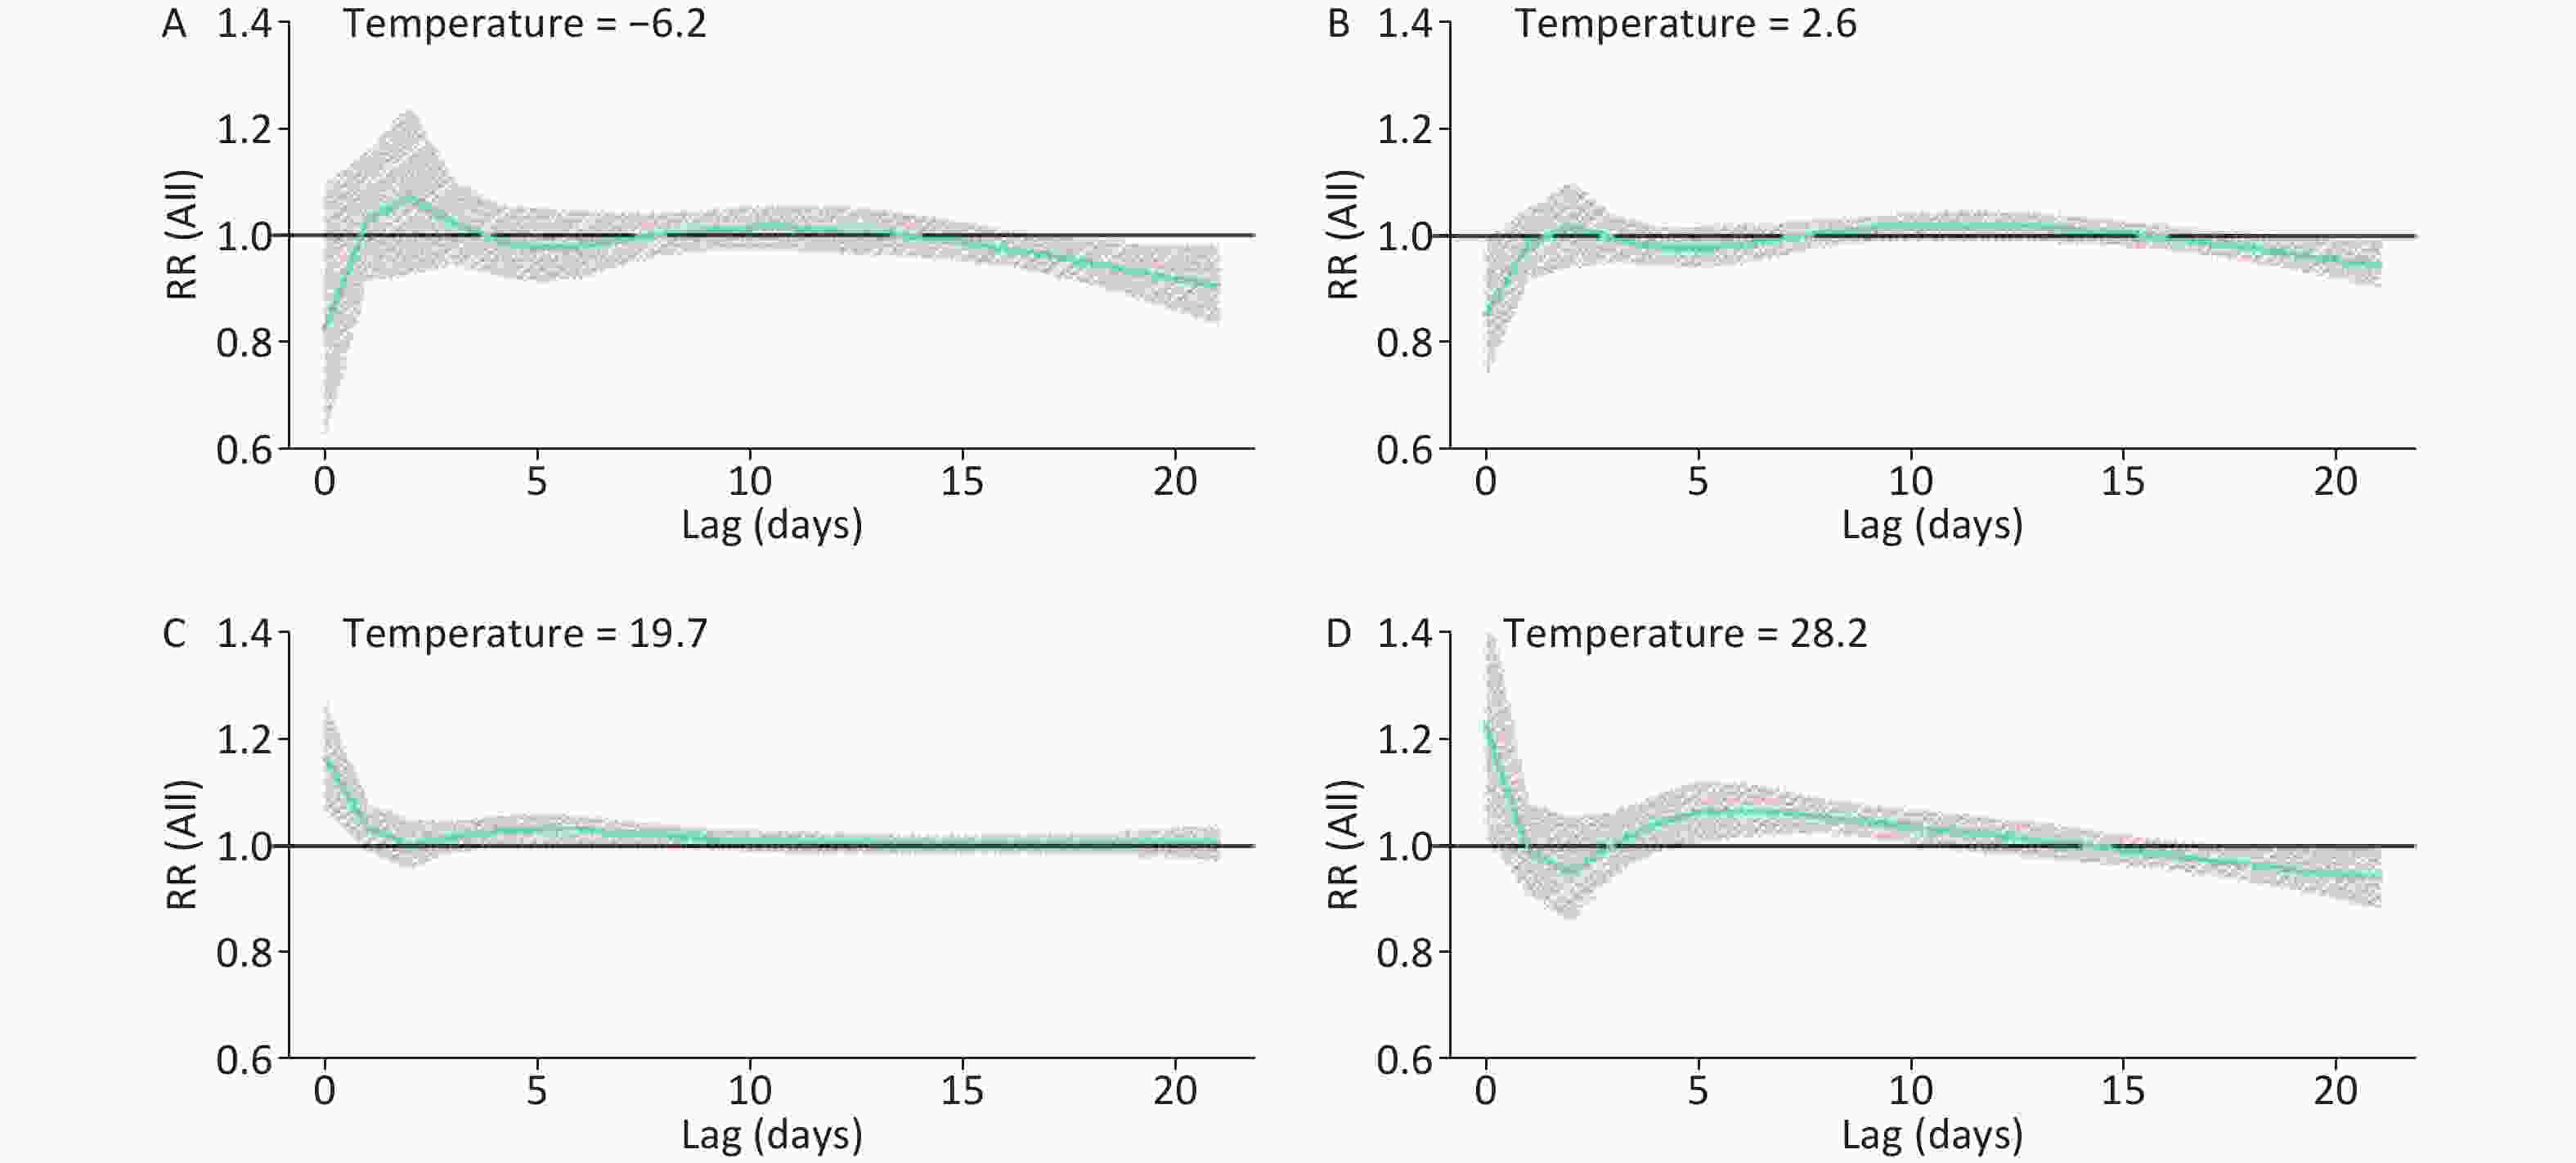
Figure 1. Lag effects of temperature (°C) on daily outpatients with eczema in Lanzhou, China during 2014–2016. The bold lines are the effect estimates and the grey areas represent 95% confidential intervals. [1st percentile: −6.2 °C (A); 25th percentile: 2.6 °C (B); 75th percentile: 19.7 °C (C); 99th percentile: 28.2 °C (D)]. RR, relative risk.
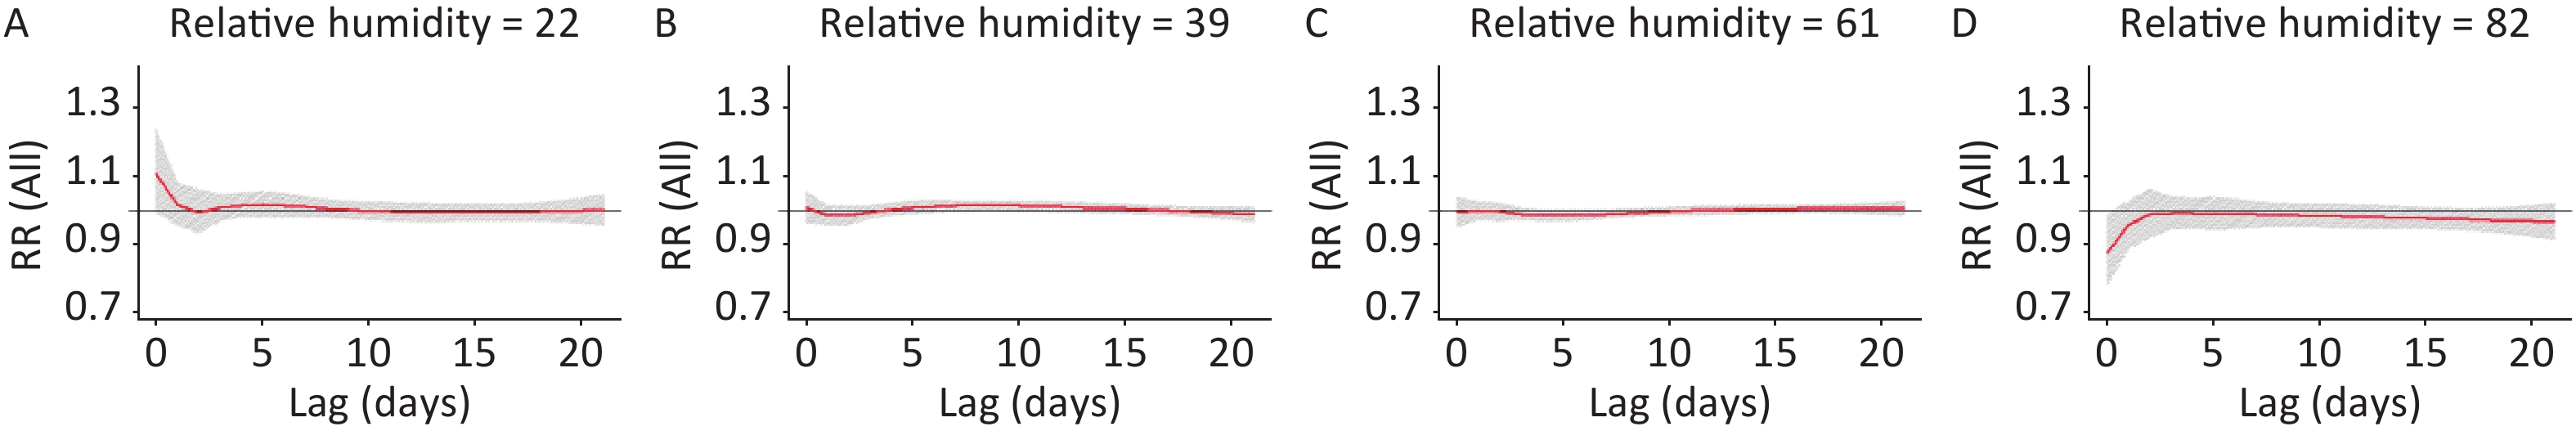
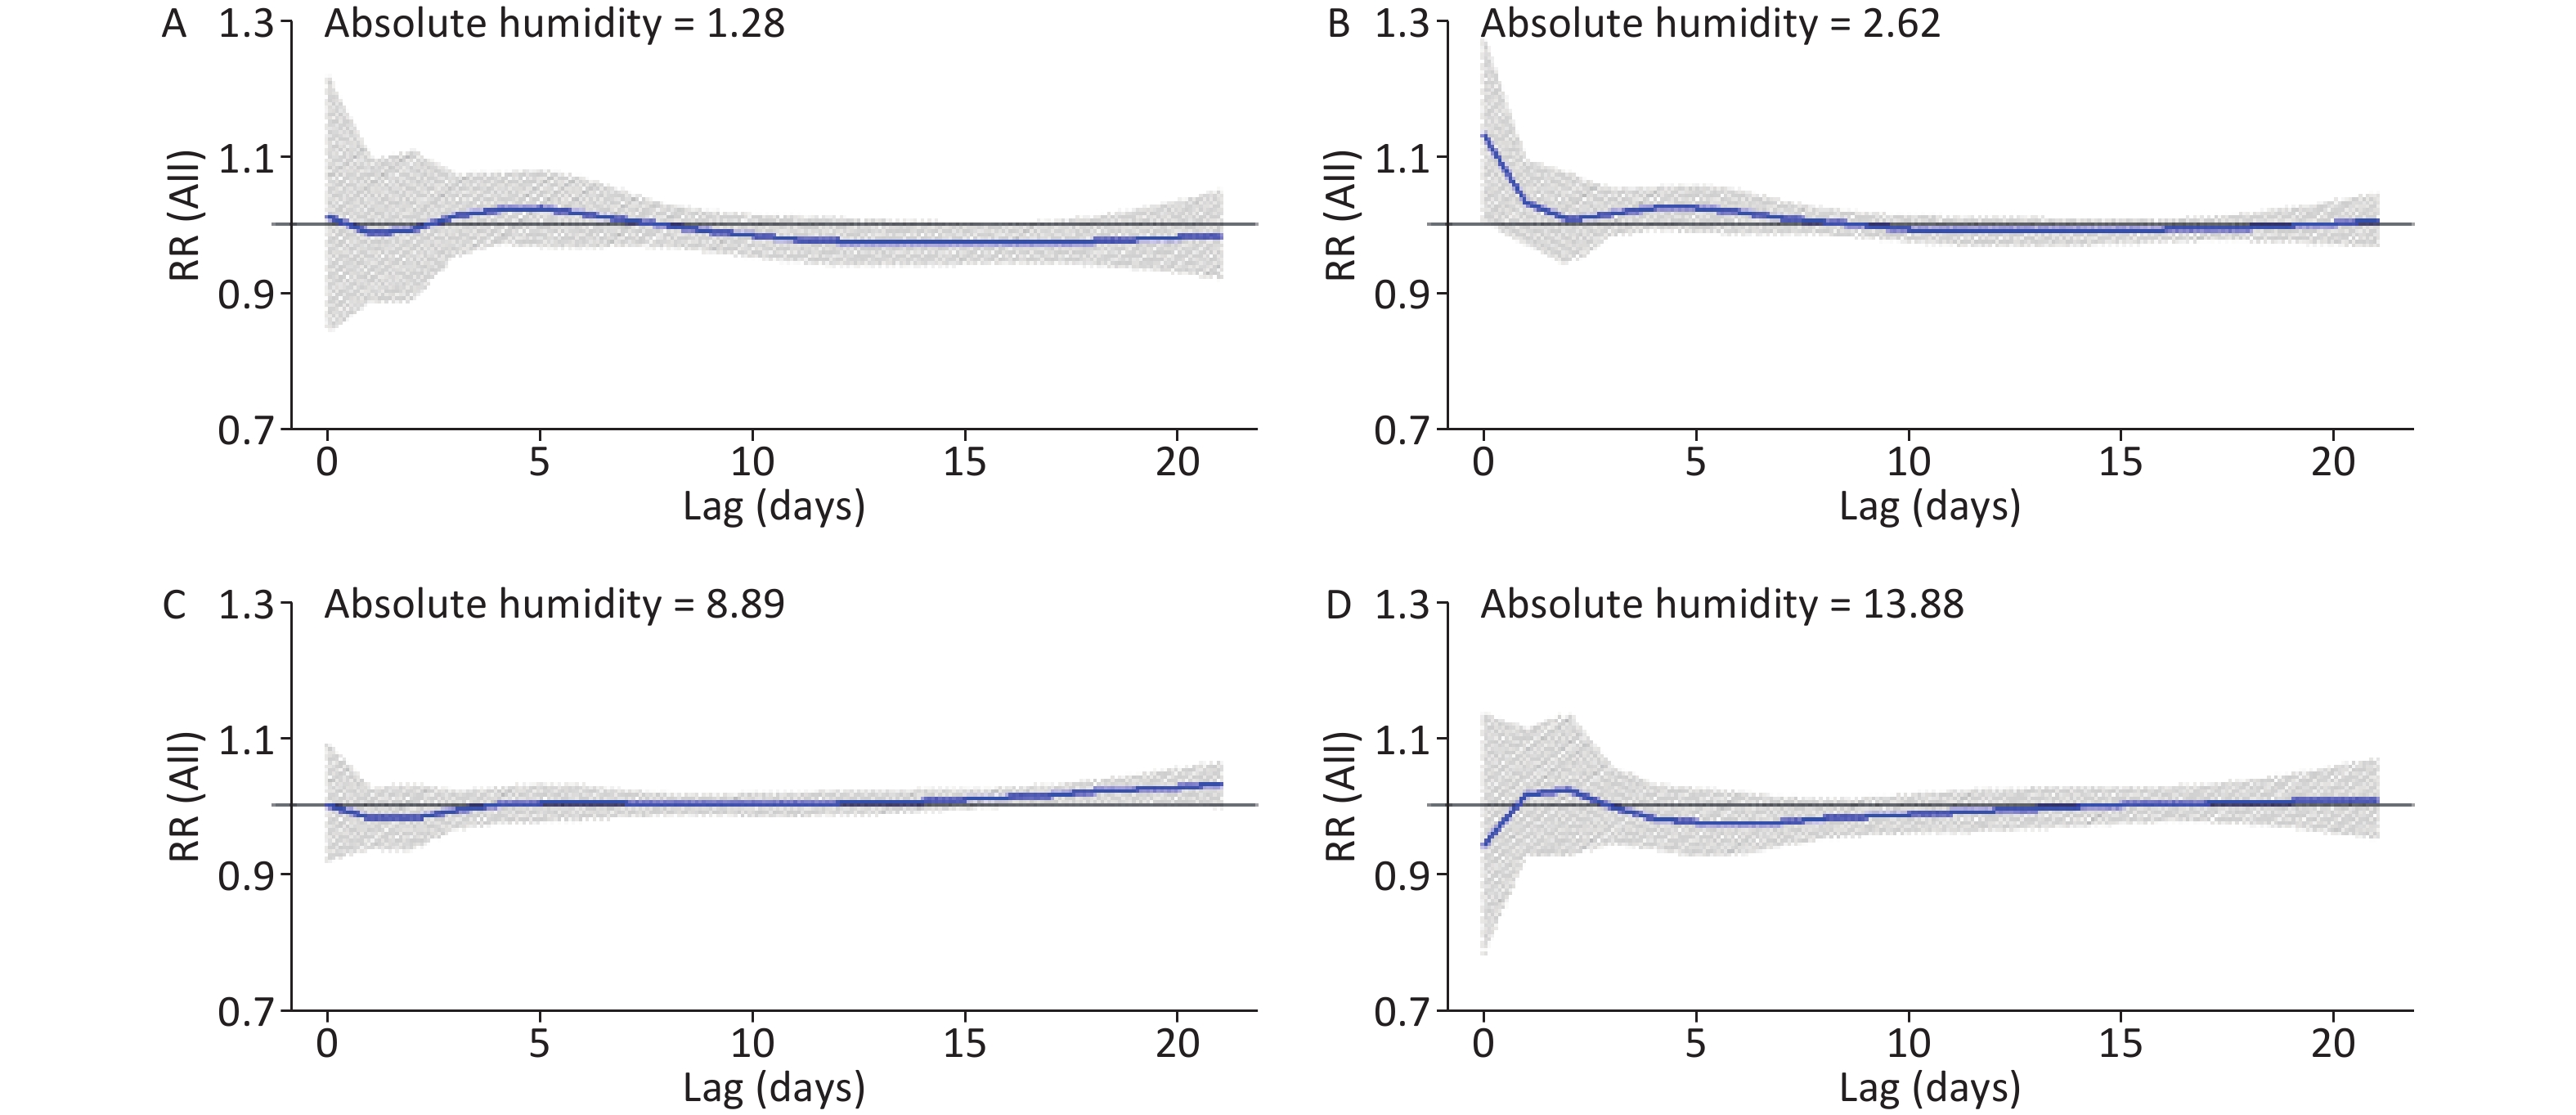
The significant RRs of total eczema outpatients were only observed at low RH (39%) (Supplementary Figure S3B available in www.besjournal.com), whereas the maximum adverse effect [1.02 (95% CI: 1.00, 1.03)] appeared at lag 8, which were all consistent with the studies carried out in the U.S.[22] and other cities of China[3, 23]. Low humidity can increase skin roughness [24] and disturb the skin’s barrier function[25], which accelerates the dehydration of the stratum corneum under high temperature and finally leads to mild eczema[26]. However, the significant RRs of total eczema outpatients were observed at low (2.62 g/m3) (Figure 2B) and high AH (8.89 g/m3) (Figure 2C), and the strongest adverse effect [1.13 (95% CI: 1.01, 1.28)] appeared at low AH (2.62 g/m3) at lag 0. This finding may indicate the adverse effect of high humidity, which was similar to the results of a cohort study over children in the U.S. and a survey over 20,000 school children in Spain on atopic eczema with RH[2, 27]. A possible explanation is that increases in AH decrease evaporative heat loss from the respiratory tract and evaporative heat loss due to sweating and ultimately increase core heating[28]. Thus, the application of RH may lead to an underestimation of the adverse effects of humidity on eczema; hence, additional studies should be conducted to assess the effects of AH on eczema and other outcomes.
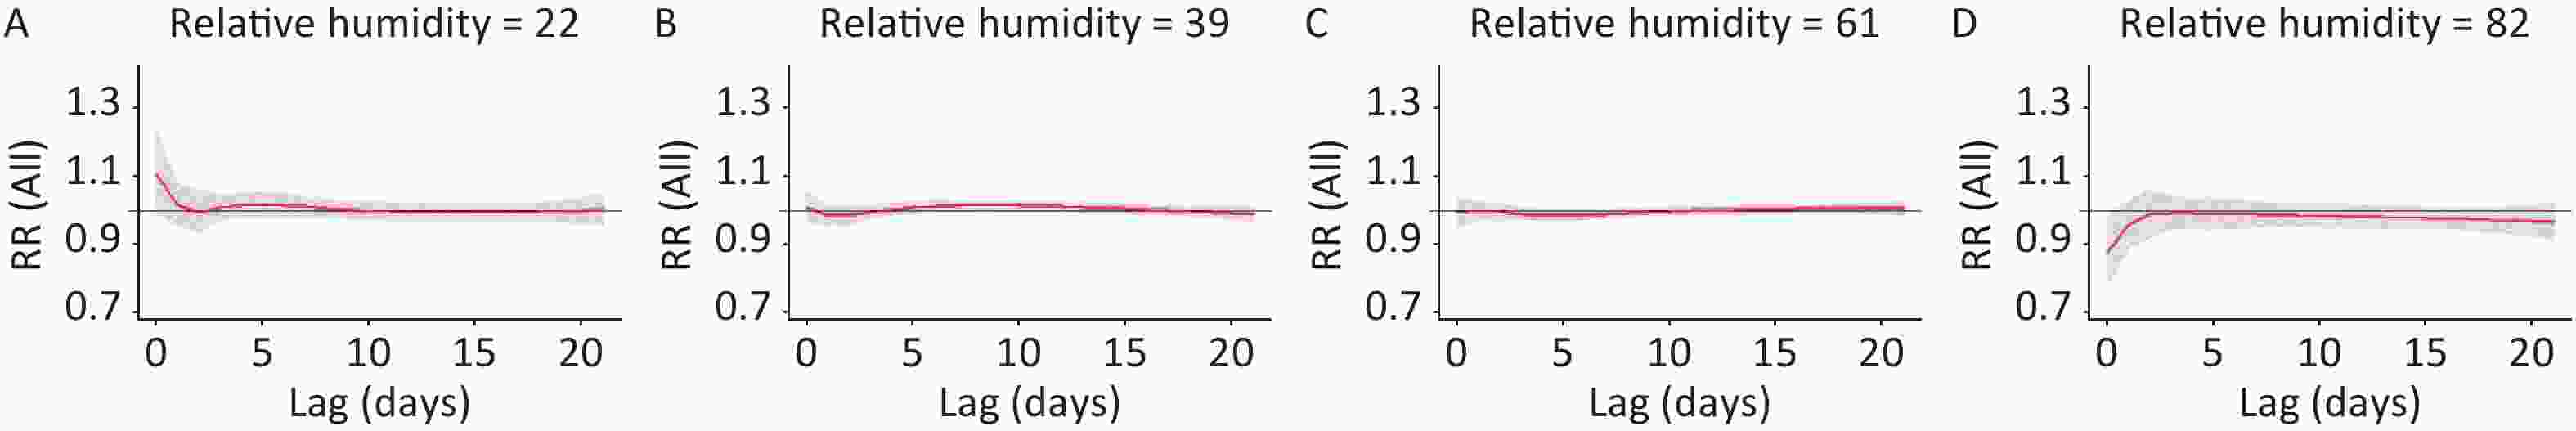
Figure S3. Lag effects of relative humidity (%) on daily outpatients with eczema in Lanzhou, China during 2014–2016. The bold lines are the effect estimates and the grey areas represent 95% confidential intervals. [1st percentile: 22% (A); 25th percentile: 39% (B); 75th percentile: 61% (C); 99th percentile: 82% (D)]. RR, relative risk.
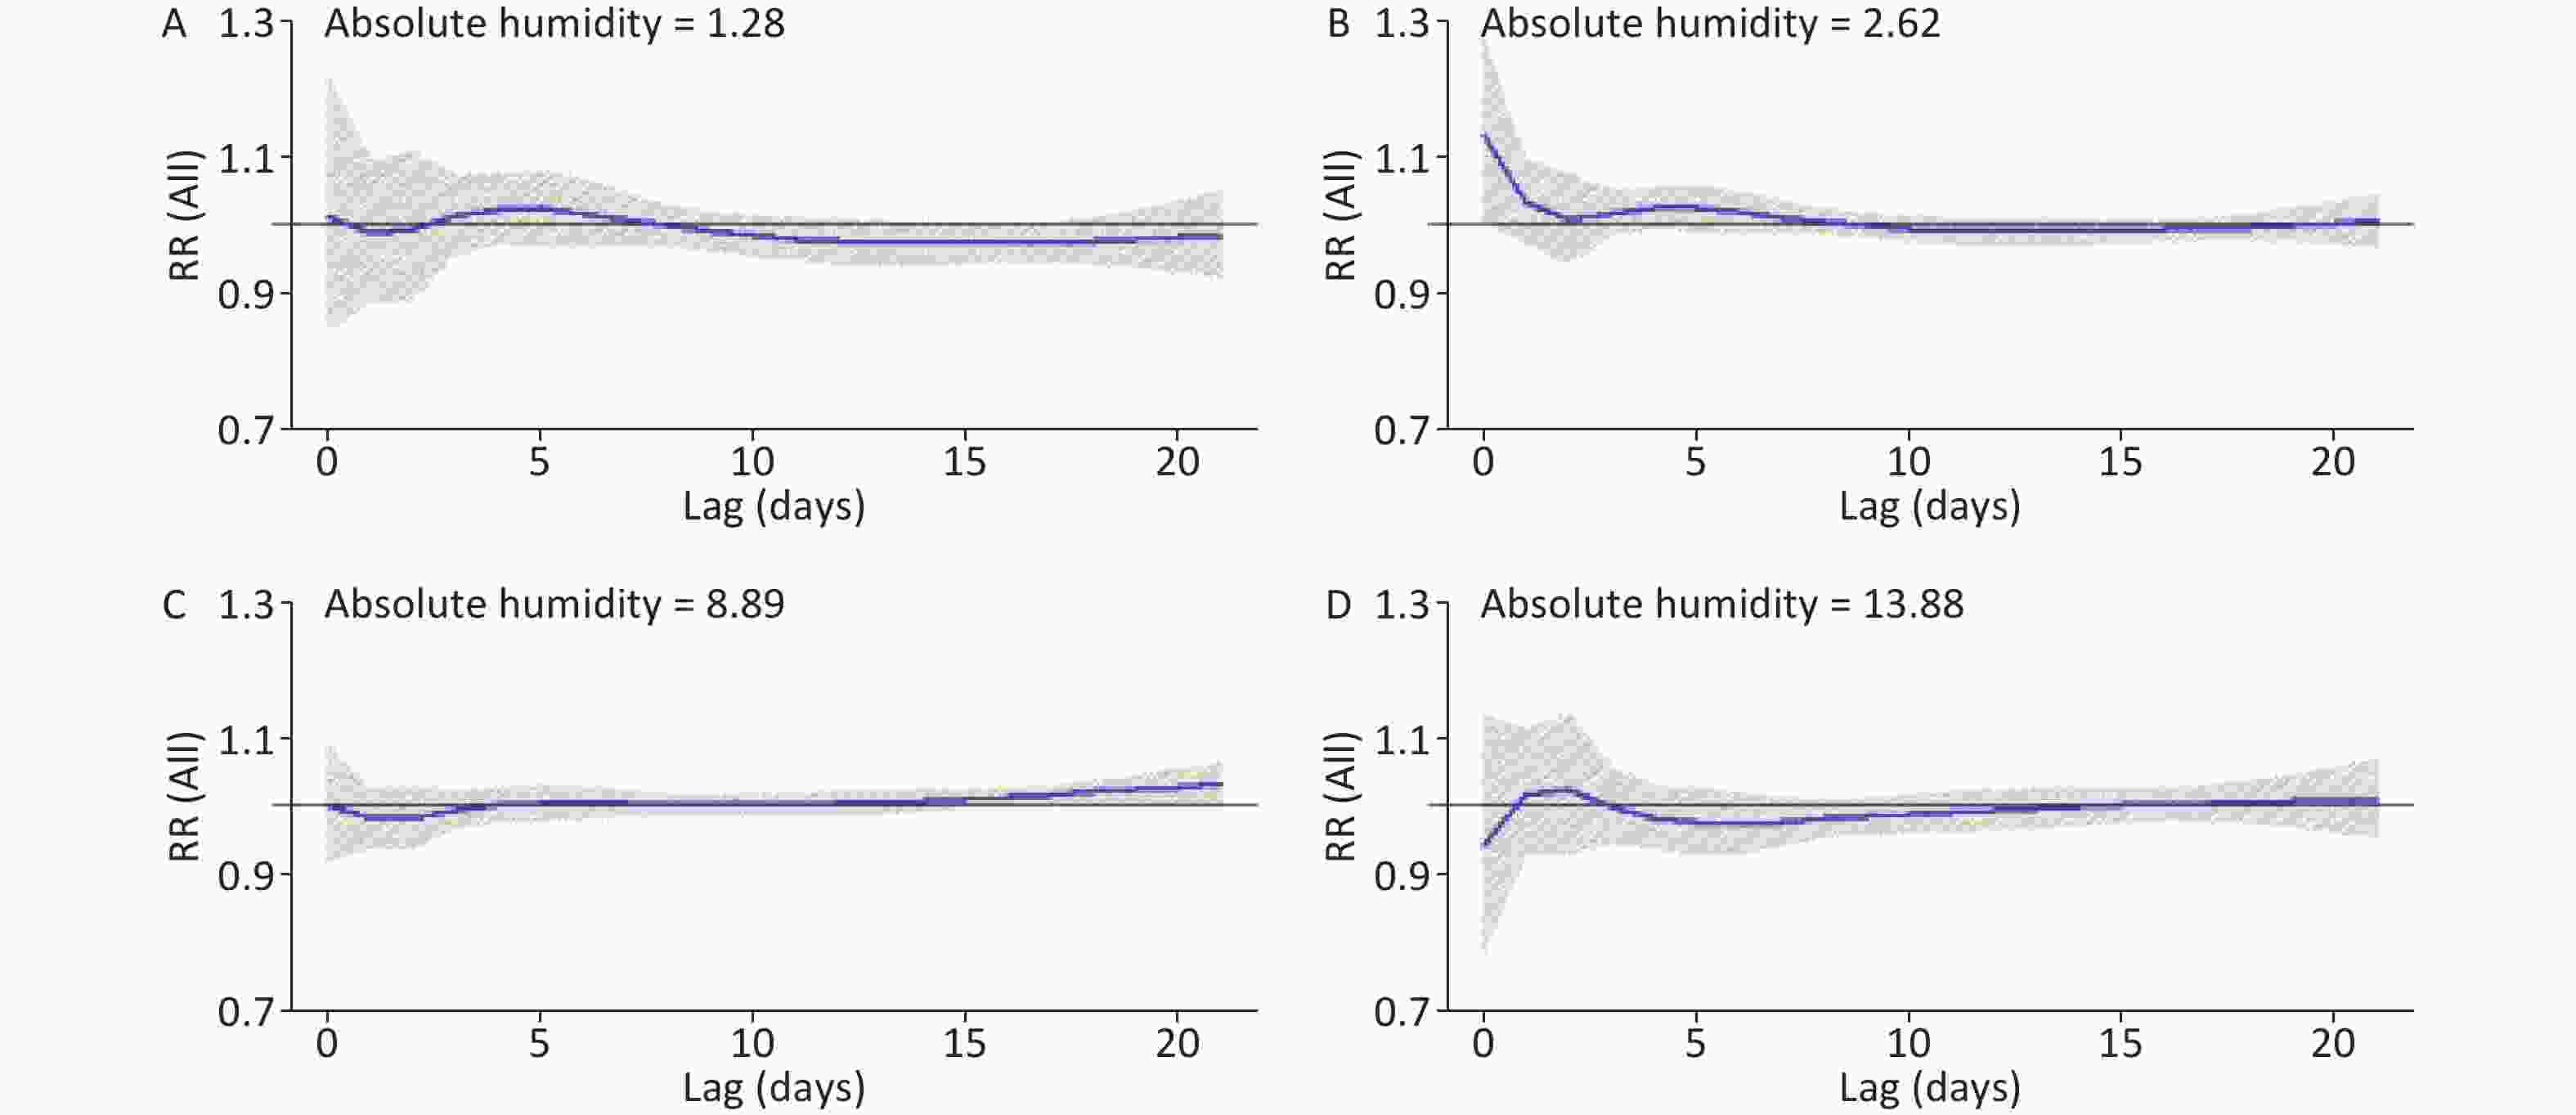
Figure 2. Lag effects of absolute humidity (g/m3) on daily outpatients with eczema in Lanzhou, China during 2014–2016. The bold lines are the effect estimates and the grey areas represent 95% confidential intervals. [1st percentile: 1.28 g/m3 (A); 25th percentile: 2.62 g/m3 (B); 75th percentile: 8.89 g/m3 (C); 99th percentile: 13.88 g/m3 (D)]. RR, relative risk.
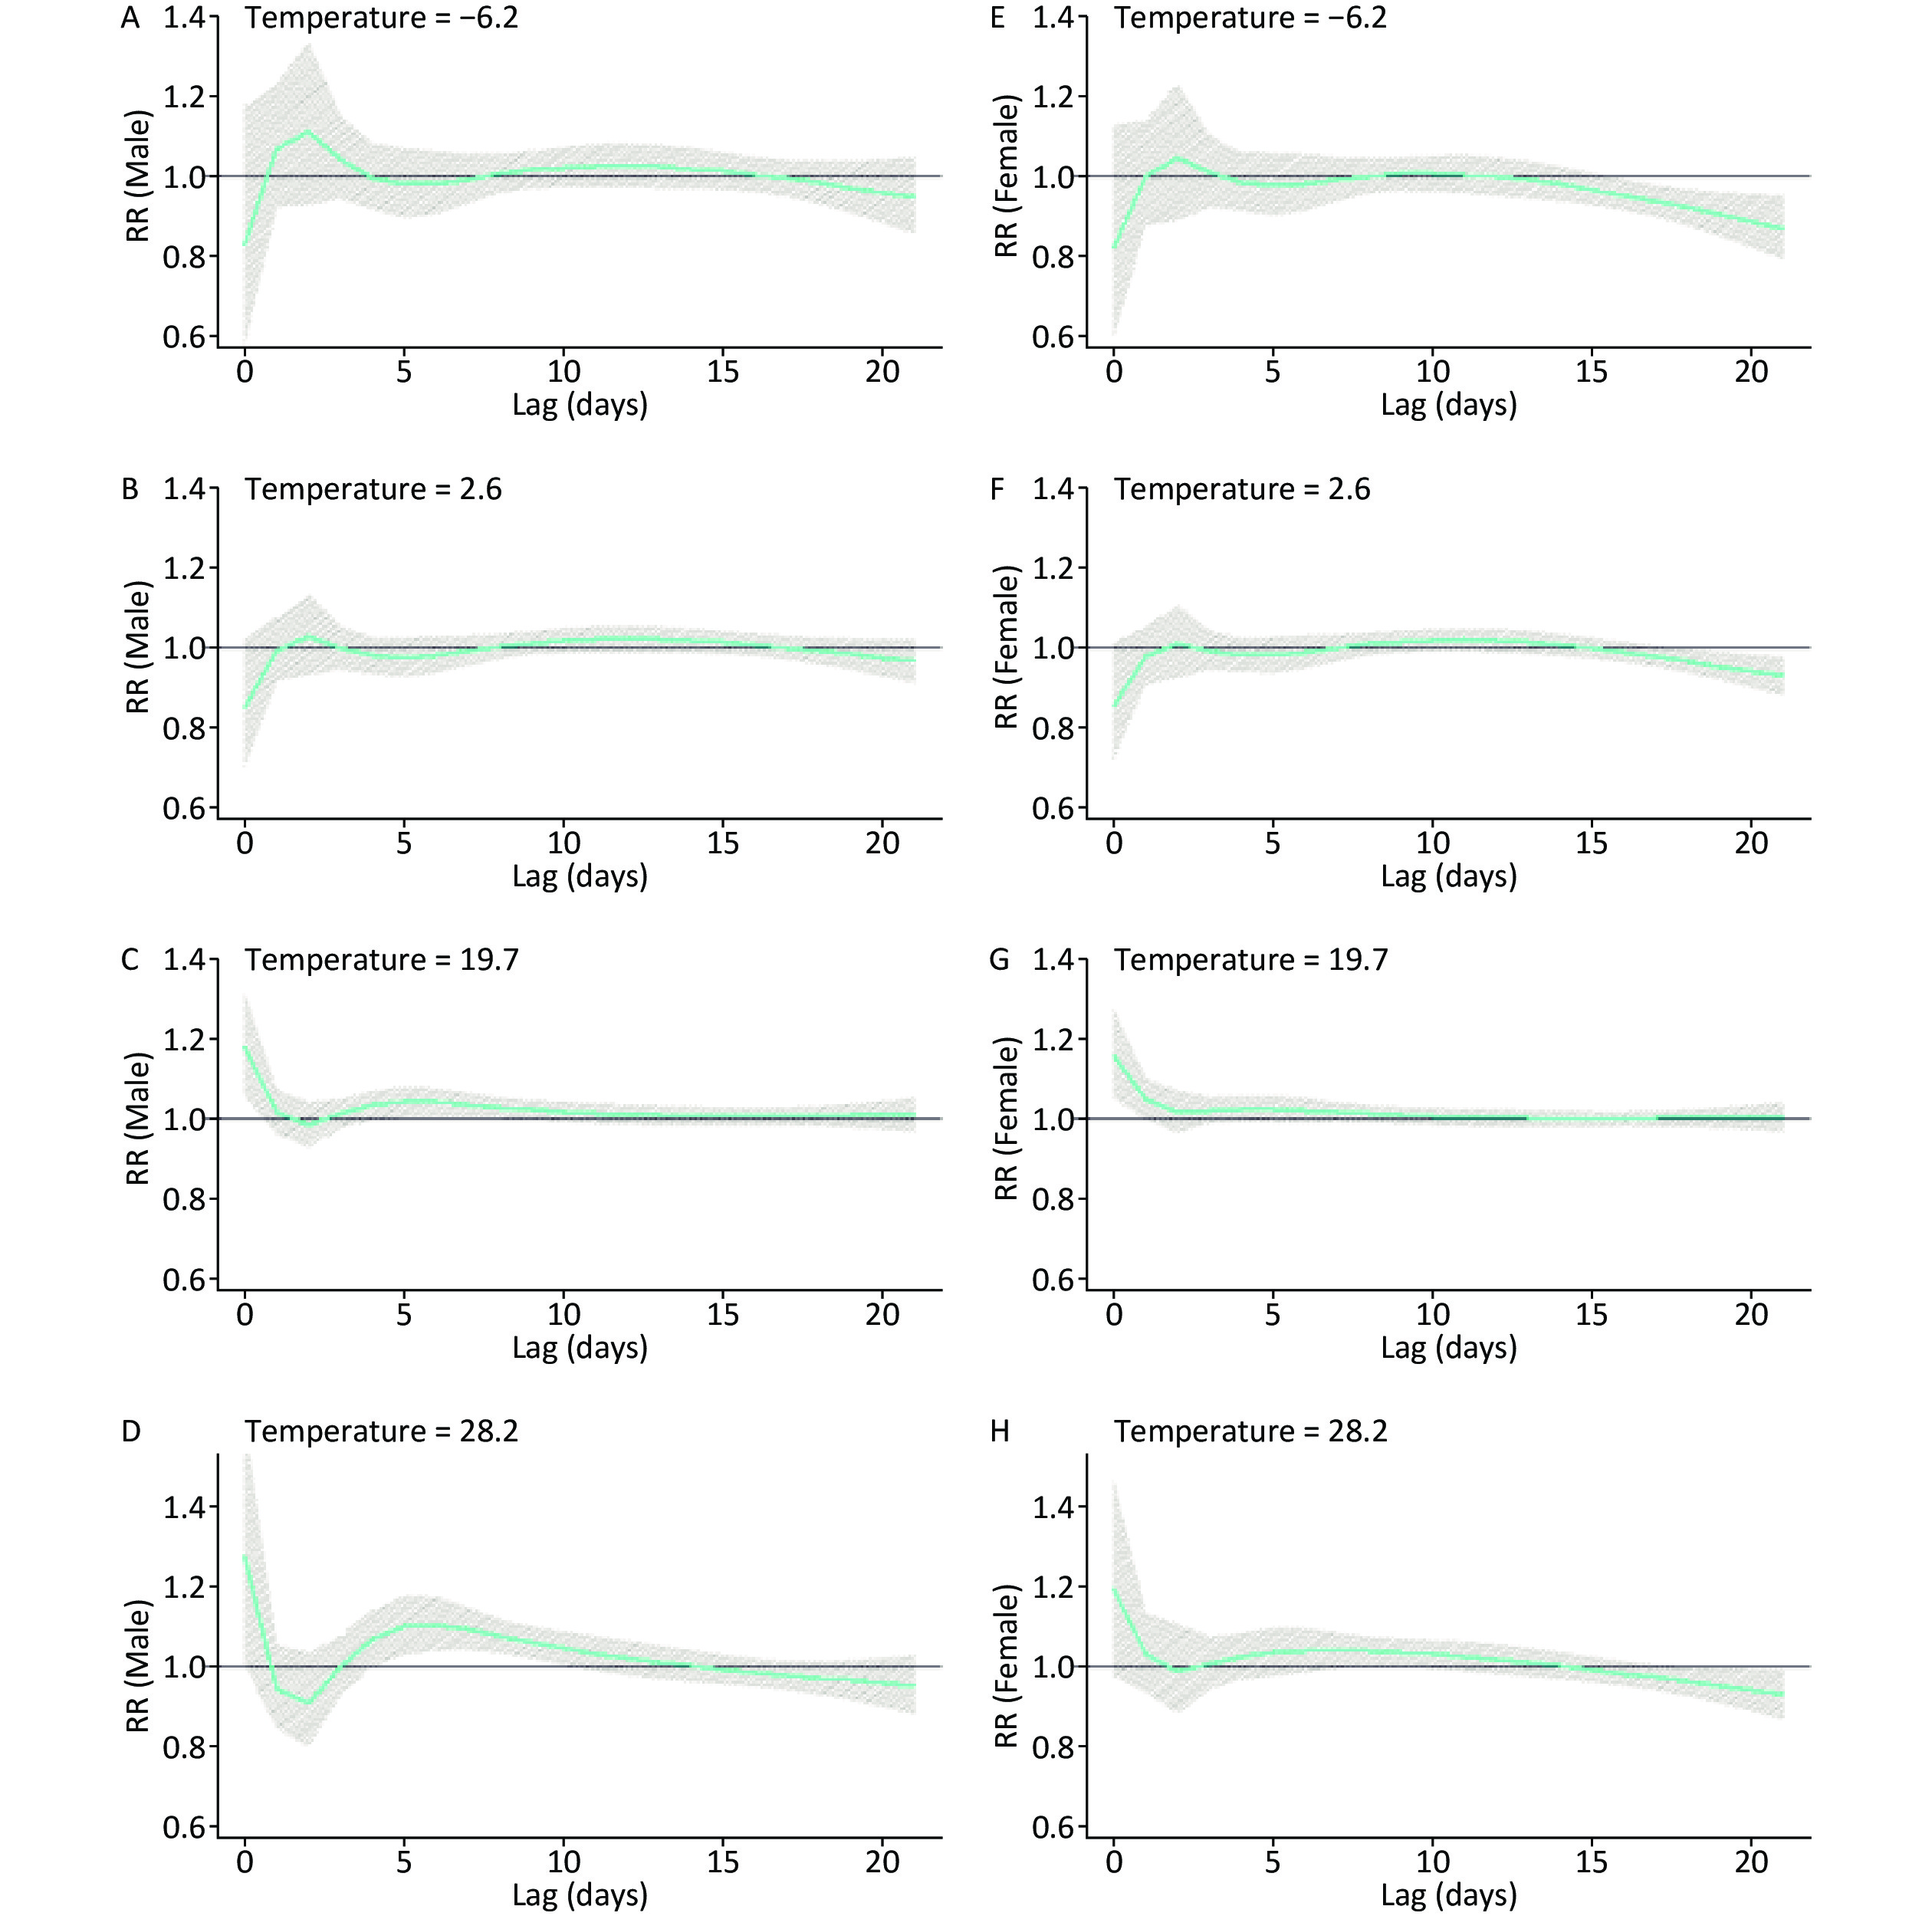
With regard to the effects of weather factors on sex, the associations of high temperature with eczema outpatient visits were stronger among males than females (Supplementary Figure S4 available in www.besjournal.com). While, the effects of high AH on eczema outpatient visits were stronger among females than males (Supplementary Table S3 available in www.besjournal.com). To consider aging susceptibility, high temperature (Supplementary Figure S5 available in www.besjournal.com) and high AH (Supplementary Figure S6I available in www.besjournal.com) displayed stronger adverse effects among younger people, and low AH (Supplementary Figure S6F available in www.besjournal.com) was positively associated with people aged 15–34 years. No studies have evaluated the effects of meteorological factors on eczema across different age groups. Thus, this study provides scientific evidence for significant associations between meteorological factors and eczema stratified by age. In addition, approximately 18% of eczema outpatients and 5,408 eczema outpatients might be attributed to abnormal temperature. However, considering that no significant maximum effects of temperature on people aged > 60 years and AH on eczema were observed, we set the number of cases to zero (Table 1).
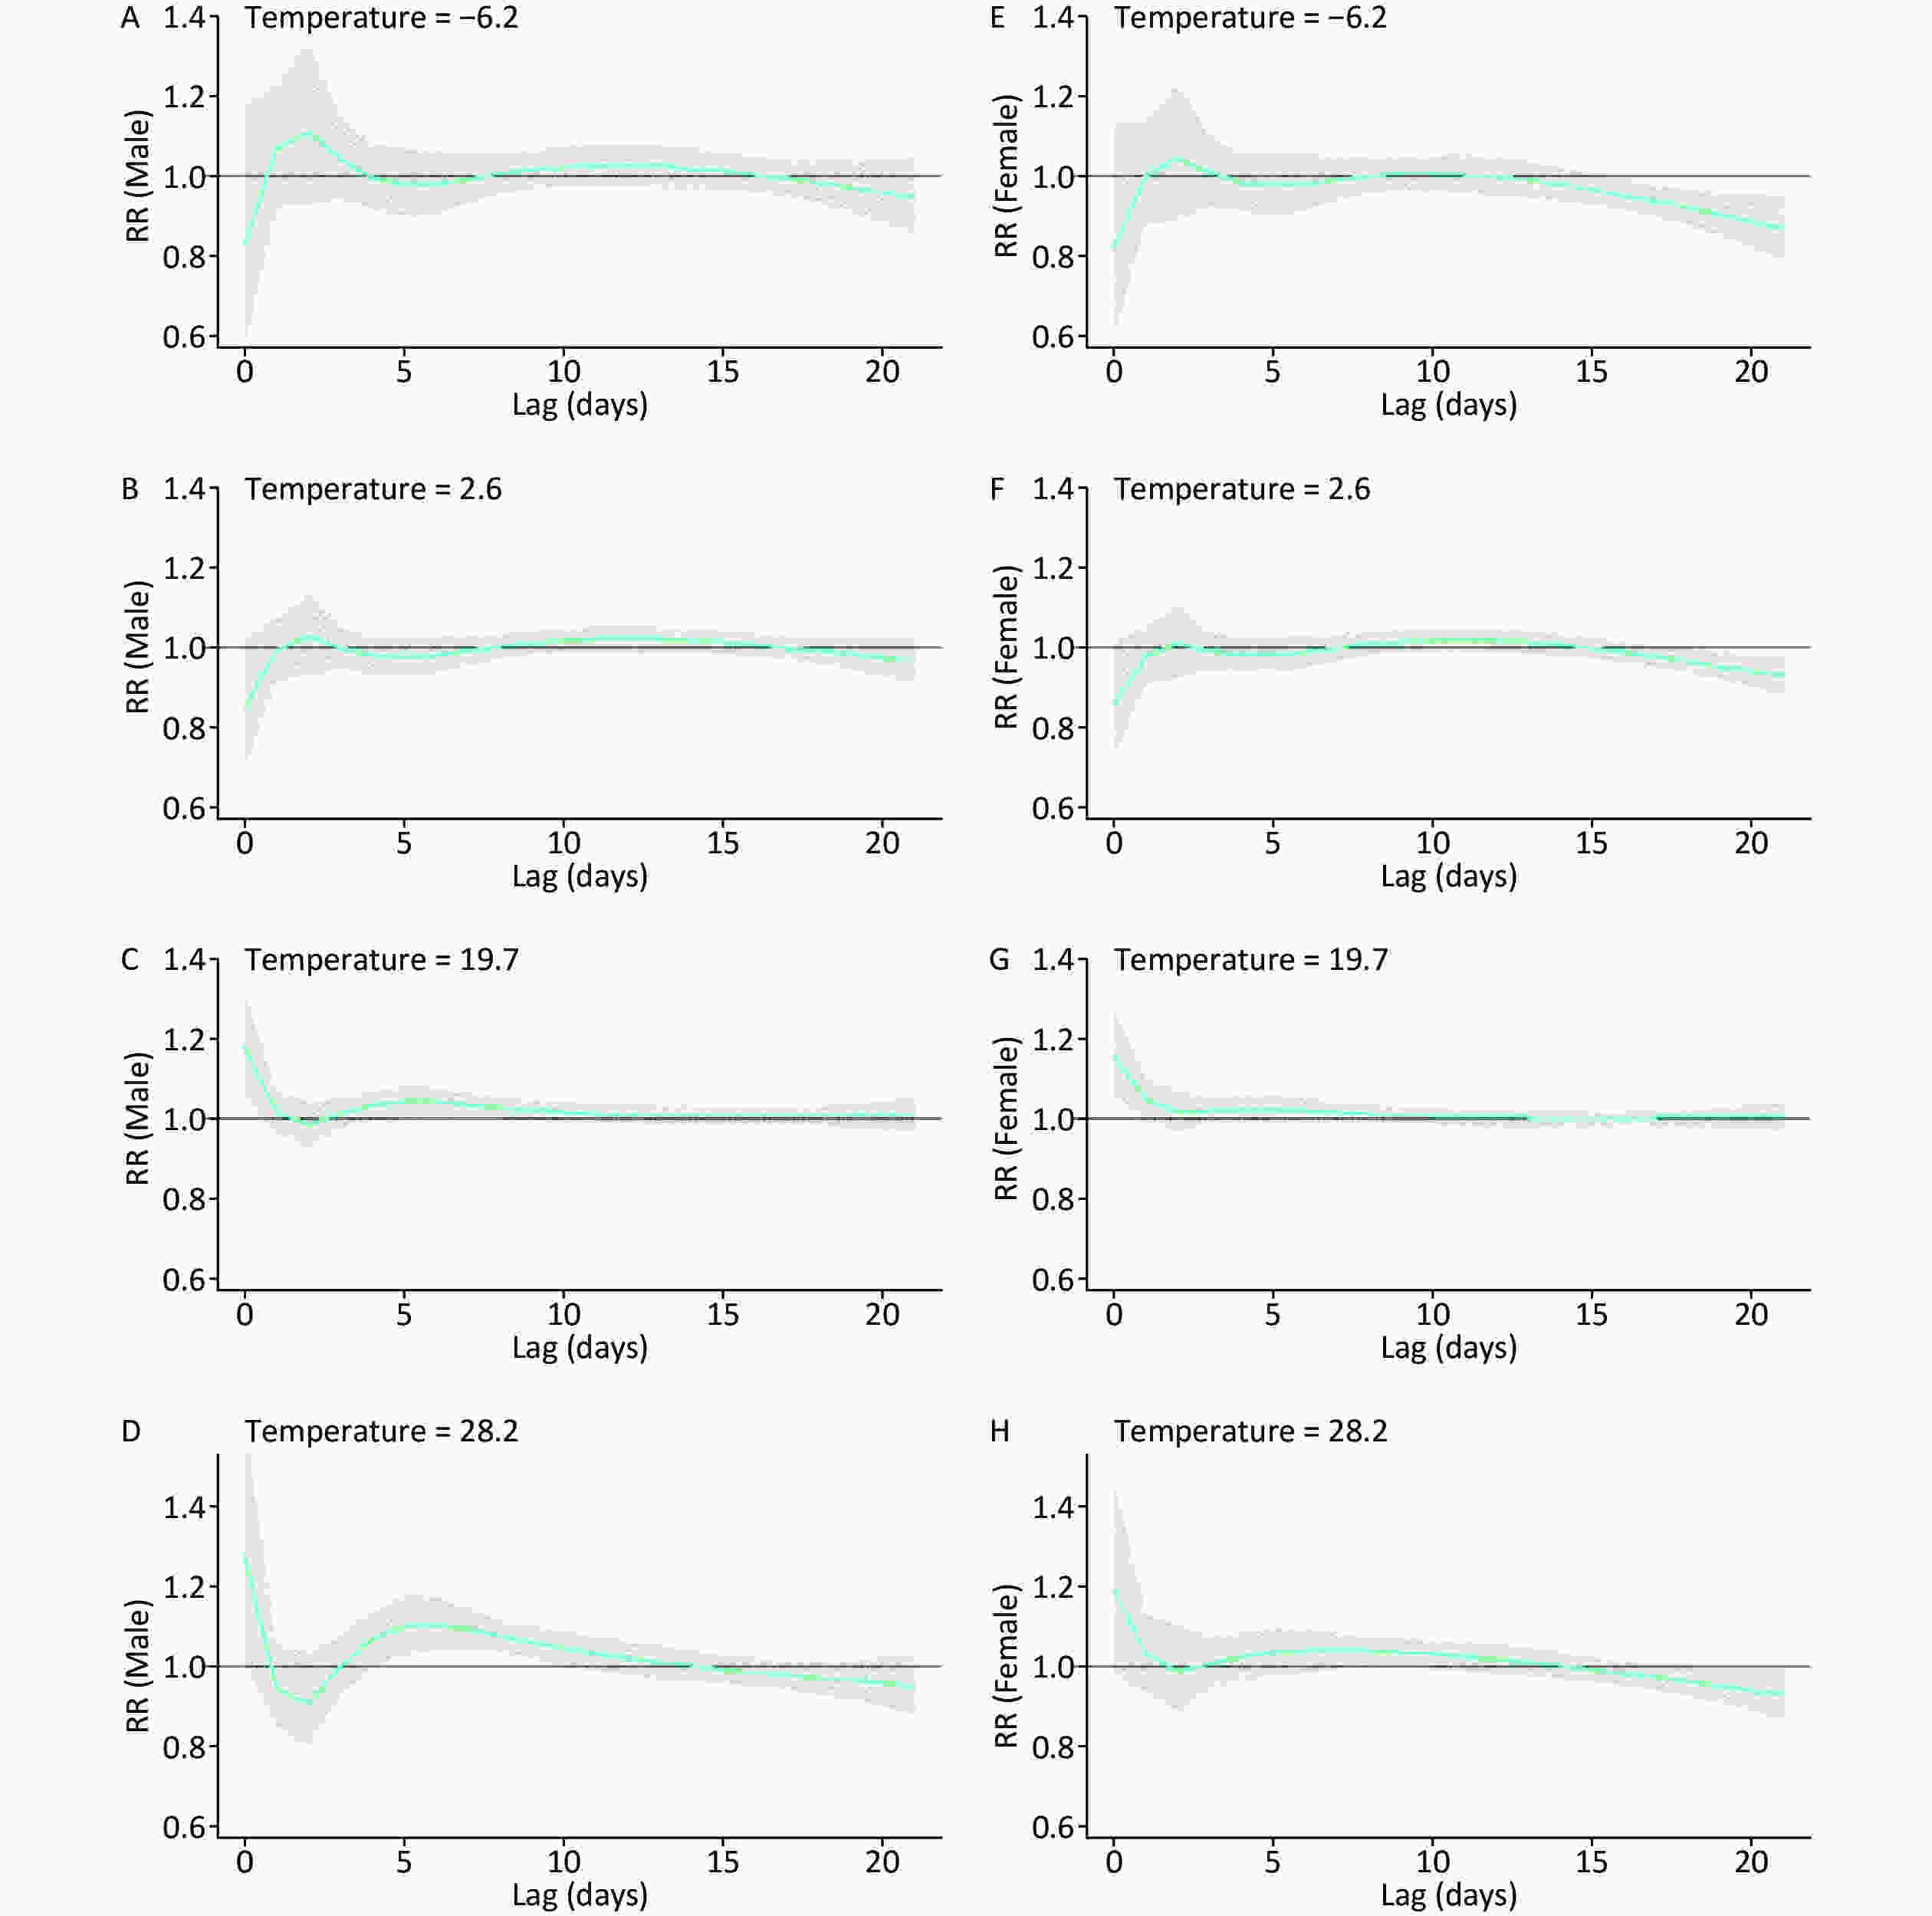
Figure S4. Lag effects of temperature (°C) on sex specific daily outpatients with eczema in Lanzhou, China during 2014–2016. The bold lines are the effect estimates and the grey areas represent 95% confidential intervals. [1st percentile: −6.2 °C (A, E); 25th percentile: 2.6 °C (B, F); 75th percentile: 19.7 °C (C, G); 99th percentile: 28.2 °C (D, H)]. RR, relative risk.
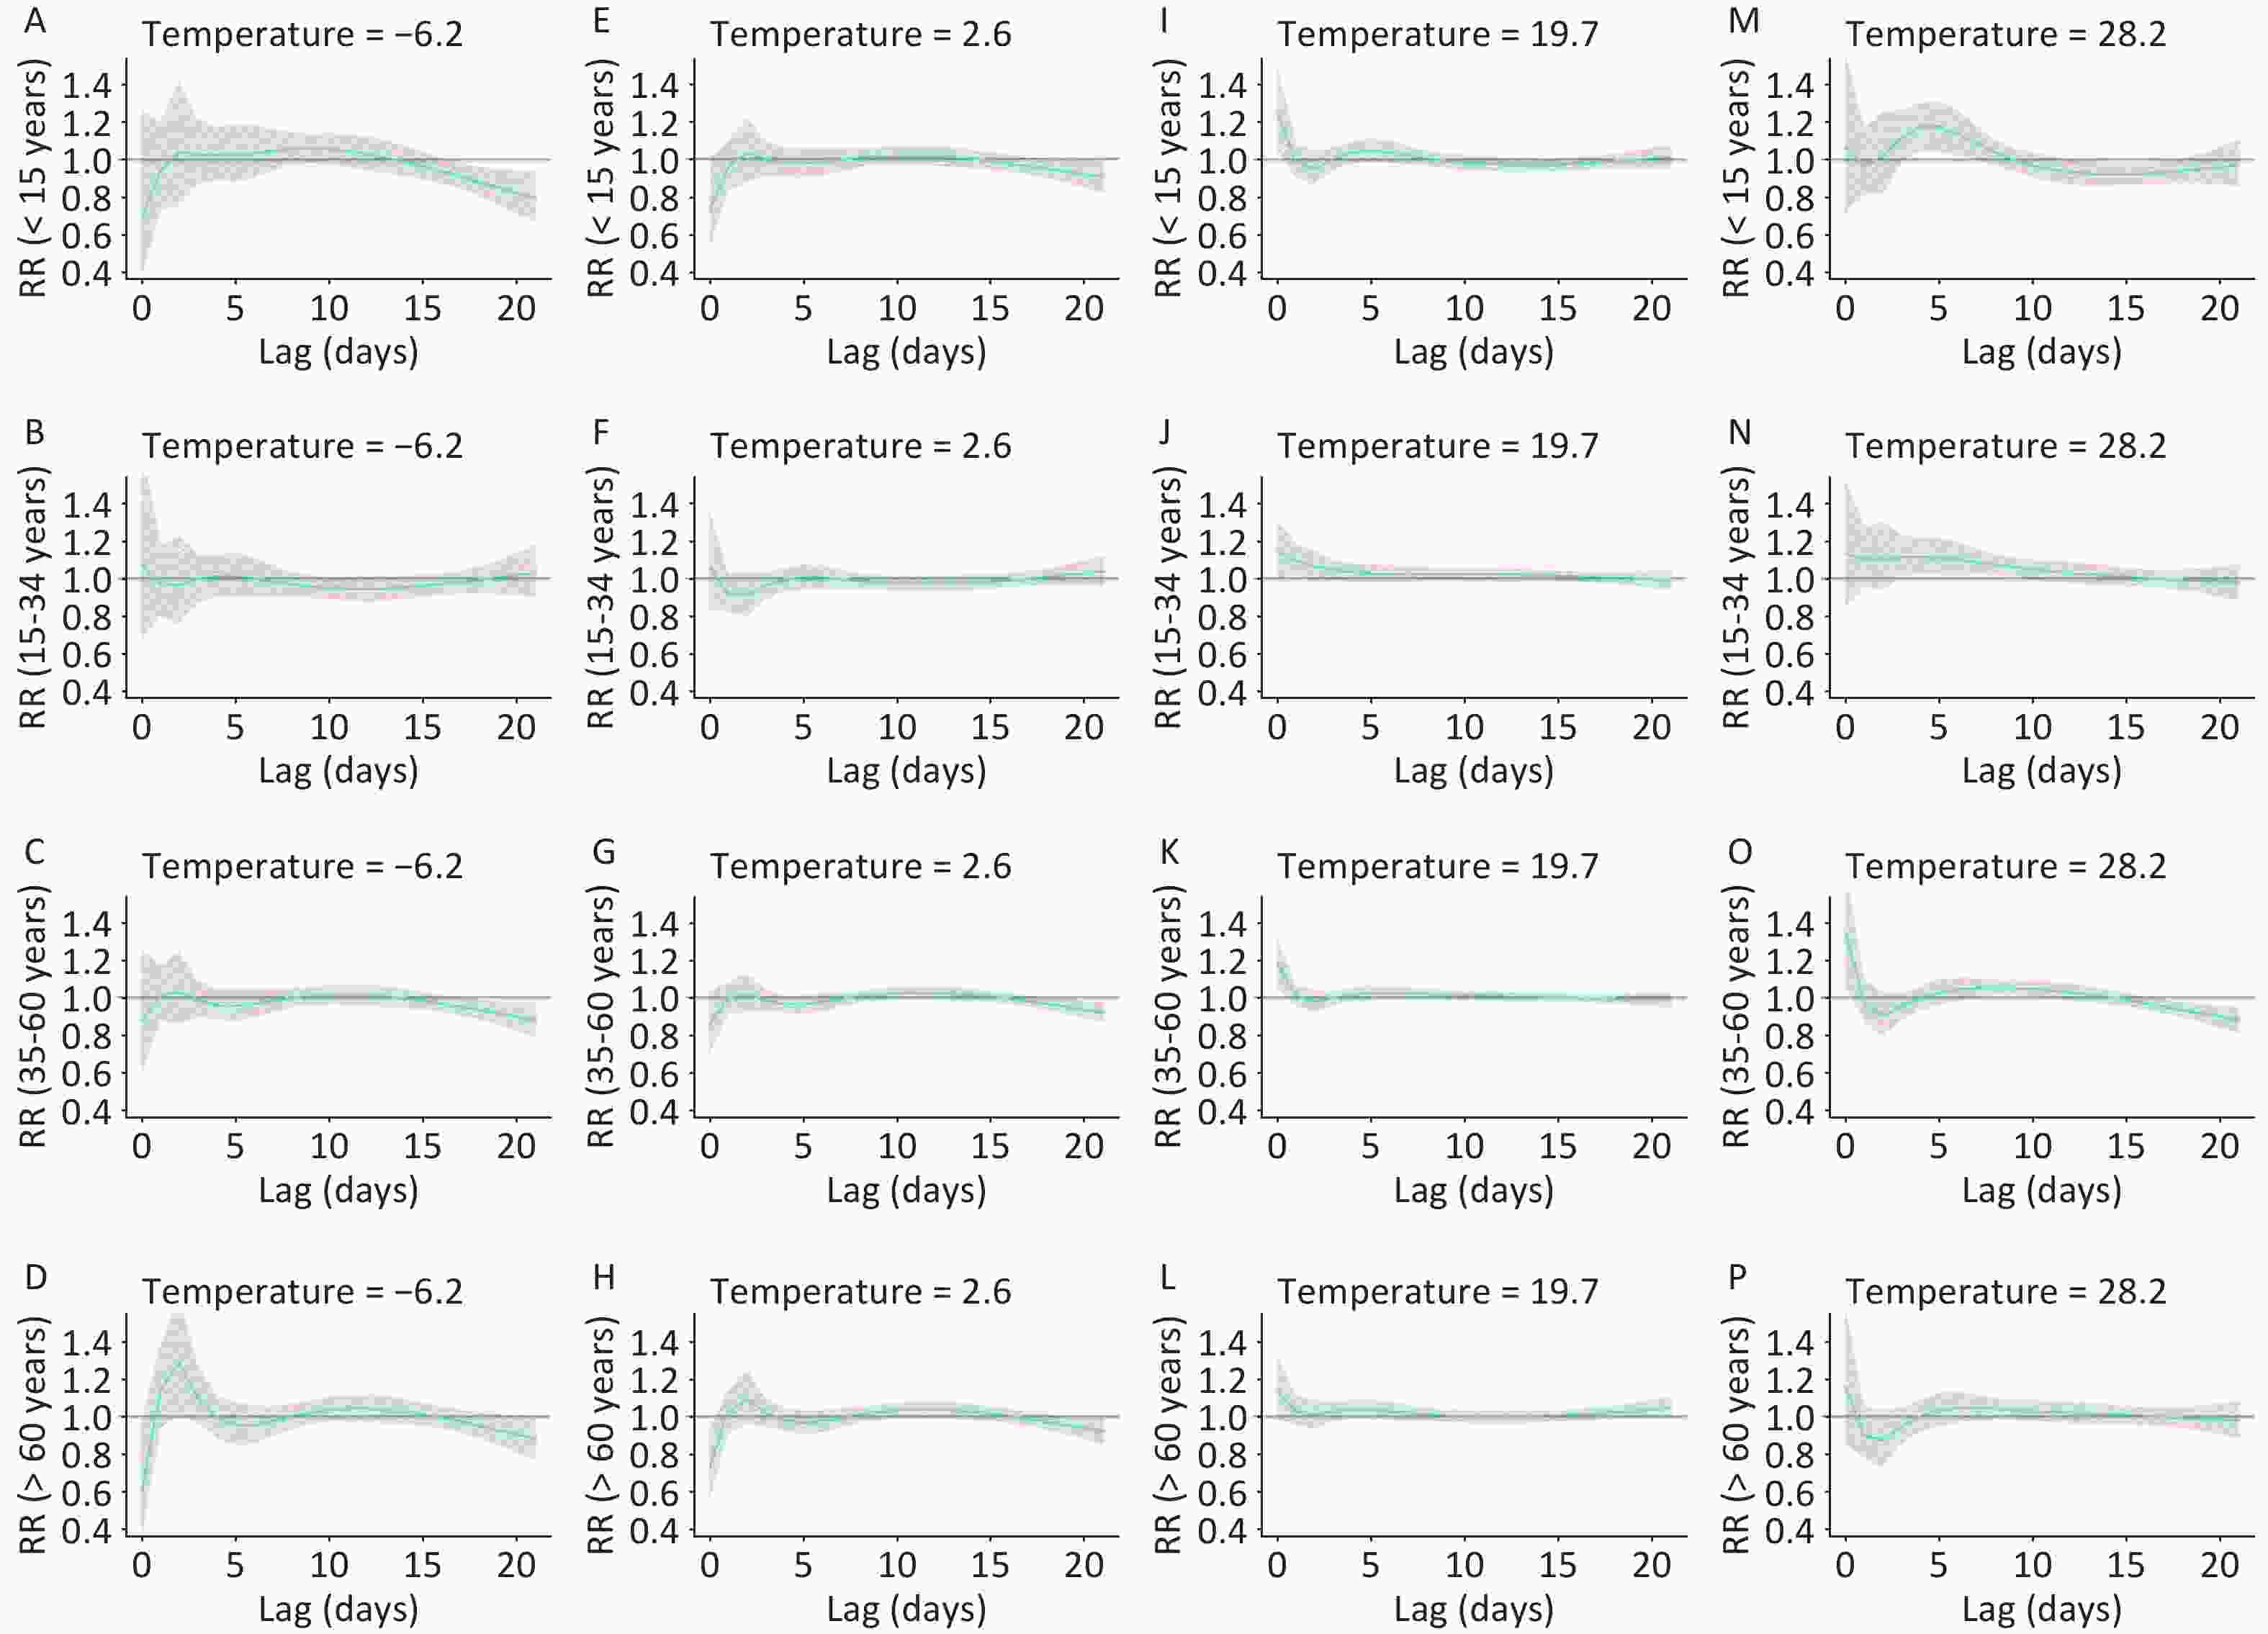
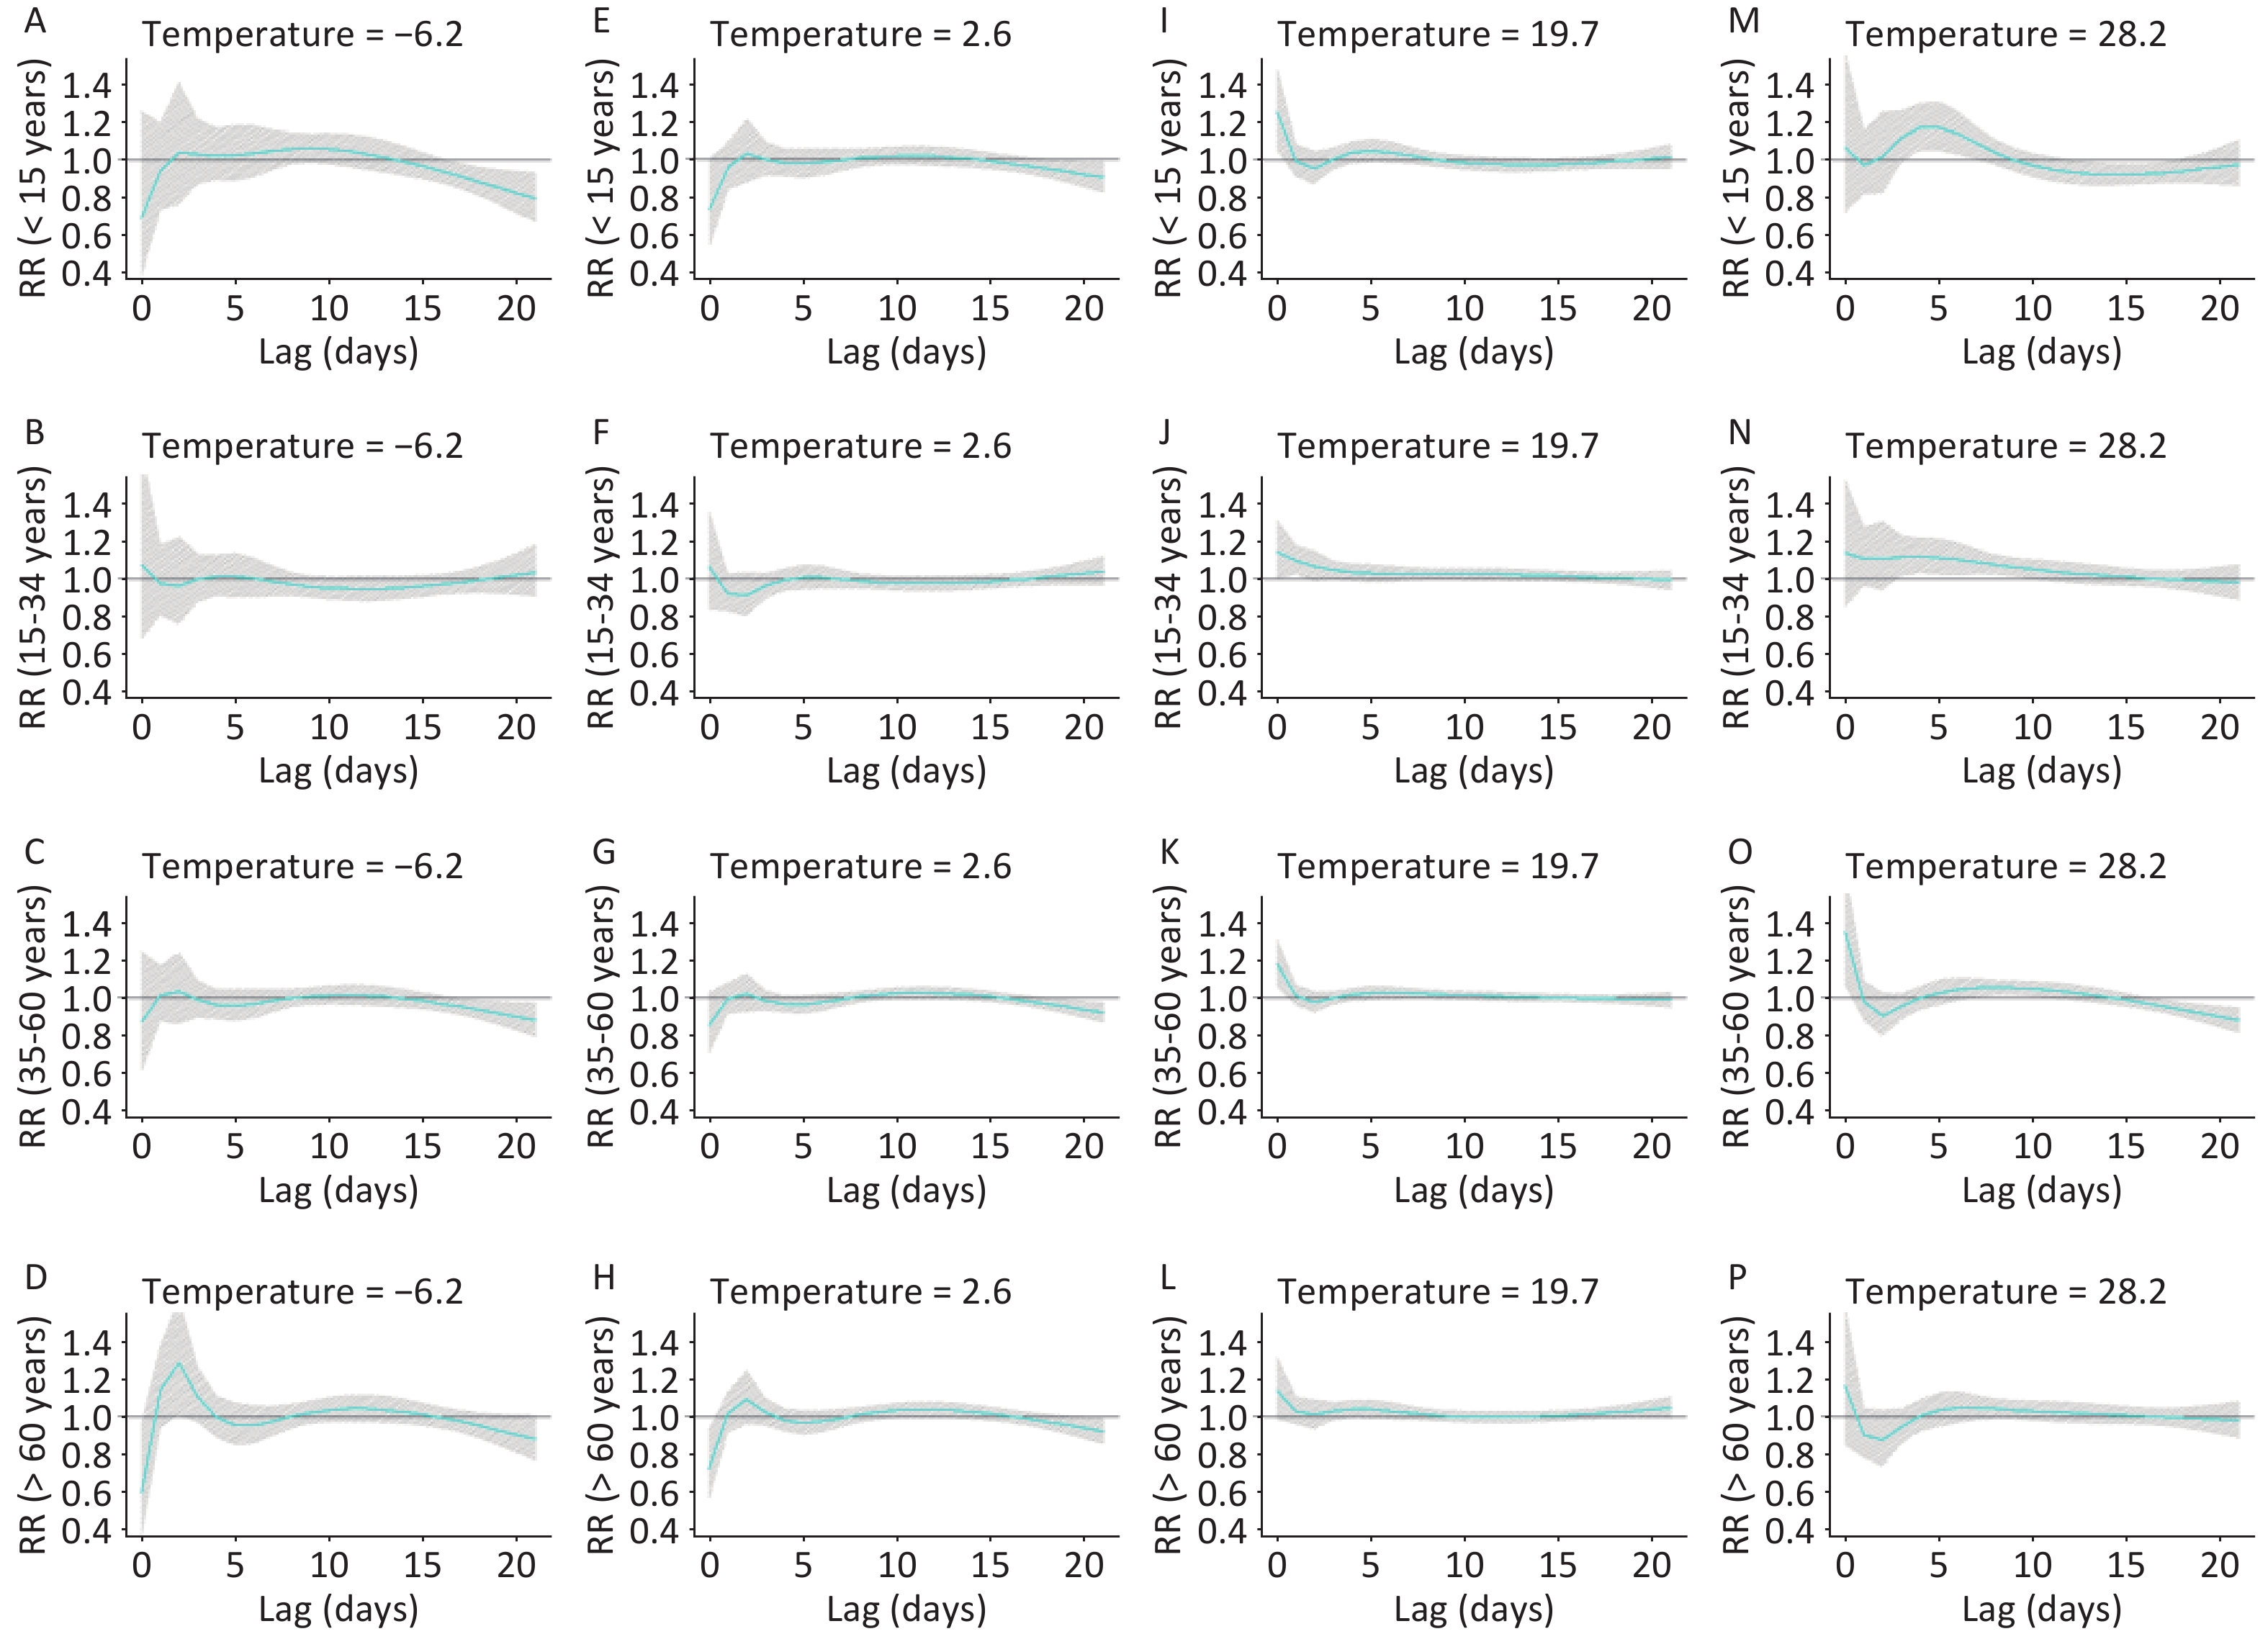
Figure S5. Lag effects of temperature (°C) on age-specific daily outpatients with eczema in Lanzhou, China during 2014–2016. The bold lines are the effect estimates and the grey areas represent 95% confidential intervals. [1st percentile: −6.2 °C (A–D); 25th percentile: 2.6 °C (E–H); 75th percentile: 19.7 °C (I–L); 99th percentile: 28.2 °C (M–P)]. RR, relative risk.
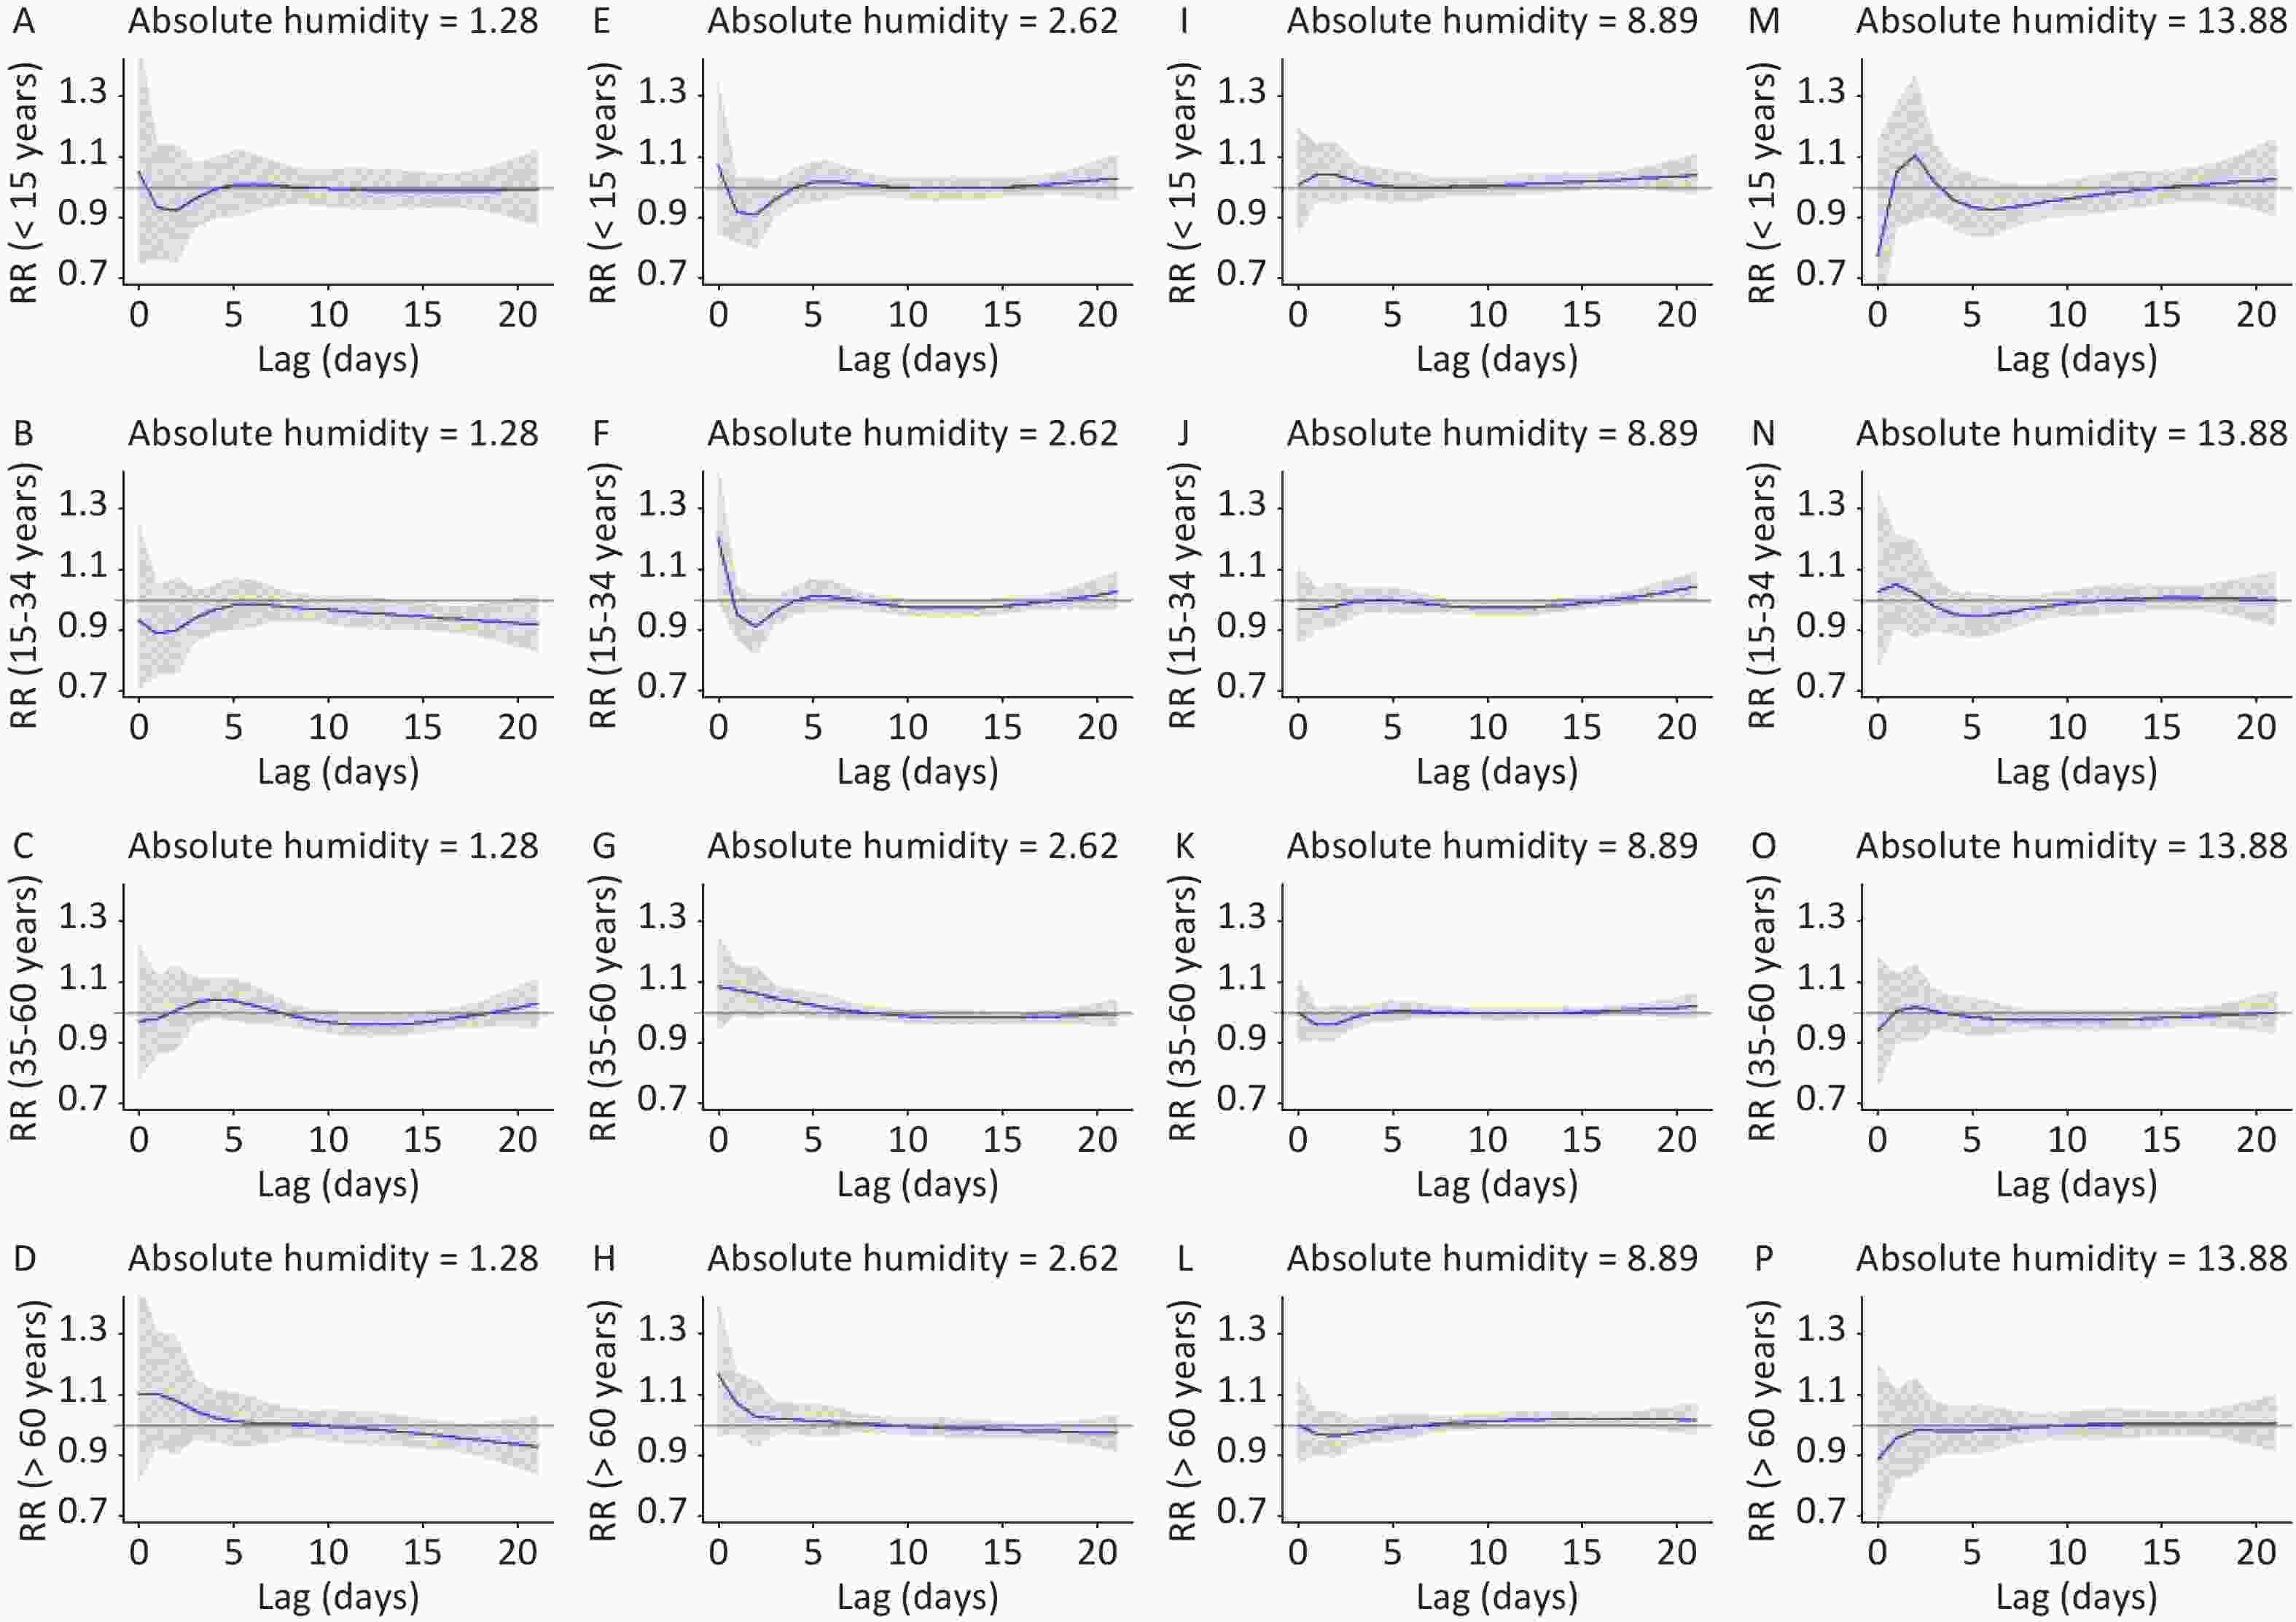
Figure S6. Lag effects of absolute humidity (g/m3) on age-specific daily outpatients with eczema in Lanzhou, China during 2014–2016. The bold lines are the effect estimates and the grey areas represent 95% confidential intervals. [1st percentile: 1.28 g/m3 (A–D); 25th percentile: 2.62 g/m3 (E–H); 75th percentile: 8.89 g/m3 (I–L); 99th percentile: 13.88 g/m3 (M–P)]. RR, relative risk.
Table 1. Attributable fraction and number of eczema outpatients due to temperature and absolute humidity by sex and age groups
Groups Reported Number Temperature (°C) AF (%, 95% CI) AN (No., 95% CI) All 29,820 18.13 (8.14, 27.04) 5,408 (2,427, 8,064) Male 13,376 17.93 (4.33, 29.59) 2,398 (580, 3,957) Female 16,444 18.03 (7.74, 27.17) 2,965 (1,273, 4,468) < 15 years 3,480 20.88 (6.91, 32.76) 727 (241, 1,140) 15–34 years 6,375 13.98 (0.96, 25.28) 891 (61, 1,612) 35–60 years 12,968 21.81 (8.59, 33.11) 2,828 (1,114, 4,294) Note. AF, attributable fraction; AN, attributable number; CI, confidence interval. Table S3. Lag effects of absolute humidity (g/m3) on sex-specific daily outpatients with eczema in Lanzhou, China during 2014–2016
Lag (days) Male (RR, 95% CI) Female (RR, 95% CI) 1.28 2.62 8.89 13.88 1.28 2.62 8.89 13.88 lag 0 1.03
(0.82, 1.30)1.13
(0.97, 1.30)1.00
(0.89, 1.11)0.85
(0.67, 1.07)1.00
(0.82, 1.23)1.14
(0.99, 1.30)1.00
(0.91, 1.10)1.02
(0.83, 1.25)lag 3 1.01
(0.94, 1.09)1.02 (0.97, 1.06) 1.00
(0.96, 1.03)1.01
(0.94, 1.08)1.01
(0.95, 1.08)1.02
(0.98, 1.06)0.99
(0.96, 1.02)0.99
(0.93, 1.06)lag 6 1.03
(0.97, 1.10)1.02
(0.98, 1.05)1.02
(0.98, 1.05)0.99
(0.93, 1.05)1.01
(0.95, 1.06)1.02
(0.99, 1.05)1.00
(0.97, 1.02)0.96
(0.92, 1.01)lag 9 0.98
(0.95, 1.02)1.00
(0.98, 1.02)1.01
(0.99, 1.03)0.99
(0.96, 1.03)0.99
(0.96, 1.03)1.00
(0.98, 1.02)1.00
(0.98, 1.01)0.98
(0.95, 1.01)lag 12 0.97
(0.93, 1.01)0.99
(0.96, 1.01)1.01
(0.98, 1.03)1.00
(0.96, 1.04)0.98
(0.95, 1.02)0.99
(0.97, 1.01)1.00
(0.98, 1.02)0.99
(0.96, 1.02)lag 15 0.97
(0.93, 1.01)0.99
(0.97, 1.01)1.01
(0.99, 1.03)1.00
(0.97, 1.03)0.97
(0.94, 1.01)0.99
(0.97, 1.01)1.01
(0.99, 1.03)1.00
(0.97, 1.03)lag 18 0.99
(0.94, 1.03)1.00
(0.97, 1.02)1.02
(0.99, 1.04)1.00
(0.96, 1.04)0.97
(0.93, 1.01)1.00
(0.98, 1.02)1.02
(1.01, 1.04)1.01
(0.98, 1.05)lag 21 1.01
(0.93, 1.10)1.00
(0.96, 1.05)1.02
(0.98, 1.07)1.00
(0.93, 1.07)0.96
(0.89, 1.03)1.01
(0.96, 1.05)1.04
(1.00, 1.07)1.02
(0.96, 1.09)Note. 1st percentile: 1.28 g/m3; 25th percentile: 2.62 g/m3; 75th percentile: 8.89 g/m3; 99th percentile: 13.88 g/m3; RR, relative risk. Our study has several limitations. First, ecologic time-series study design was applied in the study, which might be associated with a certain ecologic fallacy. Second, although we have tried to control for some potential confounding factors, some residual confounding was still possible due to the factors like ambient pollen concentrations. Third, we don’t have the information about the severity of eczema, socioeconomic factors, diet habit, mental health, and so on. Thus, a wider range of Northwestern areas should be explored in the future, which would allow us to compare the effects of meteorological factors among different cities with varying climates. However, the results using AH as the moisture variable extended previous investigations in which RH has been used to explore weather–eczema associations.
In conclusion, high temperature and high/low AH can increase the risks of eczema outpatient visits among residents in Lanzhou, China. Male and younger people are vulnerable to high temperature, whereas female and younger people are susceptible to high AH. Temperature has a greater impact on eczema outpatient visits than AH, thereby increasing incidence burden. Overall, AH provides more insights on the impact of weather on eczema than RH.
Contributors MA YL: Writing—original draft, Software; LI S: Supervision; LIU JT: Methodology; HE XT: Data curation; LI LY: Formal analysis; NIU JP: Project administration; LUO B: Conceptualization, Writing—review and editing; ZHANG K: Visualization, Validation.
Competing Interests None declared.
Patient Consent Environmental data were collected from open access websites; thus, the consent to participate was not applicable. Hospital admission data were obtained and approved by Lanzhou Center for Disease Control and Prevention with official permission.
Ethics Approval Ethical and institutional review boards for human investigation at ethics committee of Lanzhou University.
Provenance and Peer Review Not commissioned; externally peer reviewed.
doi: 10.3967/bes2021.008
-
&These authors contributed equally to this work
注释: -
S1. Overall effects of temperature (°C) (A–C), absolute humidity (g/m3) (D–F) and relative humidity (%) (G–I) on the daily counts of outpatients due to eczema in Lanzhou, China with references at 12.9 °C, 5.41 g/m3, and 50% (Median temperature, absolute humidity, and relative humidity during 2014–2016). RR, relative risk.
S2. Box plots of monthly eczema outpatients in Lanzhou, China by sex and age groups during 2014–2016.
Figure 1. Lag effects of temperature (°C) on daily outpatients with eczema in Lanzhou, China during 2014–2016. The bold lines are the effect estimates and the grey areas represent 95% confidential intervals. [1st percentile: −6.2 °C (A); 25th percentile: 2.6 °C (B); 75th percentile: 19.7 °C (C); 99th percentile: 28.2 °C (D)]. RR, relative risk.
S3. Lag effects of relative humidity (%) on daily outpatients with eczema in Lanzhou, China during 2014–2016. The bold lines are the effect estimates and the grey areas represent 95% confidential intervals. [1st percentile: 22% (A); 25th percentile: 39% (B); 75th percentile: 61% (C); 99th percentile: 82% (D)]. RR, relative risk.
Figure 2. Lag effects of absolute humidity (g/m3) on daily outpatients with eczema in Lanzhou, China during 2014–2016. The bold lines are the effect estimates and the grey areas represent 95% confidential intervals. [1st percentile: 1.28 g/m3 (A); 25th percentile: 2.62 g/m3 (B); 75th percentile: 8.89 g/m3 (C); 99th percentile: 13.88 g/m3 (D)]. RR, relative risk.
S4. Lag effects of temperature (°C) on sex specific daily outpatients with eczema in Lanzhou, China during 2014–2016. The bold lines are the effect estimates and the grey areas represent 95% confidential intervals. [1st percentile: −6.2 °C (A, E); 25th percentile: 2.6 °C (B, F); 75th percentile: 19.7 °C (C, G); 99th percentile: 28.2 °C (D, H)]. RR, relative risk.
S5. Lag effects of temperature (°C) on age-specific daily outpatients with eczema in Lanzhou, China during 2014–2016. The bold lines are the effect estimates and the grey areas represent 95% confidential intervals. [1st percentile: −6.2 °C (A–D); 25th percentile: 2.6 °C (E–H); 75th percentile: 19.7 °C (I–L); 99th percentile: 28.2 °C (M–P)]. RR, relative risk.
S6. Lag effects of absolute humidity (g/m3) on age-specific daily outpatients with eczema in Lanzhou, China during 2014–2016. The bold lines are the effect estimates and the grey areas represent 95% confidential intervals. [1st percentile: 1.28 g/m3 (A–D); 25th percentile: 2.62 g/m3 (E–H); 75th percentile: 8.89 g/m3 (I–L); 99th percentile: 13.88 g/m3 (M–P)]. RR, relative risk.
S1. Summary of meteorological data, air pollutants, and eczema outpatient visits
Variables Daily mean values Mean ± SD Min P25 Median P75 Max Daily meteorological measures Temperature (°C) 11.40 ± 9.75 −12.40 2.58 12.90 19.70 29.80 Absolute humidity (g/m3) 5.96 ± 3.52 0.91 2.62 5.41 8.89 15.44 Relative humidity (%) 50.58 ± 14.57 16.00 39.00 50.00 61.00 88.00 Daily concentrations of air pollutants PM2.5 (μg/m3) 54.52 ± 28.42 7.15 36.01 46.60 66.52 299.06 PM10 (μg/m3) 123.35 ± 75.69 19.72 82.39 108.36 144.88 1207.13 NO2 (μg/m3) 51.80 ± 21.26 12.25 36.07 49.34 63.26 138.15 SO2 (μg/m3) 22.97 ± 15.06 3.47 11.47 19.06 31.12 130.59 CO (mg/m3) 1.37 ± 0.72 0.44 0.88 1.13 1.66 4.34 O3 (μg/m3) 46.09 ± 20.32 1.85 30.41 44.30 60.43 125.05 Daily outpatient visits for eczema All 27.21 ± 14.56 0.00 15.00 27.00 38.00 74.00 Male 12.26 ± 6.98 0.00 7.00 12.00 17.00 35.00 Female 15.00 ± 8.50 0.00 8.00 15.00 21.00 43.00 < 15 years 3.18 ± 2.38 0.00 1.00 3.00 5.00 14.00 15–34 years 5.82 ± 3.59 0.00 3.00 5.00 8.00 18.00 35–60 years 11.83 ± 6.99 0.00 6.00 11.00 16.00 34.00 > 60 years 6.38 ± 4.59 0.00 2.00 6.00 9.00 24.00 Note. SD, standard deviance; Min, Minimum; P25, 25th percentile; P75, 75th percentile; Max, Maximum; PM2.5, particulate matter with aerodynamic diameter ≤ 2.5 μm; PM10, particulate matter with aerodynamic diameter ≤ 10 μm; NO2, nitrogen dioxide; SO2, sulfur dioxide; CO, carbon monoxide; O3, ozone.  下载: 导出CSV
S2. Spearman correlation of meteorological factors and air pollutants in Lanzhou
Variables Temperature RH AH PM10 PM2.5 SO2 NO2 CO O3 Temperature 1.00 RH −0.05 1.00 AH 0.88* 0.42* 1.00 PM10 −0.30* −0.31* −0.43* 1.00 PM2.5 −0.42* −0.01 −0.39* 0.80* 1.00 SO2 −0.64* −0.17* −0.67* 0.55* 0.66* 1.00 NO2 −0.26* −0.08* −0.29* 0.57* 0.58* 0.53* 1.00 CO −0.52* 0.05 −0.46* 0.51* 0.70* 0.79* 0.67* 1.00 O3 0.63* −0.32* 0.42* −0.33* −0.52* −0.63* −0.43* −0.66* 1.00 Note. *P < 0.05. RH, relative humidity; AH, absolute humidity; PM2.5, particulate matter with aerodynamic diameter ≤ 2.5 μm; PM10, particulate matter with aerodynamic diameter ≤ 10 μm; NO2, nitrogen dioxide; SO2, sulfur dioxide; CO, carbon monoxide; O3, ozone.
下载: 导出CSV
Table 1. Attributable fraction and number of eczema outpatients due to temperature and absolute humidity by sex and age groups
Groups Reported Number Temperature (°C) AF (%, 95% CI) AN (No., 95% CI) All 29,820 18.13 (8.14, 27.04) 5,408 (2,427, 8,064) Male 13,376 17.93 (4.33, 29.59) 2,398 (580, 3,957) Female 16,444 18.03 (7.74, 27.17) 2,965 (1,273, 4,468) < 15 years 3,480 20.88 (6.91, 32.76) 727 (241, 1,140) 15–34 years 6,375 13.98 (0.96, 25.28) 891 (61, 1,612) 35–60 years 12,968 21.81 (8.59, 33.11) 2,828 (1,114, 4,294) Note. AF, attributable fraction; AN, attributable number; CI, confidence interval.
下载: 导出CSV
S3. Lag effects of absolute humidity (g/m3) on sex-specific daily outpatients with eczema in Lanzhou, China during 2014–2016
Lag (days) Male (RR, 95% CI) Female (RR, 95% CI) 1.28 2.62 8.89 13.88 1.28 2.62 8.89 13.88 lag 0 1.03
(0.82, 1.30)1.13
(0.97, 1.30)1.00
(0.89, 1.11)0.85
(0.67, 1.07)1.00
(0.82, 1.23)1.14
(0.99, 1.30)1.00
(0.91, 1.10)1.02
(0.83, 1.25)lag 3 1.01
(0.94, 1.09)1.02 (0.97, 1.06) 1.00
(0.96, 1.03)1.01
(0.94, 1.08)1.01
(0.95, 1.08)1.02
(0.98, 1.06)0.99
(0.96, 1.02)0.99
(0.93, 1.06)lag 6 1.03
(0.97, 1.10)1.02
(0.98, 1.05)1.02
(0.98, 1.05)0.99
(0.93, 1.05)1.01
(0.95, 1.06)1.02
(0.99, 1.05)1.00
(0.97, 1.02)0.96
(0.92, 1.01)lag 9 0.98
(0.95, 1.02)1.00
(0.98, 1.02)1.01
(0.99, 1.03)0.99
(0.96, 1.03)0.99
(0.96, 1.03)1.00
(0.98, 1.02)1.00
(0.98, 1.01)0.98
(0.95, 1.01)lag 12 0.97
(0.93, 1.01)0.99
(0.96, 1.01)1.01
(0.98, 1.03)1.00
(0.96, 1.04)0.98
(0.95, 1.02)0.99
(0.97, 1.01)1.00
(0.98, 1.02)0.99
(0.96, 1.02)lag 15 0.97
(0.93, 1.01)0.99
(0.97, 1.01)1.01
(0.99, 1.03)1.00
(0.97, 1.03)0.97
(0.94, 1.01)0.99
(0.97, 1.01)1.01
(0.99, 1.03)1.00
(0.97, 1.03)lag 18 0.99
(0.94, 1.03)1.00
(0.97, 1.02)1.02
(0.99, 1.04)1.00
(0.96, 1.04)0.97
(0.93, 1.01)1.00
(0.98, 1.02)1.02
(1.01, 1.04)1.01
(0.98, 1.05)lag 21 1.01
(0.93, 1.10)1.00
(0.96, 1.05)1.02
(0.98, 1.07)1.00
(0.93, 1.07)0.96
(0.89, 1.03)1.01
(0.96, 1.05)1.04
(1.00, 1.07)1.02
(0.96, 1.09)Note. 1st percentile: 1.28 g/m3; 25th percentile: 2.62 g/m3; 75th percentile: 8.89 g/m3; 99th percentile: 13.88 g/m3; RR, relative risk.
下载: 导出CSV
-
[1] Archer CB. Atopic dermatitis. Medicine, 2017; 45, 379−82. doi: 10.1016/j.mpmed.2017.03.001 [2] Sargen MR, Hoffstad O, Margolis DJ. Warm, humid, and high sun exposure climates are associated with poorly controlled eczema: PEER (Pediatric Eczema Elective Registry) cohort, 2004-2012. J Invest Dermatol, 2014; 134, 51−7. doi: 10.1038/jid.2013.274 [3] Li Q, Yang YY, Chen RJ, et al. Ambient air pollution, meteorological factors and outpatient visits for eczema in Shanghai, China: A time-series analysis. Int J Environ Res Public Health, 2016; 13, 1106. doi: 10.3390/ijerph13111106 [4] Shaman J, Kohn M. Absolute humidity modulates influenza survival, transmission, and seasonality. Proc Natl Acad Sci USA, 2009; 106, 3243−8. doi: 10.1073/pnas.0806852106 [5] Zhang K, Li Y, Schwartz JD, et al. What weather variables are important in predicting heat-related mortality? A new application of statistical learning methods. Environ Res, 2014; 132, 350−9. doi: 10.1016/j.envres.2014.04.004 [6] Liu T, Kang M, Zhang B, et al. Independent and interactive effects of ambient temperature and absolute humidity on the risks of avian influenza A(H7N9) infection in China. Sci Total Environ, 2018; 619-620, 1358−65. doi: 10.1016/j.scitotenv.2017.11.226 [7] Barreca AI, Shimshack JP. Absolute humidity, temperature, and influenza mortality: 30 years of county-level evidence from the United States. Am J Epidemiol, 2012; 176 Suppl 7, S114−22. [8] Davis RE, McGregor GR, Enfield KB. Humidity: A review and primer on atmospheric moisture and human health. Environ Res, 2016; 144, 106−16. doi: 10.1016/j.envres.2015.10.014 [9] Ma YL, Zhao YD, Liu JT, et al. Effects of temperature variation and humidity on the death of COVID-19 in Wuhan, China. Sci Total Environ, 2020; 724, 138226. doi: 10.1016/j.scitotenv.2020.138226 [10] Gasparrini A. Distributed lag linear and non-linear models in R: The Package dlnm. J Stat Softw, 2011; 43, 1−20. [11] Gasparrini A. Modeling exposure-lag-response associations with distributed lag non-linear models. Stat Med, 2014; 33, 881−99. doi: 10.1002/sim.5963 [12] Xu HY, Fu XJ, Lee LKH, et al. Statistical modeling reveals the effect of absolute humidity on dengue in Singapore. PLoS Negl Trop Dis, 2014; 8, e2805. doi: 10.1371/journal.pntd.0002805 [13] Guo YM, Barnett AG, Pan XC, et al. The impact of temperature on mortality in Tianjin, China: A case-crossover design with a distributed lag nonlinear model. Environ Health Perspect, 2011; 119, 1719−25. doi: 10.1289/ehp.1103598 [14] Zeng J, Zhang XH, Yang J, et al. Humidity may modify the relationship between temperature and cardiovascular mortality in Zhejiang Province, China. Int J Environ Res Public Health, 2017; 14, 1383. doi: 10.3390/ijerph14111383 [15] Li GX, Zhou MG, Cai Y, et al. Does temperature enhance acute mortality effects of ambient particle pollution in Tianjin City, China. Sci Total Environ, 2011; 409, 1811−7. doi: 10.1016/j.scitotenv.2011.02.005 [16] Yang YW, You EQ, Wu JJ, et al. Effects of relative humidity on childhood hand, foot, and mouth disease reinfection in Hefei, China. Sci Total Environ, 2018; 630, 820−6. doi: 10.1016/j.scitotenv.2018.02.262 [17] Evans J, van Donkelaar A, Martin RV, et al. Estimates of global mortality attributable to particulate air pollution using satellite imagery. Environ Res, 2013; 120, 33−42. doi: 10.1016/j.envres.2012.08.005 [18] Chen GB, Zhang WY, Li SS, et al. The impact of ambient fine particles on influenza transmission and the modification effects of temperature in China: A multi-city study. Environ Int, 2017; 98, 82−8. doi: 10.1016/j.envint.2016.10.004 [19] Kantor R, Silverberg JI. Environmental risk factors and their role in the management of atopic dermatitis. Expert Rev Clin Immunol, 2017; 13, 15−26. doi: 10.1080/1744666X.2016.1212660 [20] Bestion E, Jacob S, Zinger L, et al. Climate warming reduces gut microbiota diversity in a vertebrate ectotherm. Nat Ecol Evol, 2017; 1, 0161. doi: 10.1038/s41559-017-0161 [21] Kang Y, Cai Y, Pan W. Change in gut microbiota for eczema: Implications for novel therapeutic strategies. Allergol Immunopathol, 2018; 46, 281−90. doi: 10.1016/j.aller.2017.05.010 [22] Silverberg JI, Hanifin J, Simpson EL. Climatic factors are associated with childhood eczema prevalence in the United States. J Invest Dermatol, 2013; 133, 1752−9. doi: 10.1038/jid.2013.19 [23] Li A, Fan L, Xie L, et al. Associations between air pollution, climate factors and outpatient visits for eczema in West China Hospital, Chengdu, south-western China: A time series analysis. J Eur Acad Dermatol Venereol, 2018; 32, 486−94. doi: 10.1111/jdv.14730 [24] Eberlein-König B, Spiegl A, Przybilla B. Change of skin roughness due to lowering air humidity in climate chamber. Acta Derm Venereol, 1996; 76, 447−9. [25] Goad N, Gawkrodger DJ. Ambient humidity and the skin: The impact of air humidity in healthy and diseased states. J Eur Acad Dermatol Venereol, 2016; 30, 1285−94. doi: 10.1111/jdv.13707 [26] Rycroft RJG. Low humidity and microtrauma. Am J Ind Med, 1985; 8, 371−3. doi: 10.1002/ajim.4700080417 [27] Suárez-Varela MM, García-Marcos Alvarez L, Kogan MD, et al. Climate and prevalence of atopic eczema in 6- to 7-year-old school children in Spain. ISAAC PhASE III. Int J Biometeorol, 2008; 52, 833−40. doi: 10.1007/s00484-008-0177-0 [28] Walters TJ, Ryan KL, Constable SH. Thermoregulation by rhesus monkeys at different absolute humidities. J Comp Physiol B, 2004; 174, 481−7. -

 点击查看大图
计量
- 文章访问数: 2168
- HTML全文浏览量: 859
- PDF下载量: 89
- 被引次数: 0


 Quick Links