


 下载:
下载:


-
Digestive system (DS) cancers include tumors of the mouth, esophagus, liver, stomach, bile duct, colon, rectum, pancreas, and gallbladder. GLOBOCAN estimates that DS cancers accounted for approximately 19.3 million newly diagnosed cancers and 10.0 million deaths worldwide in 2020. Colorectal, gastric, liver, and esophageal cancers are the four most common DS cancers, ranked 3rd, 5th, 6th, and 7th in global incidence and 2nd, 4th, 3rd, and 6th in overall mortality, respectively[1]. Although novel therapeutic strategies and precise diagnostics have been developed, the outcome for patients with DS cancer remains unsatisfactory[2]. More importantly, due to the largely asymptomatic nature of most types of DS cancers, patients are often diagnosed at a late stage, resulting in limited treatment options and poor prognosis.
Leptin is a 16-kD cytokine-like peptide hormone secreted primarily by the white adipose tissue[3]. It exerts its biological functions through a specific homodimeric receptor called leptin receptor (LEPR), which is expressed in multiple organs[4]. The long form of the leptin receptor, Ob-Rb, is the predominant isoform of LEPR. Interestingly, activation of Ob-Rb by leptin binding has been shown to stimulate the janus kinase 2/signal transducer and activator of transcription 3 (JAK2/STAT3), phosphoinositide 3-kinase/mammalian target of rapamycin (PI3K/mTOR), and mitogen-activated protein kinase/extracellular signal-regulated kinase (MAPK/ERK) signaling pathways[5-8]. Numerous lines of evidence suggest that these key signaling cascades play crucial roles in multiple aspects of tumorigenesis; thus, the LEPR gene is regarded as a plausible candidate gene for cancer susceptibility. Indeed, functional studies have revealed that LEPR is involved in promoting angiogenesis, facilitating cell proliferation and inhibiting epithelial cell apoptosis[9-11].
LEPR is located on chromosome 1p31 (position_38: 65420652-65637493). More than 3,117 genetic variants have been identified in the LEPR gene region. Current knowledge suggests that genetic variants with regulatory function are more likely to be the causative loci of complex human diseases. Matsuoka et al. reported seven common missense variants (Lys109Arg, Gln223Arg, Ser343Ser, Ser492Thr, Lys656Asn, Ala976Asp, and Pro1019Pro) that cause amino acid changes in the Ob-Rb coding region[12]. Of the seven genetic variants, Gln223Arg (rs1137101) has been extensively examined for its association with cancer risk. The interesting question is why rs1137101 has attracted the most attention. Here, we used the SNPinfo software (https://snpinfo.niehs.nih.gov/) to predict that rs1137101 may act as an exonic splicing enhancer or silencer of LEPR mRNA, which modifies the efficiency of RNA splicing and thereby alters the function of LEPR.
The genetic effect of rs1137101 has been investigated mainly in DS cancers (oral[13-16], esophageal[17,18], gastric[19-21], colorectal[22-27], and liver[28-31]) and breast cancer[32], as well as in a few other types (endometrial[33] and lung cancer[34]). Nevertheless, no conclusive results have been published, which calls for further investigation. To replicate and further explore the association between rs1137101 and risk of DS cancer, we conducted a case–control study to investigate the genetic effect of rs1137101 on the risk of gastric, colorectal, and liver cancers in a Hubei Chinese population.
On a different note, although the association between rs1137101 and overall cancer risk has been previously determined in several meta-analyses[35-37], a meta-analysis specific to the association between rs1137101 and DS cancer risk is lacking. Given that articles related to the relationship between rs1137101 and DS cancers are continually published and new experimental data were obtained in the present study, we performed a comprehensive meta-analysis to determine the contribution of rs1137101 to DS cancer risk.
-
This hospital-based case–control study included 1,727 patients with cancer and 800 healthy controls. Of these patients, 460 were diagnosed with gastric cancer, 787 with colorectal cancer, and 480 with liver cancer; the diagnoses were confirmed histopathologically. The patients were recruited from the Hubei Cancer Hospital and Wuhan Xinzhou District People’s Hospital and the healthy controls were selected from cancer-free individuals who visited the Wuhan Xinzhou District People’s Hospital for medical checkups. All enrolled participants were unrelated Chinese Han individuals living in Hubei Province. Information on age, sex, smoking status, and drinking status was collected from all participants. Regular smoking was defined as smoking at least one cigarette per day on average over one year or having quit smoking for less than one year. Regular drinking was defined as drinking at least 100 mL of alcohol per day on average over one year or having quit drinking for less than one year. This study was conducted after obtaining approval from the ethical committee of Wuhan University of Technology, and signed informed consent forms were obtained from all participants.
-
Peripheral blood samples from all participants were collected into blood vacuum tubes containing ethylenediaminetetraacetic acid (EDTA) and stored at 4 °C. Genomic DNA was extracted from the blood samples using the TIANamp Blood DNA Kit (DP348; TianGen Biotech, Beijing, China) within one week, according to the manufacturer’s instructions. The DNA samples were stored at −20 °C before use. Genotyping of the LEPR gene rs1137101 variant was performed using a polymerase chain reaction-restriction fragment length polymorphism (PCR-RFLP) assay. The DNA fragments containing rs1137101 were amplified using the primers 5'-TGTGCCAACAGCCAAACTCA-3' (forward) and 5'-CCCCAGGACTACATCTACCATCA-3' (reverse). The PCR products were digested with the restriction enzyme Msp I (Thermo Scientific, USA) for 4 h at 37 °C. The digested fragments were then separated on a 2.0% agarose gel and the RFLP bands were visualized under ultraviolet light using Gel-Red staining. The rs1137101 AA genotype was identified by the presence of a 243-bp band; the AG genotype by the presence of three bands of 243, 171, and 72 bp; and the GG genotype by the presence of two bands of 171 and 72 bp. To ensure the accuracy of the PCR-RFLP genotyping results, we performed Sanger sequencing on 20% of randomly selected DNA samples, and the results were 100% concordant. Supplementary Figure S1 (available in www.besjournal.com) shows the genotyping diagrams of rs1137101 obtained using PCR-RFLP and Sanger sequencing.
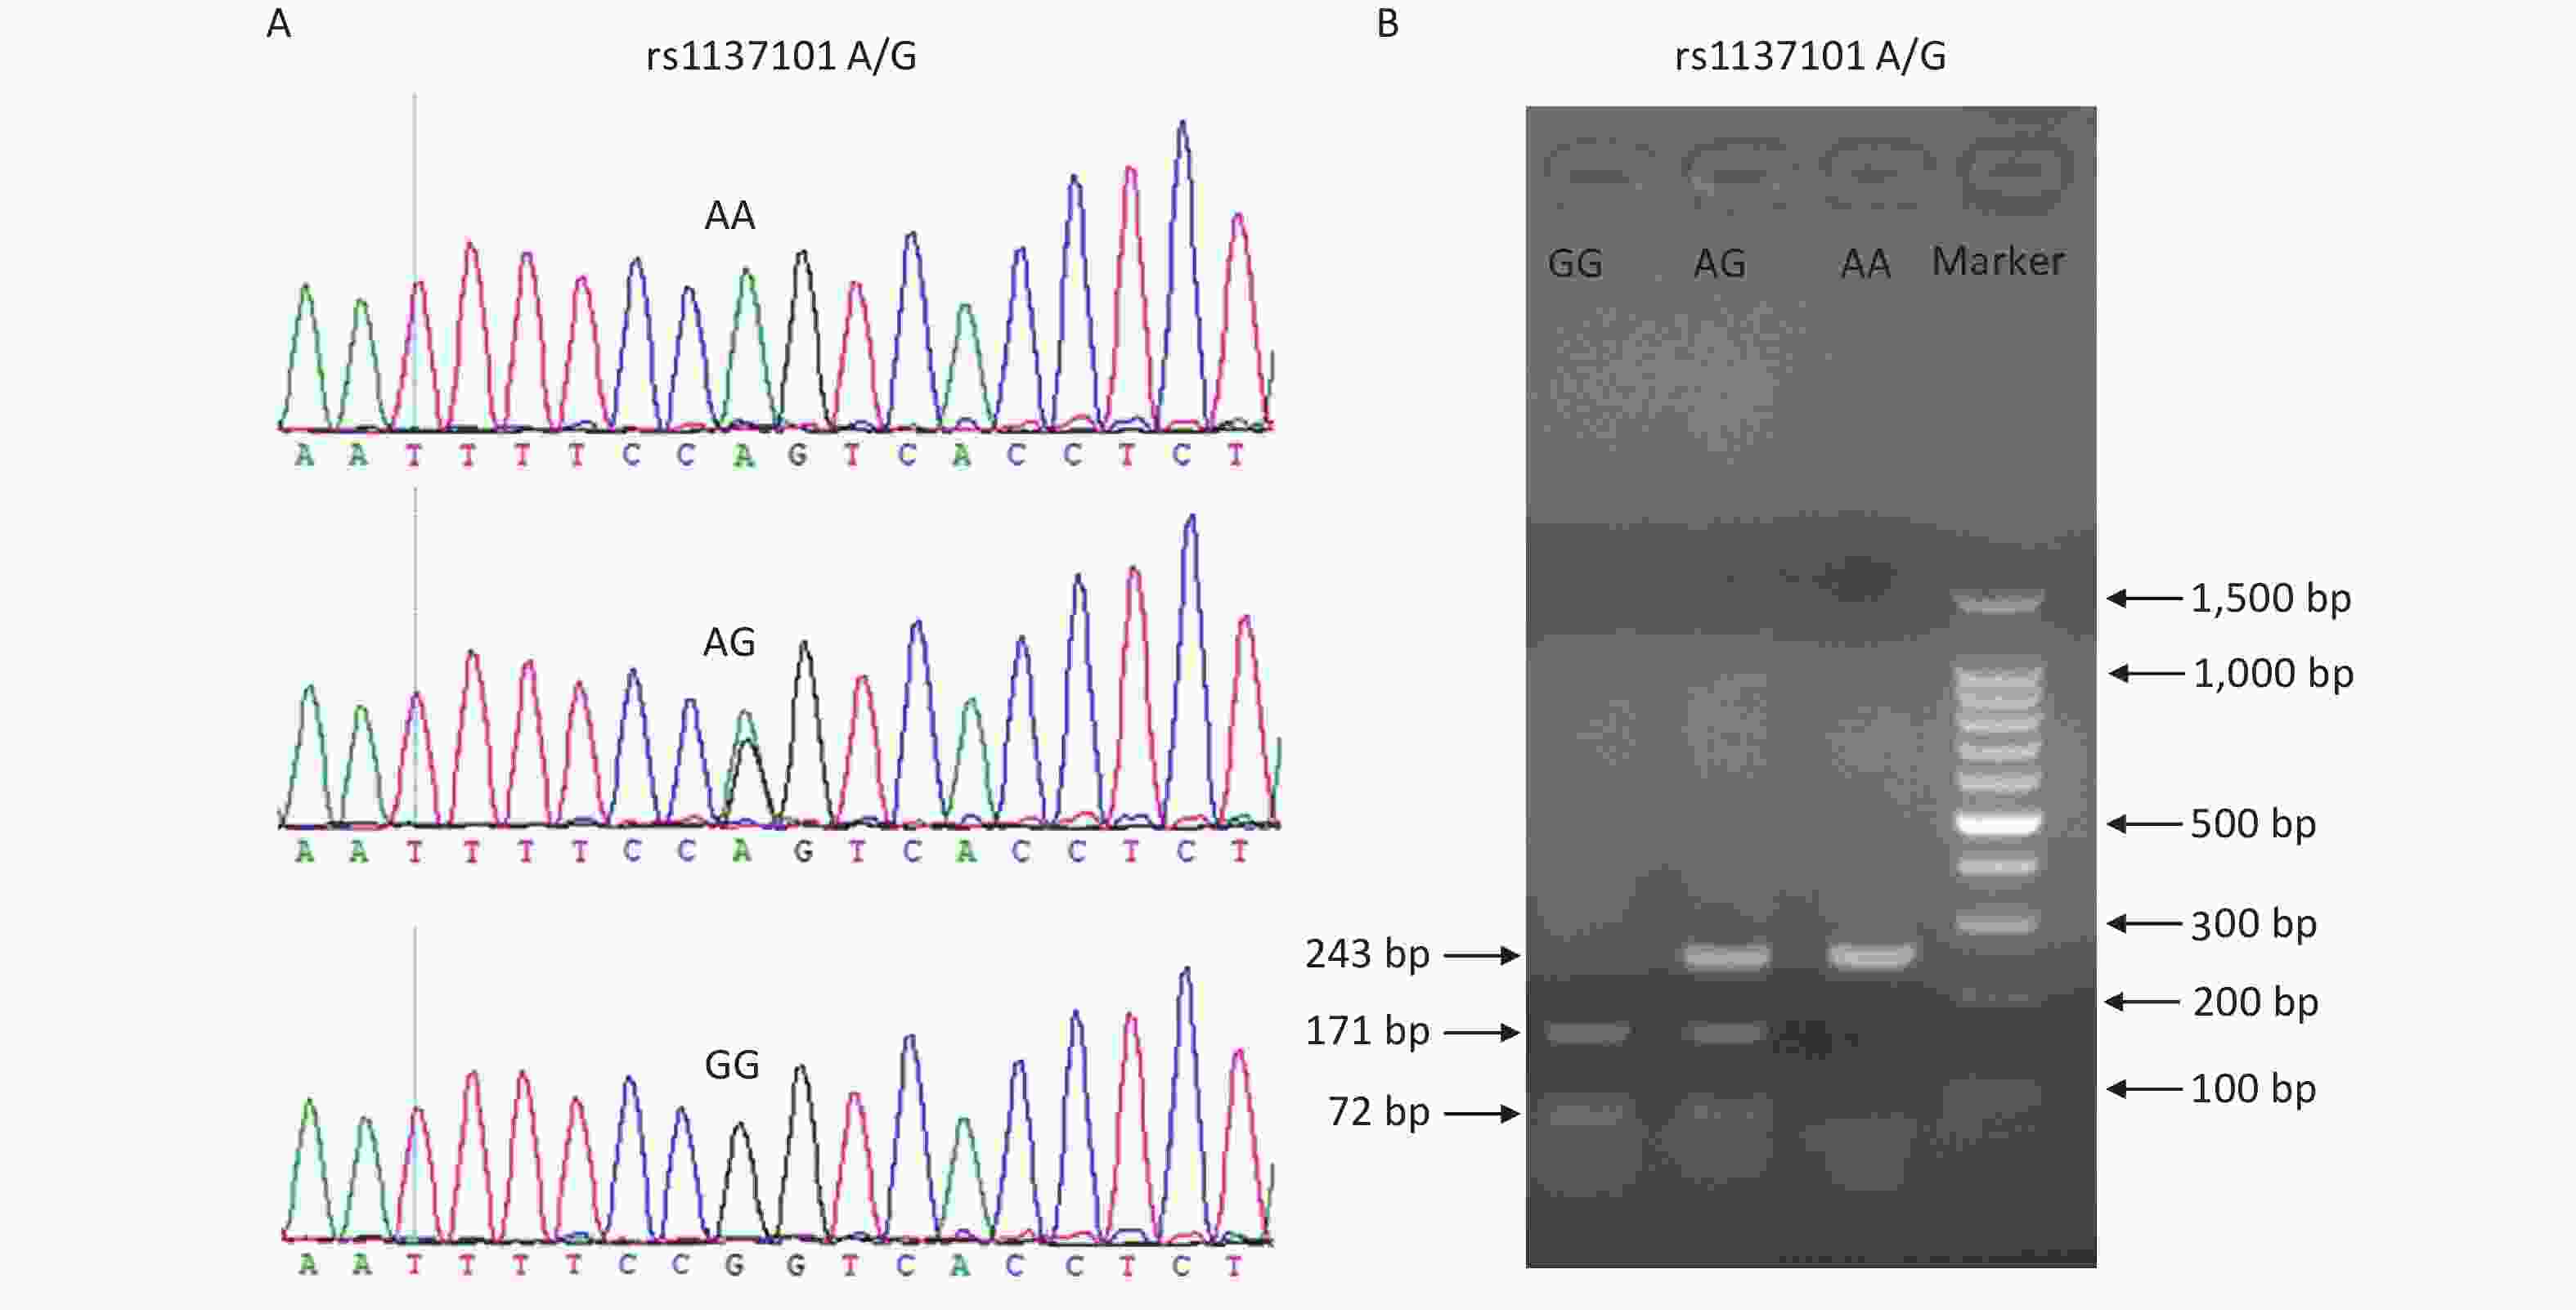
Figure S1. Genotyping diagrams of the LEPR gene rs1137101 variant using Sanger sequencing (A) and PCR-RFLP assay (B). PCR-RFLP, polymerase chain reaction-restriction fragment length polymorphism.
-
All statistical analyses were conducted using SPSS 15.0 (Chicago, IL, USA). The chi-square (χ2) test was used to compare the distributions of age, sex, smoking status, and drinking status between the patients and healthy controls. The genotypic frequency of rs1137101 in healthy controls was examined for deviation from Hardy-Weinberg equilibrium (HWE). Unconditional logistic regression analysis under allele, carrier, homozygote, heterozygote, recessive, and dominant models was used to assess the correlation between rs1137101 and cancer risk. Statistical significance was set at P < 0.05, and an adjusted threshold of 0.0084 (0.05/6) by Bonferroni correction was used for multiple comparisons.
-
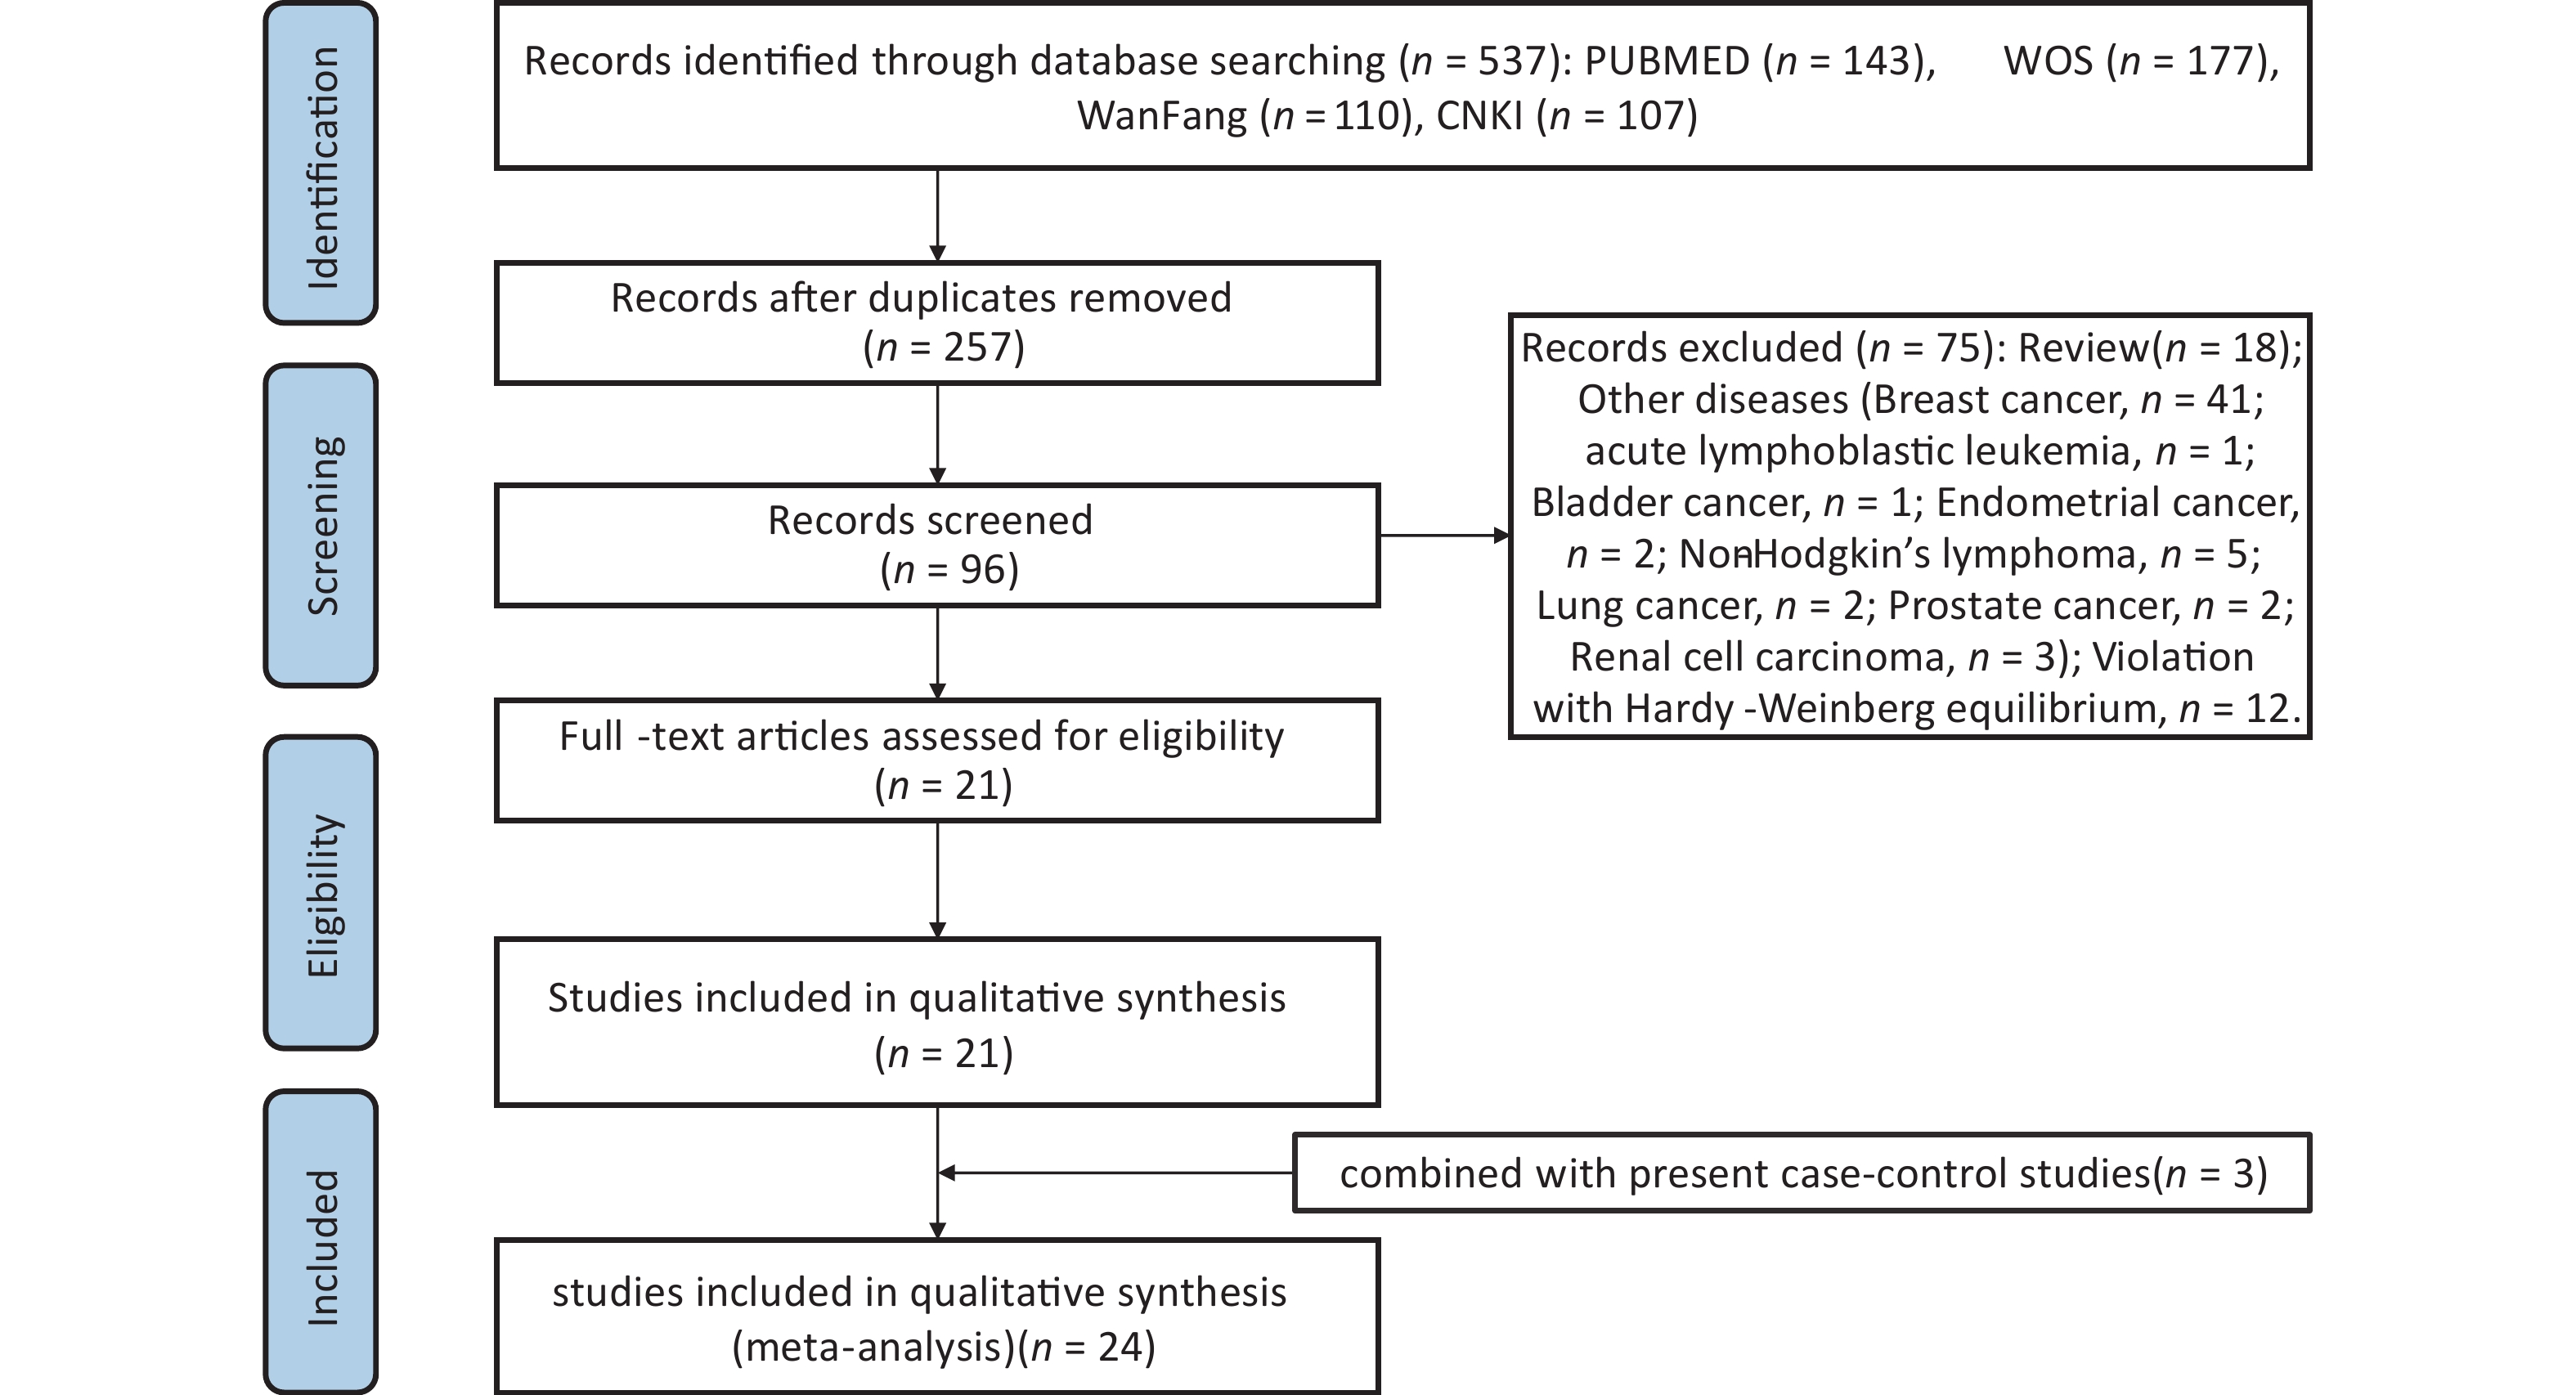
A thorough literature search of the PubMed, EMBASE, ISI, Web of Science, CNKI, and Wanfang databases up to August 31, 2023 was conducted to retrieve eligible studies related to rs1137101 and DS cancer risk. The following terms and keywords were searched: “leptin receptor” OR “LEPR” or “obese receptor” OR “OBR” AND “rs1137101” OR “Q223R” OR “p. Gln223Arg” or “c. 668A>G” and “cancer” or “tumor” OR “carcinoma” OR “malignancy” OR “neoplasms”. To identify additional eligible studies, we screened the references listed in the retrieved articles. The inclusion criteria were as follows: (1) case–control study, (2) rs1137101 and risk of DS cancer (oral, esophageal, gastric, liver, bile duct, colorectal, pancreatic, and gallbladder cancer), (3) human study, (4) extractable genotyping data, and (5) no departure from HWE in the controls. Supplementary Figure S2 (available in www.besjournal.com) shows a flowchart of the process for literature retrieval for this meta-analysis. Statistical analyses, including heterogeneity tests, pooled odds ratios (ORs), publication bias, and sensitivity analysis, were performed using STATA 14.0 (Stata Corp, College Station, Texas). P < 0.05 indicated the significance level and the Bonferroni correction was adopted for multiple comparisons. In addition, trial sequential analysis (TSA) was conducted to examine whether the statistical results were reliable and conclusive. The elucidation of TSA results was described in our previous study[38].
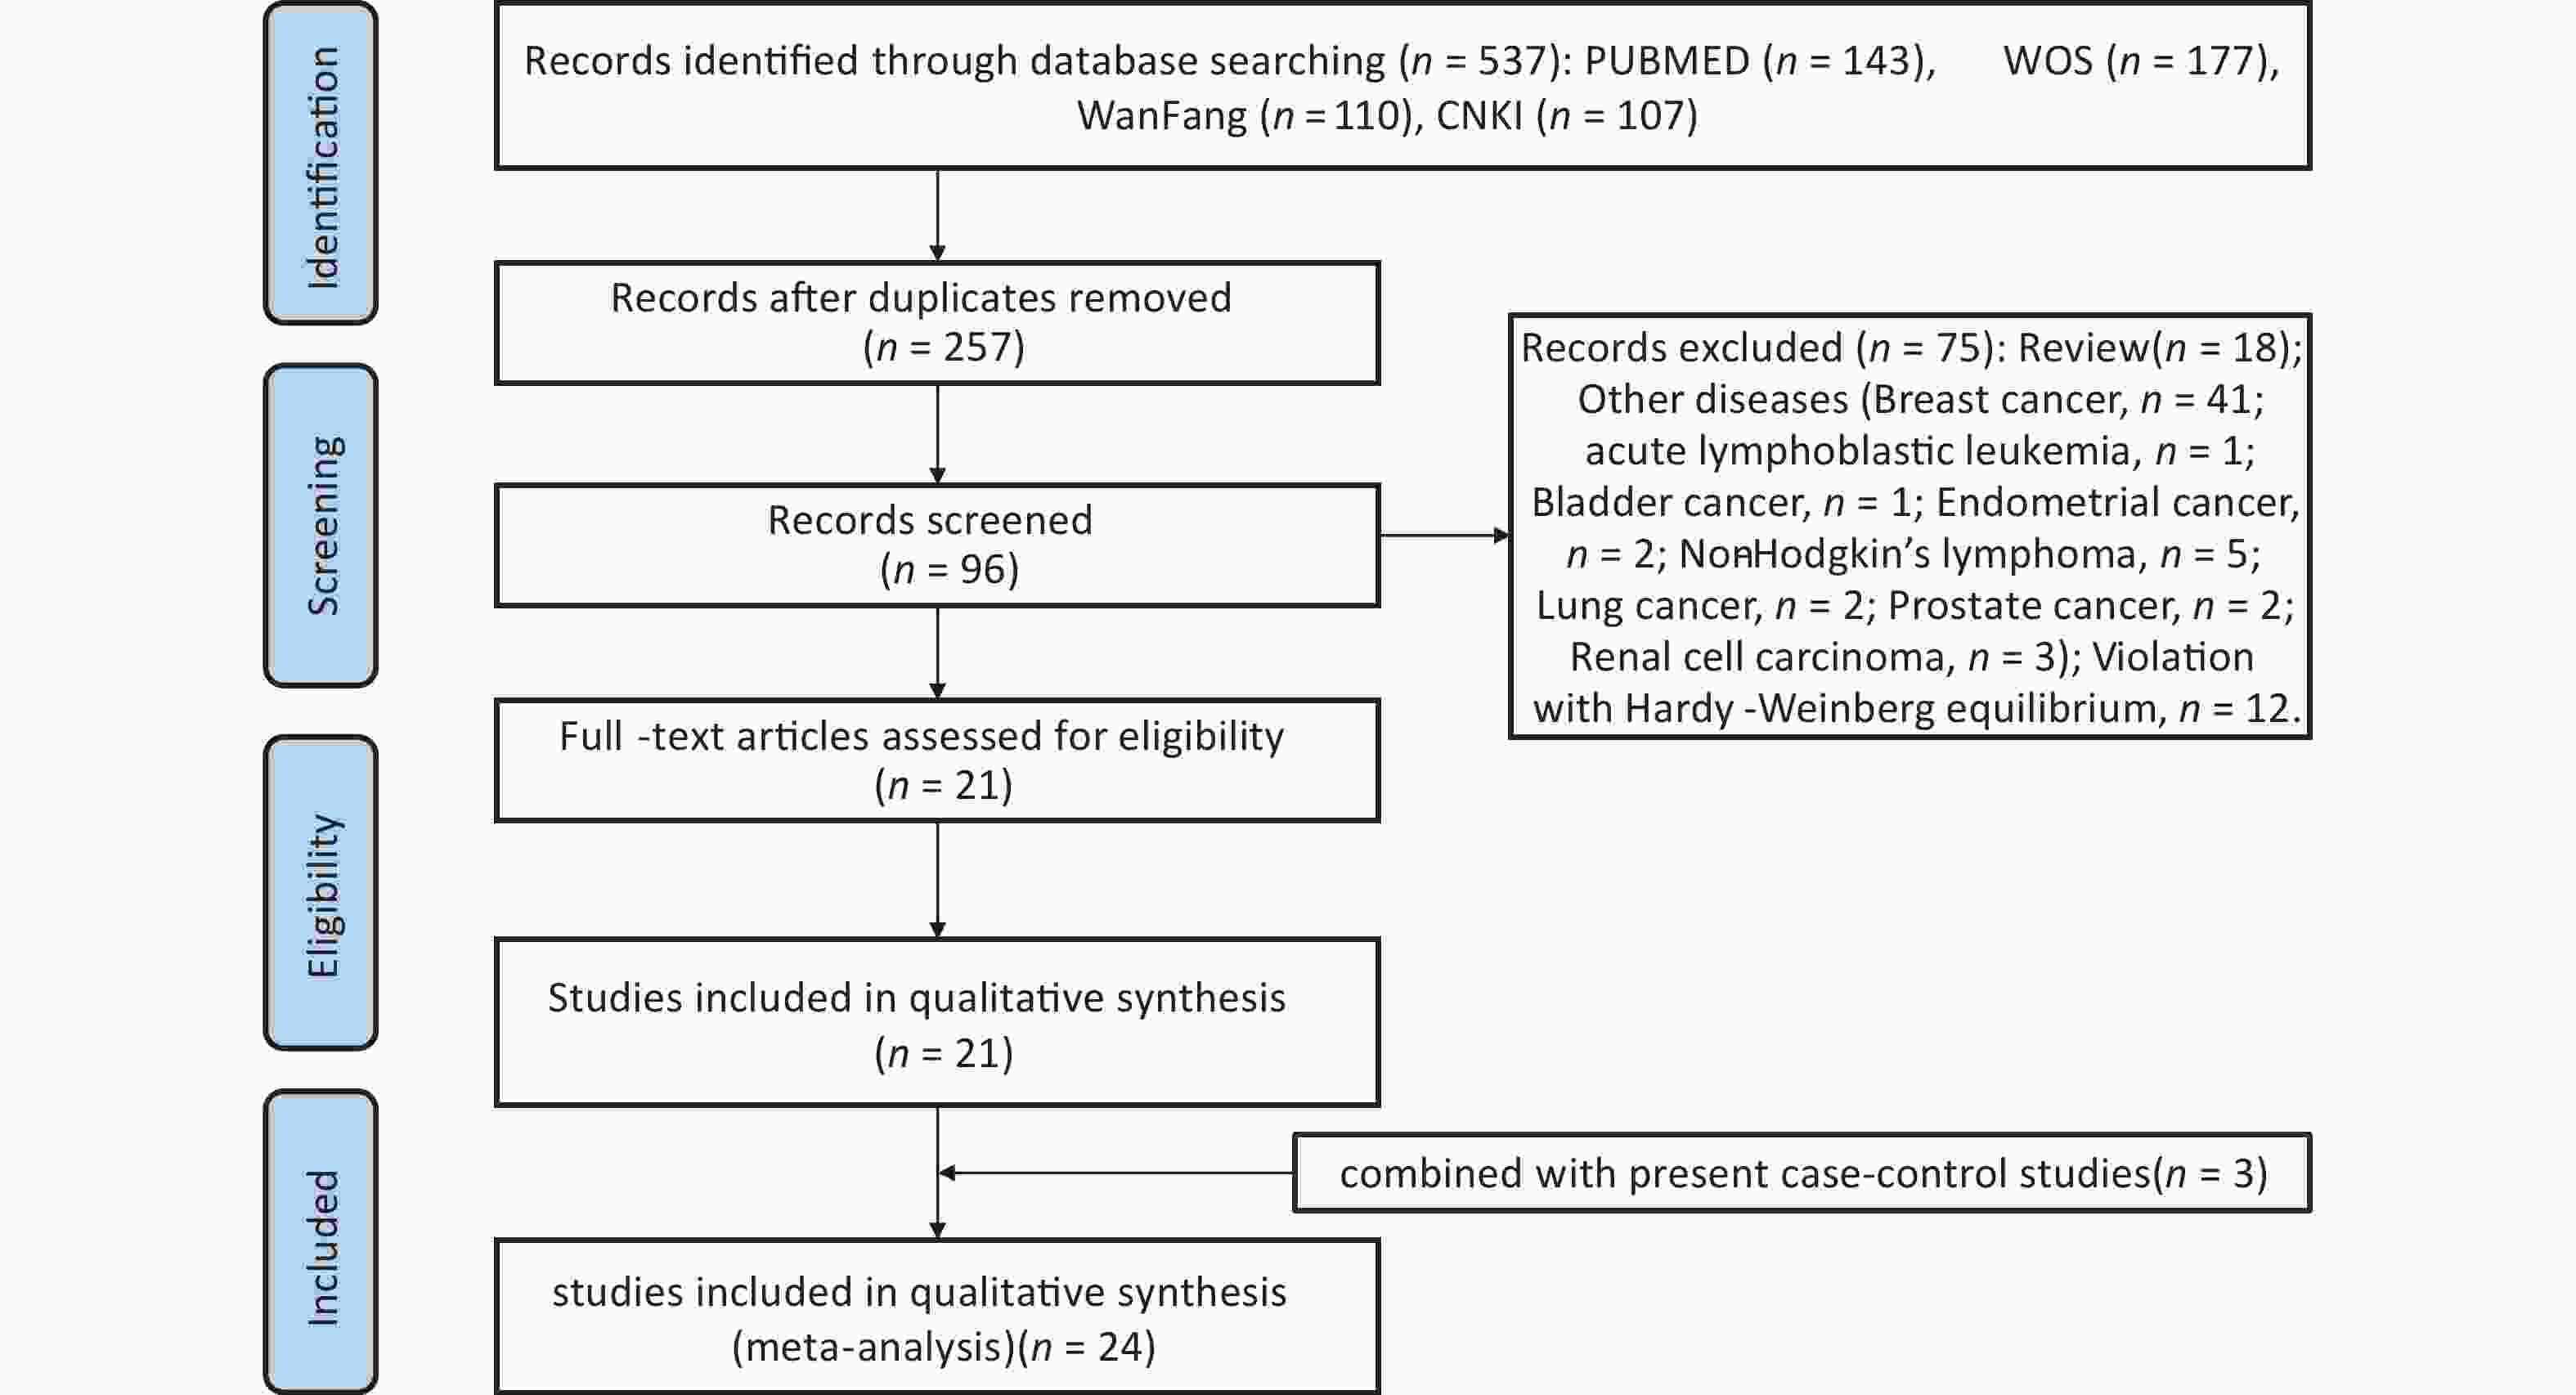
Figure S2. Flow diagram of the literature review process for this meta-analysis.
-
The principal characteristics of the participants are presented in Table 1. The distributions of age, sex, smoking status, and drinking status did not differ significantly between patients with cancer and healthy controls (P > 0.05). The average age of healthy controls and patients with gastric, colorectal, and liver cancer were 56.16 ± 10.85, 57.36 ± 10.46, 57.87 ± 10.76, and 57.57 ± 10.38 years, respectively. No statistical differences were observed in the average age between patients (with gastric, colorectal, or liver cancer) and healthy controls. These results indicate that the data from the patients with cancer and healthy controls can be compared for study purposes.
Table 1. Principal characteristics of participants
Group Age (years), n (%) Sex, n (%) Smoking status, n (%) Drinking status, n (%) P-value1 ≤ 60 > 60 Male Female Ever Never Ever Never Healthy controls
(n = 800)434 (54.3) 366 (45.7) 558 (69.7) 242 (30.3) 209 (26.1) 591 (73.9) 237 (29.6) 563 (70.4) Patients with gastric
cancer (n = 460)252 (54.8) 208 (45.2) 323 (70.3) 137 (29.7) 132 (28.8) 328 (71.2) 148 (32.1) 312 (67.9) 0.855 0.862 0.323 0.344 Patients with colorectal
cancer (n = 787)455 (57.8) 332 (42.2) 555 (70.5) 232 (29.5) 228 (29.0) 559 (71.0) 257 (32.7) 530 (67.3) 0.153 0.737 0.204 0.192 Patients with liver
cancer (n = 480)280 (58.3) 200 (41.7) 343 (71.5) 137 (28.5) 140 (29.2) 340 (70.8) 158 (32.9) 322 (67.1) 0.154 0.517 0.237 0.217 Note. 1Two-sided χ2 test for the distributions of age (1st column), sex (2nd column), smoking status (3rd column), and drinking status (4th column) between patients with gastric/colorectal/liver cancer and healthy controls. -
The association between rs1137101 and risk of gastric, colorectal, or liver cancer was examined in a Hubei Chinese population, and the statistical results are presented in Table 2. The observed genotypic distributions of rs1137101 were consistent with HWE in the healthy controls (P = 0.778), suggesting that this enrolled cohort was representative of the population. rs1137101 was nominally associated with gastric cancer risk at a significance level of 0.05 but the association did not remain after Bonferroni correction. No association was observed between the rs1137101 polymorphism and colorectal cancer risk. Of note, the presence of rs1137101 was significantly associated with liver cancer risk, even after Bonferroni correction. Specifically, compared to the G allele, the rs1137101 A allele conferred a lower risk of liver cancer (A vs. G, P = 0.002, OR = 0.66, 95% confidence intervals [CI]: 0.50–0.85). Individuals carrying the AG genotype and those carrying the AA + AG genotypes had reduced risk of liver cancer compared to individuals carrying the GG genotype (AG vs. GG, P = 0.006, OR = 0.67, 95% CI: 0.50–0.89; AA + AG vs. AG, P = 0.003, OR = 0.65, 95% CI: 0.49–0.86).
Table 2. Genotype and allele distributions of rs1137101 and its association with risk of gastric, colorectal and liver cancers in the Hubei Chinese population
Group Allele, n (%) Genotype, n (%) HWE1 Genetic model [P-value, OR (95% CI)]2 A G AA AG GG A vs. G AA vs. AG AA vs. GG AG vs. GG AA vs.
AG+GGAA+AG
vs. GGHealthy controls
(n = 800)211
(0.132)1389
(0.868)13
(0.016)185
(0.231)602
(0.753)0.778 Patients with gastric
cancer (n = 460)92
(0.100)828
(0.900)1
(0.002)90
(0.196)369
(0.802)0.018, 0.73
(0.56–0.95)0.078, 0.16
(0.02–1.23)0.046, 0.13
(0.02–0.96)0.110, 0.79
(0.60–1.05)0.051, 0.13
(0.02–1.01)0.044, 0.75
(0.57–0.99)Patients with
colorectal cancer
(n = 787)216
(0.137)1358
(0.863)12
(0.015)192
(0.244)583
(0.741)0.658, 1.05
(0.85–1.28)0.777, 0.89
(0.40–2.00)0.906, 0.95
(0.43–2.11)0.558, 1.07
(0.85–1.35)0.873, 0.94
(0.43–2.07)0.592, 1.06
(0.85–1.33)Patients with liver
cancer (n = 480)87
(0.091)873
(0.909)3
(0.006)81
(0.169)396
(0.825)0.002, 0.66
(0.50–0.85)0.328, 0.53
(0.15–1.90)0.104, 0.35
(0.10–1.24)0.006, 0.67
(0.50–0.89)0.133, 0.38
(0.11–1.34)0.003, 0.65
(0.49–0.86)Note. 1Genotypic frequency of rs1137101 in controls was tested for departure from Hardy-Weinberg equilibrium (HWE) using the two-sided χ2 test. 2The P value and OR (95% CI) were calculated for each genetic comparison between patients with gastric/colorectal/liver cancer and healthy controls, and adjusted for age, sex, smoking status, and drinking status. OR, odd ratio; CI, confidence interval. -
A total of 24 eligible studies were included in this meta-analysis. Two separate authors (HU Wei Qiong and ZHOU Wei Guang) carefully collected essential information from the eligible studies, which is presented in Supplementary Table S1 (available in www.besjournal.com). As shown in Table 3, no significant association was identified between rs1137101 and DS cancer risk. Interestingly, the stratified analysis by ethnicity also revealed lack of any significant association between rs1137101 and DS cancer risk in the Asian or Caucasian populations. In contrast, the stratified analysis by country suggested that rs1137101 was significantly associated with DS cancer risk in the Chinese population. Chinese individuals with the AA genotype were less likely to present with DS cancers than those with the AG, GG, and AG+GG genotypes (AA vs. AG, P < 0.001, OR = 0.62, 95% CI: 0.50–0.78; AA vs. GG, P < 0.001, OR = 0.53, 95% CI: 0.42–0.67; AA vs. AG + GG, P < 0.001, OR = 0.57, 95% CI: 0.46–0.70). Lastly, no significant association between rs1137101 and DS cancer risk was identified in the stratified analysis based on PCR-RFLP genotyping.
Table 3. Meta-analysis of the association between rs1137101 and digestive system cancers risk
Genetic model Heterogeneity test Pooled OR
(95% CI)1Hypothesis test Begg’s test Egger’s test Studies
(n)Q value P value I2 (%) Z value P value Z value P value Z value P value In the total population (8,279 cases/14,225 controls) A vs. G 86.03 < 0.001 74.400 0.95 (0.85–1.06) 0.93 0.352 0.00 1.000 0.40 0.695 23 AA vs. AG 39.22 0.013 43.900 0.90 (0.77–1.07) 1.18 0.237 1.16 0.245 −0.72 0.477 23 AA vs. GG 63.79 < 0.001 65.500 0.86 (0.67–1.11) 1.16 0.248 1.85 0.064 −0.42 0.682 23 AG vs. GG 38.11 0.018 42.300 0.97 (0.87–1.07) 0.65 0.514 0.53 0.597 0.55 0.588 23 AA vs. AG+GG 58.04 < 0.001 60.400 0.89 (0.74–1.08) 1.17 0.244 1.46 0.143 −0.72 0.479 24 AA+AG vs. GG 58.91 < 0.001 62.700 0.95 (0.84–1.08) 0.78 0.434 0.21 0.833 0.57 0.574 23 In the Asian population (6,105 cases/8,710 controls) A vs. G 48.98 < 0.001 73.500 0.90 (0.79–1.03) 1.52 0.129 0.11 0.913 0.56 0.588 14 AA vs. AG 21.30 0.067 39.000 0.80 (0.61–1.06) 1.58 0.115 1.42 0.155 −1.09 0.298 14 AA vs. GG 28.84 0.007 54.900 0.69 (0.48–0.99) 2.00 0.045 1.20 0.228 −0.07 0.942 14 AG vs. GG 22.30 0.051 41.700 0.92 (0.82–1.03) 1.49 0.137 0.44 0.661 0.25 0.808 14 AA vs. AG+GG 31.75 0.003 59.100 0.74 (0.54–1.03) 1.79 0.074 1.20 0.228 −0.87 0.400 14 AA+AG vs. GG 33.86 0.001 61.600 0.89 (0.78–1.03) 1.61 0.106 0.33 0.743 0.28 0.784 14 In the Chinese population (5,671 cases/8,198 controls) A vs. G 39.19 < 0.001 71.900 0.86 (0.74–0.99) 2.10 0.036 0.75 0.451 0.32 0.757 12 AA vs. AG 7.36 0.769 < 0.001 0.62 (0.50–0.78) 4.14 < 0.001 0.89 0.373 −0.12 0.905 12 AA vs. GG 15.34 0.168 28.300 0.53 (0.42–0.67) 5.33 < 0.001 0.62 0.537 0.40 0.699 12 AG vs. GG 21.77 0.026 49.500 0.91 (0.80–1.03) 1.50 0.133 0.89 0.373 −0.03 0.978 12 AA vs. AG+GG 11.49 0.403 4.200 0.57 (0.46–0.70) 5.20 < 0.001 0.62 0.537 0.15 0.882 12 AA+AG vs. GG 31.78 0.001 65.400 0.87 (0.75–1.01) 1.85 0.064 1.17 0.244 −0.22 0.833 12 In the Caucasian population (2,174 cases/5,515 controls) A vs. G 30.01 < 0.001 73.300 1.04 (0.88–1.23) 0.44 0.663 −0.10 1.000 0.25 0.808 9 AA vs. AG 16.63 0.034 51.900 0.98 (0.79–1.22) 0.17 0.864 0.52 0.602 0.67 0.524 9 AA vs. GG 26.00 0.001 69.200 1.08 (0.77–1.52) 0.46 0.644 0.94 0.348 0.43 0.680 9 AG vs. GG 11.84 0.159 32.400 1.09 (0.95–1.25) 1.17 0.242 −0.10 1.000 −0.20 0.851 9 AA vs. AG+GG 23.11 0.006 61.100 1.01 (0.81–1.26) 0.09 0.931 0.18 0.858 0.56 0.591 10 AA+AG vs. GG 19.16 0.014 58.300 1.08 (0.86–1.36) 0.68 0.497 0.10 0.917 −0.13 0.904 9 In the Australian population (774 cases/4,056 controls) A vs. G 0.27 0.874 < 0.001 0.96 (0.86–1.07) 0.80 0.424 0.00 1.000 1.31 0.415 3 AA vs. AG 0.66 0.718 < 0.001 0.85 (0.71–1.02) 1.76 0.078 1.04 0.296 4.51 0.139 3 AA vs. GG 0.28 0.871 < 0.001 0.94 (0.75–1.18) 0.56 0.575 0.00 1.000 1.32 0.413 3 AG vs. GG 0.51 0.775 < 0.001 1.10 (0.90–1.35) 0.93 0.355 0.00 1.000 −0.27 0.831 3 AA vs. AG+GG 0.52 0.772 < 0.001 0.87 (0.74–1.04) 1.55 0.122 1.04 0.296 28.33 0.022 3 AA+AG vs. GG 0.36 0.833 < 0.001 1.04 (0.86–1.26) 0.38 0.707 0.00 1.000 0.12 0.921 3 In the total population based on PCR–RFLP2 assay (3,990 cases/4,949 controls) A vs. G 84.79 < 0.001 84.700 0.94 (0.77–1.16) 0.57 0.571 0.55 0.584 0.55 0.593 14 AA vs. AG 34.66 0.001 62.500 0.92 (0.67–1.27) 0.49 0.626 0.77 0.443 −0.36 0.723 14 AA vs. GG 60.46 < 0.001 78.500 0.83 (0.51–1.35) 0.76 0.447 1.09 0.274 0.11 0.913 14 AG vs. GG 33.89 0.001 61.600 0.94 (0.78–1.14) 0.64 0.522 0.22 0.827 0.52 0.615 14 AA vs. AG+GG 54.49 < 0.001 76.100 0.88 (0.61–1.27) 0.68 0.495 0.77 0.443 −0.37 0.717 14 AA+AG vs. GG 55.80 < 0.001 76.700 0.94 (0.74–1.18) 0.55 0.581 0.00 1.000 0.60 0.563 14 Note. 1OR, odd ratio; CI, confidence interval. 2PCR–RFLP, polymerase chain reaction–restriction fragment length polymorphism. Table S1. Main features of the included studies for this meta-analysis
References
(Author, Year)Year Ethnicity Country Cancer
Type1Genotyping
assay2Case, Control (n) Correlation
(Yes/No)Total A/G AA/AG/GG Domingos et al. 2014 Caucasian Brazil OC PCR-RFLP 25, 89 31/19, 118/60 12/7/6, 40/38/11 Yes Rodrigues et al. 2015 Caucasian Brazil OC PCR-RFLP 129, 186 181/77, 228/144 60/61/8, 68/92/26 Yes Hussain et al. 2015 Caucasian India OC PCR-RFLP 306, 228 206/406, 96/360 48/110/148, 12/72/144 Yes Hung et al. 2019 Asian China OC TaqMan 567, 560 127/1007, 128/992 5/117/445, 10/108/442 No Doecke et al. 2008 Caucasian Australia EC(EAC) Sequenom 260, 1352 286/234, 1501/1203 73/140/47, 419/663/270 No Doecke et al. 2008 Caucasian Australia EC(EGJAC) Sequenom 301, 1352 322/280, 1501/1203 81/160/60, 419/663/270 No Doecke et al. 2008 Caucasian Australia EC(ESCC) Sequenom 213, 1352 234/192, 1501/1203 64/106/43, 419/663/270 No Qiu et al. 2017 Asian China EC(ESCC) SNPscan 504, 1489 120/888, 364/2614 6/108/390, 21/322/1146 Yes Ren et al. 2010 Asian China GC PCR-RFLP 117, 104 44/190, 22/186 3/38/76, 1/20/83 Yes Pan et al. 2014 Asian China GC PCR-RFLP 546, 632 142/950, 201/1063 11/120/415, 22/157/453 Yes Ling et al. 2016 Asian China GC PCR-RFLP 89, 97 19/159, 41/153 1/17/71, 6/29/62 Yes This study_1 2023 Asian China GC PCR-RFLP 460, 800 92/828, 211/1389 1/90/369, 13/185/602 No Chia et al. 2007 Caucasian America CRC MassARRAY 101, 100 NA, NA AA/AG+GG=32/69, 33/67 No Pechlivanis et al. 2009 Caucasian Czech
RepublicCRC TaqMan 639, 706 678/600, 765/647 179/320/140, 202/361/143 No Vašků et al. 2009 Caucasian Czech
RepublicCRC PCR-RFLP 100, 100 102/98, 113/87 23/56/21, 34/45/21 No Karimi et al. 2011 Asian Iran CRC PCR-RFLP 173, 173 229/117, 214/132 77/75/21, 67/80/26 No Mahmoudi et al. 2016 Asian Iran CRC PCR-RFLP 261, 339 355/167, 439/239 127/101/33, 146/147/46 No Lin et al. 2020 Asian China CRC SNPscan 980, 1299 235/1725, 323/2275 15/205/760, 19/285/995 Yes This study_2 2023 Asian China CRC PCR-RFLP 787, 800 216/1358, 211/1389 12/192/583, 13/185/602 No Li et al. 2012 Asian China LC PCR-RFLP 417, 551 382/452, 634/468 87/208/122, 189/256/106 Yes Zhang et al. 2018 Asian China LC SNPscan 575, 920 125/1025, 213/1627 3/119/453, 10/193/717 No Karam et al. 2020 Caucasian Egypt LC PCR-RFLP 100, 50 45/155, 30/70 5/35/60, 5/20/25 Yes Tang et al. 2020 Asian China LC SNaPshot 149, 146 35/263, 35/257 2/31/116, 3/29/114 No This study_3 2023 Asian China LC PCR-RFLP 480, 800 87/873, 211/1389 3/81/396, 13/185/602 Yes Note. 1OC, oral cancer; EC, esophageal cancer; EAC, esophageal adenocarcinoma; EGJAC, esophagogastric junction adenocarcinoma; ESCC, esophageal squamous cell carcinoma; GC, gastric cancer; CRC, colorectal cancer; LC, liver cancer. 2 PCR-RFLP, polymerase chain reaction-restriction fragment length polymorphism. -
A stratified analysis according to cancer type was conducted, and the pooled results are presented in Table 4. We found that rs1137101 had no significant effect on the risk of oral, esophageal, or colorectal cancer. However, a marked effect of rs1137101 on the risk of gastric and liver cancers was observed in the total population. The AA genotype carriers were less likely to have gastric cancer than the GG (AA vs. GG, P = 0.006, OR = 0.44, 95% CI: 0.24–0.79) or AG+GG genotype carriers (AA vs. AG+GG, P = 0.008, OR = 0.45, 95% CI: 0.25–0.82). Moreover, the A allele showed a protective role compared to the G allele in liver carcinogenesis (A vs. G, P = 0.003, OR = 0.74, 95% CI: 0.61–0.91). The individuals with the AA genotype had a lower risk of presenting with liver cancer than those with the AG (AA vs. AG, P < 0.001, OR = 0.56, 95% CI: 0.42–0.75), GG (AA vs. GG, P < 0.001, OR = 0.41, 95% CI: 0.30–0.56), or AG+GG genotypes (AA vs. AG+GG, P < 0.001, OR = 0.50, 95% CI: 0.38–0.65). The individuals with the AG genotype were also less likely to have liver cancer than those with the GG genotype (AG vs. GG, P = 0.005, OR = 0.80, 95% CI: 0.69–0.94). Interestingly, the association between rs1137101 and liver cancer risk was confirmed in the Chinese population (AA vs. AG, AA vs. GG, AG vs. GG, and AA vs. AG+GG).
Table 4. Meta-analysis of the association between rs1137101 and risk of specific digestive system cancers
Genetic model Heterogeneity test Pooled OR
(95% CI)1Hypothesis test Begg's test Egger's test Studies
(n)Q value P value I2 (%) Z value P value Z value P value Z value P value Oral cancer (1,027 cases/1,063 controls) A vs. G 14.05 0.003 78.600 1.28 (0.88–1.86) 1.30 0.194 −0.34 1.000 −0.35 0.761 4 AA vs. AG 7.05 0.070 57.400 1.39 (0.76–2.51) 1.07 0.284 0.34 0.734 −0.42 0.714 4 AA vs. GG 15.35 0.002 80.500 1.42 (0.50–4.06) 0.66 0.508 1.02 0.308 −4.18 0.053 4 AG vs. GG 7.33 0.062 59.100 1.22 (0.80–1.86) 0.91 0.365 −0.34 1.000 −0.24 0.836 4 AA vs. AG+GG 10.14 0.017 70.400 1.42 (0.73–2.78) 1.03 0.302 1.02 0.308 −0.73 0.539 4 AA+AG vs. GG 12.11 0.007 75.200 1.31 (0.78–2.20) 1.02 0.309 −0.34 1.000 −0.02 0.985 4 Esophageal cancer (1,278 cases/5,545 controls) A vs. G 0.28 0.963 < 0.001 0.96 (0.87–1.06) 0.83 0.404 −0.34 1.000 1.25 0.337 4 AA vs. AG 0.66 0.882 < 0.001 0.85 (0.71–1.02) 1.80 0.073 1.02 0.308 0.19 0.867 4 AA vs. GG 0.33 0.955 < 0.001 0.93 (0.75–1.16) 0.64 0.523 −0.34 1.000 −0.41 0.721 4 AG vs. GG 0.97 0.809 < 0.001 1.05 (0.90–1.23) 0.64 0.519 0.34 0.734 1.05 0.403 4 AA vs. AG+GG 0.52 0.914 < 0.001 0.87 (0.74–1.03) 1.59 0.112 0.34 0.734 0.02 0.986 4 AA+AG vs. GG 0.51 0.917 < 0.001 1.01 (0.87–1.18) 0.17 0.862 0.34 0.734 0.90 0.461 4 Gastric cancer in the Chinese population (1,212 cases/1,633 controls) A vs. G 14.43 0.002 79.200 0.83 (0.56–1.24) 0.91 0.363 0.34 0.734 0.32 0.778 4 AA vs. AG 2.84 0.418 < 0.001 0.51 (0.28–0.95) 2.11 0.035 0.34 0.734 −0.55 0.638 4 AA vs. GG 5.78 0.123 48.100 0.44 (0.24–0.79) 2.74 0.006 0.34 0.734 −0.27 0.812 4 AG vs. GG 10.17 0.017 70.500 0.90 (0.61–1.31) 0.56 0.577 0.34 0.734 0.41 0.718 4 AA vs. AG+GG 4.94 0.177 39.200 0.45 (0.25–0.82) 2.62 0.008 0.34 0.734 −0.33 0.774 4 AA+AG vs. GG 12.98 0.005 76.900 0.86 (0.57–1.30) 0.73 0.467 0.34 0.734 0.37 0.750 4 Colorectal cancer (3,041 cases/3,517 controls) A vs. G 4.74 0.448 < 0.001 1.01 (0.92–1.10) 0.15 0.882 0.38 0.707 0.43 0.689 6 AA vs. AG 5.72 0.335 12.500 1.04 (0.88–1.24) 0.50 0.614 0.38 0.707 −0.70 0.522 6 AA vs. GG 2.98 0.703 < 0.001 1.00 (0.81–1.23) 0.04 0.968 0.75 0.452 0.37 0.731 6 AG vs. GG 1.71 0.888 < 0.001 0.99 (0.87–1.12) 0.21 0.833 0.75 0.452 1.07 0.346 6 AA vs. AG+GG 5.96 0.427 < 0.001 1.03 (0.88–1.20) 0.40 0.691 0.30 0.764 −0.64 0.553 7 AA+AG vs. GG 1.83 0.872 < 0.001 0.99 (0.88–1.12) 0.15 0.885 0.38 0.707 1.17 0.306 6 Liver cancer in the total population (1,721 cases/2,467 controls) A vs. G 9.01 0.061 55.600 0.74 (0.61–0.91) 2.93 0.003 0.24 0.806 0.66 0.556 5 AA vs. AG 0.07 0.999 < 0.001 0.56 (0.42–0.75) 3.96 <0.001 −0.24 1.000 −0.62 0.581 5 AA vs. GG 0.38 0.984 < 0.001 0.41 (0.30–0.56) 5.45 <0.001 1.22 0.221 1.08 0.360 5 AG vs. GG 5.37 0.251 25.600 0.80 (0.69–0.94) 2.78 0.005 −0.24 1.000 0.03 0.980 5 AA vs. AG+GG 0.28 0.991 < 0.001 0.50 (0.38–0.65) 5.06 < 0.001 0.73 0.462 −0.46 0.679 5 AA+AG vs. GG 8.70 0.069 54.000 0.74 (0.58–0.94) 2.43 0.015 0.24 0.806 0.03 0.980 5 Liver cancer in the Chinese population (1,621 cases/2,417 controls) A vs. G 8.96 0.030 66.500 0.75 (0.60–0.95) 2.42 0.015 0.34 0.734 0.93 0.450 4 AA vs. AG 0.07 0.995 < 0.001 0.56 (0.42–0.75) 3.88 < 0.001 0.34 0.734 −0.67 0.574 4 AA vs. GG 0.38 0.944 < 0.001 0.41 (0.29–0.57) 5.30 < 0.001 1.70 0.089 0.96 0.436 4 AG vs. GG 5.30 0.151 43.400 0.81 (0.69–0.95) 2.66 0.008 −0.34 1.000 0.22 0.843 4 AA vs. AG+GG 0.27 0.966 < 0.001 0.50 (0.38–0.66) 4.94 < 0.001 0.34 0.734 −0.30 0.789 4 AA+AG vs. GG 8.60 0.035 65.100 0.75 (0.57–0.99) 2.04 0.042 0.34 0.734 0.21 0.854 4 Note. 1OR, odd ratio; CI, confidence interval. -
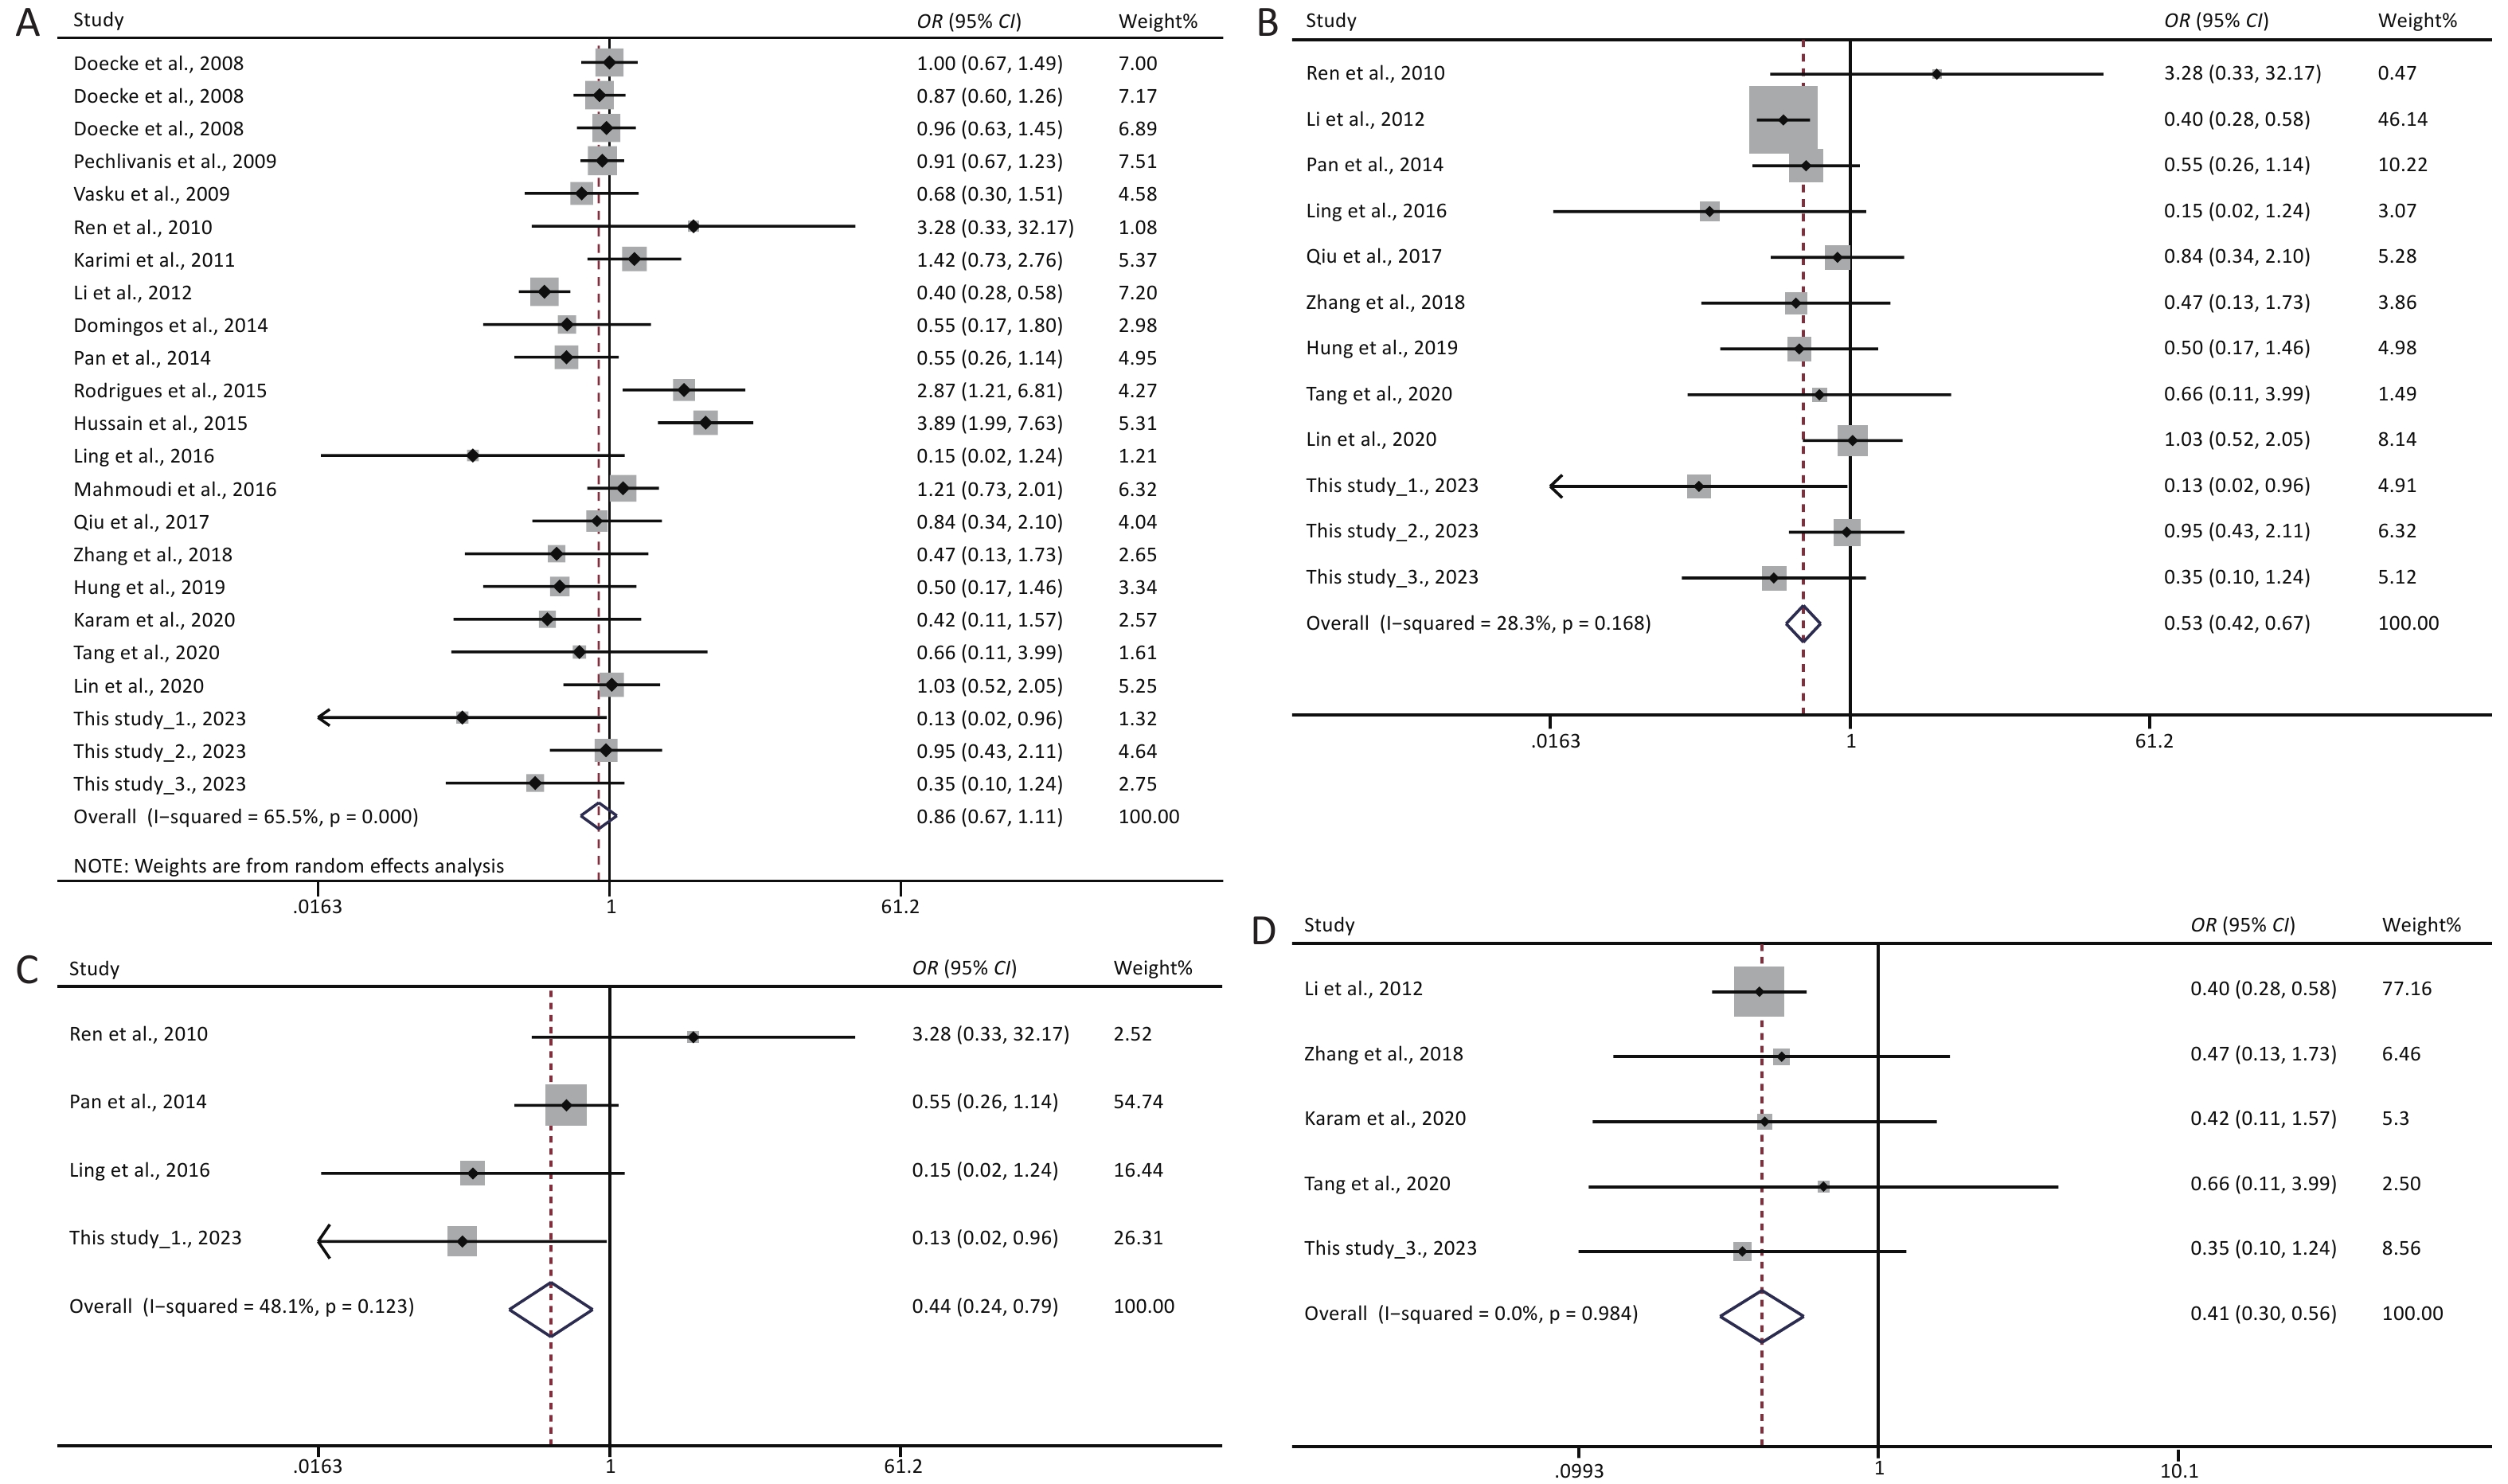
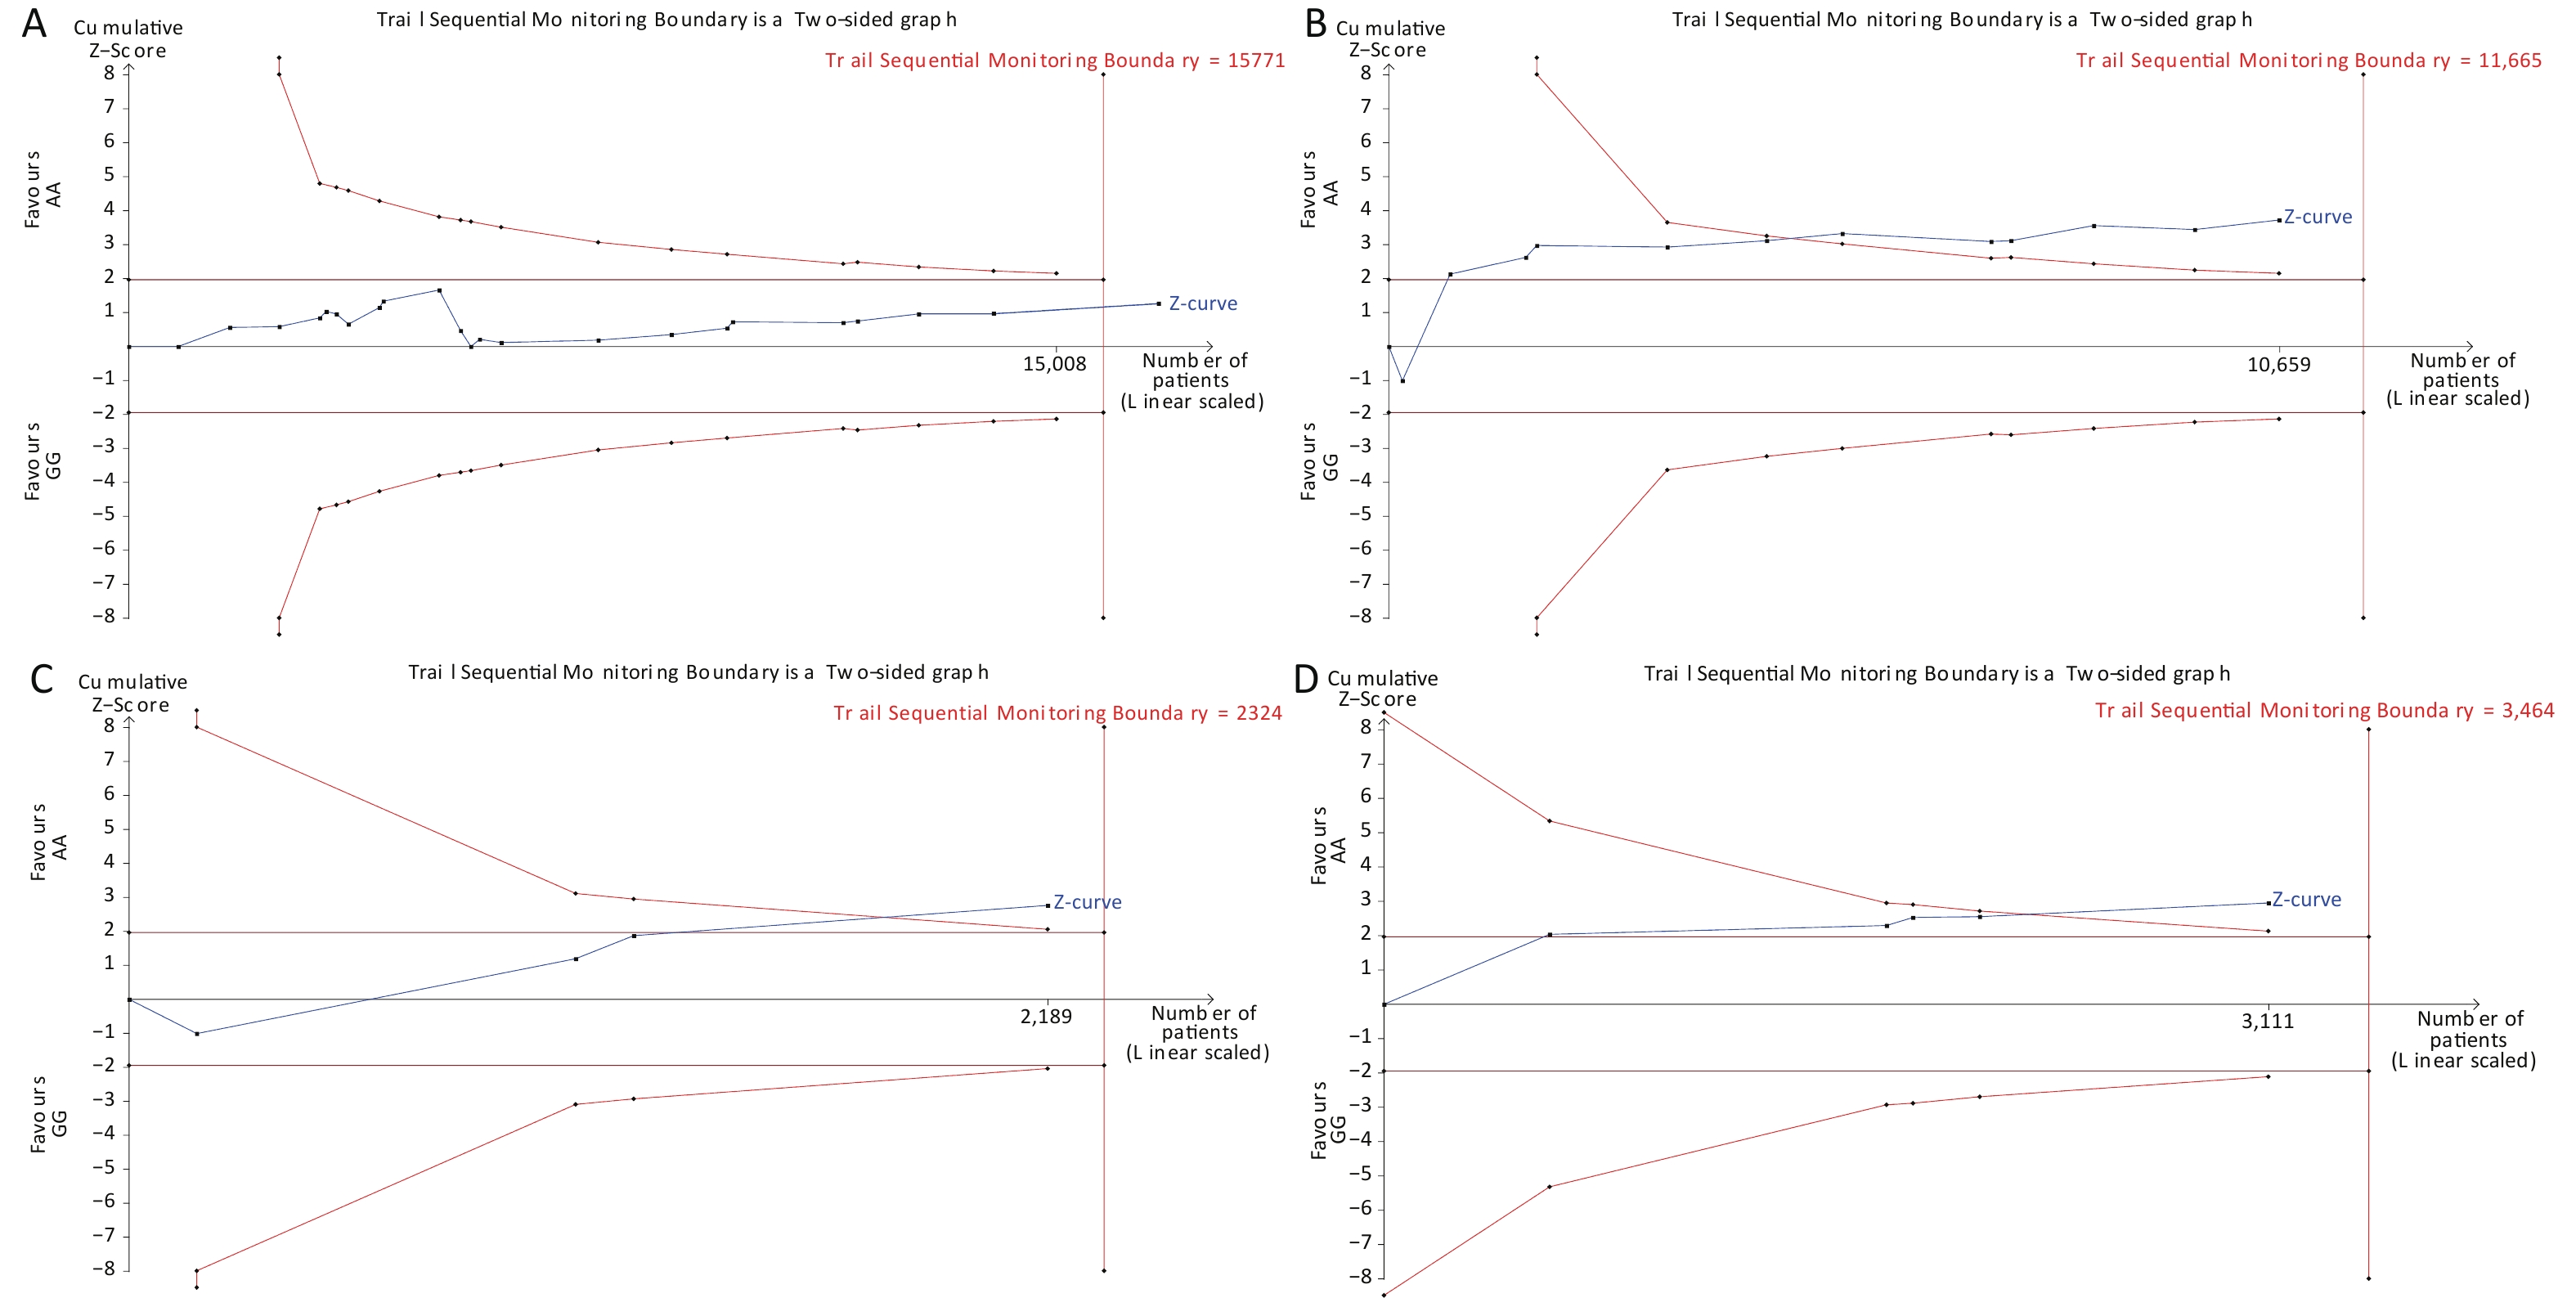
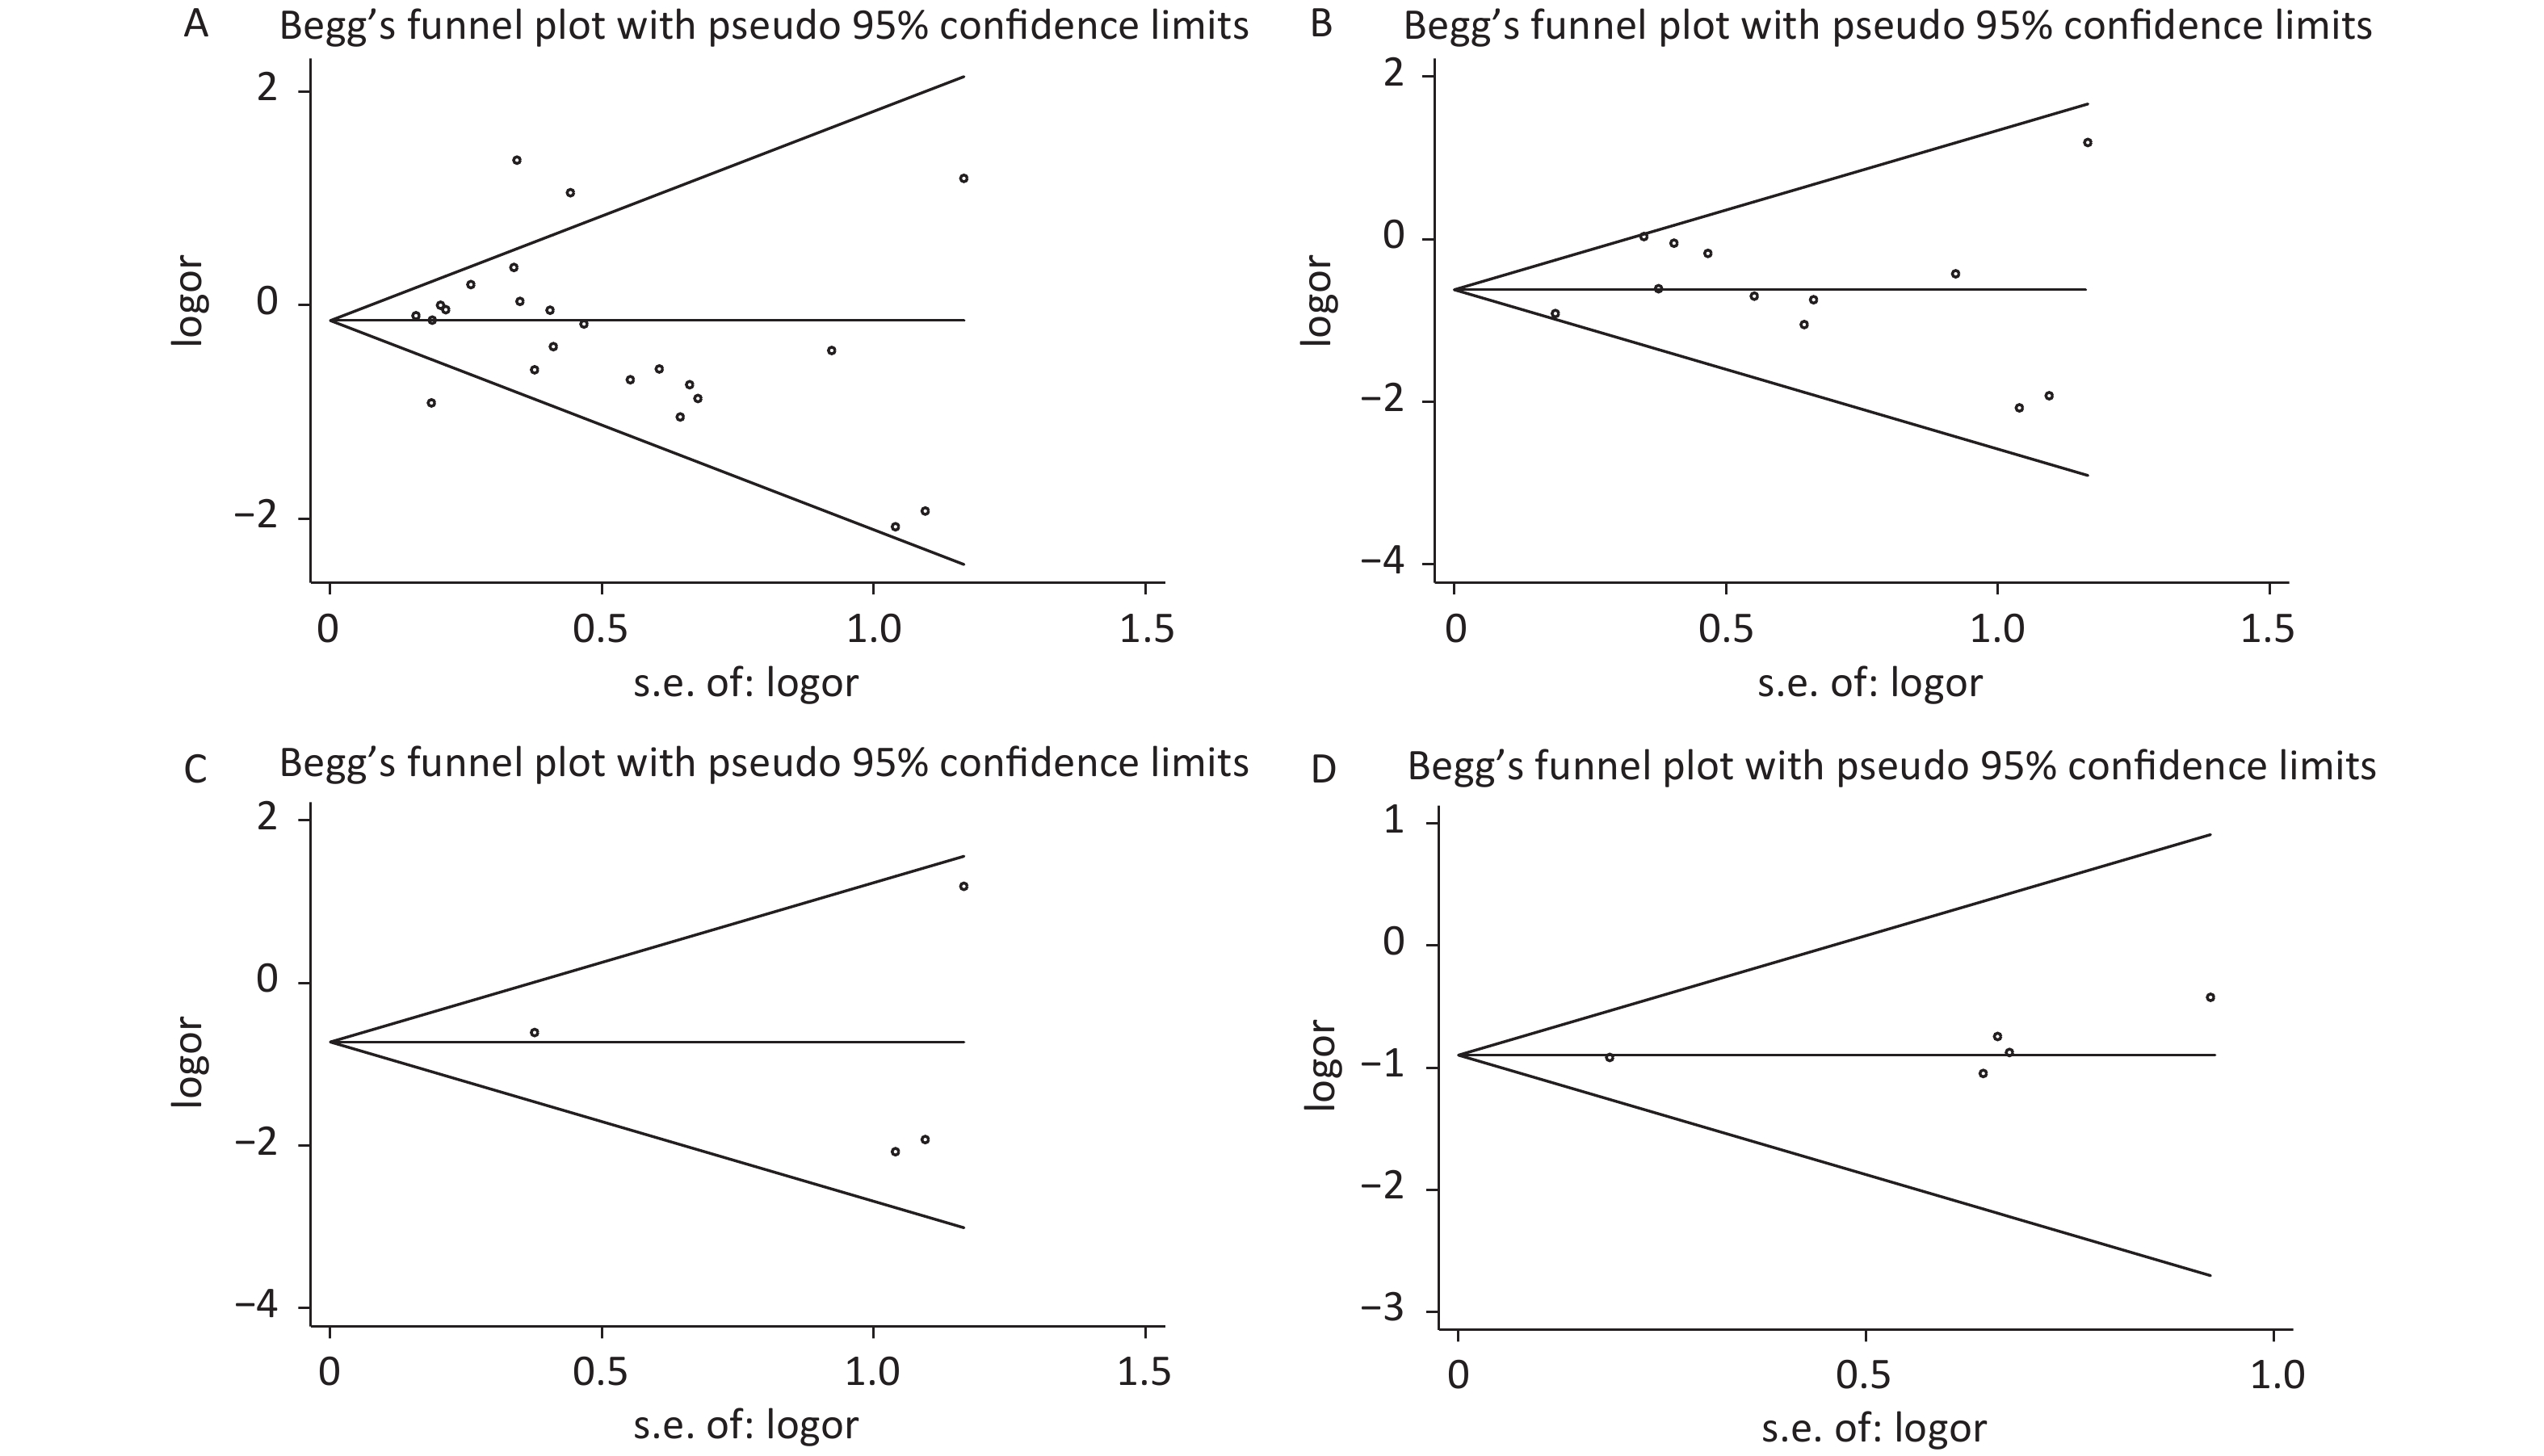
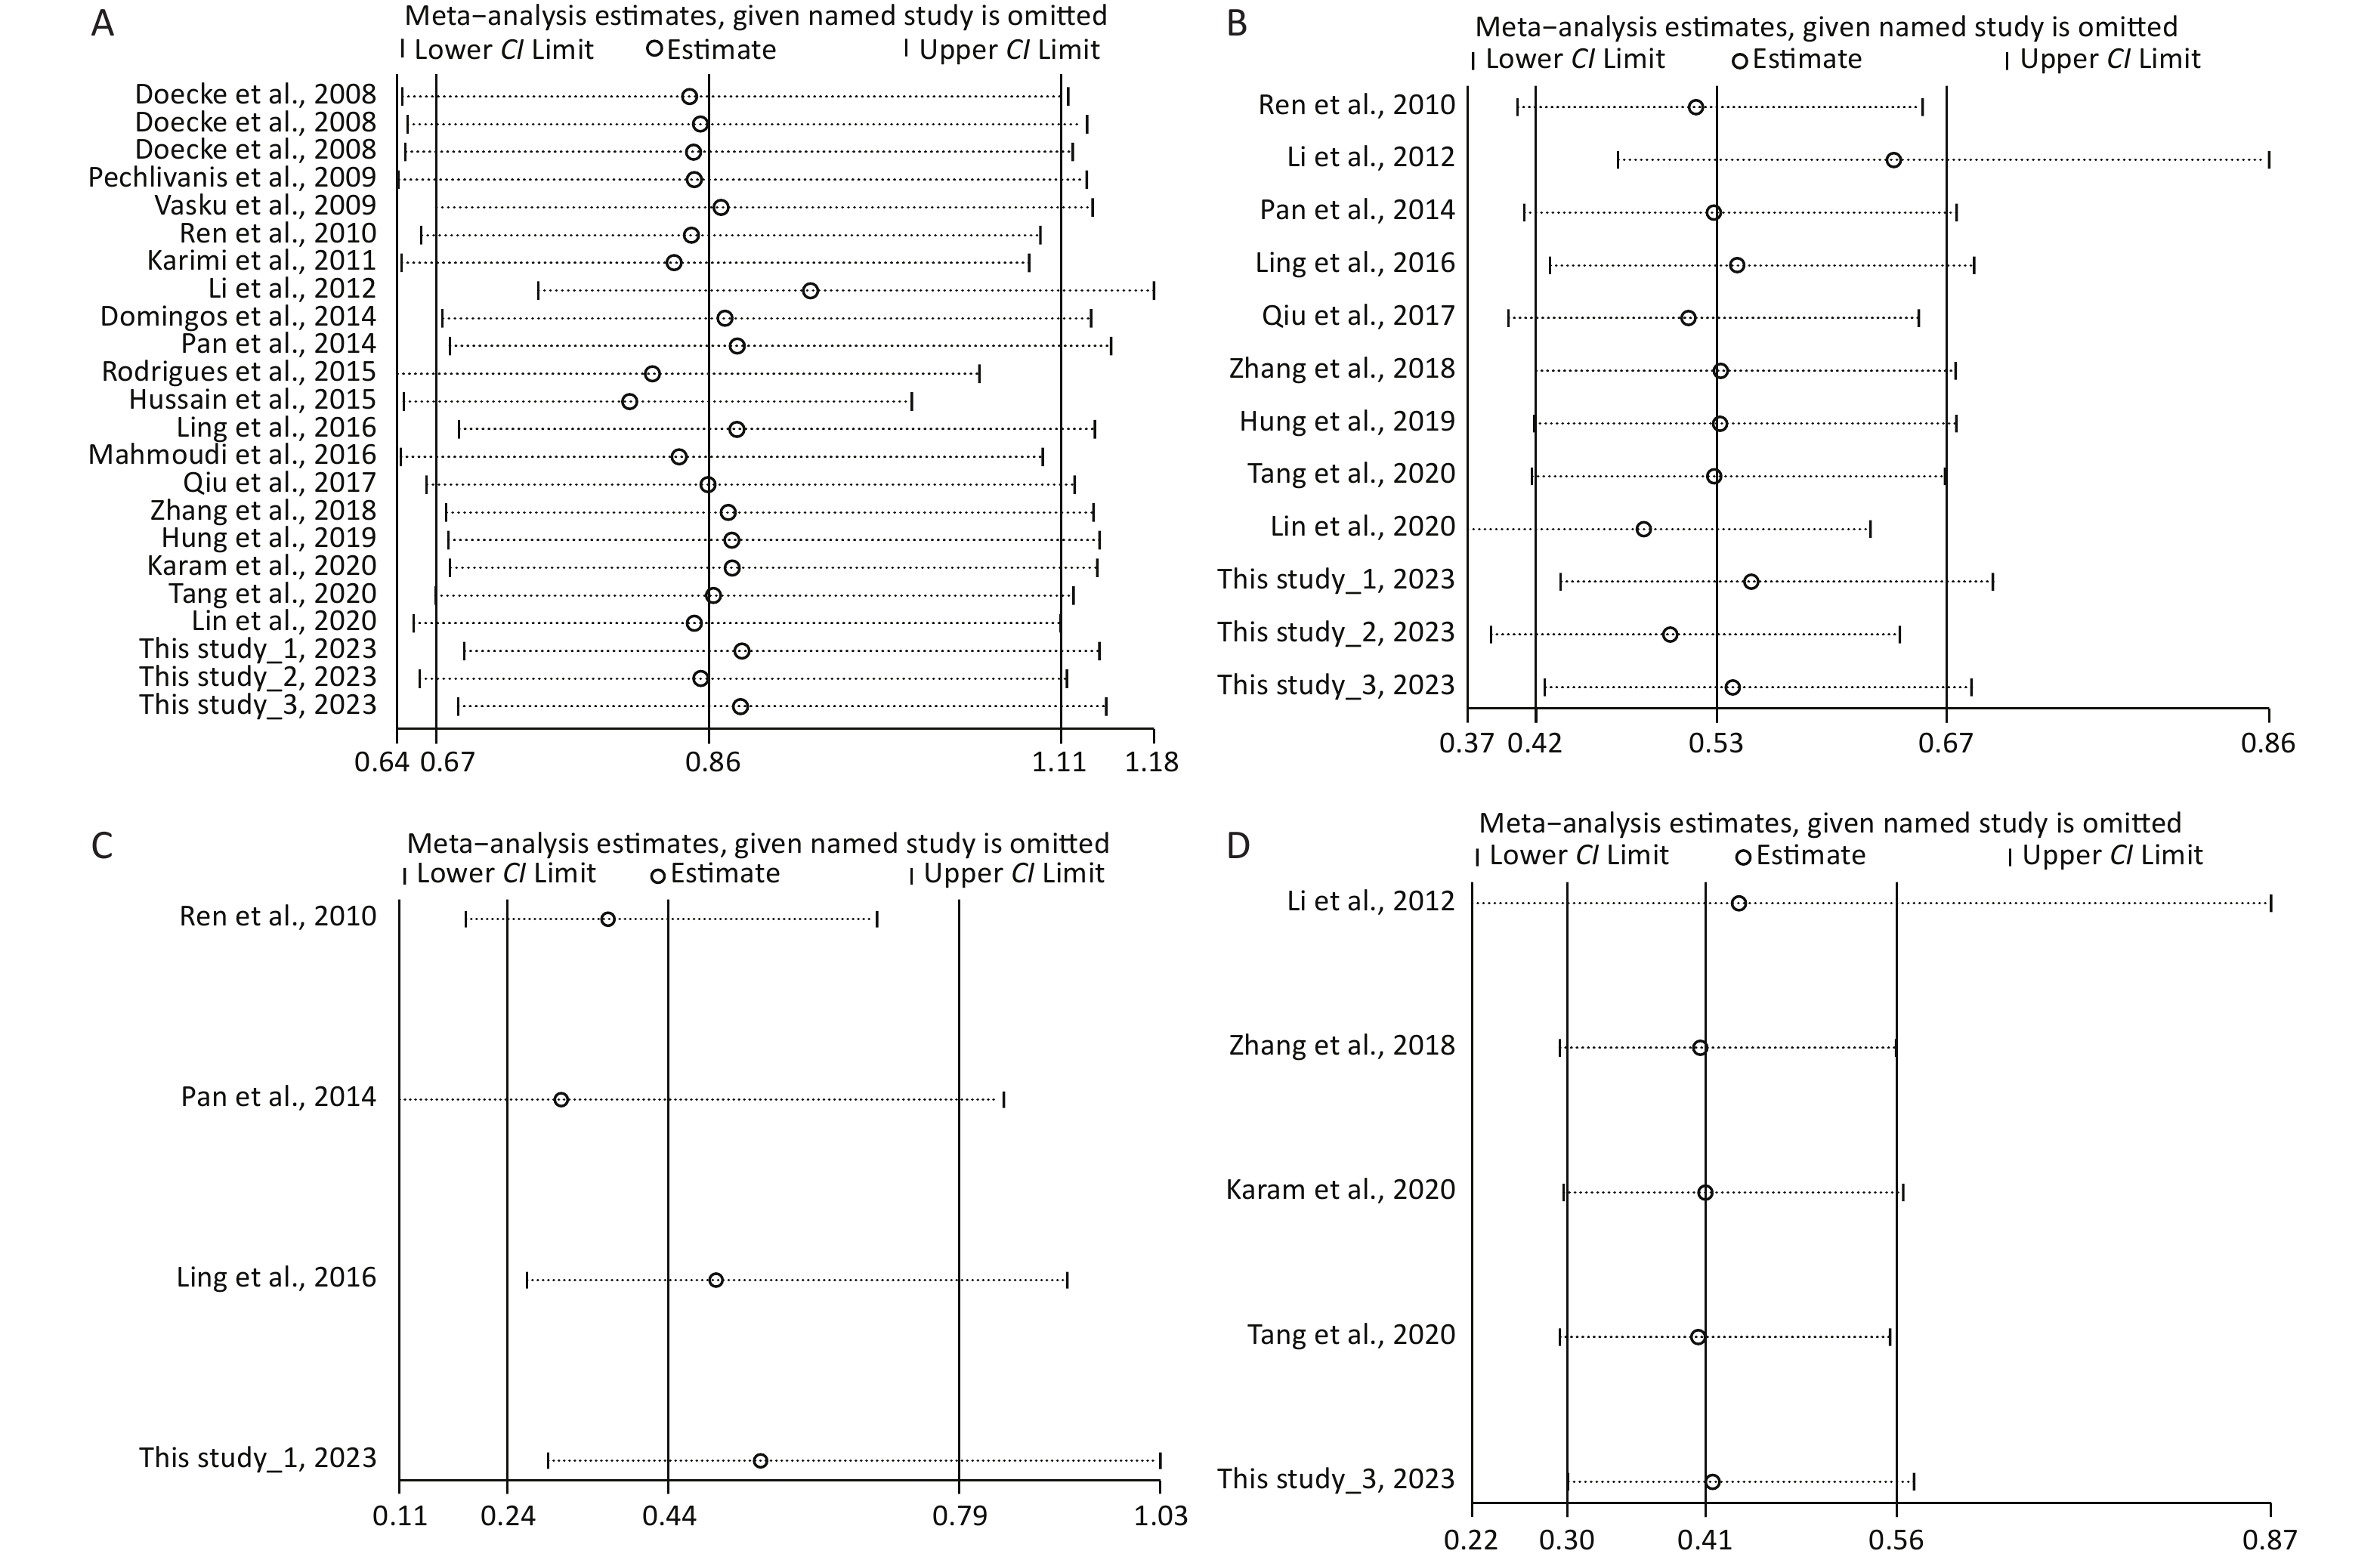
Under the genetic model of AA vs. GG, forest plots, funnel plots, sensitivity analysis, and TSA were separately performed for the meta-analysis on the association between rs1137101 and DS cancer risk in the total population (Figure 1A, 2A, 3A, and 4A) and Chinese population (Figures 1B, 2B, 3B, and 4B); and for the meta-analysis of the association of rs1137101 with gastric cancer risk in the total population (Figures 1C, 2C, 3C, and 4C) and with liver cancer risk in the total population (Figures 1D, 2D, 3D, and 4D). The Begg (Tables 3 and 4) and Egger tests (Tables 3 and 4) demonstrated no evidence of publication bias in any of the genetic models. The funnel plots of AA vs. GG also excluded the occurrence of publication bias. The sensitivity analysis showed that the pooled ORs did not significantly change after systematically removing individual studies. As shown in Figure 4A, the cumulative Z-curve did not cross Z = 1.96 or the trial sequential monitoring boundary (TSMB) before reaching the required information size line, providing firm evidence for the lack of association between rs1137101 and DS cancer risk in the total population. The TSA results in Figures 4B, 4C, and 4D show that the cumulative Z-curves crossed both Z = 1.96 and TSMB before reaching the required information size line, confirming the real contribution of rs1137101 to the risk of DS cancers in the Chinese population and risk of gastric and liver cancers in the total population.
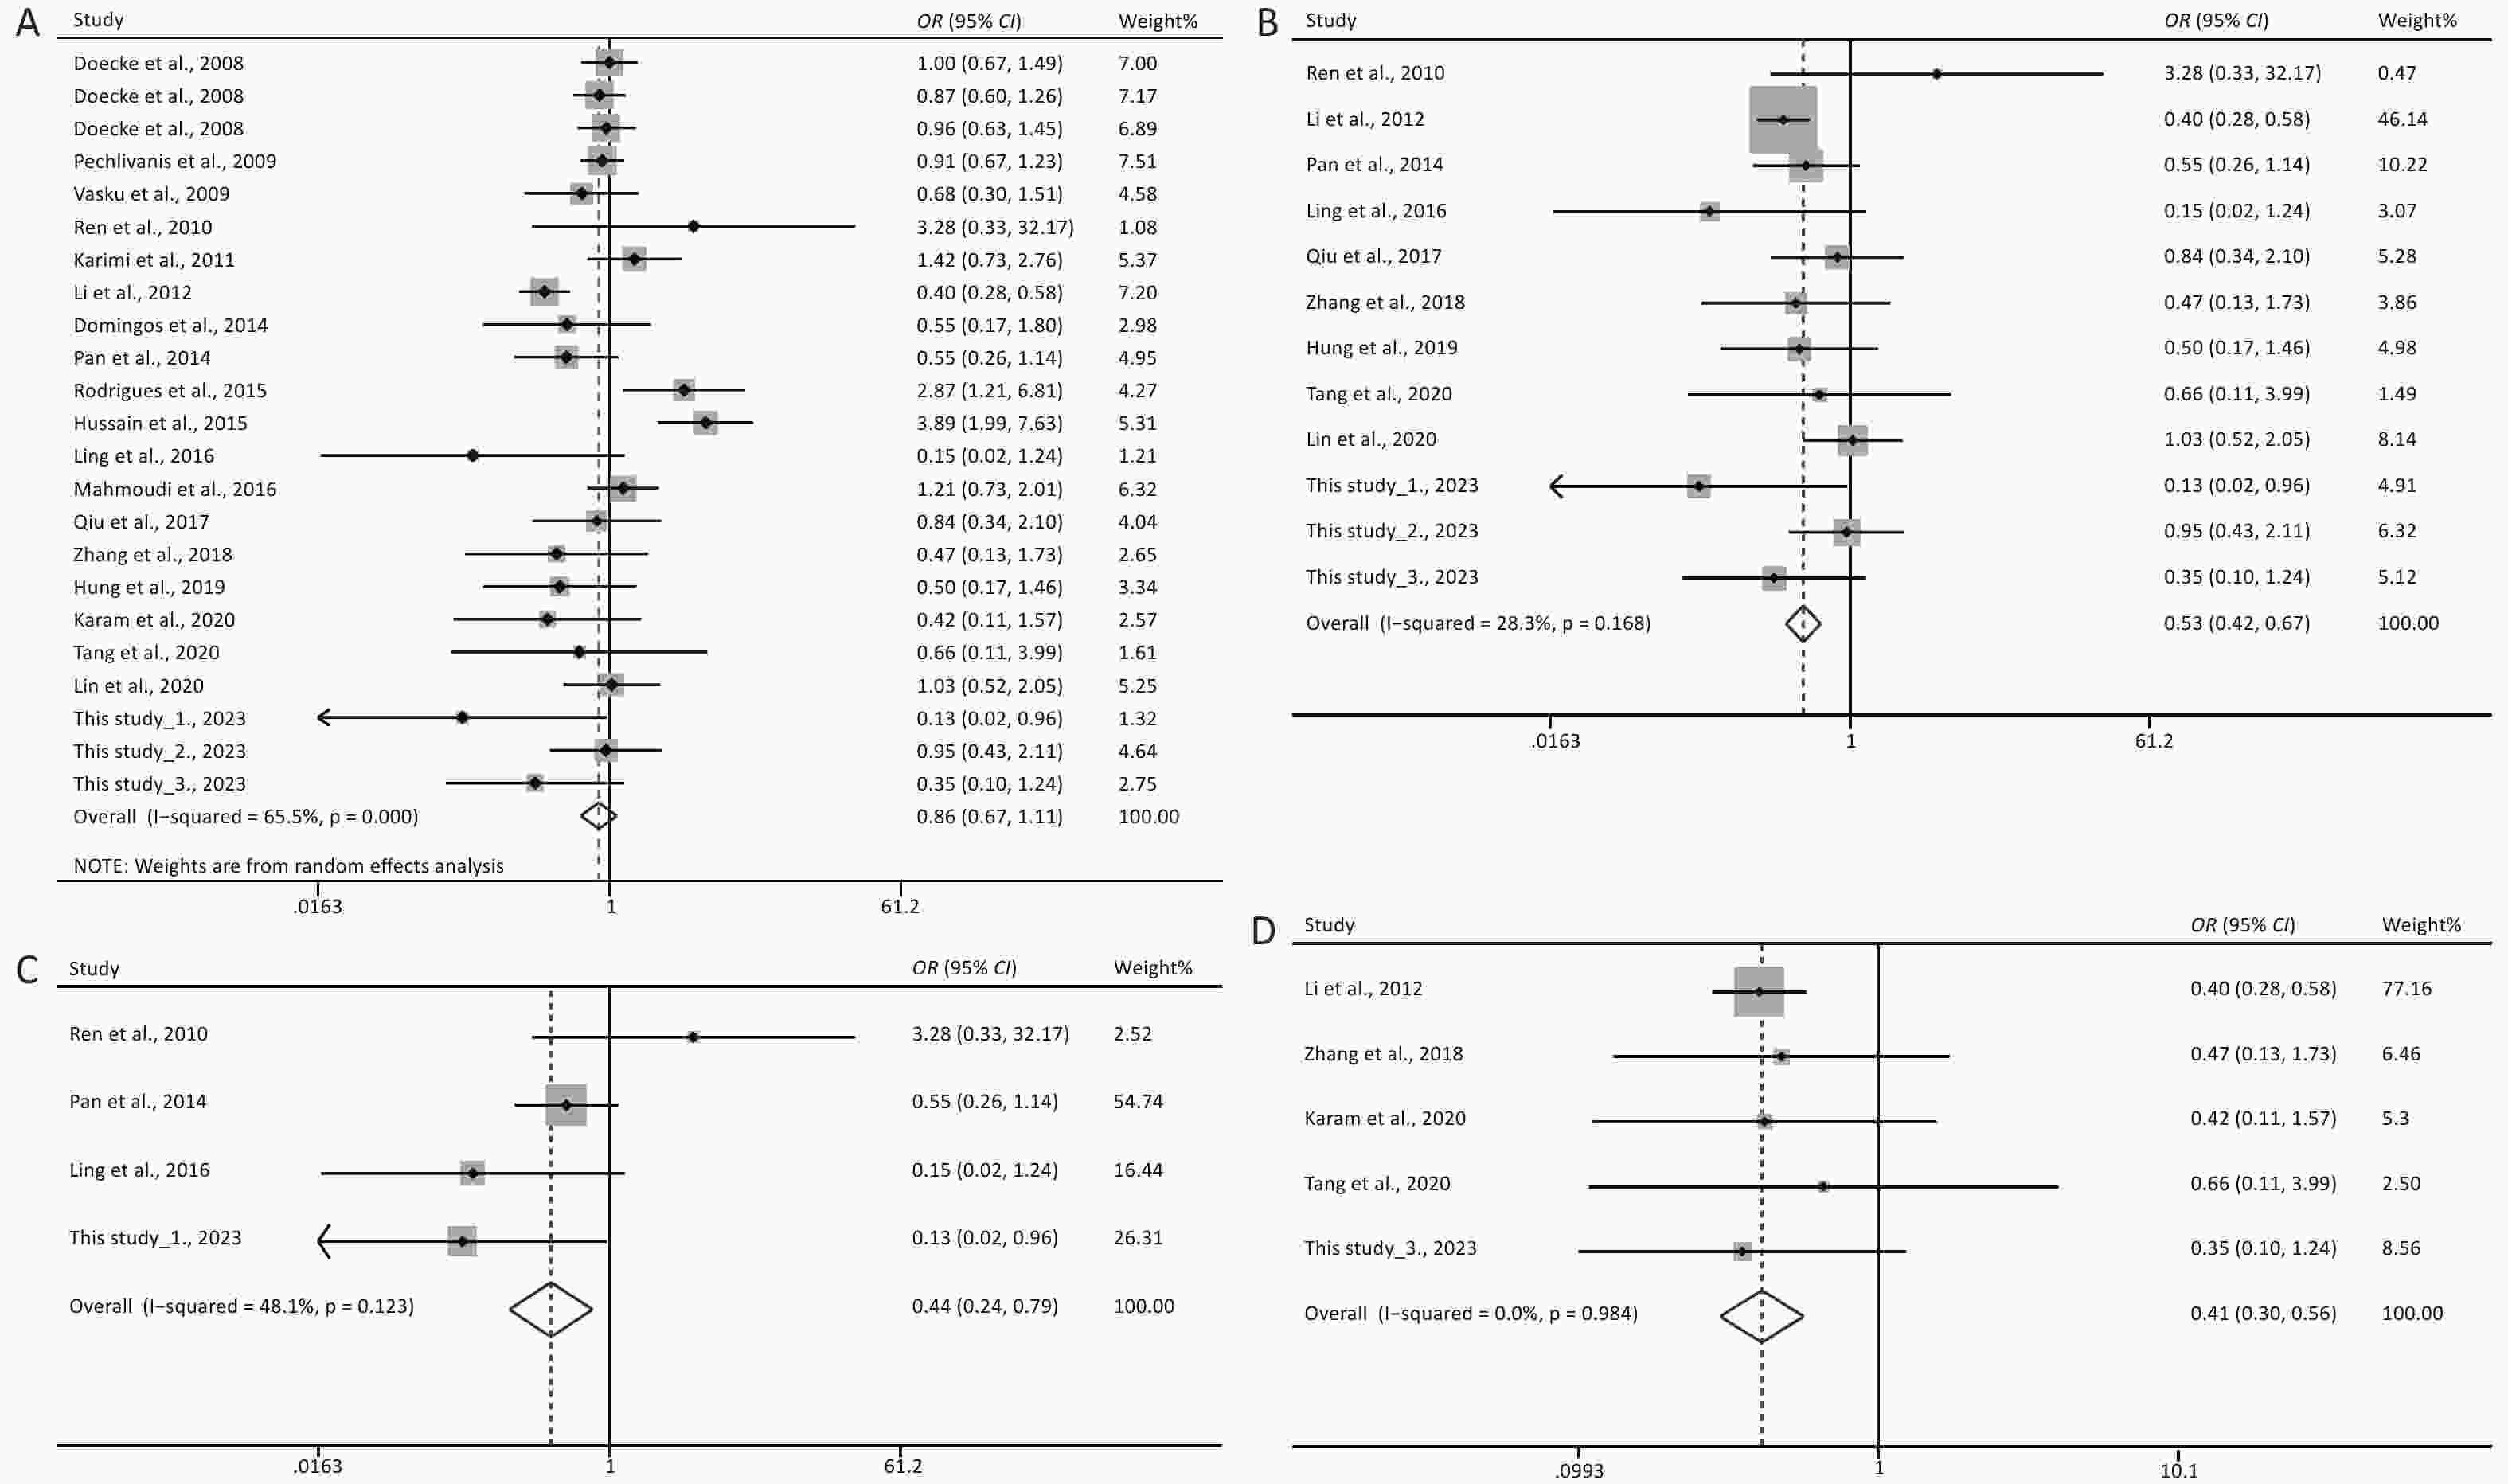
Figure 1. Forest plots of AA vs. GG for the meta-analysis of the association of rs1137101 with digestive-system cancer risk in the total population (A) and the Chinese population (B); and for the meta-analysis of the association of rs1137101 with gastric cancer risk (C) and liver cancer risk (D) in the total population. OR, odd ratio; CI, confidence interval.
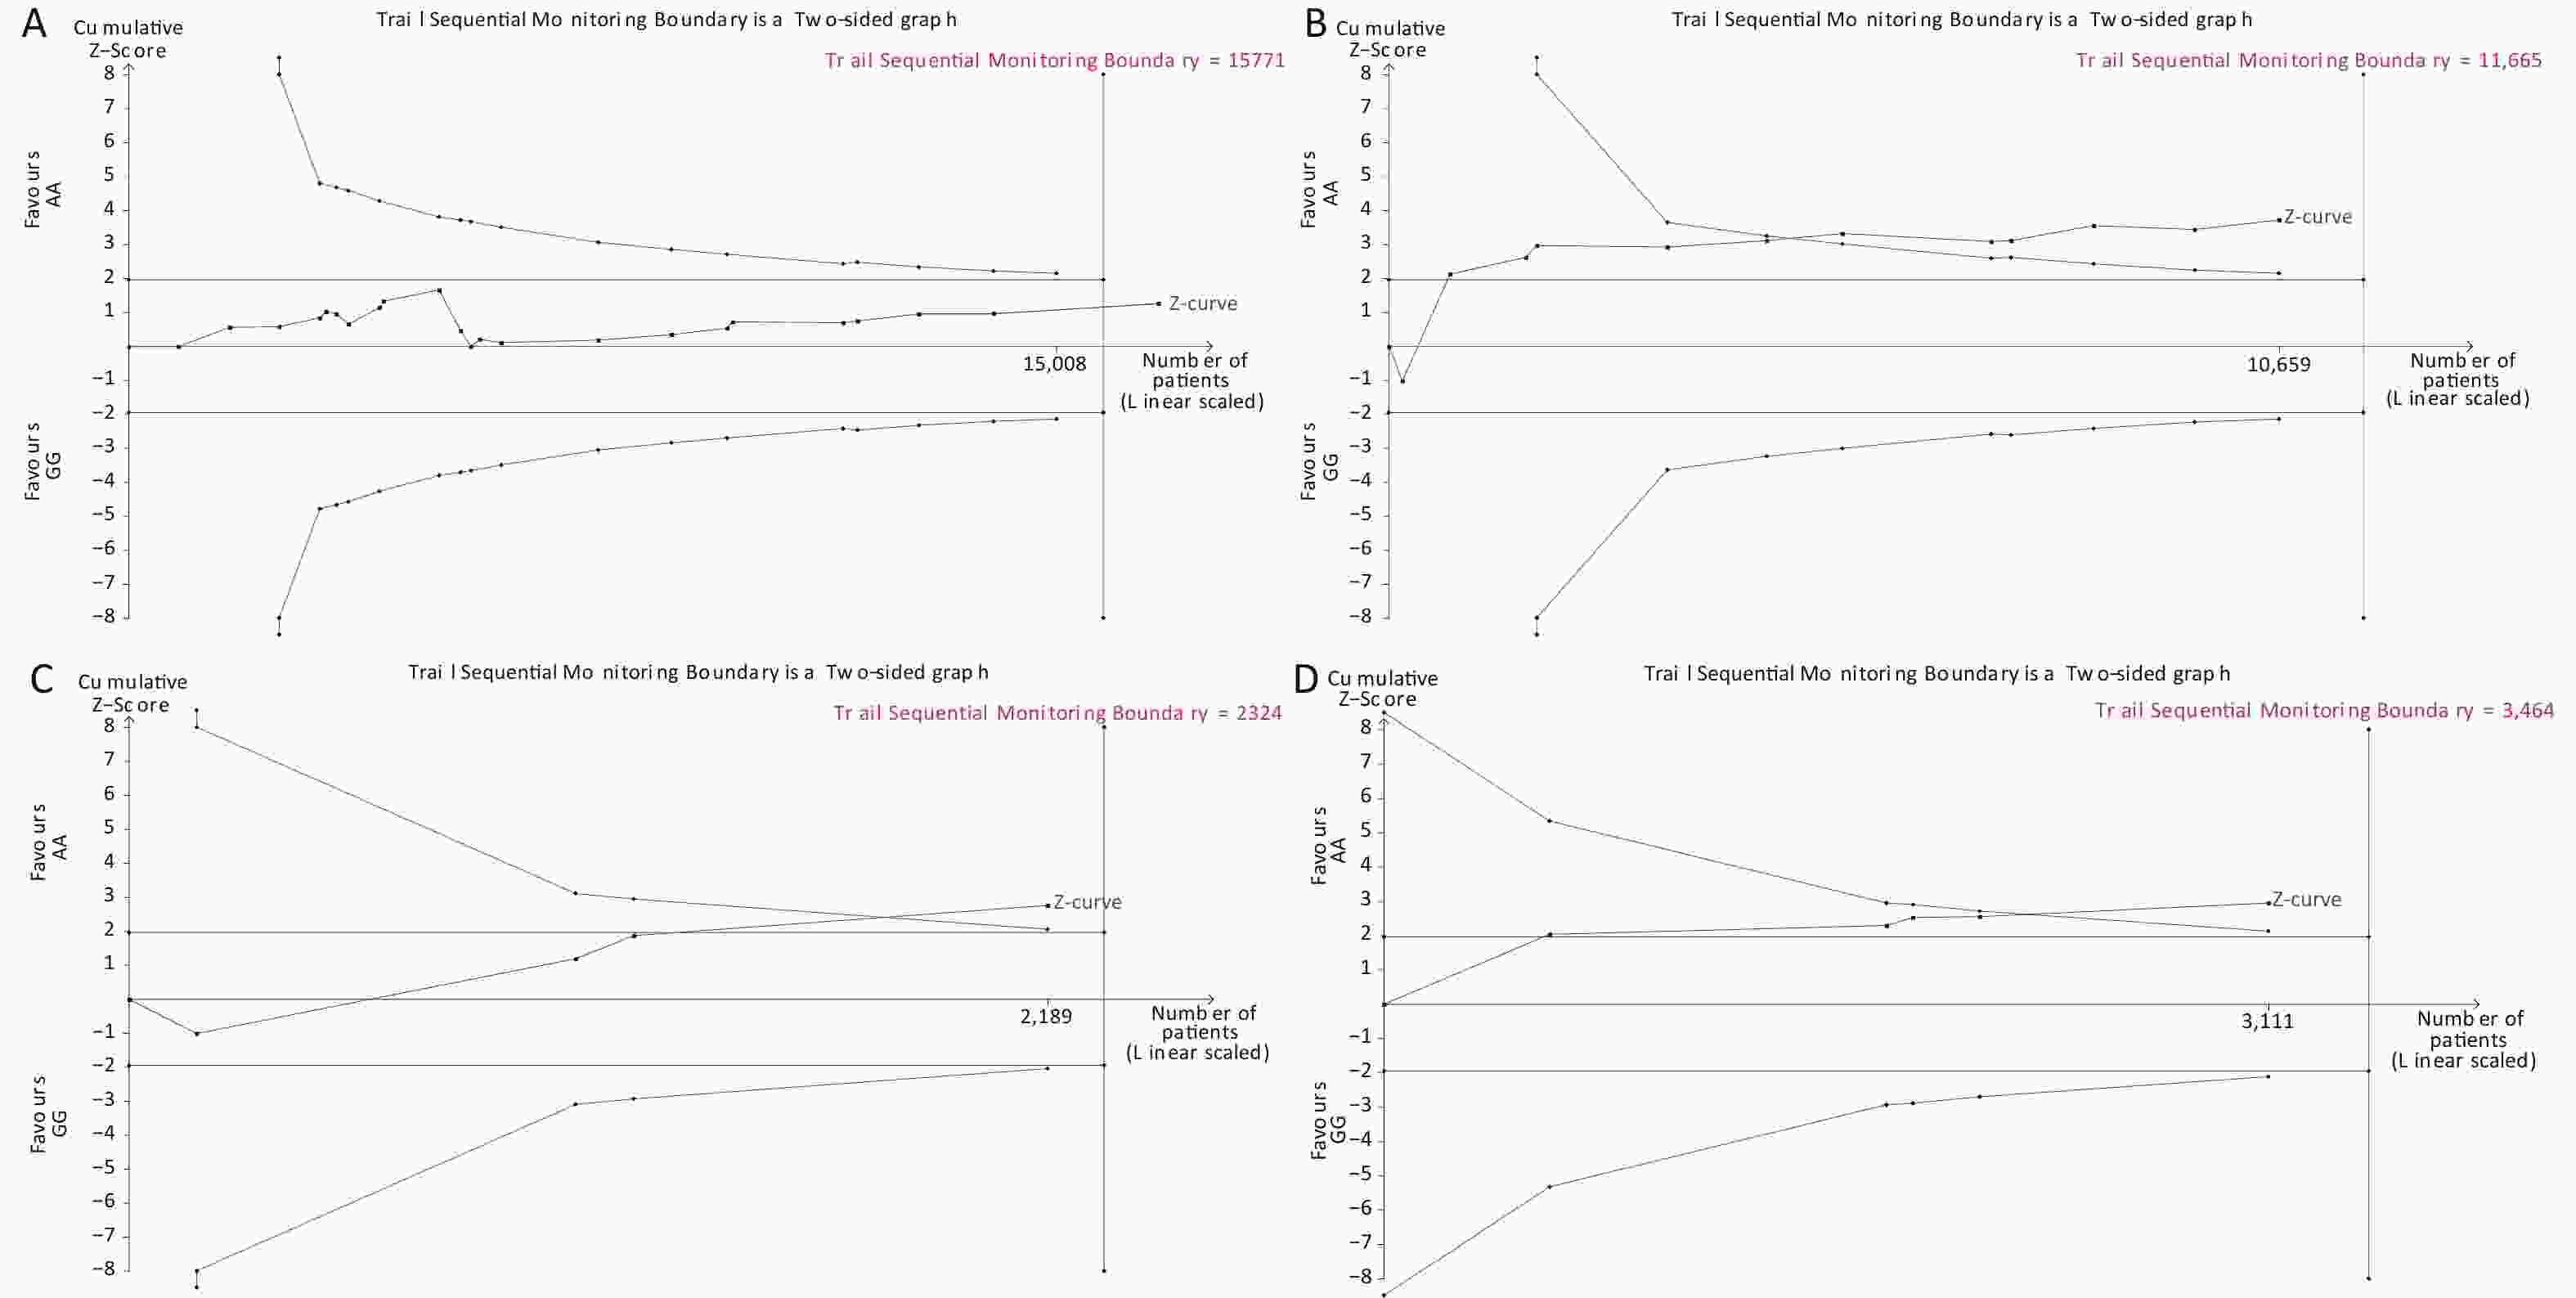
Figure 4. Trial sequential analysis of AA vs. GG for the meta-analysis on the relationship between rs1137101 and digestive-system cancer risk in the total population (A) and the Chinese population (B); and for the meta-analysis of the association of rs1137101 with gastric cancer risk (C) and liver cancer risk (D) in the total population.
-
DS cancers are a global health problem and a serious threat to human life. Detection at an early stage may be beneficial to patient outcome by improving the 5-year survival rate and may even lead to a complete cure. LEPR mediates key signaling pathways implicated in carcinogenesis. Specifically, the review by Rodrigues et al.[7] shows that leptin binding to Ob-Rb in the cell membrane induces homodimerization of the receptor followed by JAK-2 phosphorylation and subsequent phosphorylation of Tyr1138 in Ob-Rb. These events lead to the activation of STAT3 via phosphorylation, thereby regulating the expression of several cancer-associated genes[39]. Through STAT3, leptin can also trigger important cancer signaling pathways such as PI3K/mTOR. Additionally, through the phosphorylation of Tyr985 in Ob-Rb, leptin can activate Src homology 2 domain-containing phosphatase 2 (SHP2), triggering the MAPK/ERK pathway[40]. This evidence strongly suggests that LEPR is a plausible candidate gene for cancer susceptibility[10]. Consequently, the identification of certain causative variants in the LEPR gene would be of great help in the early diagnosis and treatment of DS cancers.
The LEPR gene rs1137101, a potential functional variant, has been extensively investigated for its contribution to the risk of DS cancers (21 studies up to August 31, 2023)[13-31], breast cancer (24 studies up to February 10, 2022), and endometrial[33] and lung cancers[34]. The findings of the studies on rs1137101 and DS cancer risk are summarized in Supplementary Table S1. rs1137101 was significantly associated with oral cancer risk in the Caucasian but not in the Asian population, and with esophageal cancer risk in the Asian but not in the Caucasian population. A significant association between rs1137101 and gastric cancer risk has been previously identified in the Chinese population[19-21] but the present study failed to confirm this finding. Lin et al. previously reported that the presence of rs1137101 may decrease colorectal cancer risk[27], although no such association was noted in other studies[22-26] or in the present study. A significant association between rs1137101 and liver cancer risk was observed in the Egyptian population[30] and in Chinese populations from Henan and Hubei provinces[28], but not in the Chinese population from Fujian or Guangxi provinces[29,31]. These discrepancies may be attributed to the following reasons. First, a tissue‐specific pattern may exist for the regulatory network of rs1137101 in LEPR function in different types of DS cancers. Second, the interaction of rs1137101 with different genetic backgrounds may lead to different susceptibilities to cancer among different ethnic populations. Third, the recruited Chinese participants are from different geographical areas of China and differ in their living environments and lifestyles. Fourth, the insufficient sample size may have resulted in inadequate statistical strength.
Several meta-analyses have attempted to estimate the association between rs1137101 and cancer risk more accurately. A recent meta-analysis of 44 case–control studies by Rong et al. revealed no significant association between rs1137101 and overall cancer risk[37]. Another recent meta-analysis by Zhu et al., which included 20 case-control studies, revealed a significant correlation between rs1137101 and breast cancer risk in African populations[41]. Since the studies related to rs1137101 and breast cancer make up nearly half of all related studies, they likely affect the estimation of the association between rs1137101 and overall cancer risk. Similarly, the studies related to rs1137101 and DS cancers account for a high proportion of all related studies. Thus, meta-analyses are necessary to determine the effect of rs1137101 on DS cancer risk. After pooling the data from previous related studies and the present study, a significant association between rs1137101 and DS cancer risk was only identified in the Chinese population. In the stratified analysis by cancer type, rs1137101 was significantly associated with the risk of gastric and liver cancer but not oral, esophageal, or colorectal cancer.
Several limitations should be considered when interpreting these results. First, the recruitment of participants was hospital-based, which may potentially have contributed to a selection bias. Second, the association of rs1137101 with gastric cancer risk involved only a Chinese population; confirmatory research in other ethnic groups is needed. Third, considering the small number of included studies for each specific DS cancer in this meta-analysis, replication studies and updated meta-analyses are required for a more accurate estimation of the effect of rs1137101 on DS cancer risk. Lastly, no evidence is currently available to show that rs1137101 is functionally significant and contributes to cancer development in vitro and in vivo. Future functional studies are thus needed to gain a better understanding of the role that LEPR gene rs1137101 plays in cancer pathogenesis.
In conclusion, our case–control study suggests that the LEPR gene rs1137101 variant is associated with liver cancer risk in the Hubei Chinese population. The subsequent meta-analysis revealed that rs1137101 may contribute to susceptibility to DS cancers (especially gastric and liver cancer) in the Chinese population. Additional well-designed studies with larger sample sizes and involving different ethnic groups are required to confirm the present findings.
-
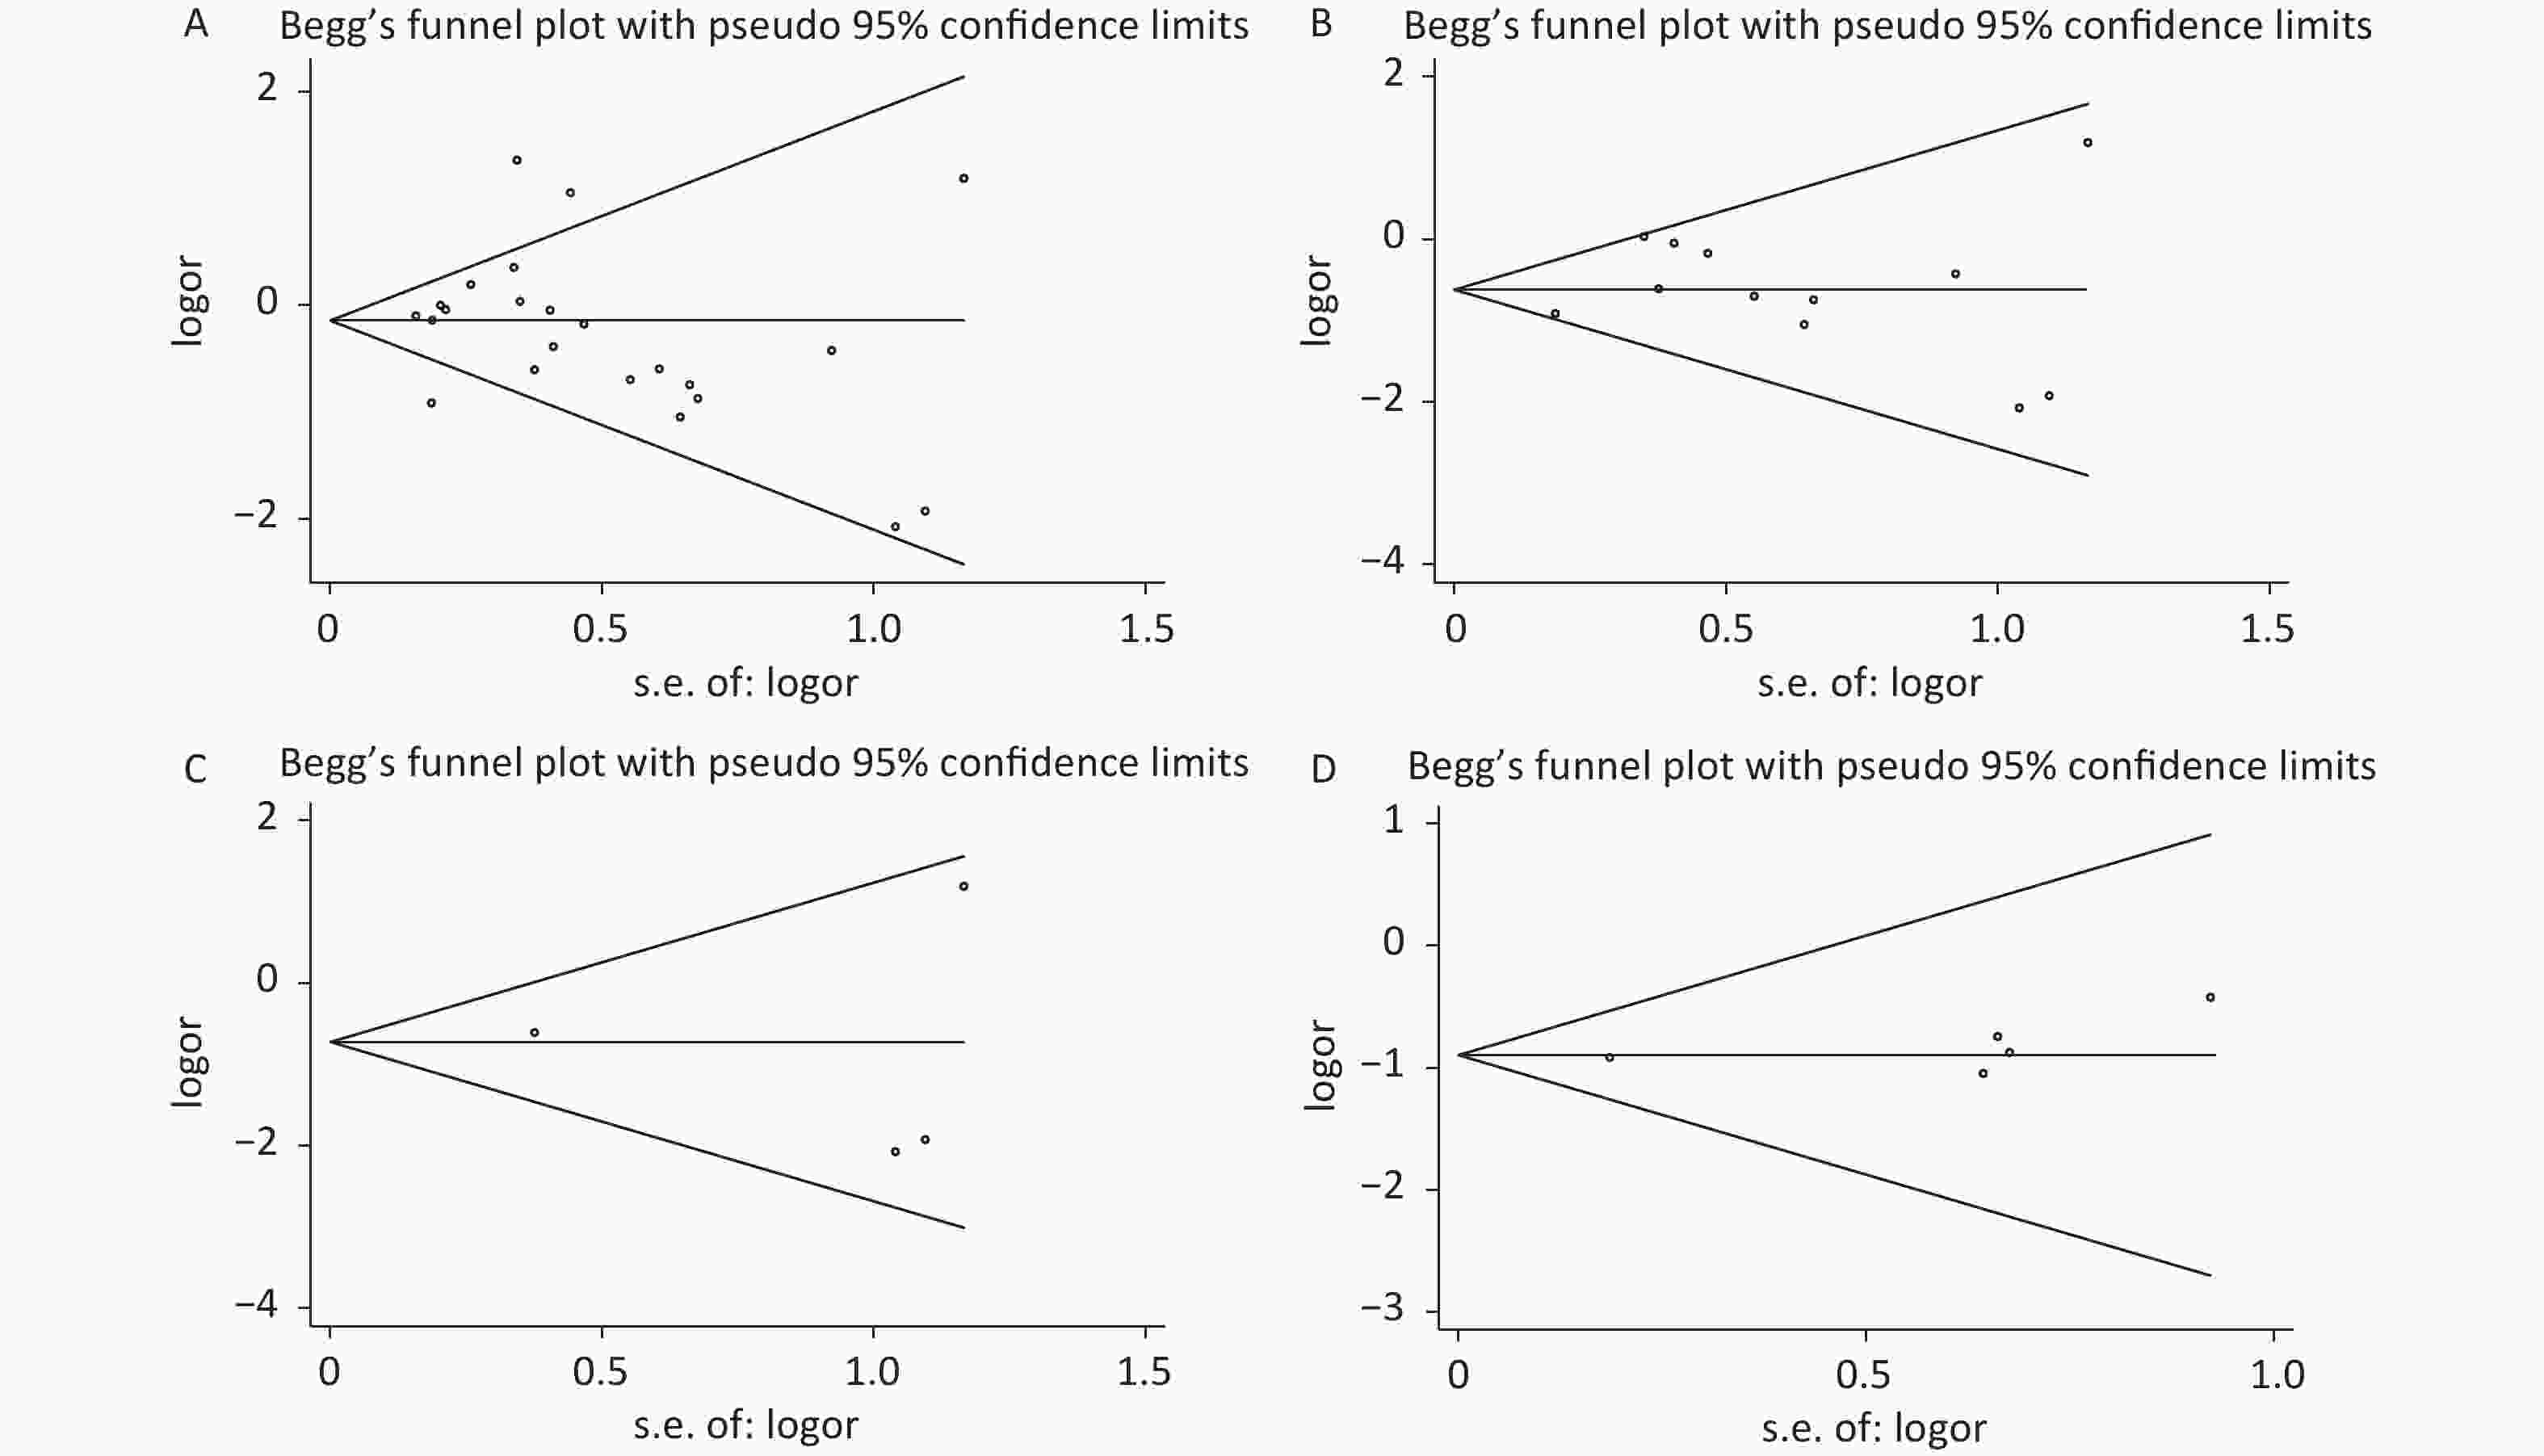
Figure 2. Funnel plots of AA vs. GG for the meta-analysis on the relationship between rs1137101 and digestive-system cancer risk in the total population (A) and the Chinese population (B); and for the meta-analysis of the association of rs1137101 with gastric cancer risk (C) and liver cancer risk (D) in the total population.
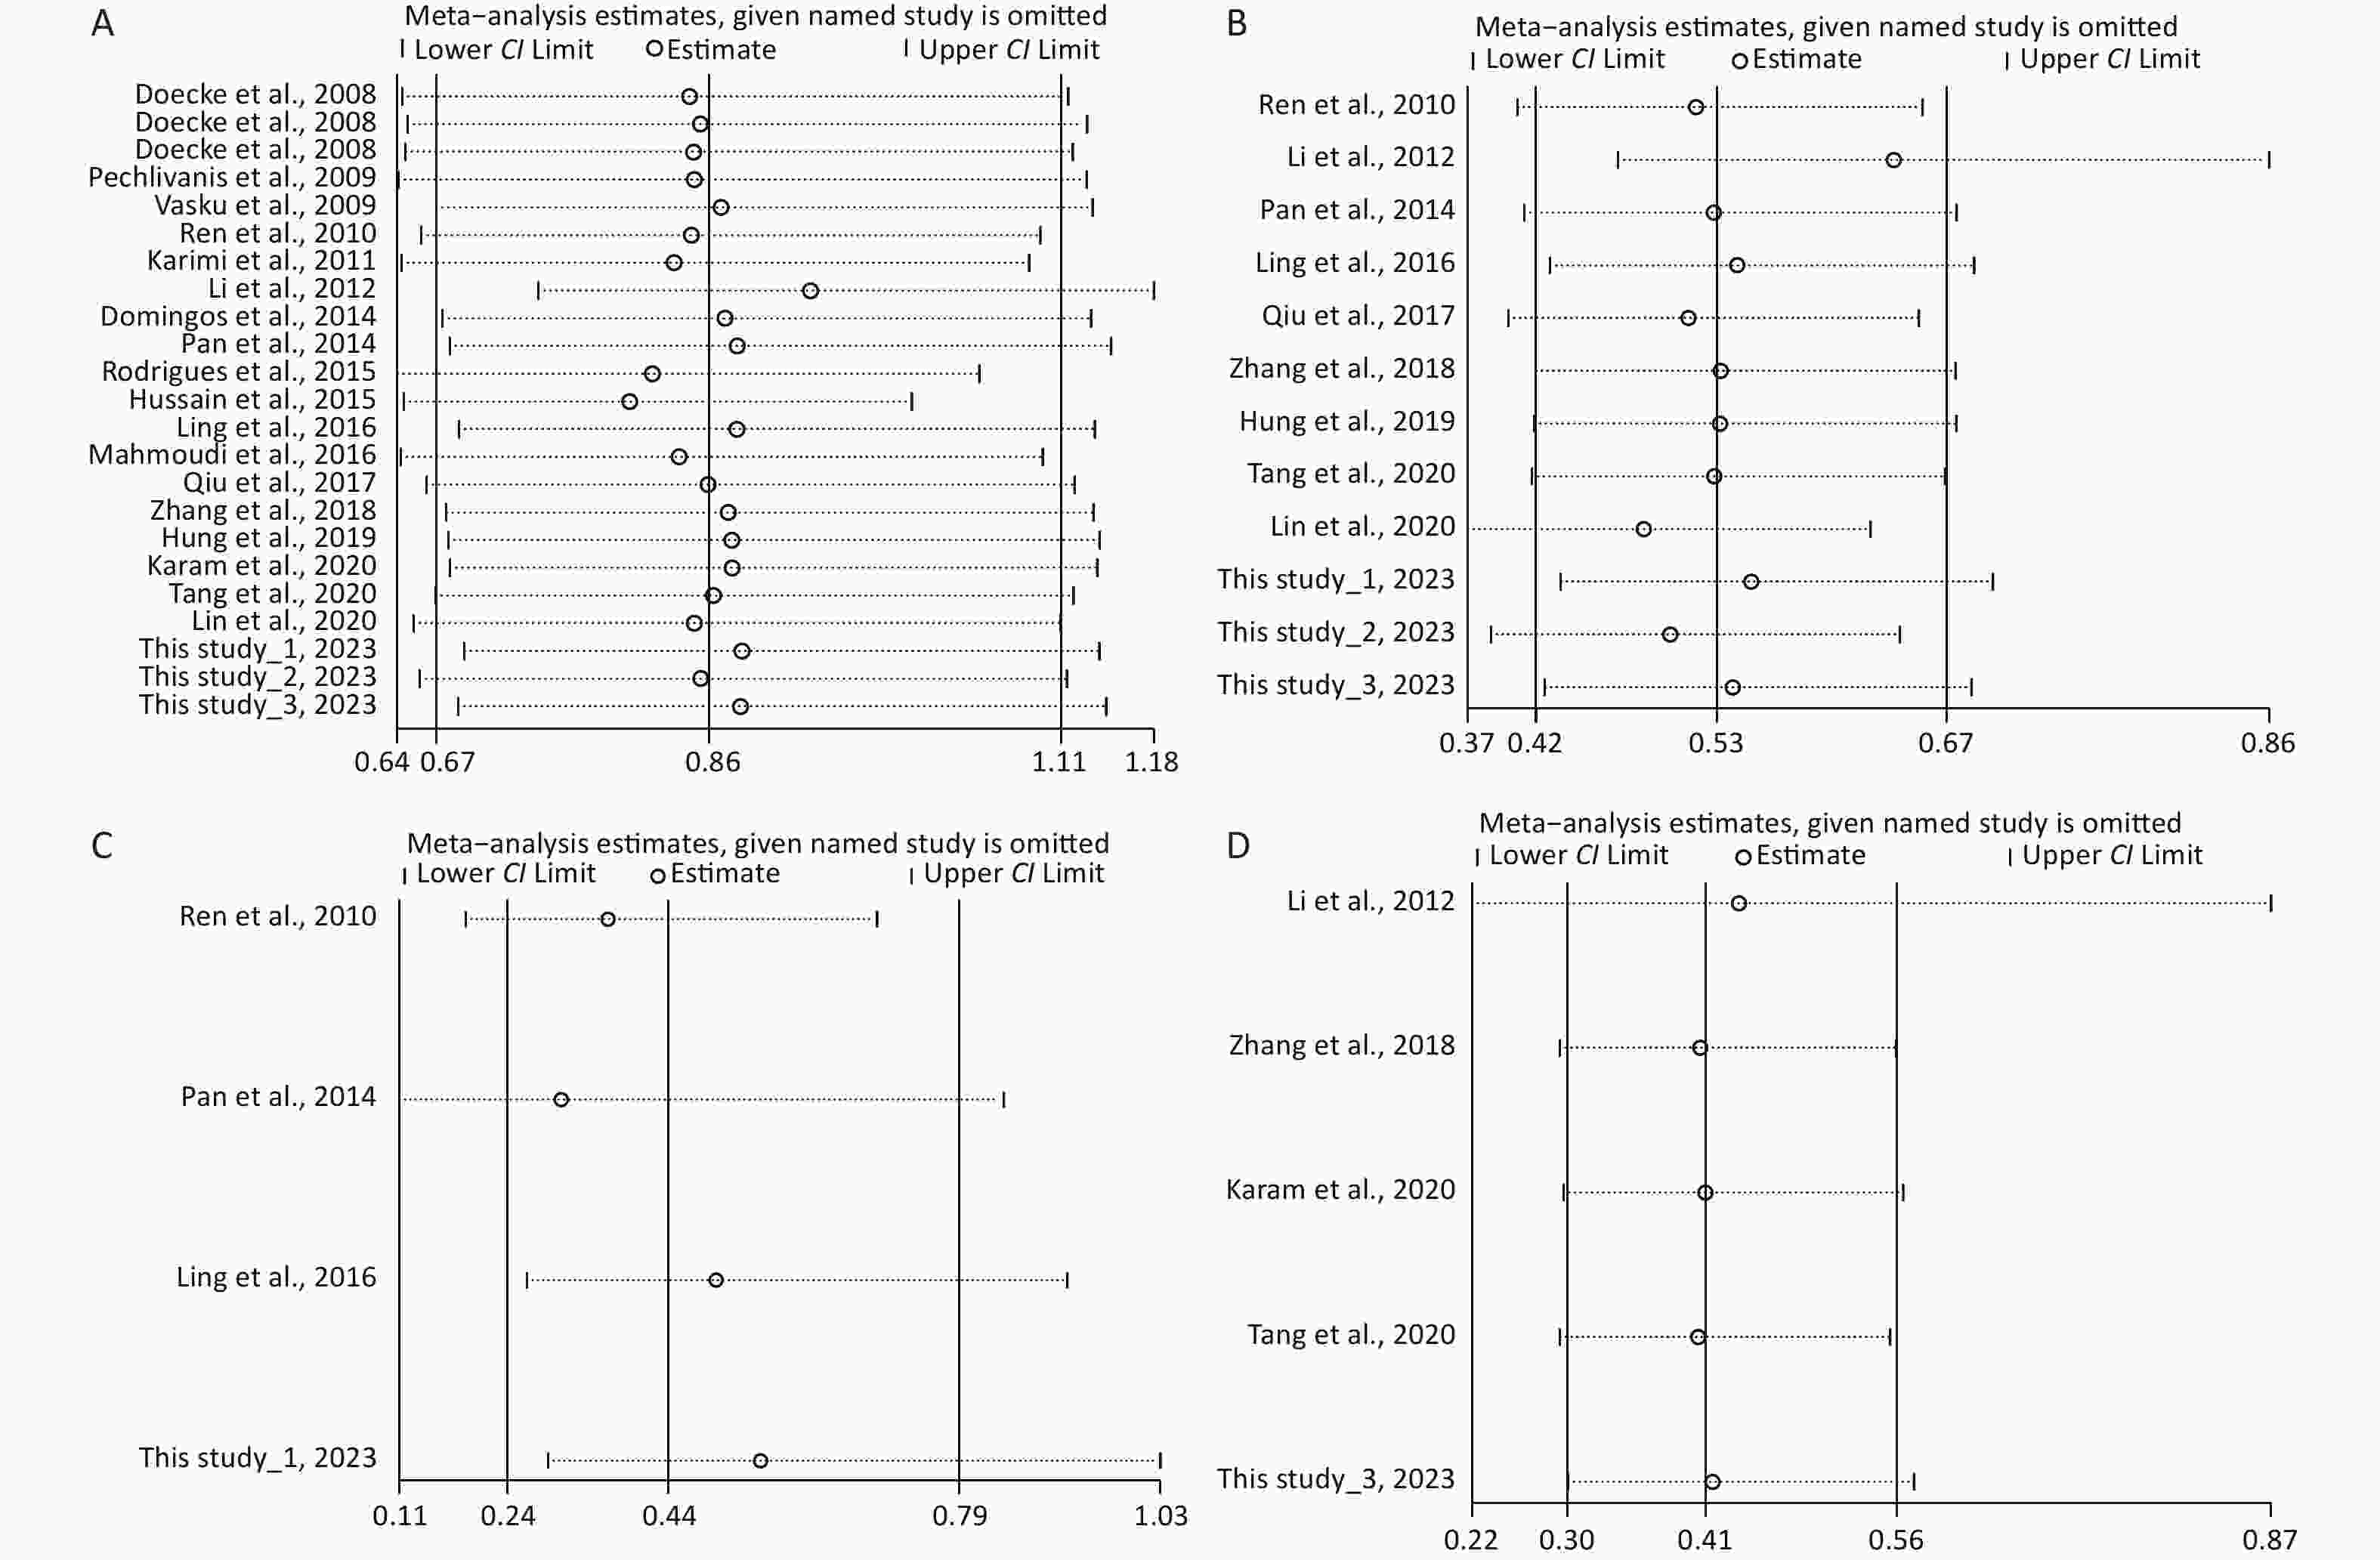
Figure 3. Sensitivity analysis of AA vs. GG for the meta-analysis of the association of rs1137101 with digestive-system cancer risk in the total population (A) and the Chinese population (B); and for the meta-analysis of the association of rs1137101 with gastric cancer risk (C) and liver cancer risk (D) in the total population. CI, confidence interval.
全文HTML
Participants
DNA Extraction and Genotyping
Statistical Analysis
Meta-Analysis
Principal Characteristics of the Participants
Association of rs1137101 with Susceptibility to Three DS Cancers in the Hubei Chinese Population
Meta-Analysis of the Association between rs1137101 and DS Cancer Risk
Meta-Analysis of the Association between rs1137101 and Risk of Specific DS Cancers
Forest Plots, Publication Bias, Sensitivity Analysis, and TSA in this Meta-analysis
 23404-S.pdf
|

|
|
23304-S.pdf
|
|

 Quick Links