

 下载:
下载:


-
The health of older adults has emerged as a critical public health problem because the global population is rapidly aging. According to the Global Burden of Disease (GBD) 2019 Study, cardiovascular diseases and cancer were both major causes of death among individuals over 70 years old, which seriously threaten the life and health of older adults[1]. Since 99% of humanity lives with ambient air pollution at levels beyond the World Health Organization (WHO) Air Quality Guidelines limits, this issue has grown in concern for public health[2]. Recently, more and more studies have reported that long-term ambient air pollution exposure was correlated with a greater risk of mortality[3–6]. Studies were mainly focused on particulate matter with an aerodynamic diameter ≤ 2.5 μm (PM2.5)[7,8], PM10[4,9], nitrogen dioxide (NO2)[10,11], and ozone (O3)[5,12], whereas epidemiological evidence on PM1, sulfur dioxide (SO2), and carbon monoxide (CO) was limited. Due to their impaired physiological function, physical weakness, and pre-existing chronic diseases, older adults are more susceptible to air pollution[13]. Nevertheless, little is known about the negative effects of ambient air pollution on older adults.
In China, over 1.5 million people died from ambient air pollution in 2019, of whom 77.4% were 65 years or older[14]. Evidence in China has revealed the association between long-term air pollution exposure and mortality[3,15,16]. Most of these studies were conducted in northern China in regions with more severe air pollution concentrations, therefore less is known about the risks in regions in southern China with lower air pollution concentrations. Given recent cohorts from Europe and the United States of America have found that the chronic harmful effects of air pollution still exist at low concentrations, it is intriguing to find out the consequences of low-level air pollution in China.
Hence, our study aimed to evaluate the association between long-term exposure to PM1, PM2.5, PM10, SO2, NO2, CO, and O3 and mortality among individuals aged ≥ 65 years in southern China to better understand the impact of air pollution on mortality among Chinese older adults.
-
Shenzhen is situated in southern China and the ambient air quality is relatively good. It ranked sixth among 168 cities in China in 2020, and the annual mean PM2.5 concentration of Shenzhen in 2020 (19.0 µg/m3) has fallen below the WHO interim target 2 (25.0 µg/m3). In addition, the total elderly population aged ≥ 65 years in Shenzhen city was 0.56 million in 2020. Benefiting from the well-developed economy, the construction of medical service systems for older adults in Shenzhen is relatively complete, which is conducive to carrying out epidemiologic studies among older adults.
-
Study participants were recruited from Shenzhen Healthy Ageing Research, which was established based on the older adult health management project of the National Basic Public Health Service. The population sample was selected from the lists of all individuals who signed up at community health centers in Shenzhen. The recruitment process has been described in detail in the previous study[17]. According to the specification of Shenzhen Healthy Ageing Research, people aged ≥ 65 years were eligible to take free health examinations once a year. The health examination included a face-to-face questionnaire about basic health status and lifestyles, anthropometric tests, biochemical index measurements, and health status assessments. With an exemption of informed consent, the Shenzhen Center for Chronic Disease Control Human Ethics Committee approved our study (No. SZCCC-2021-061-01-PJ).
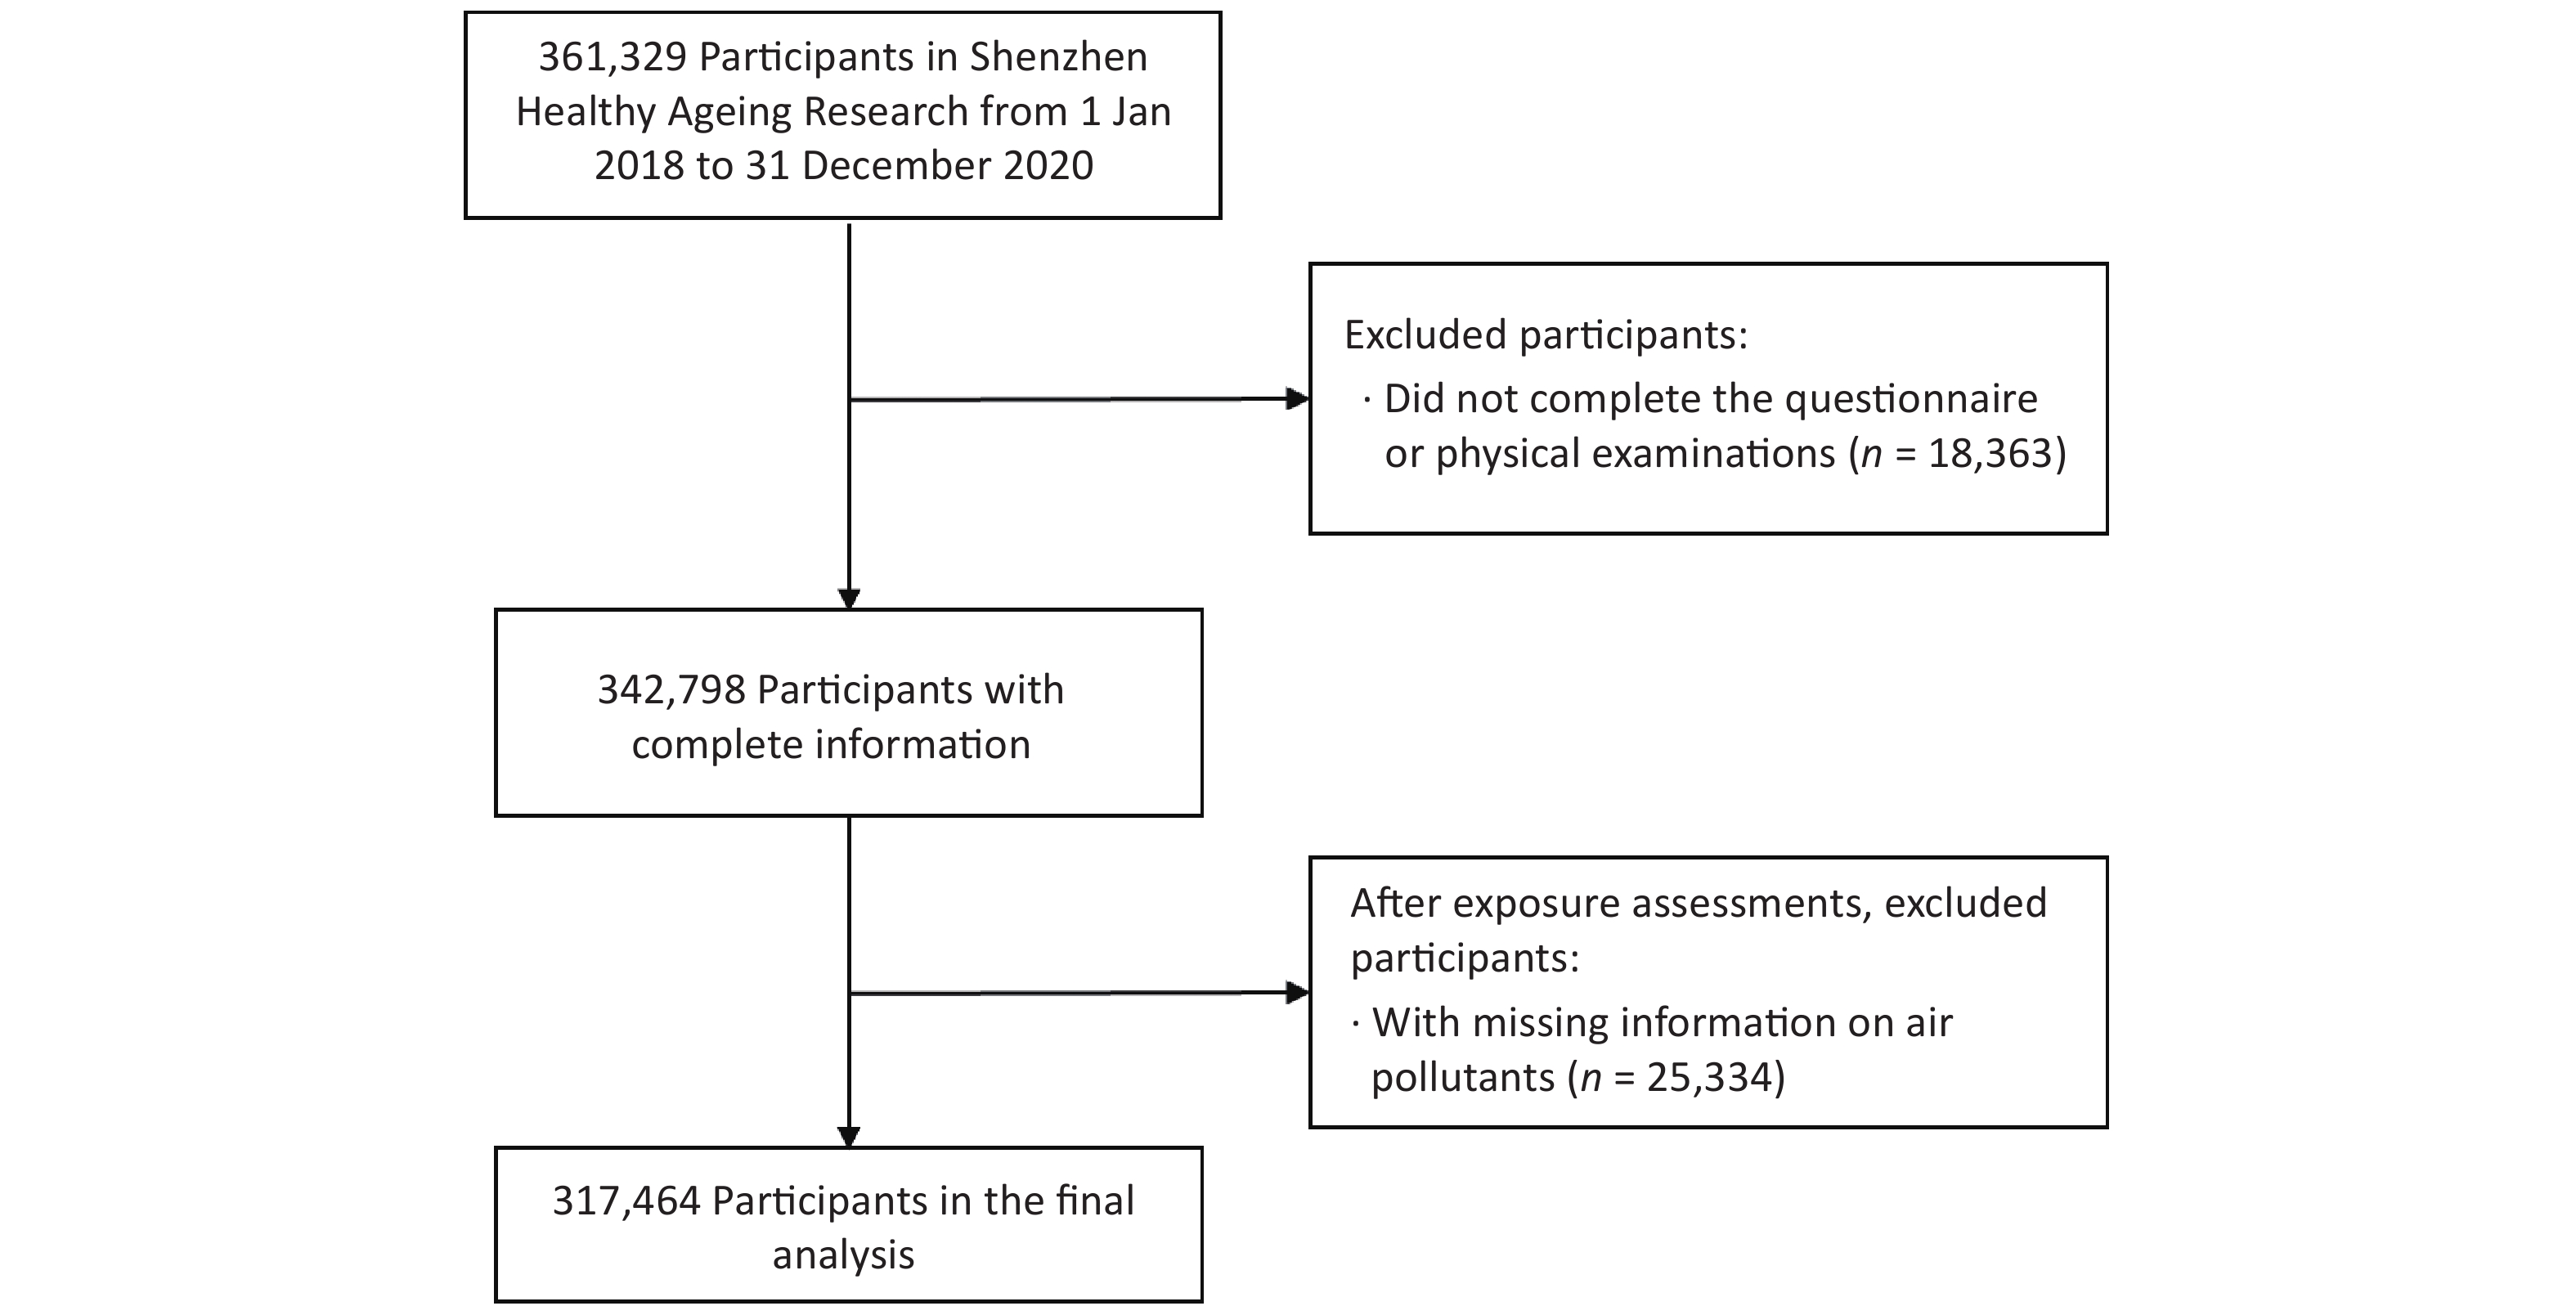
A total of 361,329 subjects were enrolled in Shenzhen Healthy Ageing Research from 2018 to 2020, which included 63.9% of older adults aged ≥ 65 years in Shenzhen. By strictly excluding participants who (1) did not complete the questionnaire or physical examinations, and (2) had missing information on air pollutants, we included 317,464 subjects with complete information in the final analyses (Supplementary Figure S1, available in www.besjournal.com). All subjects were followed from recruitment to the date of mortality or the study’s finish (December 31, 2020), whichever came first.
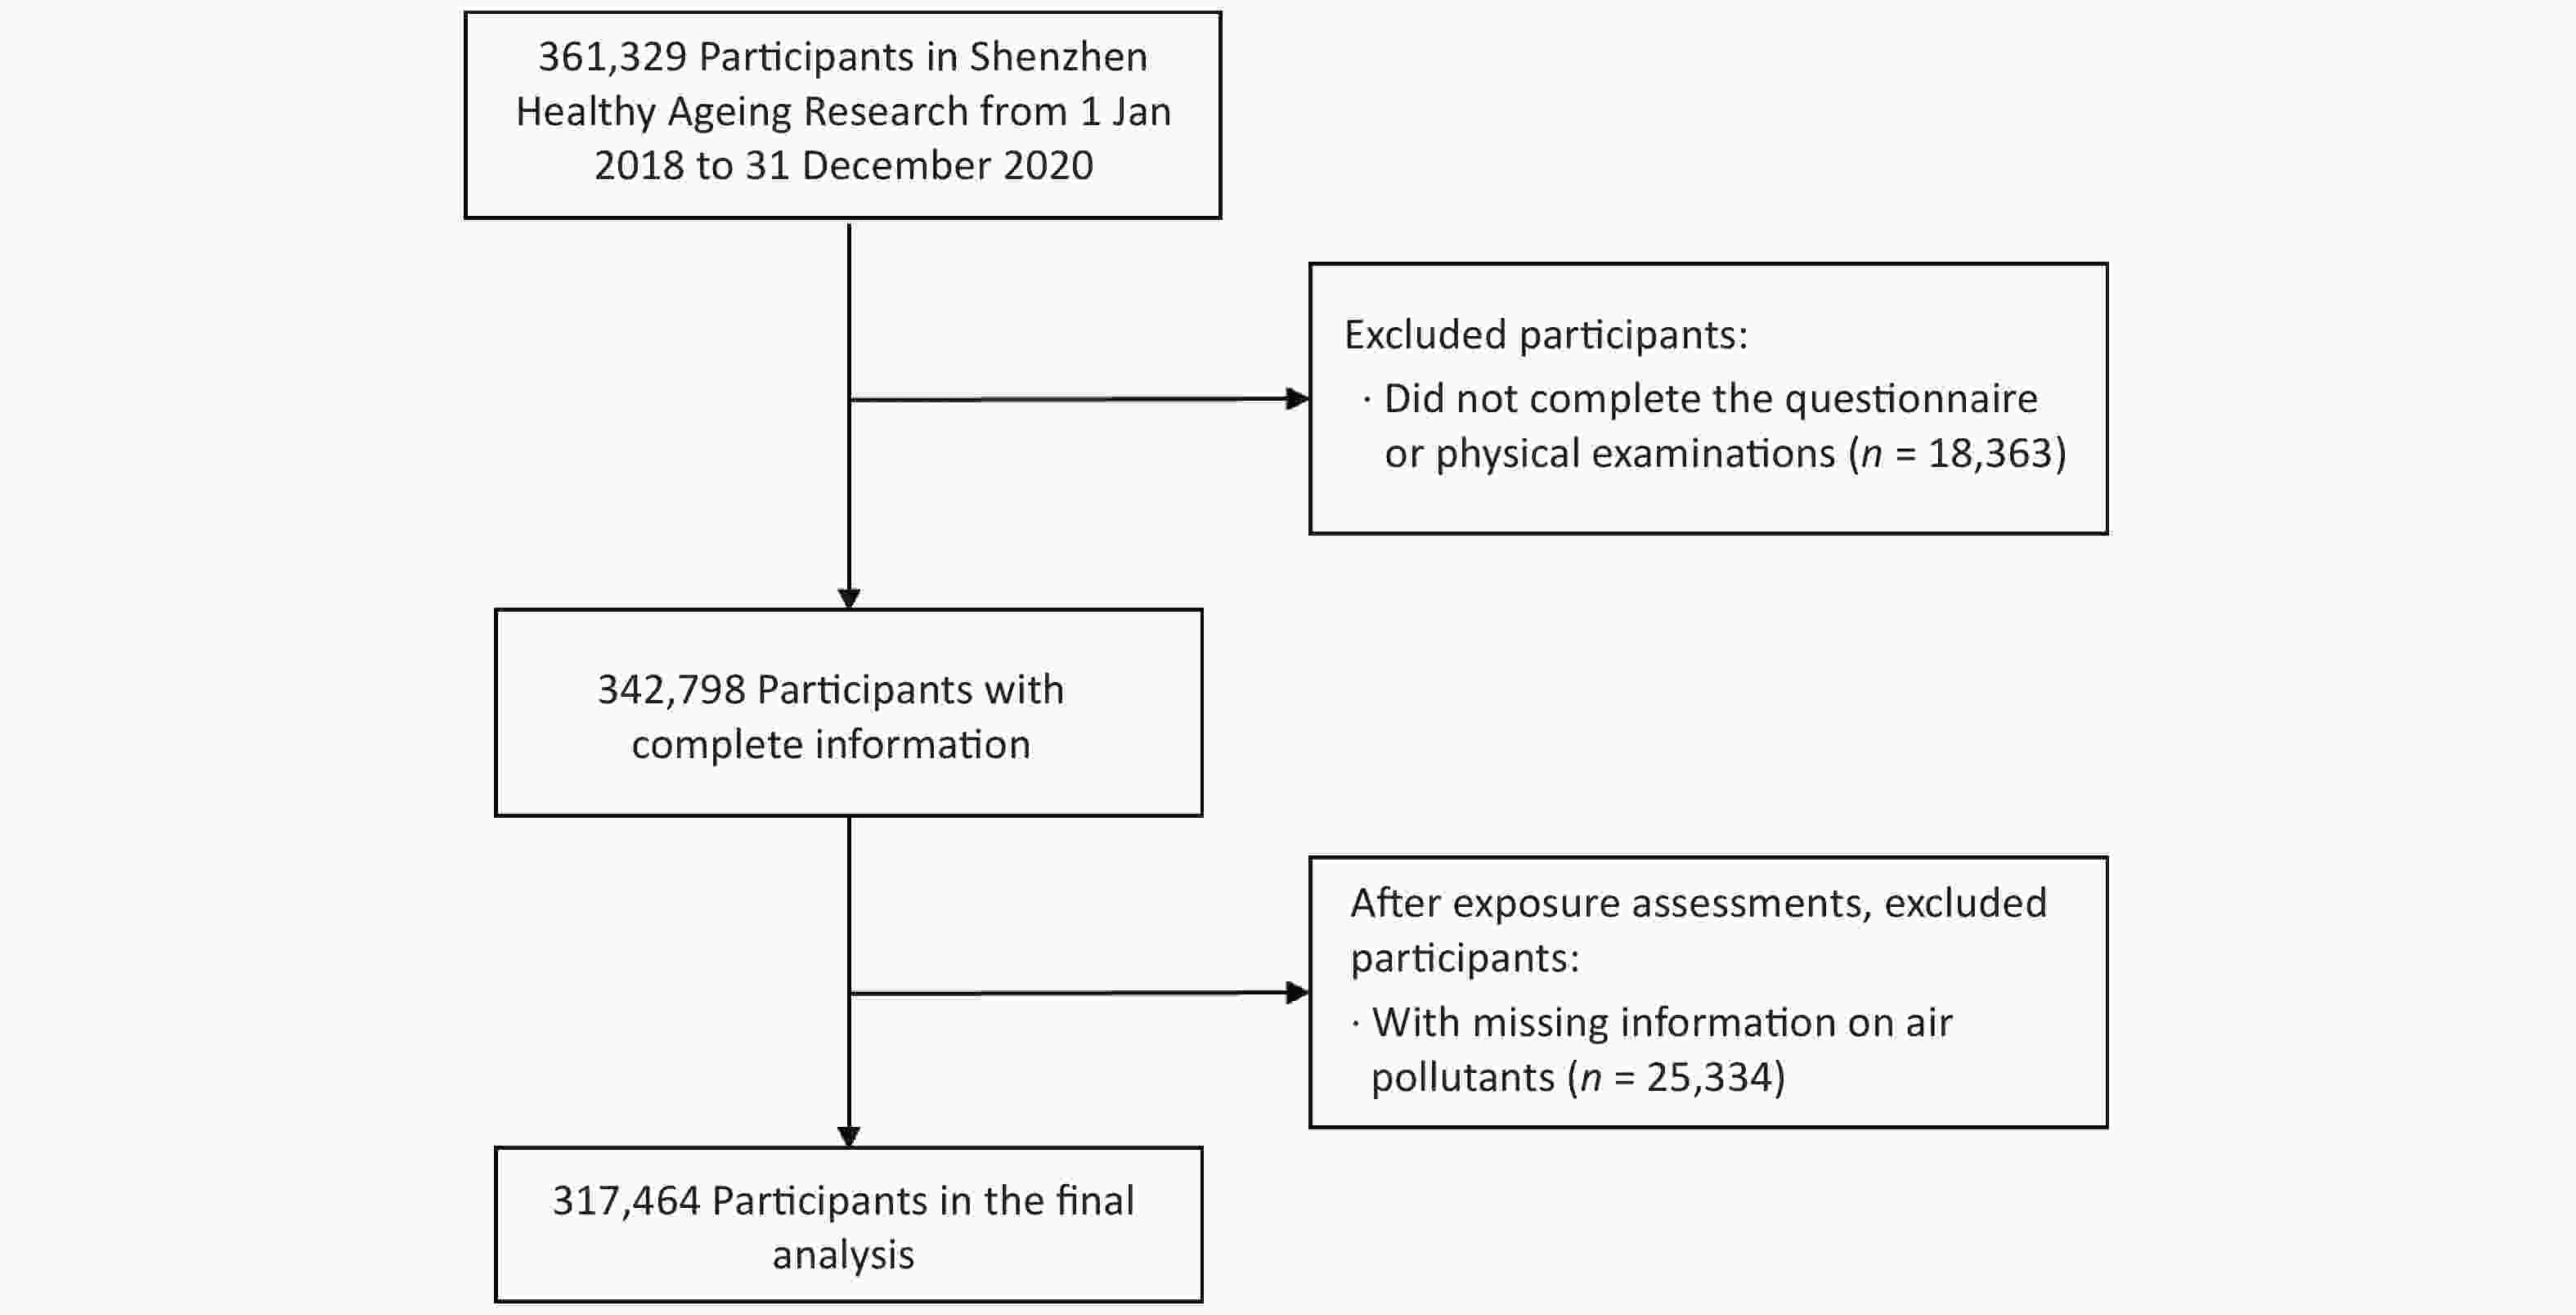
Figure S1. Flow diagram of study participants’ selection.
-
To verify the vital status of each participant, we performed three steps. First, family physicians telephoned the participant to follow up on deaths. Second, we linked the health examination data to the China Population Death Information Registration System to determine the date and cause of death[18]. The International Statistical Classification of Diseases and Related Health Problems 10th Revision (ICD-10) was applied to code underlying causes of death. With regard to some people who were registered by the family physicians but did not have a record in the national death registration system, we further checked their vital status by telephone in the third step. In this study, all-cause mortality (A00-Z99), non-accidental mortality (A00-R99), cancer mortality (C00-C97), and cardiovascular mortality (I00-I99) were considered as outcomes.
-
Daily gridded data of air pollutants were calculated from the ChinaHighAirPollutants (CHAP) dataset at 10 km2 resolution. The CHAP dataset was produced using artificial intelligence algorithms in conjunction with big data[19]. The cross-validation results demonstrated that the accuracy of the CHAP dataset was high, where the cross-validation coefficient of determination (R2) for PM1, PM2.5, PM10, SO2, NO2, CO, and O3 was 0.77, 0.90, 0.86, 0.84, 0.84, 0.80, and 0.87, respectively[20–22]. Depending on the geocoded residential address, we retrieved the 24-hour mean PM1, PM2.5, PM10, SO2, NO2, CO, and maximum 8-hour mean O3 concentrations for each individual. Then we calculated 3-year averages before the end date of follow-up as the main exposure.
-
Referring to previous studies and available data, a series of potential confounders were taken into account[23,24]. Individual-level variables were gathered from the baseline data and categorized for sex (male, female), education (illiteracy, primary school: ≤ 6 years, middle school: 7–12 years, college and above: > 12 years), marital status [married, other (unmarried or widowed or divorced)], physical activity (never, once in a while, more than once a week, daily), smoking (never, quit or current), drinking (never, quit or current). Weight (in kilograms) divided by the square of height (in meters) was used to calculate body mass index (BMI). According to the WHO guidelines, we classified BMI into four groups: underweight, normal weight, overweight, and obese (< 18.5 kg/m², 18.5–24.9 kg/m2, 25.0–29.9 kg/m2, ≥ 30.0 kg/m2)[25].
History of chronic diseases included hypertension and diabetes. We repeatedly measured blood pressure in both arms of each subject twice and used the side with the higher blood pressure value for our study. Hypertension was determined as (1) diastolic blood pressure ≥ 90 mmHg and systolic blood pressure ≥ 140 mmHg[26]; (2) taking the anti-hypertension medicine; or (3) self-reported physician-diagnosed hypertension. Subjects are required to fast for 8 hours before venous blood collection. Diabetes was determined as (1) fasting blood glucose (FBG) ≥ 7.0 mmol/L[27]; (2) taking the anti-diabetes medicine; or (3) self-reported physician-diagnosed diabetes.
-
The correlation between air pollutants was assessed using Spearman’s correlation analysis. The association of 3-year exposure to ambient air pollution with all-cause, non-accidental, cancer and cardiovascular mortality was quantitatively assessed using logistic regression models. Models were adjusted for baseline age, sex, education, marital status, physical activity, smoking, drinking, history of hypertension, and history of diabetes. Additionally, we used categorical analyses to assess the trend of mortality risk, while the exposure level of each air pollutant was grouped by its quartiles, and the first quartile was used as the reference group. The linear trend was examined by putting the median of each quartile spacing in the model and setting them as continuous variables. The calculated P value of the air pollutant was used to determine whether the trend of the odds ratio (OR) was statistically significant.
Stratified analyses were carried out by sex (male, female), age (aged < 75 years, aged ≥ 75 years), BMI (underweight and normal weight, overweight and obese), physical activity frequency (not daily, daily), smoking (never, quit or current), history of hypertension (no, yes), and history of diabetes (no, yes). For each subgroup, we first assessed the association of each air pollutant with different mortality outcomes and then compared the association across stratified variables by two-sample z tests. In each adjusted model, the stratified variable was excluded from the adjustments.
Sensitivity analyses were performed to check the stability of our results. Firstly, we assessed the association by using the 1-year exposure level before the end of follow-up. Secondly, by separately adding each air pollutant into the model, we performed two-pollutant models and compared the estimates using likelihood ratio tests. To avoid collinearity, Spearman’s correlation coefficient between the pair < 0.9 was allowed to develop two-pollutant models. Thirdly, we excluded subjects who died within 1 year after joining Shenzhen Healthy Ageing Research to disregard those who were seriously ill. Finally, we only included subjects whose follow-up time was less than the average follow-up time (1.5 years). All statistical analyses were performed in R (version 4.1.1). A two-sided P less than 0.05 was regarded as statistically significant.
-
From 2018 to 2020, 3,975 deaths were reported, including 3,822 from non-accidental causes, 1,425 from cancer, and 1,555 from cardiovascular diseases (Table 1). By PM2.5 exposure categories, the number of deaths increased with increasing PM2.5 exposure levels. Among total participants, the mean age was 70.9 years [standard deviation (SD): 5.6 years], 55.5% were female, 45.4% had middle school degrees, most of them (96.3%) were married, 62.0% had a normal BMI, 64.4% had daily physical activities. Never-smokers and never-drinkers accounted for 83.7% and 84.7% of participants, respectively. 59.9% and 27.0% of participants had a history of hypertension and diabetes, respectively. Supplementary Figure S2 shows the spatial distribution of all participants.
Table 1. Baseline characteristics of the study population from 2018 to 2020
Characteristics Overall
(n = 317,464)PM2.5 exposure, (µg/m3) P value Quartile 1
(n = 79,365)Quartile 2
(n = 79,317)Quartile 3
(n = 79,354)Quartile 4
(n = 79,427)Follow-up, years 1.5 ± 0.9 1.5 ± 0.9 1.5 ± 1.0 1.5 ± 0.9 1.4 ± 0.9 < 0.001 All-cause mortality 3,975 228 435 1,229 2,083 Non-accidental mortality 3,822 219 421 1,183 1,999 Cancer mortality 1,425 69 169 444 743 Cardiovascular mortality 1,555 93 157 481 824 Age, years 70.9 ± 5.6 71.3 ± 5.8 71.2 ± 5.7 70.4 ± 5.2 70.7 ± 5.6 < 0.001 Female 176,098 (55.5) 43,971 (55.4) 44,052 (55.5) 44,097 (55.6) 43,978 (55.4) 0.820 Education < 0.001 Illiteracy 24,897 (7.8) 4,267 (5.4) 4,069 (5.1) 6,087 (7.7) 10,474 (13.2) Primary school 121,115 (38.2) 23,046 (29.0) 26,704 (33.7) 32,587 (41.1) 38,777 (48.8) Middle school 144,063 (45.4) 40,435 (50.9) 40,169 (50.6) 36,086 (45.5) 27,373 (34.5) College and above 27,389 (8.6) 11,617 (14.6) 8,375 (10.6) 4,594 (5.8) 2,803 (3.5) Married 305,580 (96.3) 75,673 (95.3) 76,725 (96.7) 77,129 (97.2) 76,052 (95.8) < 0.001 BMI < 0.001 Underweight 11,476 (3.6) 2,513 (3.2) 2,606 (3.3) 2,895 (3.6) 3,462 (4.4) Normal 196,986 (62.0) 48,892 (61.6) 48,433 (61.1) 49,329 (62.2) 50,332 (63.4) Overweight 97,975 (30.9) 25,069 (31.6) 25,381 (32.0) 24,436 (30.8) 23,088 (29.1) Obese 11,027 (3.5) 2,891 (3.6) 2,897 (3.7) 2,694 (3.4) 2,545 (3.2) Physical activity < 0.001 Never 56,300 (17.7) 12,269 (15.5) 11,454 (14.4) 13,179 (16.6) 19,398 (24.4) Once in a while 23,201 (7.3) 5,946 (7.5) 6,565 (8.3) 5,426 (6.8) 5,264 (6.6) More than once a week 33,668 (10.6) 8,614 (10.9) 9,710 (12.2) 8,213 (10.3) 7,131 (9.0) Daily 204,295 (64.4) 52,536 (66.2) 51,588 (65.0) 52,536 (66.2) 47,634 (60.0) Never-smoker 265,723 (83.7) 67,130 (84.6) 68,706 (86.6) 65,531 (82.6) 64,356 (81.0) < 0.001 Never-drinker 268,827 (84.7) 66,853 (84.2) 68,624 (86.5) 66,479 (83.8) 66,870 (84.2) < 0.001 Hypertension 190,038 (59.9) 48,661 (61.3) 49,367 (62.2) 45,759 (57.7) 46,251 (58.2) < 0.001 Diabetes 85,852 (27.0) 22,658 (28.5) 22,164 (27.9) 20,609 (26.0) 20,420 (25.7) < 0.001 Note. Values are n, n (%) or mean ± SD. PM2.5, particulate matter with an aerodynamic diameter ≤ 2.5 μm; BMI, body mass index. The distribution of 3-year exposure to ambient air pollutants is shown in Table 2. The average exposure level of PM1, PM2.5, PM10, SO2, NO2, CO, and O3 was 15.1 µg/m3, 25.3 µg/m3, 44.0 µg/m3, 6.9 µg/m3, 31.7 µg/m3, 0.68 mg/m3, and 94.5 µg/m3, respectively. PM1, PM2.5, PM10, SO2, NO2, and CO had positive correlations with each other, while O3 was negatively correlated with SO2 and NO2 (Supplementary Table S1, available in www.besjournal.com).
Table 2. Distribution of 3-year exposure to ambient air pollutants before the end date of follow-up
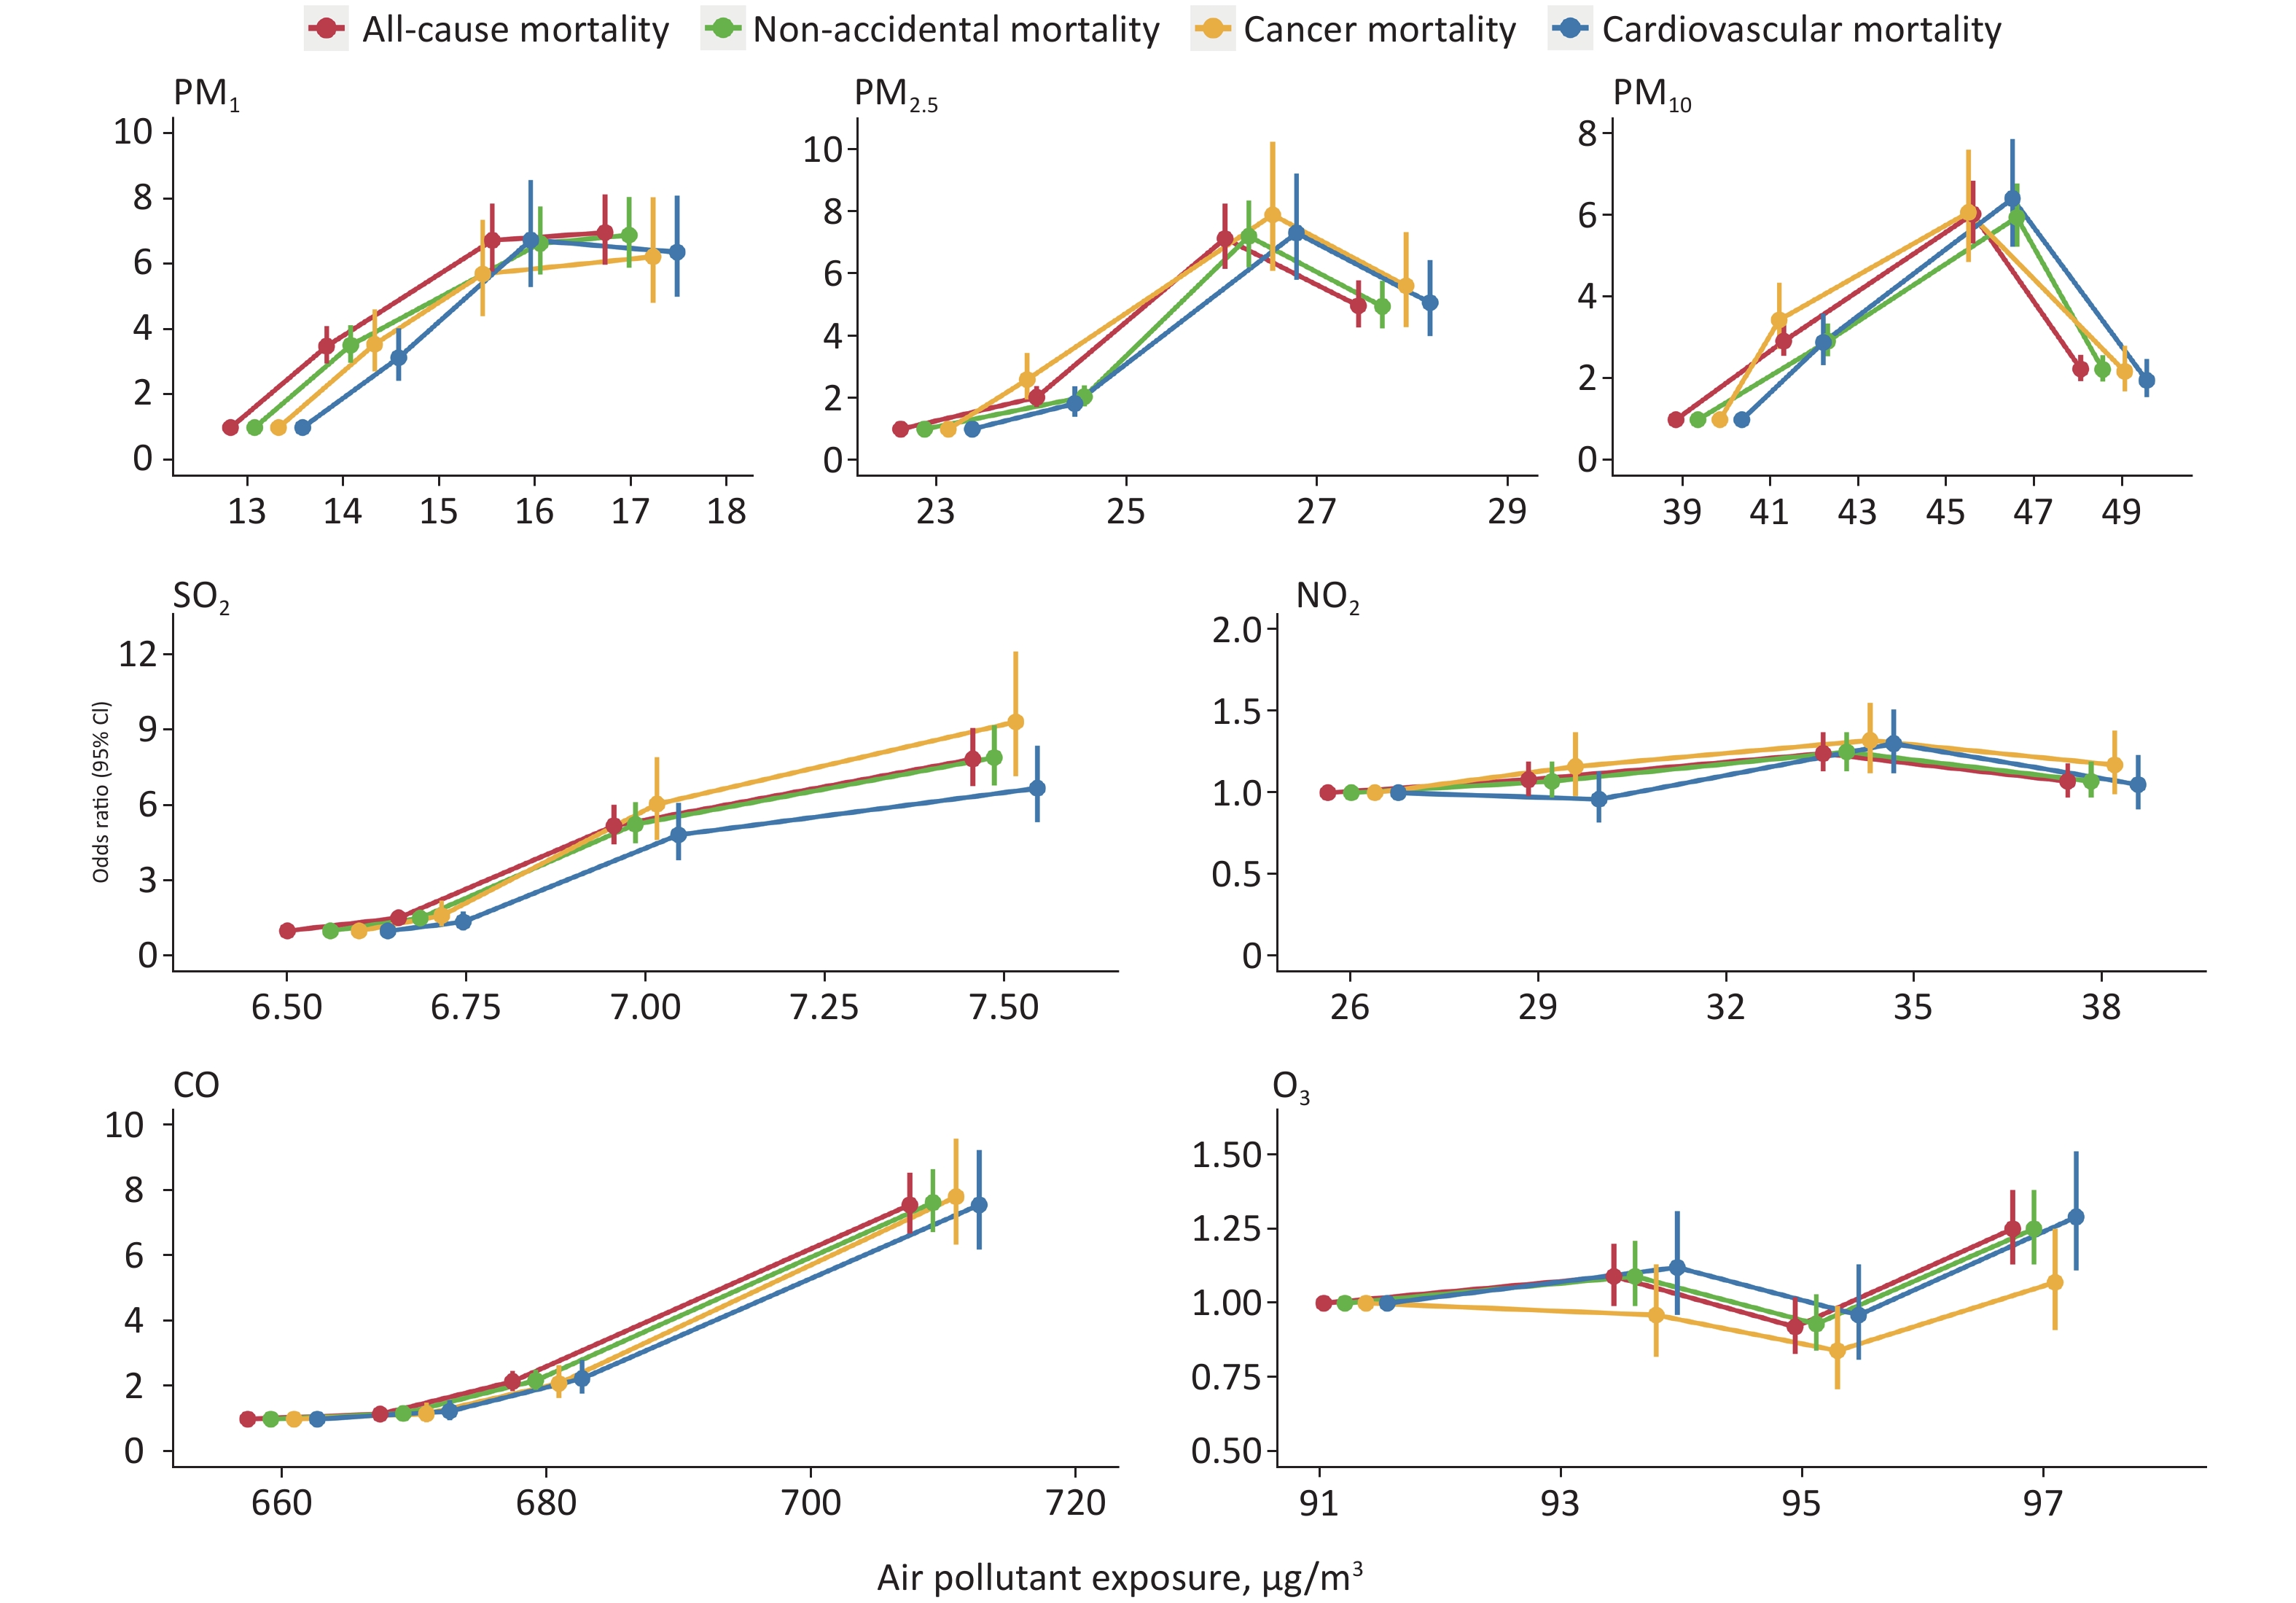
Air pollutant Mean SD Min Percentile Max 25th 50th 75th PM1, µg/m3 15.1 1.6 12.9 13.6 14.8 16.6 26.7 PM2.5, µg/m3 25.3 2.0 19.0 23.8 24.9 27.0 35.8 PM10, µg/m3 44.0 3.9 31.0 40.5 42.9 48.3 55.4 SO2, µg/m3 6.9 0.5 4.8 6.6 6.8 7.3 10.6 NO2, µg/m3 31.7 4.7 11.8 28.5 31.2 35.9 45.3 CO, mg/m3 0.68 0.02 0.61 0.67 0.68 0.69 0.85 O3, µg/m3 94.5 2.6 80.0 92.7 94.7 95.8 102.9 Note. PM1, particulate matter with an aerodynamic diameter ≤ 1 μm; PM2.5, particulate matter with an aerodynamic diameter ≤ 2.5 μm; PM10, particulate matter with an aerodynamic diameter ≤ 10 μm; SO2, sulfur dioxide; NO2, nitrogen dioxide; CO, carbon monoxide; O3, ozone; SD, standardized deviation; Min, minimum; Max, maximum. In the main models, 3-year exposure to PM1, PM2.5, PM10, SO2, and CO were significantly associated with increased risks of all-cause, non-accidental, cancer and cardiovascular mortality, and O3 was significantly associated with increased risks of all-cause and non-accidental mortality (Table 3). For all-cause mortality, the OR for each 1 µg/m3 increase in exposure to PM1, PM2.5, PM10, SO2, CO, and O3 was 1.49 [95% confidence interval (CI): 1.46, 1.53], 1.30 (1.27, 1.32), 1.05 (1.04, 1.06), 5.84 (5.39, 6.32), 1.04 (1.04, 1.05), and 1.02 (1.00, 1.03), respectively. Outcomes for non-accidental mortality were similar to those for all-cause mortality. In terms of cancer mortality, the OR each 1 µg/m3 increment in exposure to PM1, PM2.5, PM10, SO2, and CO was 1.46 (95% CI: 1.40, 1.52), 1.30 (1.26, 1.35), 1.04 (1.02, 1.06), 6.34 (5.55, 7.25), and 1.04 (1.04, 1.05), respectively. Regarding cardiovascular mortality, the OR per 1 µg/m3 increase in exposure to PM1, PM2.5, PM10, SO2, and CO was 1.47 (95% CI: 1.42, 1.53), 1.30 (1.26, 1.34), 1.04 (1.03, 1.06), 5.33 (4.69, 6.07), and 1.04 (1.04, 1.05), respectively. In the categorical analyses, the mortality risks for SO2 and CO demonstrated a monotonic increment, while the mortality risks for PM1, PM2.5 and PM10 increased at lower concentrations but levelled off or decreased at higher concentrations. The mortality risk for O3 increased at high-level concentrations (Figure 1, Supplementary Table S2, available in www.besjournal.com). There was no significant association between NO2 and any mortality outcomes.
Table 3. Adjusted ORs and 95% CIs for per 1 µg/m3 increase in 3-year exposure to ambient air pollution with risk of all-cause and cause-specific mortality
Air pollutant All-cause mortality Non-accidental mortality Cancer mortality Cardiovascular mortality PM1 1.49 (1.46, 1.53) 1.49 (1.45, 1.52) 1.46 (1.40, 1.52) 1.47 (1.42, 1.53) PM2.5 1.30 (1.27, 1.32) 1.29 (1.27, 1.32) 1.30 (1.26, 1.35) 1.30 (1.26, 1.34) PM10 1.05 (1.04, 1.06) 1.05 (1.04, 1.06) 1.04 (1.02, 1.06) 1.04 (1.03, 1.06) SO2 5.84 (5.39, 6.32) 5.87 (5.42, 6.37) 6.34 (5.55, 7.25) 5.33 (4.69, 6.07) NO2 1.01 (1.00, 1.01) 1.01 (1.00, 1.01) 1.01 (1.00, 1.02) 1.01 (1.00, 1.02) CO 1.04 (1.04, 1.05) 1.04 (1.04, 1.05) 1.04 (1.04, 1.05) 1.04 (1.04, 1.05) O3 1.02 (1.00, 1.03) 1.02 (1.00, 1.03) 1.00 (0.98, 1.02) 1.02 (0.99, 1.04) Note. Values are OR (95% CI), and adjusted for age, sex, race, education, marital status, BMI, physical activity, smoking, drinking, hypertension, and diabetes. PM1, particulate matter with an aerodynamic diameter ≤ 1 μm; PM2.5, particulate matter with an aerodynamic diameter ≤ 2.5 μm; PM10, particulate matter with an aerodynamic diameter ≤ 10 μm; SO2, sulfur dioxide; NO2, nitrogen dioxide; CO, carbon monoxide; O3, ozone; OR, odds ratio; CI, confidence interval. 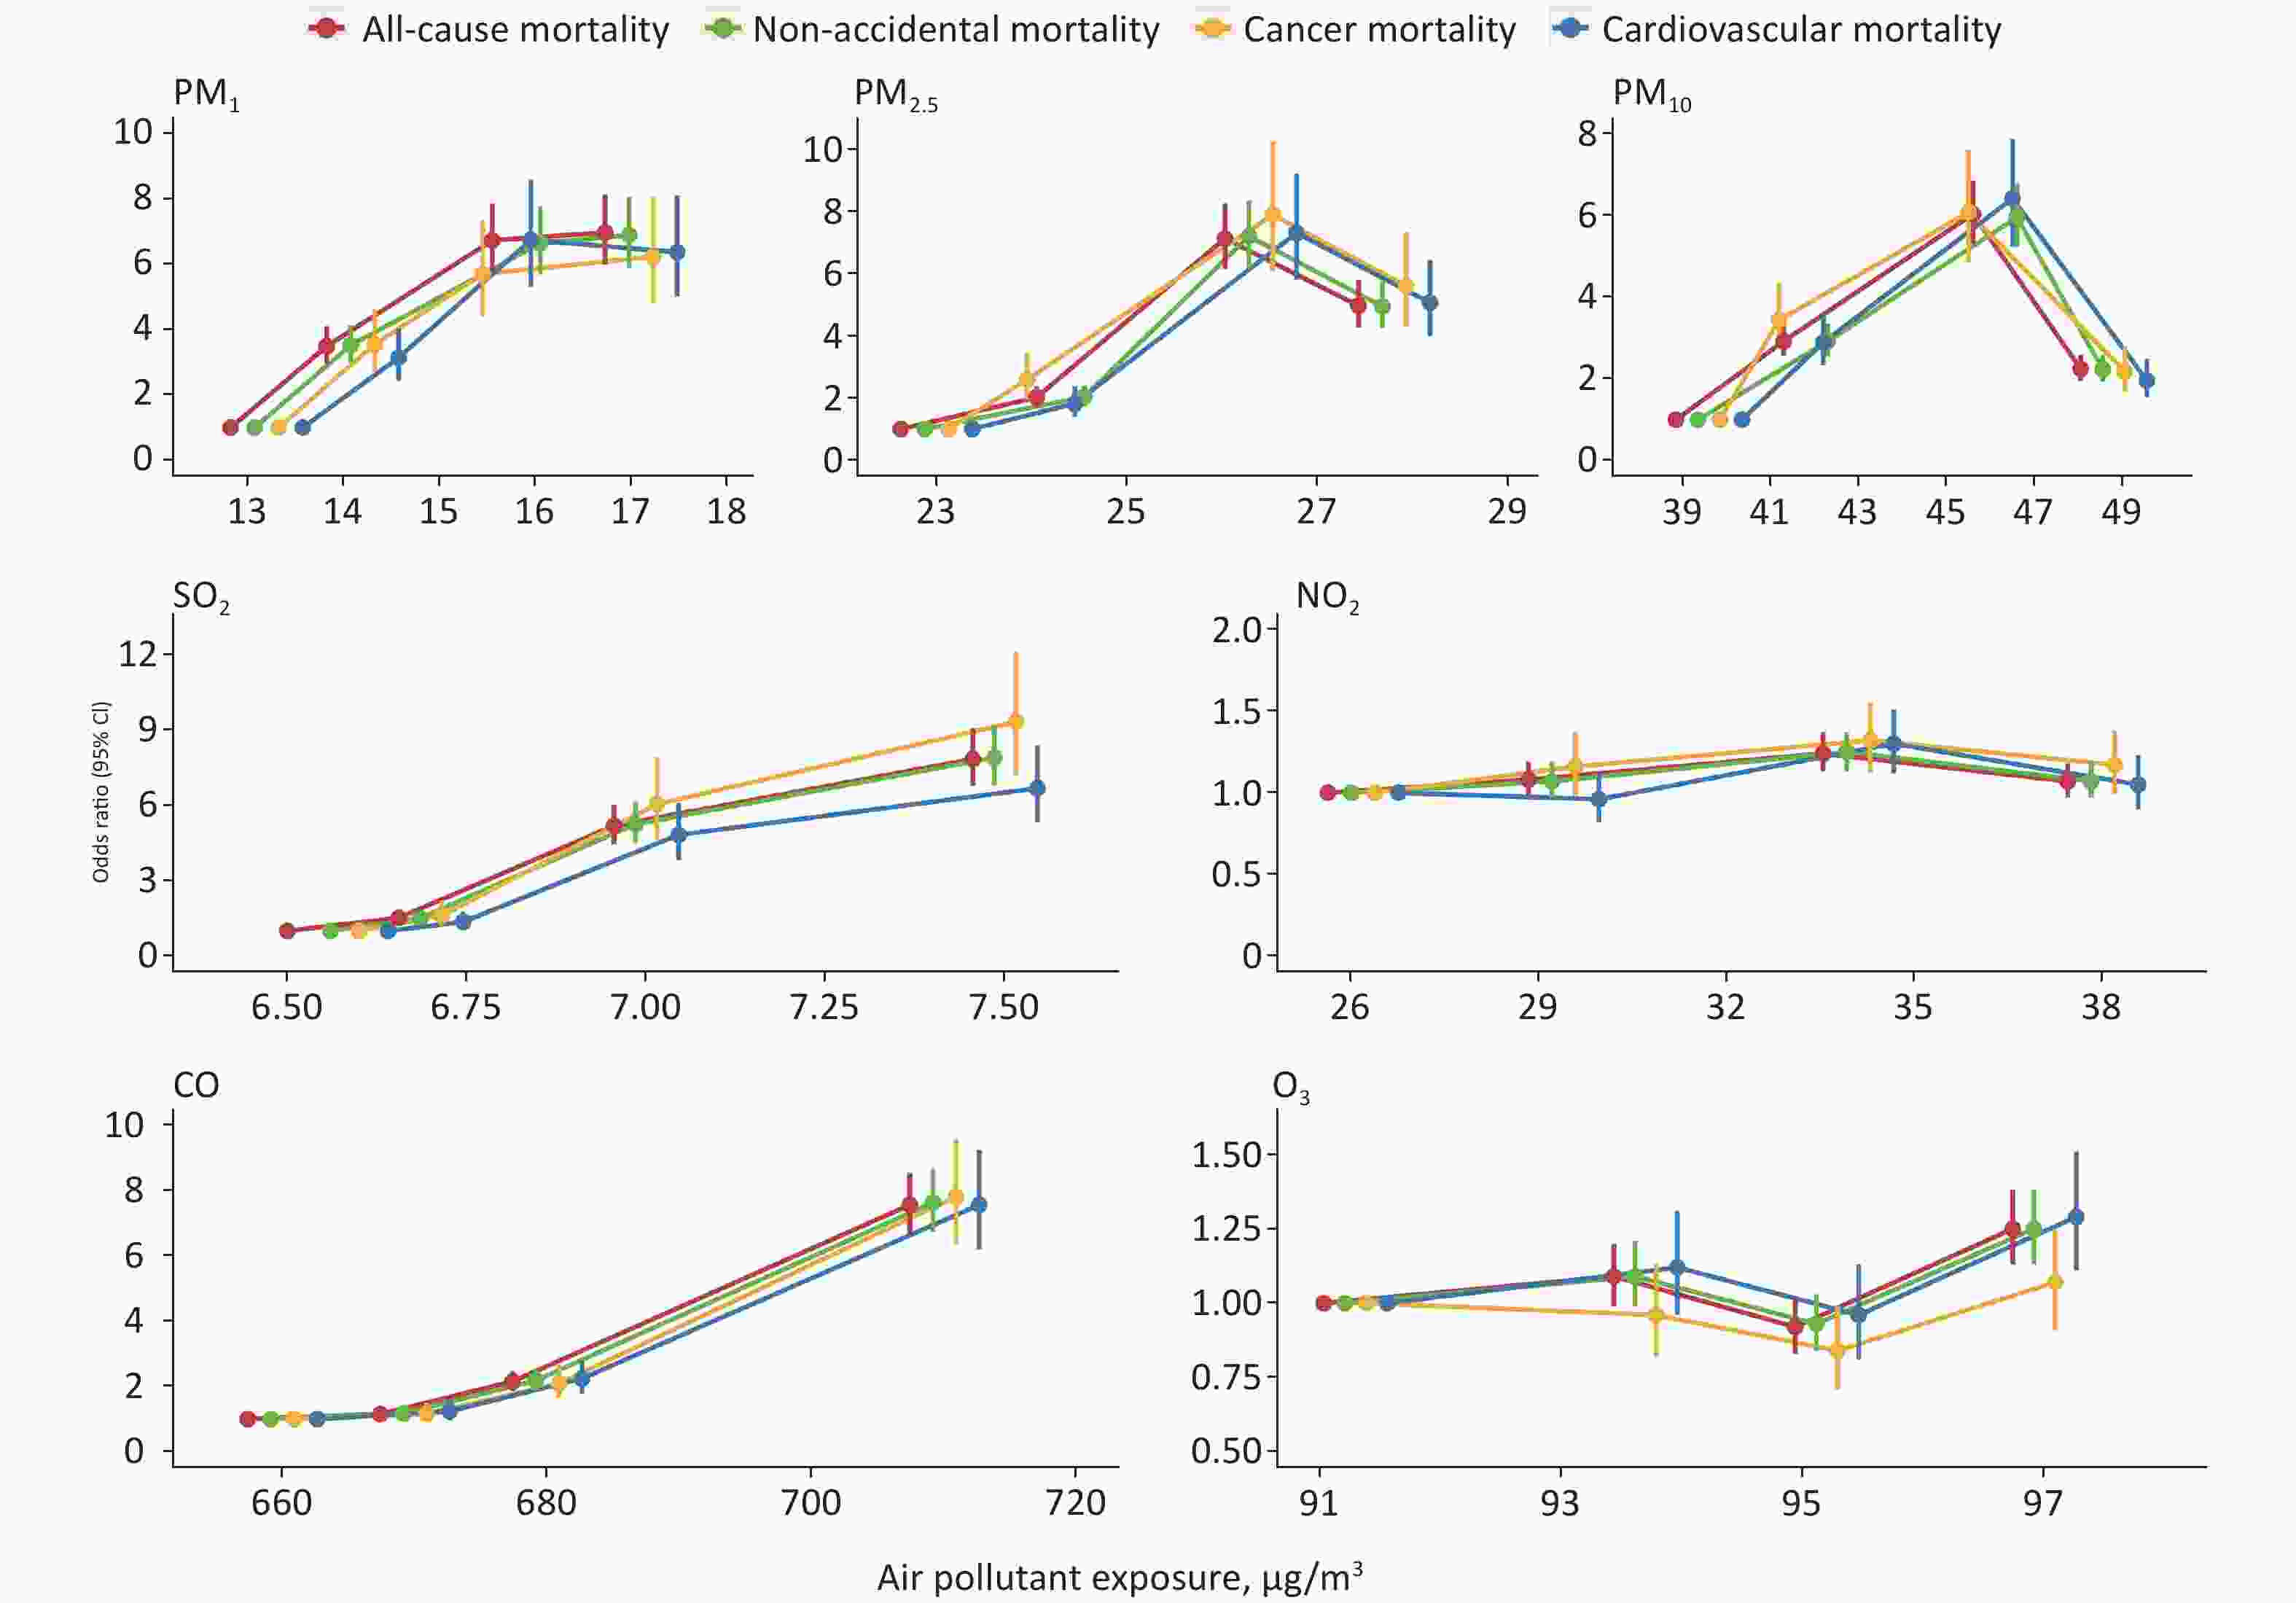
Figure 1. ORs and 95% CIs of all-cause and cause-specific mortality associated with 3-year exposure to ambient air pollution in categorical analyses. The first quartile was considered as a reference group. PM1, particulate matter with an aerodynamic diameter ≤ 1 μm; PM2.5, particulate matter with an aerodynamic diameter ≤ 2.5 μm; PM10, particulate matter with an aerodynamic diameter ≤ 10 μm; SO2, sulfur dioxide; NO2, nitrogen dioxide; CO, carbon monoxide; O3, ozone; OR, odds ratio; CI, confidence interval.
In stratified analyses, we observed effect modifications by age, BMI, physical activity, smoking, and history of diabetes for different air pollutant exposures and all-cause mortality (P for difference < 0.05) (Table 4). With regard to age, stronger associations of PM1 and SO2 were found in participants younger than 75 years. For BMI, a higher association of SO2 exposure was observed in overweight and obese subjects. For physical activity, stronger associations of PM1, PM2.5, PM10, SO2, CO, and O3 exposure were observed in subjects who did physical activities daily. For smoking, a higher association of CO exposure was observed in never-smokers. For diabetes, we investigated a stronger association of SO2 exposure in participants with a history of diabetes. Stratified analyses for non-accidental, cancer and cardiovascular mortality displayed similar trends (Supplementary Tables S3–S5, available in www.besjournal.com).
Table 4. Adjusted ORs and 95% CIs for per 1 µg/m3 increase in 3-year exposure to ambient air pollution with risk of all-cause mortality in stratified analyses
Subgroup PM1 PM2.5 PM10 SO2 NO2 CO O3 Sex Male 1.50 (1.45, 1.55) 1.32 (1.28, 1.35) 1.06 (1.04, 1.07) 5.94 (5.35, 6.59) 1.01 (1.00, 1.02) 1.04 (1.04, 1.05) 1.02 (1.00, 1.04) Female 1.49 (1.44, 1.55) 1.27 (1.23, 1.31) 1.05 (1.03, 1.06) 5.76 (5.09, 6.51) 1.00 (0.99, 1.01) 1.04 (1.04, 1.05) 1.01 (0.99, 1.03) P for differencea 0.860 0.100 0.450 0.830 0.070 0.410 0.950 Age, years < 75 1.52 (1.46, 1.58) 1.28 (1.24, 1.32) 1.05 (1.03, 1.07) 6.31 (5.61, 7.10) 1.01 (1.00, 1.02) 1.04 (1.04, 1.05) 1.02 (1.00, 1.04) ≥ 75 1.46 (1.41, 1.51) 1.29 (1.25, 1.32) 1.05 (1.03, 1.06) 5.38 (4.84, 6.00) 1.00 (0.99, 1.01) 1.04 (1.04, 1.05) 1.00 (0.98, 1.02) P for differencea 0.030 0.300 0.610 0.004 0.100 0.670 0.480 BMI, kg/m2 < 25.0 1.49 (1.44, 1.53) 1.29 (1.26, 1.32) 1.05 (1.04, 1.06) 5.84 (5.33, 6.41) 1.01 (1.00, 1.01) 1.04 (1.04, 1.05) 1.02 (1.00, 1.03) ≥ 25.0 1.52 (1.45, 1.59) 1.32 (1.27, 1.37) 1.06 (1.04, 1.08) 5.89 (5.04, 6.88) 1.01 (1.00, 1.03) 1.05 (1.04, 1.05) 1.02 (0.99, 1.05) P for differencea 0.150 0.250 0.840 0.020 0.870 0.480 0.640 Physical activity Not daily 1.48 (1.43, 1.53) 1.25 (1.21, 1.29) 1.04 (1.03, 1.06) 5.14 (4.57, 5.77) 1.01 (1.00, 1.02) 1.04 (1.04, 1.04) 1.00 (0.98, 1.02) Daily 1.51 (1.46, 1.57) 1.35 (1.31, 1.39) 1.06 (1.05, 1.08) 6.61 (5.93, 7.37) 1.01 (1.00, 1.02) 1.05 (1.04, 1.05) 1.03 (1.01, 1.05) P for differencea 0.002 < 0.001 < 0.001 0.010 0.060 < 0.001 0.040 Smoking Never 1.49 (1.45, 1.53) 1.30 (1.27, 1.33) 1.05 (1.04, 1.06) 6.01 (5.51, 6.57) 1.01 (1.00, 1.02) 1.05 (1.04, 1.05) 1.01 (1.00, 1.03) Quit or current 1.54 (1.45, 1.63) 1.29 (1.23, 1.36) 1.06 (1.03, 1.08) 5.14 (4.26, 6.20) 1.01 (0.99, 1.03) 1.04 (1.04, 1.04) 1.03 (1.00, 1.06) P for differencea 0.416 0.587 0.933 0.079 0.954 0.004 0.810 Hypertension No 1.50 (1.44, 1.56) 1.31 (1.26, 1.36) 1.06 (1.04, 1.07) 5.78 (5.08, 6.59) 1.00 (0.99, 1.01) 1.05 (1.04, 1.05) 1.01 (0.98, 1.03) Yes 1.49 (1.45, 1.54) 1.29 (1.25, 1.32) 1.05 (1.04, 1.06) 5.86 (5.30, 6.48) 1.01 (1.00, 1.02) 1.04 (1.04, 1.04) 1.02 (1.00, 1.04) P for differencea 1.000 0.650 0.690 0.840 0.250 0.080 0.180 Diabetes No 1.48 (1.44, 1.53) 1.28 (1.25, 1.32) 1.05 (1.03, 1.06) 5.48 (4.97, 6.03) 1.00 (0.99, 1.01) 1.04 (1.04, 1.05) 1.02 (1.00, 1.03) Yes 1.52 (1.46, 1.58) 1.32 (1.27, 1.37) 1.06 (1.04, 1.08) 6.74 (5.84, 7.77) 1.02 (1.00, 1.03) 1.04 (1.04, 1.05) 1.01 (0.99, 1.04) P for differencea 0.360 0.210 0.140 0.030 0.050 0.190 0.910 Note. Values are OR (95% CI), and adjusted for age, sex, race, education, marital status, BMI, physical activity, smoking, drinking, hypertension, and diabetes. aP for difference was compared with another stratified group. Abbreviations: BMI, body mass index; PM1, particulate matter with an aerodynamic diameter ≤ 1 μm; PM2.5, particulate matter with an aerodynamic diameter ≤ 2.5 μm; PM10, particulate matter with an aerodynamic diameter ≤ 10 μm; SO2, sulfur dioxide; NO2, nitrogen dioxide; CO, carbon monoxide; O3, ozone; OR, odds ratio; CI, confidence interval. In the sensitivity analysis, using the 1-year exposure level did not change the main results visibly, despite the significant association for CO disappeared, while the significant association was found for NO2 (Supplementary Table S6, available in www.besjournal.com). In two-pollutant models, although estimates were changed after adjustment, the association of exposure to PM1, SO2, and CO remained stable (Supplementary Tables S7–S10, available in www.besjournal.com). The analysis excluding the subjects who died within 1 year after entering Shenzhen Healthy Ageing Research yielded similar trends (Supplementary Table S11, available in www.besjournal.com). Results in the analysis with a shorter mortality follow-up also remained stable (Supplementary Table S12, available in www.besjournal.com).
Table S6. Adjusted ORs and 95% CIs for per 1 µg/m3 increase in 1-year exposure to ambient air pollution with risk of all-cause and cause-specific mortality
Air pollutant OR (95% CI) All-cause mortality Non-accidental mortality Cancer mortality Cardiovascular mortality PM1 1.27 (1.24, 1.29) 1.27 (1.24, 1.29) 1.28 (1.24, 1.32) 1.26 (1.22, 1.30) PM2.5 2.16 (2.03, 2.31) 2.16 (2.02, 2.31) 2.37 (2.11, 2.66) 2.10 (1.89, 2.33) PM10 1.20 (1.18, 1.22) 1.20 (1.19, 1.22) 1.21 (1.18, 1.24) 1.20 (1.17, 1.23) SO2 1.91 (1.71, 2.15) 1.91 (1.70, 2.15) 1.91 (1.58, 2.30) 1.92 (1.59, 2.31) NO2 1.05 (1.04, 1.06) 1.05 (1.04, 1.06) 1.05 (1.03, 1.07) 1.06 (1.04, 1.08) CO 1.00 (1.00, 1.01) 1.00 (1.00, 1.01) 1.00 (0.99, 1.01) 1.00 (1.00, 1.01) O3 1.39 (1.37, 1.41) 1.39 (1.37, 1.41) 1.37 (1.34, 1.40) 1.41 (1.38, 1.44) Note. Adjusted for age, sex, race, education, marital status, BMI, physical activity, smoking, drinking, hypertension, and diabetes. PM1, particulate matter with an aerodynamic diameter ≤ 1 μm; PM2.5, particulate matter with an aerodynamic diameter ≤ 2.5 μm; PM10, particulate matter with an aerodynamic diameter ≤ 10 μm; SO2, sulfur dioxide; NO2, nitrogen dioxide; CO, carbon monoxide; O3, ozone; OR, odds ratio; CI, confidence interval. Table S7. Adjusted ORs and 95% CIs of all-cause mortality associated with per 1 µg/m3 increase of 3-year exposure to ambient air pollution estimated by single- and 2-pollutant models
Air pollutant Model OR (95% CI) P for difference PM1 Single 1.49 (1.46, 1.53) And SO2 1.19 (1.15, 1.22) < 0.001 And NO2 2.33 (2.25, 2.41) < 0.001 And CO 1.18 (1.14, 1.22) < 0.001 And O3 1.61 (1.57, 1.65) < 0.001 PM2.5 Single 1.30 (1.27, 1.32) And SO2 1.09 (1.07, 1.11) < 0.001 And NO2 2.43 (2.34, 2.51) < 0.001 And CO 0.93 (0.90, 0.95) < 0.001 And O3 1.41 (1.38, 1.44) < 0.001 PM10 Single 1.05 (1.04, 1.06) And SO2 0.96 (0.95, 0.97) < 0.001 And NO2 1.27 (1.24, 1.29) < 0.001 And CO 0.76 (0.74, 0.77) < 0.001 And O3 1.07 (1.06, 1.08) < 0.001 SO2 Single 5.84 (5.39, 6.32) And PM1 3.05 (2.75, 3.38) < 0.001 And PM2.5 3.46 (3.13, 3.83) < 0.001 And PM10 5.97 (5.49, 6.49) 0.090 And NO2 8.61 (7.92, 9.36) < 0.001 And CO 2.41 (2.16, 2.69) < 0.001 And O3 6.94 (6.39, 7.54) < 0.001 NO2 Single 1.01 (1.00, 1.01) And PM1 0.77 (0.77, 0.78) < 0.001 And PM2.5 0.64 (0.63, 0.65) < 0.001 And PM10 0.81 (0.80, 0.82) < 0.001 And SO2 0.88 (0.87, 0.89) < 0.001 And CO 0.83 (0.82, 0.84) < 0.001 And O3 1.01 (1.00, 1.01) < 0.001 CO Single 1.04 (1.04, 1.05) And PM1 1.03 (1.02, 1.03) < 0.001 And PM2.5 1.03 (1.03, 1.03) < 0.001 And PM10 1.07 (1.07, 1.08) < 0.001 And SO2 1.02 (1.02, 1.03) < 0.001 And NO2 1.06 (1.06, 1.06) < 0.001 And O3 1.10 (1.10, 1.10) < 0.001 O3 Single 1.02 (1.00, 1.03) And PM1 0.88 (0.87, 0.89) < 0.001 And PM2.5 0.85 (0.84, 0.86) < 0.001 And PM10 0.95 (0.94, 0.96) < 0.001 And SO2 0.94 (0.93, 0.95) < 0.001 And NO2 1.02 (1.01, 1.03) < 0.001 And CO 0.60 (0.58, 0.61) < 0.001 Note. Adjusted for age, sex, race, education, marital status, BMI, physical activity, smoking, drinking, hypertension, and diabetes. PM1, particulate matter with an aerodynamic diameter ≤ 1 μm; PM2.5, particulate matter with an aerodynamic diameter ≤ 2.5 μm; PM10, particulate matter with an aerodynamic diameter ≤ 10 μm; SO2, sulfur dioxide; NO2, nitrogen dioxide; CO, carbon monoxide; O3, ozone; OR, odds ratio; CI, confidence interval. Table S10. Adjusted ORs and 95% CIs of cardiovascular mortality associated with per 1 µg/m3 increase of 3-year exposure to ambient air pollution estimated by single- and 2-pollutant models
Air pollutant Model OR (95% CI) P for difference PM1 Single 1.47 (1.42, 1.53) And SO2 1.19 (1.14, 1.25) < 0.001 And NO2 2.37 (2.24, 2.50) < 0.001 And CO 1.20 (1.13, 1.26) < 0.001 And O3 1.58 (1.52, 1.65) < 0.001 PM2.5 Single 1.30 (1.26, 1.34) And SO2 1.10 (1.06, 1.13) < 0.001 And NO2 2.43 (2.29, 2.57) < 0.001 And CO 0.93 (0.88, 0.97) < 0.001 And O3 1.41 (1.36, 1.47) < 0.001 PM10 Single 1.04 (1.03, 1.06) And SO2 0.95 (0.94, 0.97) < 0.001 And NO2 1.27 (1.23, 1.31) < 0.001 And CO 0.74 (0.72, 0.76) < 0.001 And O3 1.06 (1.05, 1.08) < 0.001 SO2 Single 5.33 (4.69, 6.07) And PM1 2.71 (2.29, 3.20) < 0.001 And PM2.5 3.06 (2.59, 3.61) < 0.001 And PM10 5.46 (4.77, 6.26) 0.332 And NO2 8.07 (7.04, 9.24) < 0.001 And CO 2.15 (1.79, 2.57) < 0.001 And O3 6.43 (5.62, 7.36) < 0.001 NO2 Single 1.01 (1.00, 1.02) And PM1 0.77 (0.75, 0.78) < 0.001 And PM2.5 0.63 (0.61, 0.65) < 0.001 And PM10 0.82 (0.80, 0.83) < 0.001 And SO2 0.88 (0.87, 0.89) < 0.001 And CO 0.83 (0.81, 0.84) < 0.001 And O3 1.01 (1.00, 1.02) < 0.001 CO Single 1.04 (1.04, 1.05) And PM1 1.03 (1.02, 1.03) < 0.001 And PM2.5 1.03 (1.03, 1.03) < 0.001 And PM10 1.07 (1.07, 1.08) < 0.001 And SO2 1.02 (1.02, 1.03) < 0.001 And NO2 1.06 (1.06, 1.06) < 0.001 And O3 1.10 (1.10, 1.11) < 0.001 O3 Single 1.02 (0.99, 1.04) And PM1 0.87 (0.85, 0.88) < 0.001 And PM2.5 0.84 (0.83, 0.86) < 0.001 And PM10 0.95 (0.93, 0.97) < 0.001 And SO2 0.94 (0.92, 0.95) < 0.001 And NO2 1.02 (1.00, 1.04) < 0.001 And CO 0.57 (0.55, 0.59) < 0.001 Note. Adjusted for age, sex, race, education, marital status, BMI, physical activity, smoking, drinking, hypertension, and diabetes. PM1, particulate matter with an aerodynamic diameter ≤ 1 μm; PM2.5, particulate matter with an aerodynamic diameter ≤ 2.5 μm; PM10, particulate matter with an aerodynamic diameter ≤ 10 μm; SO2, sulfur dioxide; NO2, nitrogen dioxide; CO, carbon monoxide; O3, ozone; OR, odds ratio; CI, confidence interval. Table S11. Adjusted ORs and 95% CIs for per 1 µg/m3 increase in 3-year exposure to ambient air pollution with risk of all-cause and cause-specific mortality without subjects died in the first year after entering Shenzhen Healthy Ageing Researcha
Air pollutant OR (95% CI) All-cause mortality Non-accidental mortality Cancer mortality Cardiovascular mortality PM1 1.44 (1.40, 1.48) 1.43 (1.39, 1.47) 1.38 (1.31, 1.45) 1.43 (1.36, 1.50) PM2.5 1.26 (1.23, 1.29) 1.26 (1.22, 1.29) 1.26 (1.21, 1.31) 1.26 (1.21, 1.31) PM10 1.03 (1.02, 1.04) 1.03 (1.02, 1.04) 1.02 (1.00, 1.04) 1.03 (1.01, 1.05) SO2 4.35 (3.95, 4.79) 4.40 (3.99, 4.86) 4.77 (4.07, 5.58) 4.26 (3.64, 4.98) NO2 1.00 (0.99, 1.01) 1.00 (0.99, 1.01) 1.00 (0.99, 1.02) 1.00 (0.98, 1.01) CO 1.04 (1.04, 1.04) 1.04 (1.04, 1.04) 1.04 (1.03, 1.04) 1.04 (1.03, 1.04) O3 1.05 (1.03, 1.07) 1.05 (1.03, 1.07) 1.04 (1.01, 1.07) 1.05 (1.02, 1.07) Note. Adjusted for age, sex, race, education, marital status, BMI, physical activity, smoking, drinking, hypertension, and diabetes. aThe total number of subjects without people died in the first year after entering Shenzhen Healthy Ageing Research was 208,394. The total of deaths was 2,491, including 2,403 non-accidental deaths, 935 deaths from cancer and 940 deaths from cardiovascular diseases. PM1, particulate matter with an aerodynamic diameter ≤ 1 μm; PM2.5, particulate matter with an aerodynamic diameter ≤ 2.5 μm; PM10, particulate matter with an aerodynamic diameter ≤ 10 μm; SO2, sulfur dioxide; NO2, nitrogen dioxide; CO, carbon monoxide; O3, ozone; OR, odds ratio; CI, confidence interval. Table S12. Adjusted ORs and 95% CIs for per 1 µg/m3 increase in 3-year exposure to ambient air pollution with risk of all-cause and cause-specific mortality with subjects followed up less than 1.5 yearsa
Air pollutant OR (95% CI) All-cause mortality Non-accidental mortality Cancer mortality Cardiovascular mortality PM1 1.60 (1.55, 1.66) 1.60 (1.55, 1.66) 1.54 (1.50, 1.60) 1.54 (1.49, 1.60) PM2.5 1.33 (1.30, 1.37) 1.33 (1.30, 1.37) 1.34 (1.30, 1.38) 1.34 (1.30, 1.38) PM10 1.06 (1.05, 1.07) 1.06 (1.05, 1.07) 1.05 (1.04, 1.07) 1.05 (1.04, 1.07) SO2 8.46 (7.60, 9.42) 8.46 (7.60, 9.42) 8.26 (7.41, 9.22) 8.26 (7.41, 9.22) NO2 1.01 (1.00, 1.02) 1.01 (1.00, 1.02) 1.01 (1.00, 1.02) 1.01 (1.00, 1.02) CO 1.05 (1.05, 1.06) 1.05 (1.05, 1.06) 1.05 (1.05, 1.06) 1.05 (1.05, 1.06) O3 0.96 (0.94, 0.97) 0.96 (0.94, 0.97) 0.95 (0.94, 0.97) 0.95 (0.94, 0.97) Note. Adjusted for age, sex, race, education, marital status, BMI, physical activity, smoking, drinking, hypertension, and diabetes. aThe total number of subjects followed up less than 1.5 years was 148,715. The total of deaths was 2,437, including 2,343 non-accidental deaths, 845 deaths from cancer and 985 deaths from cardiovascular diseases. PM1, particulate matter with an aerodynamic diameter ≤ 1 μm; PM2.5, particulate matter with an aerodynamic diameter ≤ 2.5 μm; PM10, particulate matter with an aerodynamic diameter ≤ 10 μm; SO2, sulfur dioxide; NO2, nitrogen dioxide; CO, carbon monoxide; O3, ozone; OR, odds ratio; CI, confidence interval. -
This large population-based study observed that long-term PM1, PM2.5, PM10, SO2, and CO exposures were significantly positively associated with all-cause, non-accidental, cancer and cardiovascular mortality, and O3 was significantly positively associated with all-cause and non-accidental mortality. Varying by subpopulations, a stronger association was detected among participants who were younger (< 75 years), overweight and obese, engaged in daily physical activities, never smoked, and had a history of diabetes.
Long-term exposure to low-level PM2.5, NO2, and O3 have been linked with mortality among older adults in some large studies, especially in Australia and the United States of America. In Australia, Yu and colleagues[28] evaluated the association between low-level PM2.5 (< 9 μg/m3) and mortality among 0.27 million registered deaths (≥ 65 years). They discovered that the risk of non-accidental, and cardiovascular mortality increased by 5.02% (95% CI: 3.46%, 6.50%) and 4.08% (2.22%, 6.08%), respectively, for each 1 μg/m3 increment in PM2.5. In the United States of America, Yazdi and colleagues[29] developed a cohort study among more than 40 million Medicare beneficiaries (≥ 65 years) from 2000–2016 who had been restrictedly only in contact with low concentrations of PM2.5 (< 12 μg/m3), NO2 [53 parts per billion (ppb), –100 μg/m3], and O3 (50 ppb, –107 μg/m3). They observed an increased risk of all-cause mortality of 0.073% (95% CI: 0.071%, 0.076%), 0.0016% (0.0016%, 0.0021%), and 0.038% (0.037%, 0.039%) per 1 μg/m3 increment in PM2.5, NO2, and O3, respectively. Qian and colleagues[30] found similar findings in a cohort study of over 9 million Medicare beneficiaries (≥ 65 years). They observed an increased risk of all-cause mortality of 0.22% (95% CI: 0.21%, 0.24%) per 1 μg/m3 increment for NO2 and its concentration was below the WHO interim target 1 (40 μg/m3). In contrast to recent epidemiological researches, we did not observe a significant association between NO2 exposure and mortality. The inconsistency may be related to unadjusted confounders, such as dietary intake and socioeconomic status (SES), which could affect the results[31]. However, the estimates implied that there may be adverse effects, and we discovered the detrimental effects of NO2 when changing the exposure window to 1 year before the end of follow-up.
Generally, compared with previous studies, the estimates in our study were larger. Evidence has shown the adverse impact of air pollution is elevated with the increasing concentration of air pollutants[32]. The concentration of air pollutants in Shenzhen was higher than that in Western countries. The concentration range of PM2.5 was 19.0–35.8 μg/m³ in our study, whereas in Western countries, PM2.5 concentrations were normally below 15 μg/m³. Additionally, researchers have suggested that the particular matter composition may have a more deleterious effect on health than its concentration[33]. The composition and sources of air pollutants differ among countries. Compared to other countries, China is the only country that has all the industrial categories, and the industrial scale of Shenzhen ranks at the top in China. Therefore, the composition of air pollutants in this region is more complex and may contain more harmful components.
Few studies have investigated the associations of long-term PM1, SO2, and CO exposure with mortality among older adults[34,35]. We observed significant associations of long-term PM1, SO2, and CO exposure with all-cause, non-accidental, cancer and cardiovascular mortality, which were robust in sensitive analyses. The estimates of PM1 were higher than those of PM2.5 and PM10. PM1 is smaller, more toxic, can reach deeper into the lung and rapidly enter the bloodstream and cells[36]. For SO2, the relatively small range in SO2 exposure in our study (4.8–10.6 μg/m3) made the estimates higher than another cohort study conducted in China (OR: 1.008; 95% CI: 1.002, 1.014; each 10 μg/m3 increment), which covered a concentration range of 16.75–189.00 μg/m3[34]. Besides, we observed that in most studies conducted in Shenzhen, the estimates of SO2 were much higher than that of other air pollutants[37–39]. Similar to our study, the SO2 exposure varied in a very narrow range. However, the ORs of those studies conducted in areas with a higher level or wider range of SO2 concentrations in China were not excessively elevated or markedly different from those of other pollutants. Therefore, we speculate that the main reason for the excessively high estimates of SO2 in our study was the narrow range of concentration variation. In addition, potential exposure misclassification cannot be disregarded.
Previous studies found nonlinear associations between long-term exposure to particulate matter and mortality, with the risk rising in the range of low concentrations and leveling off at higher concentrations, which is generally consistent with our results[23,40,41]. The highly polluted environment will limit older adults from going outside, thereby reducing their exposure to air pollutants. Additionally, we observed monotonically increasing trends between SO2 and CO exposures and mortality within a narrow range of fairly low SO2 and CO concentrations, which is in line with the existing evidence. Studies in developed western countries have shown a steep linear trend between long-term exposure to low-level air pollution and mortality[42–44].
In terms of effect modification, the associations of PM1 and SO2 with all-cause, non-accidental, and cardiovascular mortality were stronger in subjects aged < 75 years. Compared to the subjects aged ≥ 75 years, adults aged < 75 years may spend more time outdoors and be more vulnerable to being affected by air pollution[30]. We also found stronger associations of SO2 with all-cause and non-accidental mortality in overweight and obese subjects. Evidence has substantiated that overweight and obesity could damage normal physiological functions of the body, so these individuals are more vulnerable to air pollution[45]. Besides, we found stronger associations of air pollution with all-cause and cause-specific mortality among more physically active subjects. Individuals may inhale more air pollutants when performing physical activities outside because of incremental lung ventilation, which aggravates the harmful impact of air pollution[46]. However, the estimates across subgroups were similar. The information on physical activity in this study only includes frequency, which is a relatively rough indicator. Besides, since the older adults are now retired, the demographic characteristics and lifestyles of them in the same region are close. Therefore, we are unsure of whether there is a significant difference between the estimates for the categories of physical activity. Moreover, our results showed that the estimates of CO on all-cause and non-accidental mortality in never-smokers were slightly higher than that in quit or current smokers. Similar to physical activity, the reasons for our smoking-specific observation are unclear and require further investigation. In addition, we found the association of SO2 with all-cause and non-accidental mortality was stronger in diabetic patients. Evidence has demonstrated that diabetic patients exposed to SO2 for a long time have greater levels of inflammatory biomarkers than non-diabetic patients[47], which has been linked to a higher risk of macrovascular events and mortality.
Oxidative stress, inflammatory responses, and epigenetic changes are now the main explanations for biological mechanisms related to air pollution and mortality. During inhalation, air pollutants are deposited on the walls of the bronchi and lungs. These foreign substances can trigger inflammatory responses and increase oxidative stress, which can lead to the destruction of the cell’s structure, and finally induce or expedite the development of atherosclerosis, cardiovascular diseases, and other chronic diseases[48]. Particular carcinogens and their mixtures, such as polycyclic aromatic hydrocarbon (PAHs) and sulfur-containing compounds, can cause molecular changes through oxidative stress and low-grade, chronic inflammation, involving inactivation of tumor suppressor genes and the activation of oncogenes, abnormal induction of somatic cells, and finally leading to cancer[49].
The present research has a few advantages. Firstly, the large sample size (over 0.3 million older adults) facilitated the statistical efficacy to produce reliable results. Secondly, we obtained air pollutants data from the CHAP dataset, which completely covered the study area in space and time, and performed an exposure assessment based on individual levels. It provided a more accurate exposure assessment than previous studies that obtained data from monitoring stations. Thirdly, by conducting research among older adults in an area where air pollutant concentrations are one of the lowest in China, our study adds to the knowledge about the association between long-term low-level air pollution exposure and mortality.
However, our study also has limitations to be noted. Firstly, the extrapolation of the results was limited. The subjects in our study were aged ≥ 65 years, thus the results may not be appropriate for extrapolation to younger groups. Subjects were recruited using convenience sampling. This is an important barrier in extrapolating the results to the general population. This study was conducted in a single city with a narrow range of air pollutants, so generalizing the findings to other areas or nations should be made with caution. Secondly, the resolution of the CHAP dataset was coarse, and we used pollutant concentrations at each subject’s residential address to represent individual exposure, which may have led to exposure misclassifications. However, these misclassifications are more likely to be non-differential and only underestimate the effect of air pollution on mortality towards the null[50]. Nonetheless, a possible differential misclassification cannot be ruled out. Thirdly, the exposure assessment was performed according to the residential address reported by the subject at baseline while we did not consider changes during the study period. This might have introduced bias into the results if a change in a residential address was related to the exposure level. Fourthly, information on covariates was obtained from questionnaires completed by participants at baseline, and some of that, such as lifestyles, might have changed during the study period, thus affected the results. In addition, we did not have any information about indoor air pollution. However, Shenzhen has a high level of modernization that clean fuels have basically been used for home cooking. Therefore, we consider the bias of indoor air pollution on our results is negligible. Besides, underreporting of mortality data and inaccurate coding of the cause of death are unavoidable problems. Nonetheless, the official investigation has shown that the completeness of death registration in Guangdong Province, where Shenzhen is located, is relatively high (86.7%)[51]. The occurrence rate of coding errors in the system is low (2.73%), and the errors are mostly in underdeveloped regions[18]. Therefore, it had little impact on our findings. Finally, due to the short follow-up period, the sample size on specific causes of death was relatively small. Hence, we did not consider specific diseases as outcomes in this study. A longer follow-up would collect more deaths.
-
We found that among Chinese older adults, long-term exposure to low-level ambient air pollution was associated with increased mortality risks.
-
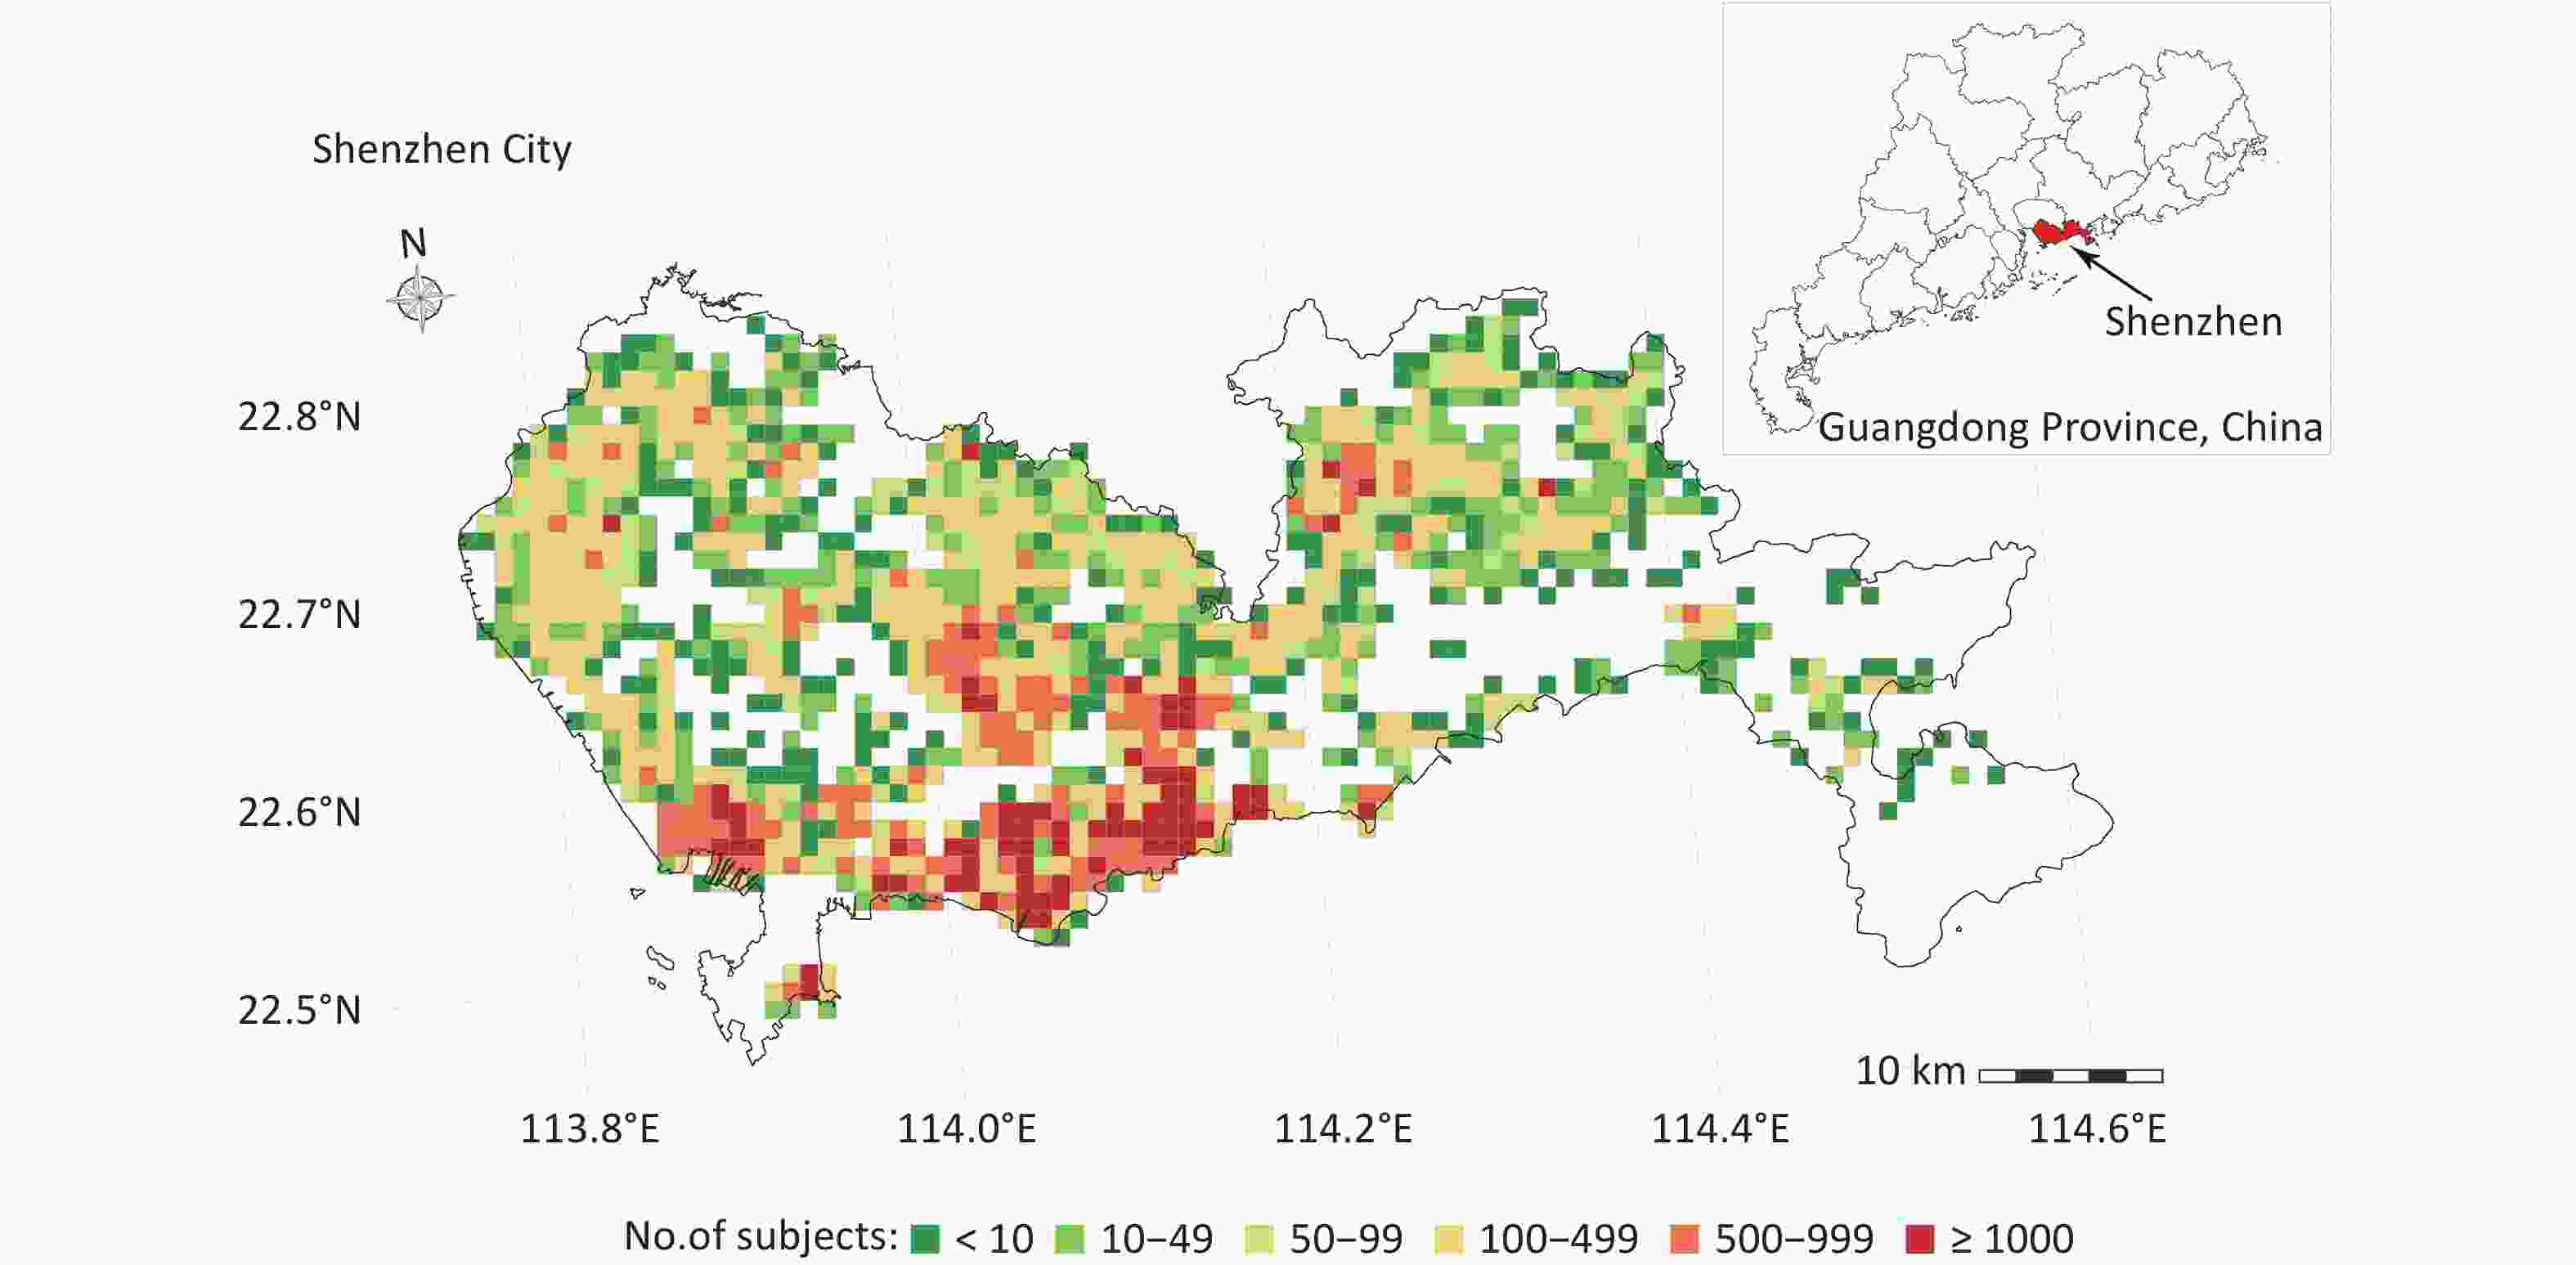
Figure S2. Spatial distribution of the study population in Shenzhen, China, 2018–2020. The grids with different colors indicate the number of subjects at a 1 km × 1 km (approximately 0.01° × 0.01°) spatial resolution.
Table S1. Spearman’s correlation coefficients between ambient air pollutants
Air pollutant PM1 PM2.5 PM10 SO2 NO2 CO O3 PM1 1 0.93 0.96 0.42 0.71 0.74 0.33 PM2.5 1 0.95 0.43 0.77 0.71 0.30 PM10 1 0.46 0.80 0.73 0.23 SO2 1 0.65 0.31 -0.01 NO2 1 0.40 -0.14 CO 1 0.61 O3 1 Note. All P < 0.05. PM1, particulate matter with an aerodynamic diameter ≤ 1 μm; PM2.5, particulate matter with an aerodynamic diameter ≤ 2.5 μm; PM10, particulate matter with an aerodynamic diameter ≤ 10 μm; SO2, sulfur dioxide; NO2, nitrogen dioxide; CO, carbon monoxide; O3, ozone. Table S2. Adjusted ORs and 95% CIs of all-cause and cause-specific mortality associated with 3-year exposure to ambient air pollution in categorical analyses
Air pollutant OR (95% CI) Quartile of exposure P for linear trend Quartile 1 (Ref.) Quartile 2 Quartile 3 Quartile 4 PM1 All-cause mortality 1 3.49 (2.97, 4.10) 6.73 (5.77, 7.86) 6.97 (5.98, 8.13) < 0.001 Non-accidental mortality 1 3.52 (2.99, 4.14) 6.64 (5.68, 7.77) 6.89 (5.90, 8.06) < 0.001 Cancer mortality 1 3.55 (2.72, 4.62) 5.70 (4.41, 7.36) 6.23 (4.82, 8.05) < 0.001 Cardiovascular mortality 1 3.14 (2.43, 4.04) 6.74 (5.30, 8.58) 6.37 (5.00, 8.10) < 0.001 PM2.5 All-cause mortality 1 2.02 (1.71, 2.38) 7.12 (6.15, 8.24) 4.96 (4.27, 5.77) < 0.001 Non-accidental mortality 1 2.04 (1.73, 2.41) 7.19 (6.19, 8.34) 4.94 (4.23, 5.76) < 0.001 Cancer mortality 1 2.59 (1.95, 3.45) 7.88 (6.08, 10.22) 5.60 (4.28, 7.32) < 0.001 Cardiovascular mortality 1 1.82 (1.40, 2.37) 7.30 (5.79, 9.20) 5.06 (3.99, 6.42) < 0.001 PM10 All-cause mortality 1 2.92 (2.56, 3.35) 6.03 (5.31, 6.85) 2.24 (1.94, 2.59) < 0.001 Non-accidental mortality 1 2.92 (2.55, 3.35) 5.95 (5.23, 6.78) 2.23 (1.93, 2.58) < 0.001 Cancer mortality 1 3.44 (2.73, 4.35) 6.07 (4.86, 7.60) 2.18 (1.69, 2.81) < 0.001 Cardiovascular mortality 1 2.89 (2.33, 3.59) 6.41 (5.23, 7.86) 1.96 (1.56, 2.48) < 0.001 SO2 All-cause mortality 1 1.52 (1.28, 1.81) 5.18 (4.45, 6.02) 7.83 (6.76, 9.06) < 0.001 Non-accidental mortality 1 1.51 (1.26, 1.80) 5.24 (4.49, 6.12) 7.89 (6.79, 9.17) < 0.001 Cancer mortality 1 1.61 (1.18, 2.21) 6.04 (4.62, 7.90) 9.31 (7.16, 12.10) < 0.001 Cardiovascular mortality 1 1.36 (1.03, 1.78) 4.82 (3.82, 6.08) 6.67 (5.32, 8.36) < 0.001 NO2 All-cause mortality 1 1.08 (0.98, 1.19) 1.24 (1.13, 1.37) 1.07 (0.97, 1.18) 0.030 Non-accidental mortality 1 1.07 (0.97, 1.19) 1.25 (1.13, 1.37) 1.07 (0.97, 1.19) 0.020 Cancer mortality 1 1.16 (0.98, 1.37) 1.32 (1.12, 1.55) 1.17 (0.99, 1.38) 0.030 Cardiovascular mortality 1 0.96 (0.82, 1.13) 1.30 (1.12, 1.51) 1.05 (0.90, 1.23) 0.060 CO All-cause mortality 1 1.15 (0.99, 1.35) 2.15 (1.86, 2.47) 7.56 (6.68, 8.54) < 0.001 Non-accidental mortality 1 1.17 (1.00, 1.37) 2.18 (1.89, 2.52) 7.63 (6.73, 8.65) < 0.001 Cancer mortality 1 1.16 (0.90, 1.50) 2.09 (1.65, 2.65) 7.81 (6.35, 9.59) < 0.001 Cardiovascular mortality 1 1.24 (0.97, 1.58) 2.24 (1.78, 2.82) 7.56 (6.19, 9.24) < 0.001 O3 All-cause mortality 1 1.09 (0.99, 1.20) 0.92 (0.83, 1.02) 1.25 (1.13, 1.38) < 0.001 Non-accidental mortality 1 1.09 (0.99, 1.21) 0.93 (0.84, 1.03) 1.25 (1.13, 1.38) < 0.001 Cancer mortality 1 0.96 (0.82, 1.13) 0.84 (0.71, 0.99) 1.07 (0.91, 1.25) 0.800 Cardiovascular mortality 1 1.12 (0.96, 1.31) 0.96 (0.81, 1.13) 1.29 (1.11, 1.51) < 0.010 Note. Adjusted for age, sex, race, education, marital status, BMI, physical activity, smoking, drinking, hypertension, and diabetes. PM1, particulate matter with an aerodynamic diameter ≤ 1 μm; PM2.5, particulate matter with an aerodynamic diameter ≤ 2.5 μm; PM10, particulate matter with an aerodynamic diameter ≤ 10 μm; SO2, sulfur dioxide; NO2, nitrogen dioxide; CO, carbon monoxide; O3, ozone; OR, odds ratio; CI, confidence interval. Table S3. Adjusted ORs and 95% CIs for per 1 µg/m3 increase in 3-year exposure to ambient air pollution with risk of non-accidental mortality in stratified analyses
Subgroup OR (95% CI) PM1 PM2.5 PM10 SO2 NO2 CO O3 Sex Male 1.49 (1.44, 1.53) 1.31 (1.28, 1.35) 1.05 (1.04, 1.07) 5.97 (5.36, 6.64) 1.01 (1.00, 1.02) 1.04 (1.04, 1.05) 1.02 (1.00, 1.04) Female 1.49 (1.44, 1.55) 1.27 (1.23, 1.31) 1.05 (1.03, 1.06) 5.81 (5.13, 6.59) 1.00 (0.99, 1.01) 1.04 (1.04, 1.05) 1.01 (0.99, 1.03) P for differencea 0.880 0.140 0.590 0.910 0.050 0.360 0.940 Age < 75 years 1.51 (1.46, 1.57) 1.28 (1.24, 1.32) 1.05 (1.03, 1.07) 6.41 (5.68, 7.24) 1.01 (1.00, 1.02) 1.04 (1.04, 1.05) 1.02 (1.00, 1.04) ≥ 75 years 1.45 (1.41, 1.50) 1.29 (1.25, 1.32) 1.05 (1.03, 1.06) 5.38 (4.82, 6.00) 1.00 (0.99, 1.01) 1.04 (1.04, 1.05) 1.00 (0.99, 1.02) P for differencea 0.030 0.300 0.570 0.002 0.110 0.570 0.560 BMI < 25.0 kg/m2 1.48 (1.44, 1.52) 1.29 (1.26, 1.32) 1.05 (1.04, 1.06) 5.88 (5.35, 6.47) 1.01 (1.00, 1.02) 1.04 (1.04, 1.05) 1.02 (1.00, 1.04) ≥ 25.0 kg/m2 1.51 (1.44, 1.58) 1.31 (1.26, 1.37) 1.06 (1.04, 1.08) 5.93 (5.06, 6.96) 1.01 (0.99, 1.03) 1.05 (1.04, 1.05) 1.01 (0.98, 1.04) P for differencea 0.140 0.280 0.820 0.040 0.950 0.520 0.600 Physical activity Not daily 1.48 (1.43, 1.53) 1.25 (1.21, 1.29) 1.04 (1.03, 1.06) 5.14 (4.57, 5.79) 1.01 (1.00, 1.02) 1.04 (1.04, 1.04) 0.99 (0.97, 1.02) Daily 1.51 (1.45, 1.56) 1.34 (1.31, 1.39) 1.06 (1.05, 1.08) 6.70 (6.00, 7.49) 1.01 (1.00, 1.02) 1.05 (1.04, 1.05) 1.03 (1.01, 1.05) P for differencea 0.003 < 0.001 < 0.001 0.004 0.040 < 0.001 0.010 Smoking Never 1.48 (1.44, 1.52) 1.30 (1.27, 1.33) 1.05 (1.04, 1.06) 6.02 (5.50, 6.59) 1.01 (1.00, 1.02) 1.05 (1.04, 1.05) 1.01 (1.00, 1.03) Quit or current 1.54 (1.45, 1.63) 1.29 (1.23, 1.36) 1.06 (1.03, 1.08) 5.30 (4.38, 6.42) 1.01 (0.99, 1.03) 1.04 (1.04, 1.04) 1.03 (1.00, 1.06) P for differencea 0.455 0.544 0.910 0.147 0.700 0.009 0.911 History of hypertension No 1.49 (1.43, 1.55) 1.30 (1.26, 1.35) 1.06 (1.04, 1.07) 5.94 (5.19, 6.79) 1.00 (0.99, 1.02) 1.05 (1.04, 1.05) 1.00 (0.98, 1.03) Yes 1.49 (1.44, 1.53) 1.29 (1.25, 1.32) 1.05 (1.04, 1.06) 5.83 (5.26, 6.46) 1.01 (1.00, 1.02) 1.04 (1.04, 1.05) 1.02 (1.00, 1.04) P for differencea 0.880 0.790 0.720 0.860 0.330 0.120 0.120 History of diabetes No 1.48 (1.43, 1.52) 1.28 (1.25, 1.32) 1.05 (1.03, 1.06) 5.53 (5.01, 6.10) 1.00 (0.99, 1.01) 1.05 (1.04, 1.05) 1.02 (1.00, 1.03) Yes 1.51 (1.44, 1.57) 1.32 (1.27, 1.37) 1.06 (1.04, 1.08) 6.72 (5.81, 7.77) 1.02 (1.00, 1.03) 1.04 (1.04, 1.05) 1.01 (0.99, 1.04) P for differencea 0.440 0.260 0.180 0.040 0.060 0.230 0.970 Note. Adjusted for age, sex, race, education, marital status, BMI, physical activity, smoking, drinking, hypertension, and diabetes. aP for difference was compared with another stratified group. BMI, body mass index; PM1, particulate matter with an aerodynamic diameter ≤ 1 μm; PM2.5, particulate matter with an aerodynamic diameter ≤ 2.5 μm; PM10, particulate matter with an aerodynamic diameter ≤ 10 μm; SO2, sulfur dioxide; NO2, nitrogen dioxide; CO, carbon monoxide; O3, ozone; OR, odds ratio; CI, confidence interval. Table S4. Adjusted ORs and 95% CIs for per 1 µg/m3 increase in 3-year exposure to ambient air pollution with risk of cancer mortality in stratified analyses
Subgroup OR (95% CI) PM1 PM2.5 PM10 SO2 NO2 CO O3 Sex Male 1.45 (1.38, 1.53) 1.31 (1.25, 1.37) 1.04 (1.02, 1.07) 6.36 (5.37, 7.54) 1.01 (1.00, 1.03) 1.05 (1.04, 1.05) 1.01 (0.98, 1.04) Female 1.47 (1.37, 1.56) 1.30 (1.23, 1.38) 1.04 (1.01, 1.07) 6.35 (5.11, 7.89) 1.01 (0.99, 1.03) 1.04 (1.04, 1.05) 0.99 (0.95, 1.02) P for differencea 0.960 0.640 0.550 0.990 0.750 0.410 0.250 Age < 75 years 1.45 (1.37, 1.53) 1.28 (1.22, 1.34) 1.04 (1.01, 1.06) 6.45 (5.40, 7.69) 1.01 (0.99, 1.03) 1.04 (1.04, 1.05) 1.00 (0.97, 1.03) ≥ 75 years 1.45 (1.37, 1.54) 1.33 (1.26, 1.40) 1.04 (1.01, 1.07) 6.18 (5.03, 7.59) 1.01 (0.99, 1.03) 1.04 (1.04, 1.05) 0.99 (0.96, 1.03) P for differencea 0.260 0.950 0.550 0.290 0.810 0.910 0.340 BMI < 25.0 kg/m2 1.45 (1.38, 1.52) 1.30 (1.25, 1.35) 1.03 (1.01, 1.05) 6.46 (5.53, 7.55) 1.01 (1.00, 1.03) 1.05 (1.04, 1.05) 0.99 (0.97, 1.02) ≥ 25.0 kg/m2 1.48 (1.37, 1.59) 1.32 (1.24, 1.42) 1.06 (1.03, 1.10) 6.11 (4.72, 7.91) 1.01 (0.99, 1.04) 1.04 (1.04, 1.05) 1.02 (0.97, 1.07) P for differencea 0.350 0.680 0.580 0.770 0.990 0.260 0.480 Physical activity Not daily 1.42 (1.34, 1.52) 1.25 (1.19, 1.32) 1.02 (1.00, 1.05) 5.73 (4.61, 7.11) 1.02 (1.00, 1.04) 1.04 (1.04, 1.05) 0.97 (0.93, 1.01) Daily 1.47 (1.40, 1.55) 1.34 (1.28, 1.40) 1.05 (1.03, 1.07) 6.72 (5.67, 7.97) 1.01 (0.99, 1.03) 1.05 (1.04, 1.05) 1.02 (0.99, 1.05) P for differencea 0.150 0.004 0.110 0.290 0.020 0.001 0.080 Smoking Never 1.43 (1.37, 1.50) 1.30 (1.25, 1.36) 1.04 (1.02, 1.06) 6.59 (5.67, 7.67) 1.01 (0.99, 1.02) 1.05 (1.04, 1.05) 0.99 (0.96, 1.02) Quit or current 1.56 (1.42, 1.70) 1.31 (1.21, 1.41) 1.04 (1.00, 1.08) 5.57 (4.19, 7.40) 1.02 (0.99, 1.05) 1.04 (1.04, 1.05) 1.04 (0.99, 1.08) P for differencea 0.183 0.785 0.578 0.228 0.569 0.177 0.089 History of hypertension No 1.45 (1.36, 1.54) 1.30 (1.23, 1.37) 1.05 (1.02, 1.08) 5.85 (4.79, 7.15) 1.00 (0.98, 1.02) 1.04 (1.04, 1.05) 1.00 (0.96, 1.03) Yes 1.46 (1.38, 1.54) 1.30 (1.25, 1.37) 1.03 (1.01, 1.06) 6.76 (5.65, 8.09) 1.02 (1.01, 1.04) 1.05 (1.04, 1.05) 1.00 (0.97, 1.04) P for differencea 0.920 0.940 0.330 0.410 0.070 0.900 0.620 History of diabetes No 1.45 (1.38, 1.52) 1.29 (1.24, 1.34) 1.04 (1.02, 1.06) 5.99 (5.13, 6.99) 1.01 (0.99, 1.02) 1.04 (1.04, 1.05) 1.00 (0.98, 1.03) Yes 1.47 (1.36, 1.59) 1.35 (1.26, 1.44) 1.04 (1.01, 1.08) 7.57 (5.81, 9.87) 1.03 (1.00, 1.06) 1.05 (1.04, 1.05) 1.00 (0.95, 1.04) P for differencea 0.940 0.360 0.850 0.200 0.100 0.840 0.560 Note. Adjusted for age, sex, race, education, marital status, BMI, physical activity, smoking, drinking, hypertension, and diabetes. aP for difference was compared with another stratified group. BMI, body mass index; PM1, particulate matter with an aerodynamic diameter ≤ 1 μm; PM2.5, particulate matter with an aerodynamic diameter ≤ 2.5 μm; PM10, particulate matter with an aerodynamic diameter ≤ 10 μm; SO2, sulfur dioxide; NO2, nitrogen dioxide; CO, carbon monoxide; O3, ozone; OR, odds ratio; CI, confidence interval. Table S5. Adjusted ORs and 95% CIs for per 1 µg/m3 increase in 3-year exposure to ambient air pollution with risk of cardiovascular mortality in stratified analyses
Subgroup OR (95% CI) PM1 PM2.5 PM10 SO2 NO2 CO O3 Sex Male 1.49 (1.42, 1.57) 1.34 (1.28, 1.40) 1.05 (1.03, 1.07) 5.34 (4.48, 6.36) 1.02 (1.01, 1.04) 1.04 (1.04, 1.05) 1.02 (0.99, 1.05) Female 1.45 (1.37, 1.53) 1.26 (1.20, 1.33) 1.04 (1.02, 1.06) 5.43 (4.49, 6.57) 1.00 (0.98, 1.02) 1.04 (1.04, 1.05) 1.01 (0.97, 1.04) P for differencea 0.560 0.090 0.610 0.810 0.070 0.230 0.580 Age < 75 years 1.54 (1.44, 1.64) 1.30 (1.23, 1.37) 1.04 (1.02, 1.07) 5.89 (4.78, 7.25) 1.01 (1.00, 1.03) 1.04 (1.04, 1.05) 1.04 (1.00, 1.07) ≥ 75 years 1.42 (1.36, 1.49) 1.28 (1.23, 1.34) 1.04 (1.02, 1.06) 4.93 (4.19, 5.80) 1.00 (0.99, 1.02) 1.04 (1.04, 1.04) 1.00 (0.97, 1.03) P for differencea 0.030 0.260 0.450 0.010 0.180 0.220 0.210 BMI < 25.0 kg/m2 1.44 (1.38, 1.51) 1.29 (1.24, 1.34) 1.04 (1.02, 1.06) 4.92 (4.23, 5.72) 1.01 (1.00, 1.02) 1.04 (1.04, 1.05) 1.02 (1.00, 1.05) ≥ 25.0 kg/m2 1.55 (1.44, 1.67) 1.33 (1.25, 1.42) 1.06 (1.03, 1.09) 6.66 (5.21, 8.51) 1.02 (0.99, 1.04) 1.05 (1.04, 1.05) 1.00 (0.96, 1.04) P for differencea 0.610 0.900 0.930 0.050 0.990 0.250 0.290 Physical activity Not daily 1.44 (1.37, 1.52) 1.25 (1.20, 1.31) 1.04 (1.02, 1.06) 4.35 (3.64, 5.19) 1.01 (0.99, 1.03) 1.04 (1.04, 1.04) 0.99 (0.96, 1.02) Daily 1.52 (1.44, 1.61) 1.38 (1.31, 1.45) 1.06 (1.03, 1.08) 6.82 (5.66, 8.21) 1.02 (1.00, 1.04) 1.05 (1.04, 1.05) 1.04 (1.01, 1.07) P for differencea 0.110 0.001 0.030 0.003 0.650 0.030 0.080 Smoking Never 1.47 (1.41, 1.53) 1.30 (1.25, 1.35) 1.04 (1.02, 1.06) 5.49 (4.77, 6.31) 1.01 (1.00, 1.02) 1.04 (1.04, 1.05) 1.02 (0.99, 1.04) Quit or current 1.49 (1.35, 1.65) 1.32 (1.21, 1.43) 1.06 (1.02, 1.10) 4.68 (3.38, 6.47) 1.02 (0.99, 1.05) 1.04 (1.03, 1.05) 1.01 (0.96, 1.06) P for differencea 0.926 0.919 0.669 0.248 0.742 0.160 0.440 History of hypertension No 1.46 (1.36, 1.57) 1.31 (1.23, 1.40) 1.05 (1.02, 1.09) 5.81 (4.58, 7.37) 1.02 (1.00, 1.05) 1.05 (1.04, 1.05) 0.99 (0.95, 1.04) Yes 1.48 (1.41, 1.54) 1.30 (1.25, 1.35) 1.04 (1.02, 1.06) 5.17 (4.44, 6.02) 1.01 (0.99, 1.02) 1.04 (1.04, 1.04) 1.03 (1.00, 1.05) P for differencea 0.980 0.730 0.500 0.380 0.410 0.020 0.310 History of diabetes No 1.47 (1.41, 1.55) 1.30 (1.25, 1.36) 1.04 (1.02, 1.06) 4.89 (4.17, 5.73) 1.01 (0.99, 1.02) 1.05 (1.04, 1.05) 1.03 (1.00, 1.06) Yes 1.47 (1.38, 1.56) 1.30 (1.22, 1.37) 1.05 (1.03, 1.08) 6.29 (5.05, 7.83) 1.02 (1.00, 1.04) 1.04 (1.03, 1.04) 0.99 (0.95, 1.03) P for differencea 0.690 0.650 0.640 0.110 0.340 0.030 0.120 Note. Adjusted for age, sex, race, education, marital status, BMI, physical activity, smoking, drinking, hypertension, and diabetes. aP for difference was compared with another stratified group. BMI, body mass index; PM1, particulate matter with an aerodynamic diameter ≤ 1 μm; PM2.5, particulate matter with an aerodynamic diameter ≤ 2.5 μm; PM10, particulate matter with an aerodynamic diameter ≤ 10 μm; SO2, sulfur dioxide; NO2, nitrogen dioxide; CO, carbon monoxide; O3, ozone; OR, odds ratio; CI, confidence interval. Table S8. Adjusted ORs and 95% CIs of non-accidental mortality associated with per 1 µg/m3 increase of 3-year exposure to ambient air pollution estimated by single- and 2-pollutant models
Air pollutant Model OR (95% CI) P for difference PM1 Single 1.49 (1.45, 1.52) And SO2 1.18 (1.15, 1.21) < 0.001 And NO2 2.31 (2.24, 2.39) < 0.001 And CO 1.18 (1.14, 1.22) < 0.001 And O3 1.60 (1.56, 1.64) < 0.001 PM2.5 Single 1.29 (1.27, 1.32) And SO2 1.09 (1.06, 1.11) < 0.001 And NO2 2.41 (2.33, 2.50) < 0.001 And CO 0.92 (0.89, 0.95) < 0.001 And O3 1.40 (1.37, 1.44) < 0.001 PM10 Single 1.05 (1.04, 1.06) And SO2 0.96 (0.95, 0.97) < 0.001 And NO2 1.26 (1.24, 1.29) < 0.001 And CO 0.75 (0.74, 0.77) < 0.001 And O3 1.07 (1.06, 1.08) < 0.001 SO2 Single 5.87 (5.42, 6.37) And PM1 3.11 (2.80, 3.45) < 0.001 And PM2.5 3.51 (3.17, 3.89) < 0.001 And PM10 6.02 (5.53, 6.56) 0.081 And NO2 8.65 (7.95, 9.42) < 0.001 And CO 2.44 (2.18, 2.73) < 0.001 And O3 6.98 (6.41, 7.60) < 0.001 NO2 Single 1.01 (1.00, 1.01) And PM1 0.77 (0.77, 0.78) < 0.001 And PM2.5 0.64 (0.63, 0.65) < 0.001 And PM10 0.81 (0.80, 0.82) < 0.001 And SO2 0.88 (0.87, 0.89) < 0.001 And CO 0.83 (0.82, 0.84) < 0.001 And O3 1.01 (1.00, 1.01) < 0.001 CO Single 1.04 (1.04, 1.05) And PM1 1.03 (1.03, 1.03) < 0.001 And PM2.5 1.03 (1.03, 1.03) < 0.001 And PM10 1.07 (1.07, 1.08) < 0.001 And SO2 1.02 (1.02, 1.03) < 0.001 And NO2 1.06 (1.06, 1.06) < 0.001 And O3 1.10 (1.10, 1.10) < 0.001 O3 Single 1.02 (1.00, 1.03) And PM1 0.88 (0.87, 0.89) < 0.001 And PM2.5 0.85 (0.84, 0.86) < 0.001 And PM10 0.95 (0.94, 0.97) < 0.001 And SO2 0.94 (0.93, 0.95) < 0.001 And NO2 1.02 (1.01, 1.03) < 0.001 And CO 0.60 (0.58, 0.61) < 0.001 Note. Adjusted for age, sex, race, education, marital status, BMI, physical activity, smoking, drinking, hypertension, and diabetes. PM1, particulate matter with an aerodynamic diameter ≤ 1 μm; PM2.5, particulate matter with an aerodynamic diameter ≤ 2.5 μm; PM10, particulate matter with an aerodynamic diameter ≤ 10 μm; SO2, sulfur dioxide; NO2, nitrogen dioxide; CO, carbon monoxide; O3, ozone; OR, odds ratio; CI, confidence interval. Table S9. Adjusted ORs and 95% CIs of cancer mortality associated with per 1 µg/m3 increase of 3-year exposure to ambient air pollution estimated by single- and 2-pollutant models
Air pollutant Model OR (95% CI) P for difference PM1 Single 1.46 (1.40, 1.52) And SO2 1.12 (1.08, 1.17) < 0.001 And NO2 2.25 (2.12, 2.38) < 0.001 And CO 1.10 (1.03, 1.16) < 0.001 And O3 1.57 (1.50, 1.64) < 0.001 PM2.5 Single 1.30 (1.26, 1.35) And SO2 1.08 (1.05, 1.12) < 0.001 And NO2 2.45 (2.30, 2.60) < 0.001 And CO 0.90 (0.86, 0.95) < 0.001 And O3 1.42 (1.37, 1.48) < 0.001 PM10 Single 1.04 (1.02, 1.06) And SO2 0.95 (0.94, 0.97) < 0.001 And NO2 1.23 (1.20, 1.27) < 0.001 And CO 0.70 (0.68, 0.73) < 0.001 And O3 1.06 (1.04, 1.08) < 0.001 SO2 Single 6.34 (5.55, 7.25) And PM1 3.54 (2.99, 4.19) < 0.001 And PM2.5 3.91 (3.31, 4.61) < 0.001 And PM10 6.54 (5.70, 7.51) 0.124 And NO2 9.03 (7.88, 10.36) < 0.001 And CO 2.67 (2.21, 3.21) < 0.001 And O3 7.77 (6.75, 8.94) < 0.001 NO2 Single 1.01 (1.00, 1.02) And PM1 0.76 (0.75, 0.78) < 0.001 And PM2.5 0.62 (0.60, 0.64) < 0.001 And PM10 0.82 (0.80, 0.84) < 0.001 And SO2 0.88 (0.87, 0.89) < 0.001 And CO 0.82 (0.80, 0.83) < 0.001 And O3 1.01 (1.00, 1.02) < 0.001 CO Single 1.04 (1.04, 1.05) And PM1 1.03 (1.03, 1.03) < 0.001 And PM2.5 1.03 (1.03, 1.04) < 0.001 And PM10 1.08 (1.08, 1.09) < 0.001 And SO2 1.02 (1.02, 1.03) < 0.001 And NO2 1.06 (1.06, 1.07) < 0.001 And O3 1.12 (1.11, 1.12) < 0.001 O3 Single 1.00 (0.98, 1.02) And PM1 0.85 (0.83, 0.87) < 0.001 And PM2.5 0.82 (0.81, 0.84) < 0.001 And PM10 0.94 (0.92, 0.96) < 0.001 And SO2 0.93 (0.91, 0.94) < 0.001 And NO2 1.01 (0.99, 1.03) < 0.001 And CO 0.52 (0.50, 0.54) < 0.001 Note. Adjusted for age, sex, race, education, marital status, BMI, physical activity, smoking, drinking, hypertension, and diabetes. PM1, particulate matter with an aerodynamic diameter ≤ 1 μm; PM2.5, particulate matter with an aerodynamic diameter ≤ 2.5 μm; PM10, particulate matter with an aerodynamic diameter ≤ 10 μm; SO2, sulfur dioxide; NO2, nitrogen dioxide; CO, carbon monoxide; O3, ozone; OR, odds ratio; CI, confidence interval.
全文HTML
Study Area
Study Population
Outcomes
Exposure Assessment
Covariates
Statistical Analysis
 24020+.pdf
|

|

 Quick Links