

 下载:
下载:


-
At present, more than 300 million patients globally undergo surgical treatments every year. Among these, approximately 85% are non-cardiac surgeries. Notably, within 30 days post-surgery, there are about 1.8 million deaths, with 42% of postoperative deaths resulting from cardiovascular events[1]. Elderly patients are at a higher risk of postoperative cardiovascular complications due to physiological decline, pre-existing chronic diseases, and other associated factors[2]. Studies have indicated that, compared to younger patients, the elderly experience a higher incidence of postoperative arrhythmias[3]. Among these, atrial fibrillation is the most frequently observed postoperative arrhythmia[4]. Additionally, myocardial ischemia and myocardial infarction are common postoperative complications in the elderly population[5].
Postoperative circulatory complications (PCCs) refer to any significant cardiovascular disturbances that occur post-surgery, potentially compromising circulatory stability. These complications typically encompass a range of conditions including acute myocardial infarction, cardiac arrhythmias, severe hypotension requiring intervention, heart failure, and cardiac arrest[6]. A salient risk factor identified in literature is age, with it being substantially linked to postoperative mortality. As age advances, the susceptibility to cardiovascular complications amplifies[7], which can be attributed to physiological alterations in the elderly, underlying chronic ailments, and other age-associated health issues. Pre-existing comorbidities in patients, such as cardiovascular disease, hypertension, and diabetes, may exacerbate the risk of PCCs[4]. Laboratory findings, including markers like N-terminal pro-B type natriuretic peptide (NT-proBNP)[8], troponin[9] and neutrophil to lymphocyte ratio (NLR)[10] can also have implications for the incidence of PCCs post-surgery. Anesthetic agents used during anesthesia[11] and hemodynamic indices in patients[12] may further modulate the rate of postoperative complications. Furthermore, research has underscored postoperative pain as a pivotal determinant in the onset of PCCs[13]. Postoperative cardiovascular complications, encompassing myocardial infarction, heart failure, and arrhythmias, have been observed not only to elevate mortality rates in elderly patients[14], but also to prolong hospitalization durations[15], escalate healthcare expenditures[16], and detrimentally impact patient quality of life[14].
Before now, several scales were available to evaluate a patient’s preoperative cardiac function[6, 17-20]. Despite the outstanding predictive capabilities of these tools, they have limitations such as a small sample size for internal validation, lack of external validation, and retrospective study design. With the growth of medical data and increased computational power, several machine learning algorithms have been shown to be highly accurate and reliable in the medical field[21]. Oh et al.[22] established a machine learning model for predicting postoperative myocardial injury utilizing perioperative data from 6,811 non-cardiac surgery patients. Comprising 12 predictive variables, the model exhibited an AUC (Area Under the Curve) of 0.78. Similarly, Shin et al.[23] developed a machine learning model based on perioperative data from 7,629 non-cardiac surgery patients with myocardial injury, aimed at forecasting 30-day postoperative mortality, yielding an AUC of 0.923. Beyond its efficacy in predicting mortality, this model also offers interpretability concerning its predictive variables, allowing for individualized adjustments in patient parameters to enhance prognostic outcomes. Weng et al. utilized machine learning models to predict adverse outcomes after cardiovascular surgery and found them to be more accurate than traditional risk scores[24]. Moreover, Goldstein et al. also explored various machine learning techniques in predicting post-cardiac surgery complications, showcasing their unique advantages when dealing with high-dimensional and complex data sets[25].
With the advancement of technology, it is anticipated that machine learning and deep learning techniques will play an increasingly significant role in predicting and managing postoperative cardiovascular complications. However, there is limited research on the application of machine learning to predict cardiovascular complications following non-cardiac surgery in elderly patients. This research employs machine learning algorithms to identify crucial variables and forecast cardiovascular complications in older patients post-surgery, serving as a reference for clinical practitioners.
-
The inclusion criteria comprised of patients aged between 60 and 90 years who underwent major non-cardiac thoracoabdominal surgery lasting at least 2 hours[26,27] and consented to use patient-controlled analgesia postoperatively. Eligibility was also extended to patients expected to have an incision length of 5 cm or more for either thoracoscopy or laparoscopy. Exclusion criteria were strict, disqualifying patients who had severe neurological diseases in the past three months, recent acute myocardial infarction or stroke, any contraindications to epidural anesthesia, severe cardiac dysfunction, significant hepatic impairment, or renal failure.
-
We have identified and analyzed potential determinants of postoperative cardiovascular complications. These include demographic parameters (patient age and gender), pre-existing comorbidities, comprehensive laboratory test outcomes, and intraoperative variables encompassing the categories and dosages of anesthetics administered, total volume of fluids infused, as well as monitoring of intraoperative hemodynamic parameters. Subsequent to the surgical procedure, we employed validated scoring systems during follow-up assessments to systematically evaluate the patients' postoperative condition.
-
In this investigation, a comprehensive evaluation of 67 candidate variables was performed. These encompassed baseline demographic data such as age and sex; preoperative comorbid conditions; results from preoperative laboratory diagnostics; details of intraoperative management including anesthetic agents, volume of intravenous fluids, and circulatory status parameters; and types of anesthesia [specifically, the groups receiving solely general anesthesia plus Patient-Controlled Intravenous Analgesia (PCIA) and those with general anesthesia in conjunction with epidural anesthesia plus Patient-Controlled Epidural Analgesia (PCEA)]. Additionally, we assessed postoperative pain with the rest and movement Visual Analogue Scale scores (VAS-Rest and VAS-Move, respectively) on 1 to 3 days after surgery, as well as the highest Acute Physiology and Chronic Health Evaluation II (APACHE II) scores recorded during the postoperative period. During the treatment study, follow-up evaluations were conducted by trained researchers authorized by our team but blind to the groups. On the day of surgery (Day 0), details information concerning the surgery, anesthesia, and immediate complications such as severe hypotension and postoperative nausea were meticulously documented. From postoperative days 1 to 7, daily assessments included the APACHE II score within the first 24 hours, delirium evaluations using the CAM-ICU method, VAS scores of pain, and serum concentrations of cortisol, IL-6, and IL-8. Parameters and issues related to the postoperative analgesia pump were also recorded, along with any other surgical complications. From Day 8 until discharge, any persisting complications and adverse events were noted. A follow-up call on Day 30 post-surgery records the patient’s status, noting survival or mortality along with all causes of death where applicable.
-
The principal endpoint of this investigation is the incidence of postoperative cardiovascular complications. This encompasses a spectrum of conditions such as arrhythmias, hemodynamic instability, acute coronary syndromes, and episodes of cardiac arrest, the occurrence of any one of these diagnoses in a patient post-surgery is considered an incidence of postoperative cardiovascular complications. The measurement of these outcomes will be quantified as binary variables.
-
Statistical processing is performed using R for univariate analysis. Quantitative data conforming to normal distribution are expressed as mean ± standard deviation (x̄ ± s); non-normally distributed quantitative data are expressed as median (interquartile range); count data are expressed as frequency or percentage [n (%)]; if the percentage of missing values is greater than 20%, they will be excluded from the final completed dataset. If the ratio of missing values is less than 20%, the missForest package is utilized for interpolation. The Boruta algorithm[28] is applied to screen feature variables from univariate analyses with statistical significance (P < 0.05). Upon standardization of the data, logistic regression (LR), K-Nearest Neighbor algorithm (KNN), Decision Tree (CART), Extreme Gradient Boosting (Xgboost), and Random Forest (RF) models were established using repeated cross-validation and hyperparameter optimization. To tune the model, the function used in combination with mlr3 was tune. This involved hyperparameter tuning, where one selected and configured the learner and the hyperparameters that need tuning. The search space and the optimization algorithm (random search) were defined. The evaluation method (repeated cross-validation) and performance metric (AUC) were specified. Termination criteria were also established. After selecting the optimal model, parameters of confusion matrix were calculated, and Receiver Operating Characteristic curve (ROC), Precision Recall Curve (PRC), Calibration Curve, Decision Curve Analysis (DCA), Importance Ranking Diagram of Feature Variables, Partial Dependence Graph (PDG), and Break Down Profile (BDP) were plotted.
For the dichotomous prediction model, the pmsampsize function of R Studio was applied in this paper[29], given the adjusted maximum R2: 0.236; 20 parameters of the independent variables to be included; and the incidence of postoperative PCCs: 0.03, which was calculated to result in a final sample size of 1,474, which is less than the final sample size of 1,720 that was included in this study.
-
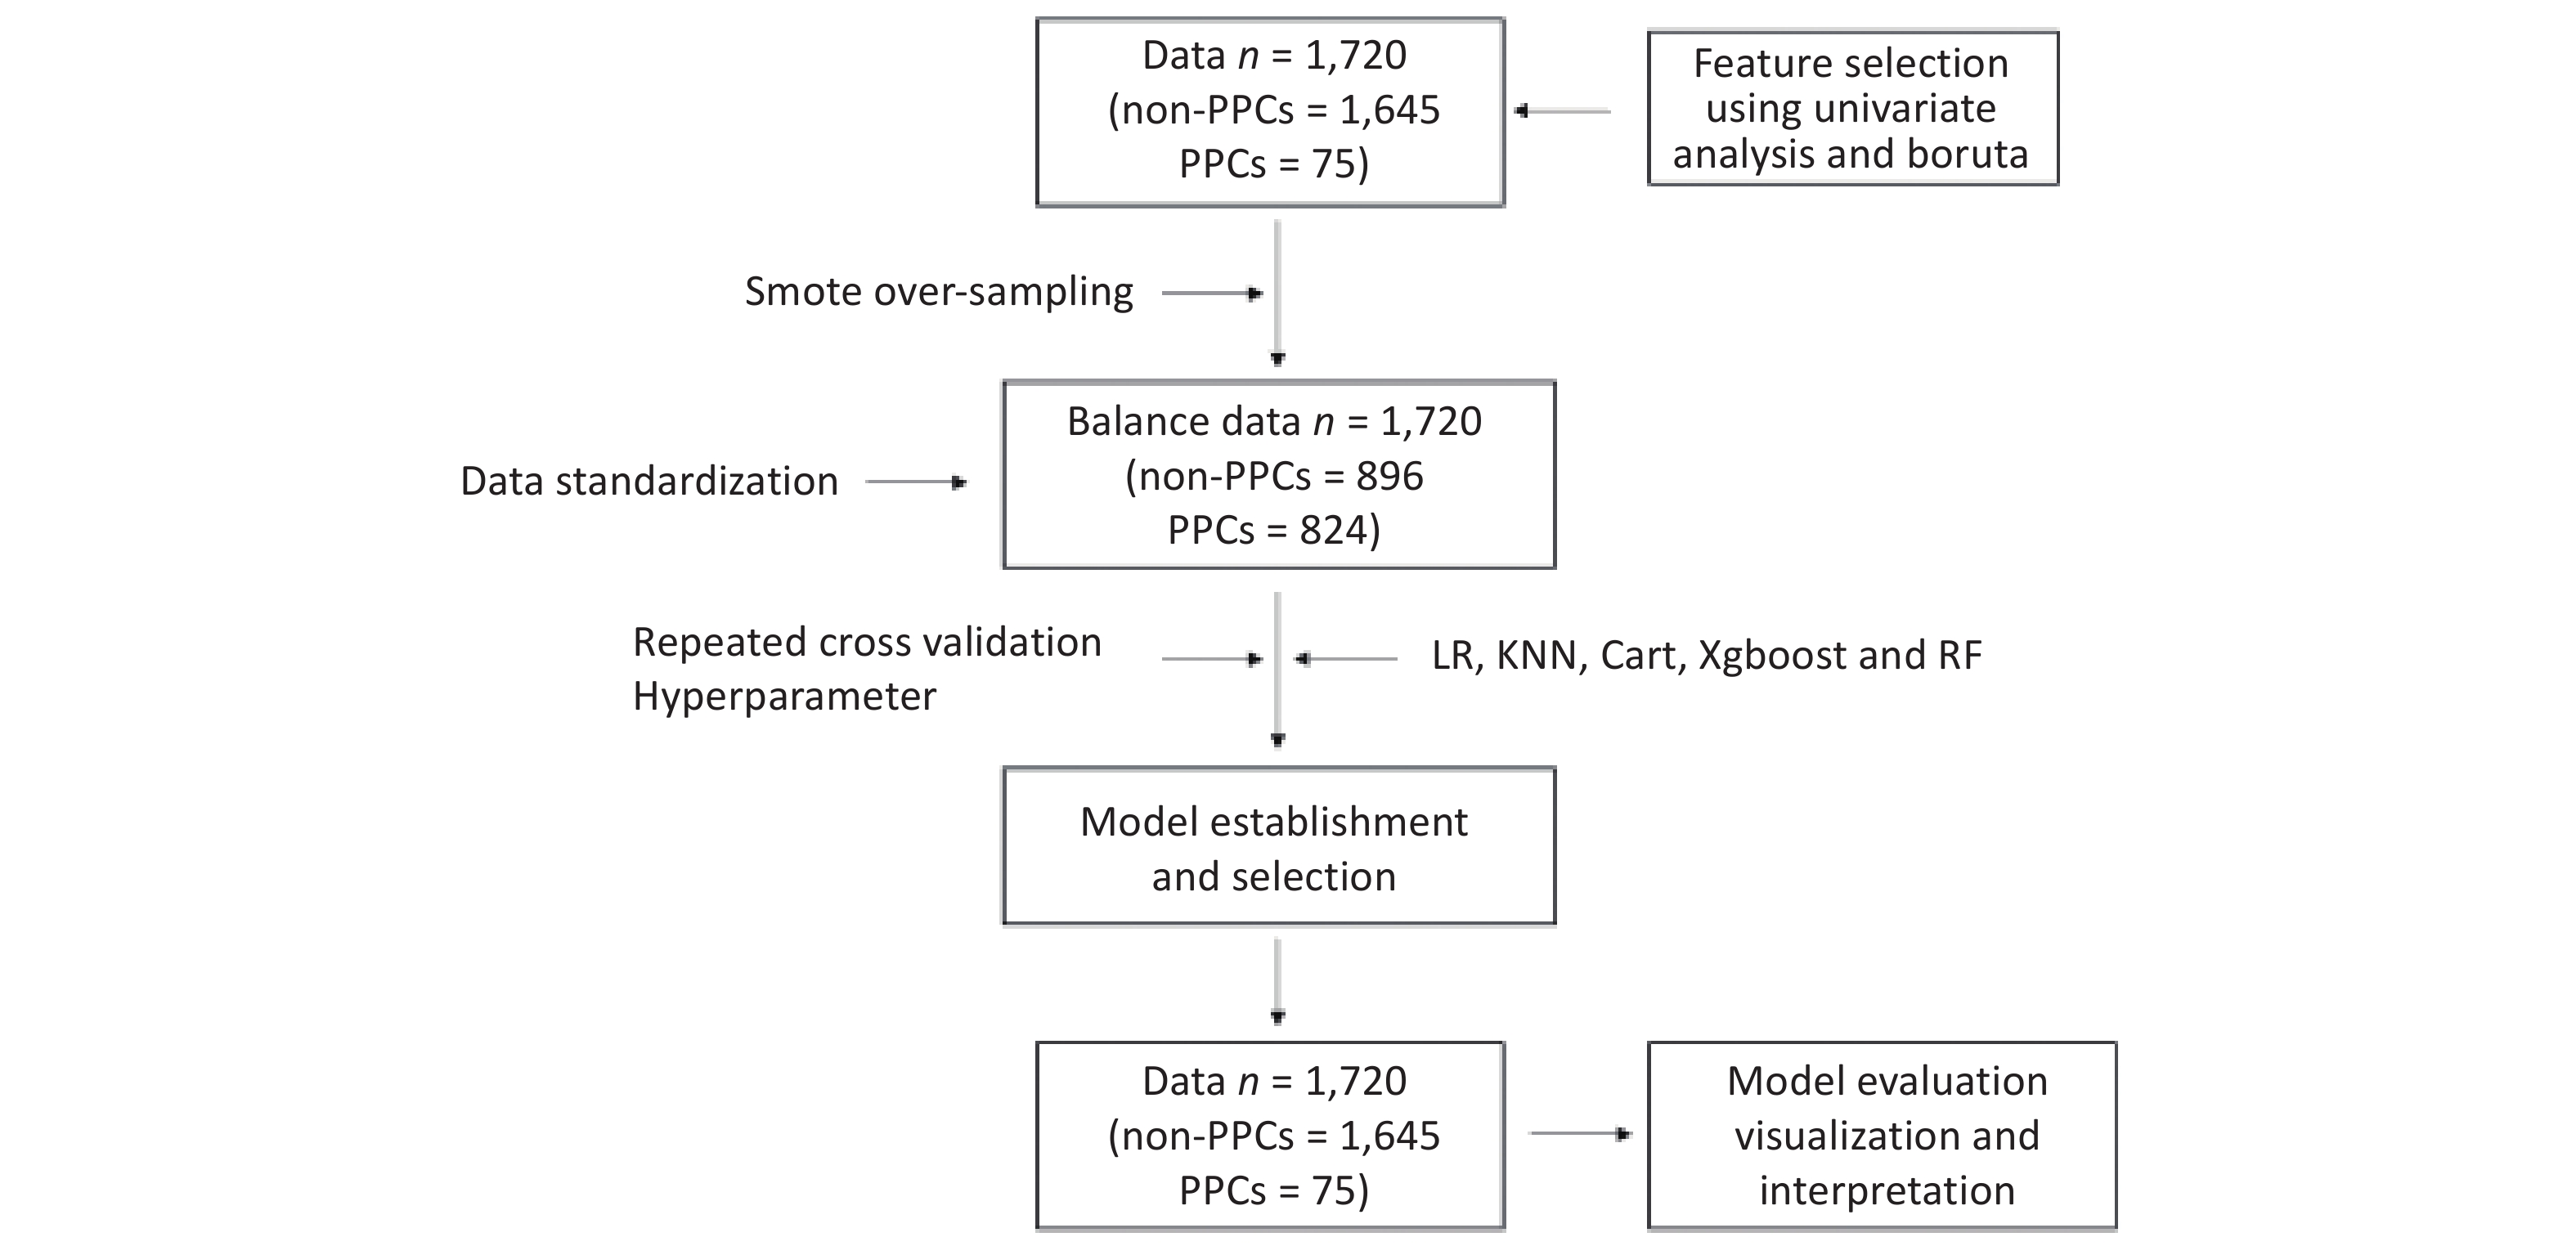
This study’s dataset involved 1,720 patients, from which we identified 67 relevant variables. Of these patients, 75 (4.36%) experienced postoperative pulmonary complications (PPCs). Our univariate analysis differentiated between patients with and without PPCs, highlighting statistically significant variables. Key differences were observed in patient age, Charlson Comorbidity Index, serum albumin and Blood Urea Nitrogen (BUN) levels, intraoperative parameters (such as anesthetic dosages, fluid volumes, and estimated blood loss), maximum heart rate during surgery, anesthesia and surgical durations, perioperative morphine equivalents, and ICU stay duration. Additionally, the analysis included postoperative factors like APACHE-II scores and Visual Analogue Scale scores for rest and movement pain. Other significant variables comprised smoking history, prevalence of coronary artery disease and hypertension, NYHA functional classification, and atropine usage. A detailed breakdown of these variables is presented in Table 1. The methodology for data inclusion, model development, and evaluation is depicted in Figure 1.
Table 1. Baseline characteristics of patients
Factor Non-PCCs PCCs P-value N 1,645 75 Age (years) 69.00 [64.00, 74.00] 71.00 [66.50, 76.50] 0.035* Education (years) 9.00 [6.00, 13.00] 9.00 [5.00, 14.00] 0.990 BMI (kg/m2) 23.53 [21.45, 25.81] 24.22 [21.21, 26.07] 0.414 MMSE score 29.00 [27.00, 30.00] 29.00 [27.00, 30.00] 0.293 Anxiety score 0.00 [0.00, 2.00] 0.00 [0.00, 2.00] 0.293 Depression score 0.00 [0.00, 2.00] 0.00 [0.00, 2.00] 0.440 CHARLSON score 92.00 [50.00, 121.00] 120.00 [75.06, 151.32] < 0.001* Hct (%) 38.60 [35.30, 41.90] 37.70 [35.10, 40.70] 0.249 ALB (g/L) 40.70 [37.50, 43.10] 38.30 [36.00, 42.70] 0.011* GLU (mmol/L) 5.38 [4.86, 6.13] 5.56 [5.06, 6.36] 0.059 Serum Na (mmol/L) 141.90 [140.00, 143.00] 141.70 [140.00, 142.90] 0.536 Serum K (mmol/L) 4.02 [3.75, 4.29] 4.04 [3.66, 4.48] 0.462 CREA (μmol/L) 86.00 [75.00, 98.00] 88.00 [77.00, 102.50] 0.284 BUN (mmol/L) 5.60 [4.60, 6.79] 5.89 [4.91, 7.35] 0.047* BUN/CREA 16.06 [13.26, 19.48] 17.21 [13.85, 19.54] 0.208 Nitrousoxide (%) 1.00 [0.00, 2.00] 1.00 [0.00, 1.00] 0.002* Sevoflurance (%) 0.50 [0.00, 1.00] 0.80 [0.00, 1.00] 0.366 Midazolam (mg) 1.50 [1.00, 2.00] 2.00 [1.50, 2.00] 0.020* Lidocaine (mg) 0.00 [0.00, 60.00] 0.00 [0.00, 60.00] 0.980 Ropivacaine (mg) 0.00 [0.00, 85.00] 0.00 [0.00, 102.50] 0.856 Crystalloid (mL) 1,850.00 [1,600.00, 2,550.00] 2,200.00 [1,600.00, 3,100.00] 0.003* Colloidal (mL) 500.00 [500.00, 1,000.00] 700.00 [500.00, 1,500.00] 0.005* RBC (mL) 0.00 [0.00, 0.00] 0.00 [0.00, 0.00] 0.002* Plasma (mL) 0.00 [0.00, 0.00] 0.00 [0.00, 0.00] 0.001* Urine (mL) 400.00 [100.00, 600.00] 400.00 [150.00, 775.00] 0.173 Bleeding (mL) 100.00 [50.00, 300.00] 350.00 [125.00, 600.00] < 0.001* MAP (mmHg) 80.54 [75.12, 85.98] 78.67 [74.26, 85.33] 0.135 MHR (times/min) 66.38 [60.59, 73.33] 73.00 [64.75, 79.32] < 0.001* Anesthesia duration (min) 283.00 [219.82, 357.08] 364.68 [289.08, 453.47] < 0.001* Operation duration (min) 226.00 [165.00, 298.00] 309.00 [232.00, 385.50] < 0.001* Perioperative morphine (mg) 183.00 [145.00, 250.00] 212.00 [163.50, 289.10] 0.008* Postoperative morphine (mg) 54.00 [50.00, 120.00] 50.00 [50.00, 120.00] 0.331 ICU duration (min) 0.00 [0.00, 0.00] 14.28 [0.00, 52.80] < 0.001* Intubation duration (min) 0.00 [0.00, 0.00] 0.00 [0.00, 4.38] < 0.001* APACHE-II 0.00 [0.00, 0.00] 4.00 [0.00, 9.50] < 0.001* VAS-Rest-M 0.00 [0.00, 1.00] 0.50 [0.00, 2.00] 0.003* VAS-Move-M 2.00 [1.00, 3.50] 2.50 [1.75, 4.00] 0.031* VAS-Rest-Max 2.00 [0.00, 3.00] 2.00 [1.00, 3.00] 0.459 VAS-Move-Max 4.00 [2.00, 5.00] 4.00 [2.00, 6.00] 0.337 VAS-Rest-Min 0.00 [0.00, 0.00] 0.00 [0.00, 1.00] 0.002* VAS-Move-Min 1.00 [0.00, 2.00] 2.00 [0.00, 3.00] 0.024* Gender Male 1,075 (65.3) 48 (64.0) 0.908 Female 570 (34.7) 27 (36.0) ASA ASA-I 123 (7.5) 0 (0.0) 0.001* ASA-II 1,409 (85.7) 63 (84.0) ASA-III 113 (6.9) 12 (16.0) Group GEA-PCEA 823 (50.0) 40 (53.3) 0.659 GA-PCIA 822 (50.0) 35 (46.7) Stroke Yes 73 (4.4) 12 (16.0) < 0.001* No 1,572 (95.6) 63 (84.0) TIA Yes 23 (1.4) 0 (0.0) 0.605 No 1,622 (98.6) 75 (100.0) COPD Yes 31 (1.9) 1 (1.3) 1 No 1,614 (98.1) 74 (98.7) Chronic bronchitis Yes 30 (1.8) 2 (2.7) 0.927 No 1,615 (98.2) 73 (97.3) Asthma Yes 26 (1.6) 1 (1.3) 1 No 1,619 (98.4) 74 (98.7) Smoke Yes 393 (23.9) 23 (30.7) 0.229 No 1,252 (76.1) 52 (69.3) CHD Yes 153 (9.3) 13 (17.3) 0.035* No 1,492 (90.7) 62 (82.7) HT Yes 667 (40.5) 44 (58.7) 0.003* No 978 (59.5) 31 (41.3) Arrhythmia Yes 57 (3.5) 6 (8.0) 0.084 No 1,588 (96.5) 69 (92.0) NYHA I 1,250 (76.0) 49 (65.3) 0.050 II 395 (24.0) 26 (34.7) DM Yes 299 (18.2) 15 (20.0) 0.805 No 1,346 (81.8) 60 (80.0) Thyroid diseases Yes 43 (2.6) 2 (2.7) 1 No 1,602 (97.4) 73 (97.3) Liver
dysfunctionYes 14 (0.9) 1 (1.3) 1 No 1,631 (99.1) 74 (98.7) HLP Yes 42 (2.6) 4 (5.3) 0.274 No 1,603 (97.4) 71 (94.7) Renal
dysfunctionYes 6 (0.4) 1 (1.3) 0.718 No 1,639 (99.6) 74 (98.7) Drinking history Yes 403 (24.5) 23 (30.7) 0.283 No 1,242 (75.5) 52 (69.3) Atropine use Yes 1,237 (75.2) 47 (62.7) 0.021* No 408 (24.8) 28 (37.3) Anti-nausea use Yes 1,466 (89.1) 62 (82.7) 0.122 No 179 (10.9) 13 (17.3) NSAIDs use Yes 1,289 (78.4) 60 (80.0) 0.846 No 356 (21.6) 15 (20.0) Surgicalsite Yes 1,271 (77.3) 45 (60.0) 0.001* No 374 (22.7) 30 (40.0) Endoscope Yes 1,103 (67.1) 65 (86.7) 0.001* No 542 (32.9) 10 (13.3) Intraoperative
hypotensionYes 973 (59.1) 38 (50.7) 0.180 No 672 (40.9) 37 (49.3) Postoperative
hypotensionYes 1,585 (96.4) 64 (85.3) < 0.001* No 60 (3.6) 11 (14.7) Note. Values for continuous variables are presented as means with 95% confidence intervals (95% CI), binary variable values represent the number of people (percentage). P value < 0.05 is considered statistically significant and has been marked with "*". BMI, Body Mass Index; MMSE, Mini-Mental State Examination; CHARLSON, Charlson Comorbidity Index; Hct, Hematocrit; ALB, Albumin; GLU, Glucose; Na, Sodium; K, Potassium; CREA, Creatinine; BUN, Blood Urea Nitrogen; RBC, red blood cell; MAP, Mean Arterial Pressure; MHR, Maximum Heart Rate; ICU, Intensive Care Unit; APACHE-II, Acute Physiology and Chronic Health Evaluation II; VAS, Visual Analog Scale; ASA, American Society of Anesthesiologists; TIA, Transient Ischemic Attack; COPD, Chronic Obstructive Pulmonary Disease; CHD, Coronary Heart Disease; HT, Hypertension; NYHA, New York Heart Association; DM, Diabetes Mellitus; HLP, Hyperlipidemia; NSAIDs, Non-Steroidal Anti-Inflammatory Drugs. 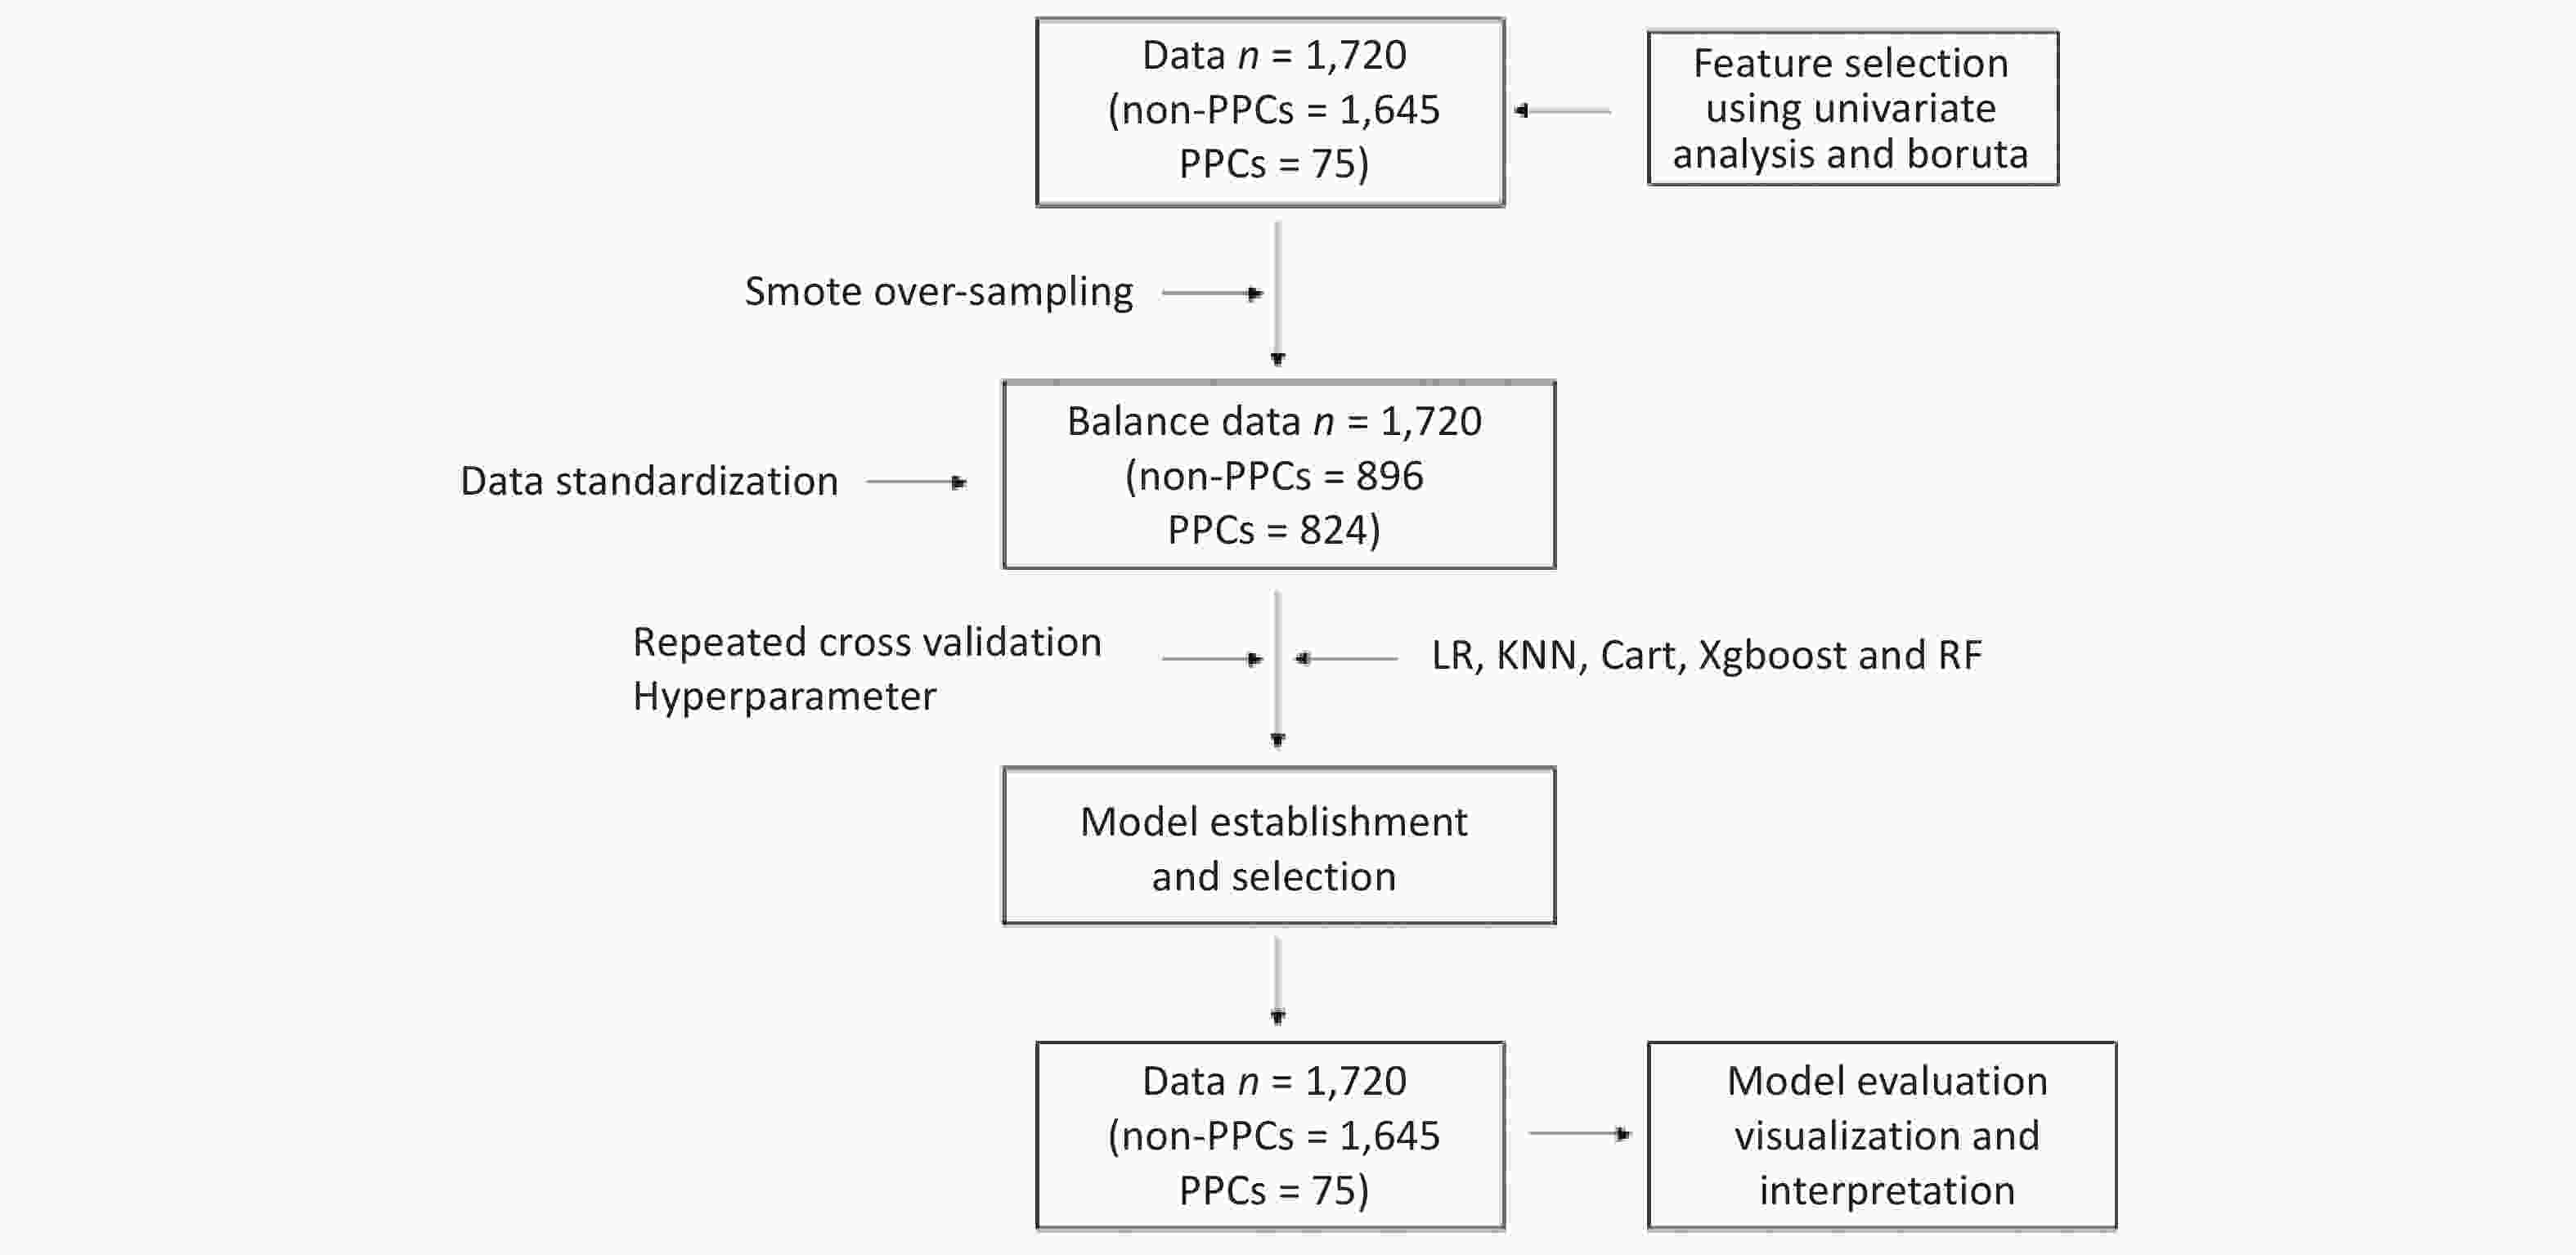
Figure 1. Clinical Data Analysis Flowchart.
-
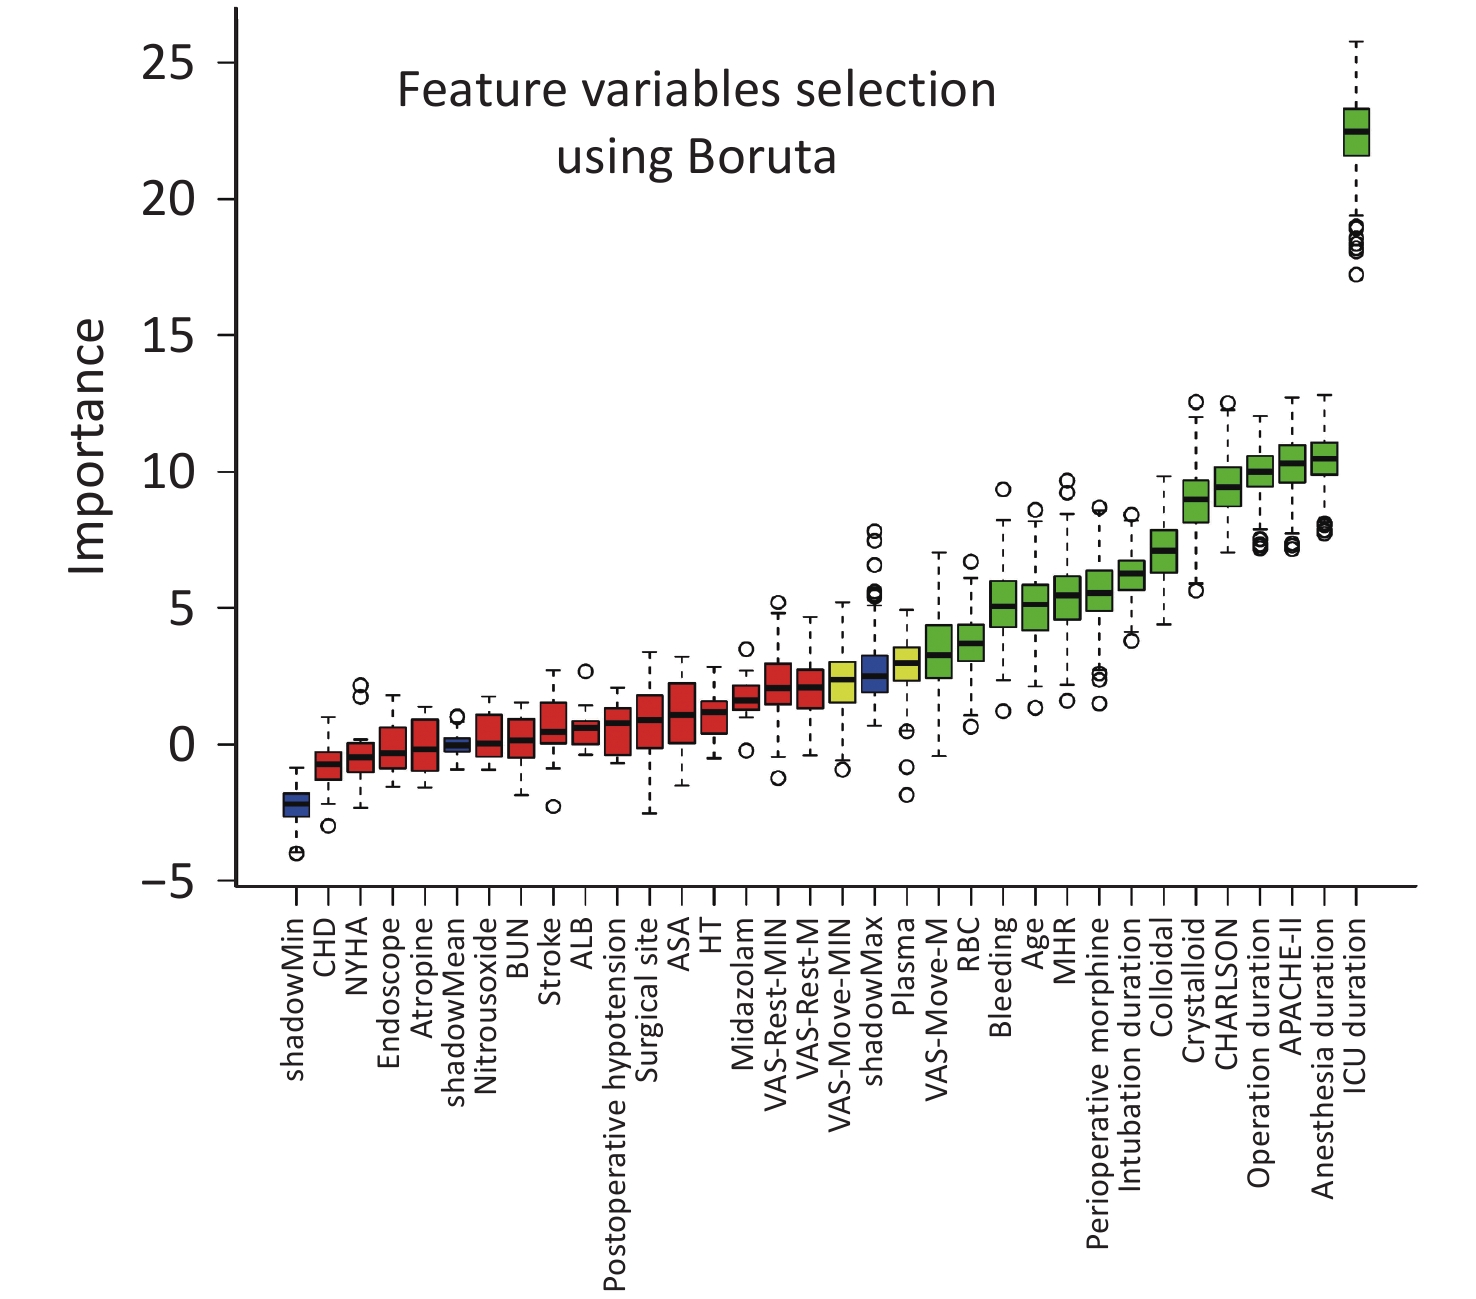
The Boruta algorithm identified critical variables, including ICU, surgery, and anesthesia durations, APACHE-II score, average intraoperative heart rate, intraoperative blood loss, total opioid dosage, patient age, VAS-Move-Median score on the 1st to 3rd day, CHARLSON score, and volumes of intraoperative plasma, crystalloid, colloid, and red blood cell transfusions, along with tracheal intubation duration. Detailed results are in Figure 2.
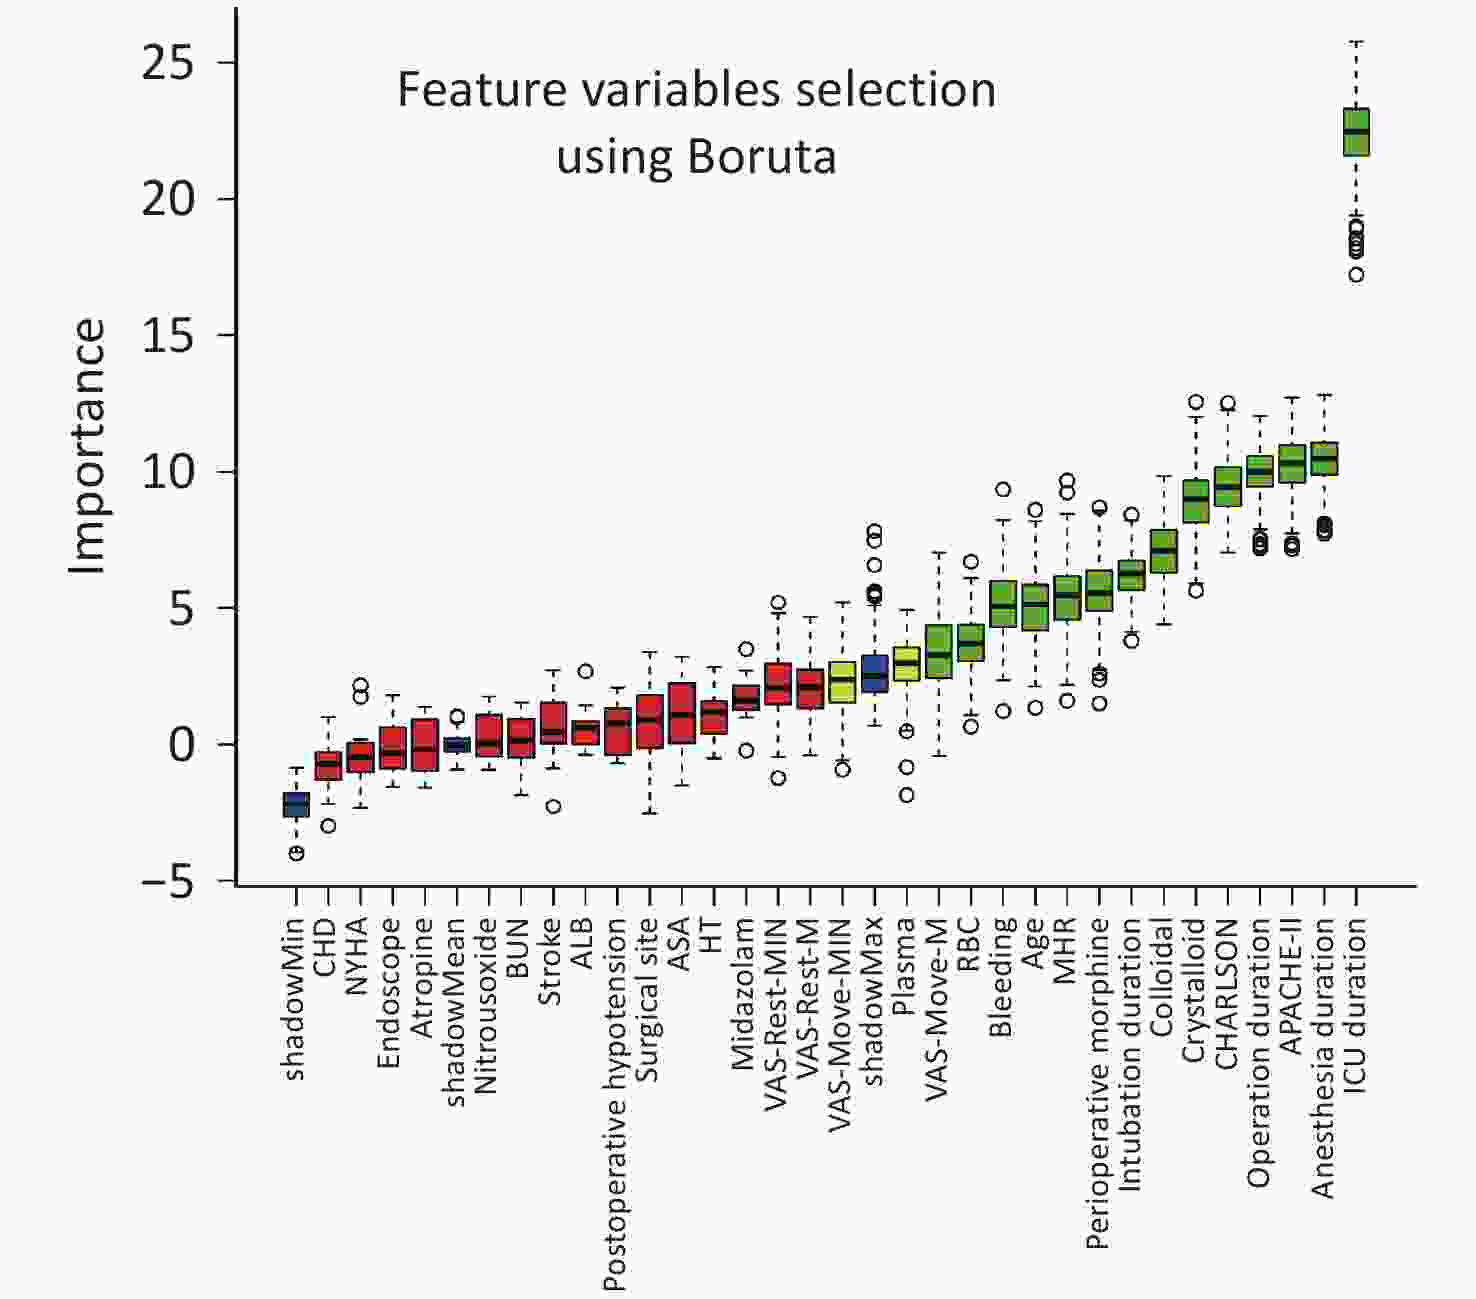
Figure 2. Feature Variable Selection using Boruta.
-
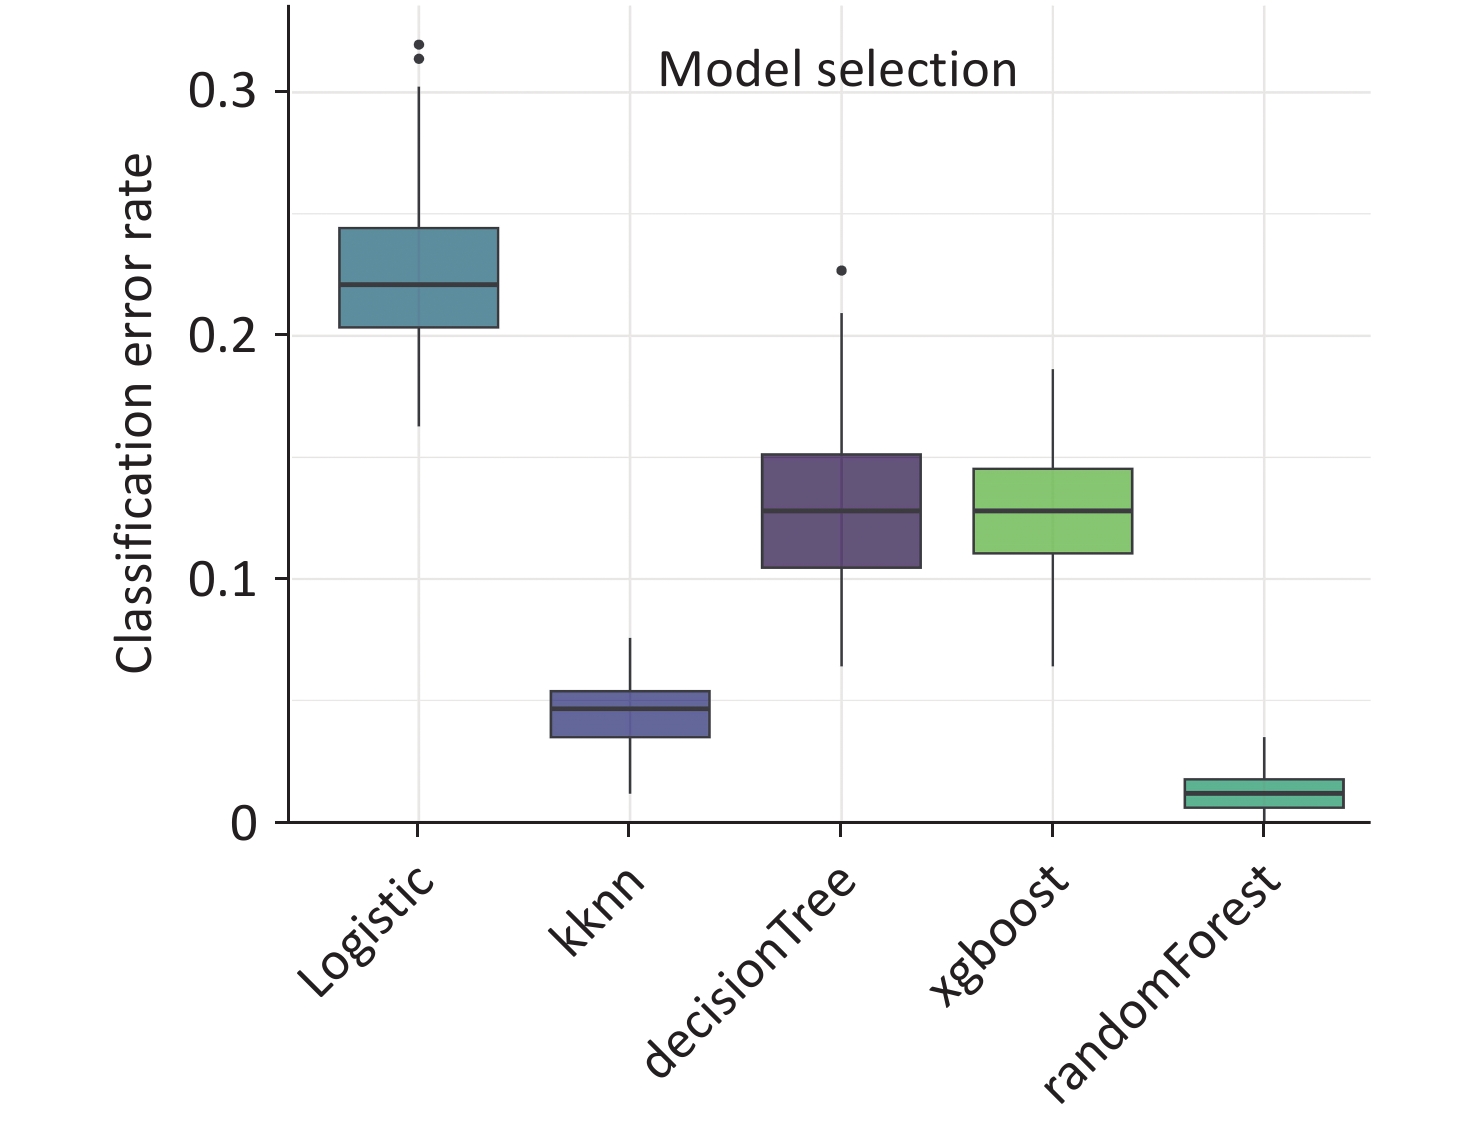
The comparative analysis of the five constructed models reveals that the RF algorithm outperforms its counterparts with respect to the misclassification rate, as indicated by the 'Classif.ce' metric. This is evidenced by its markedly lower interquartile range and minimum values on the boxplot, which signifies a more robust and consistent classification accuracy relative to the logistic regression, k-nearest neighbors (KNN), decision tree, and XGBoost algorithms (Figure 3).
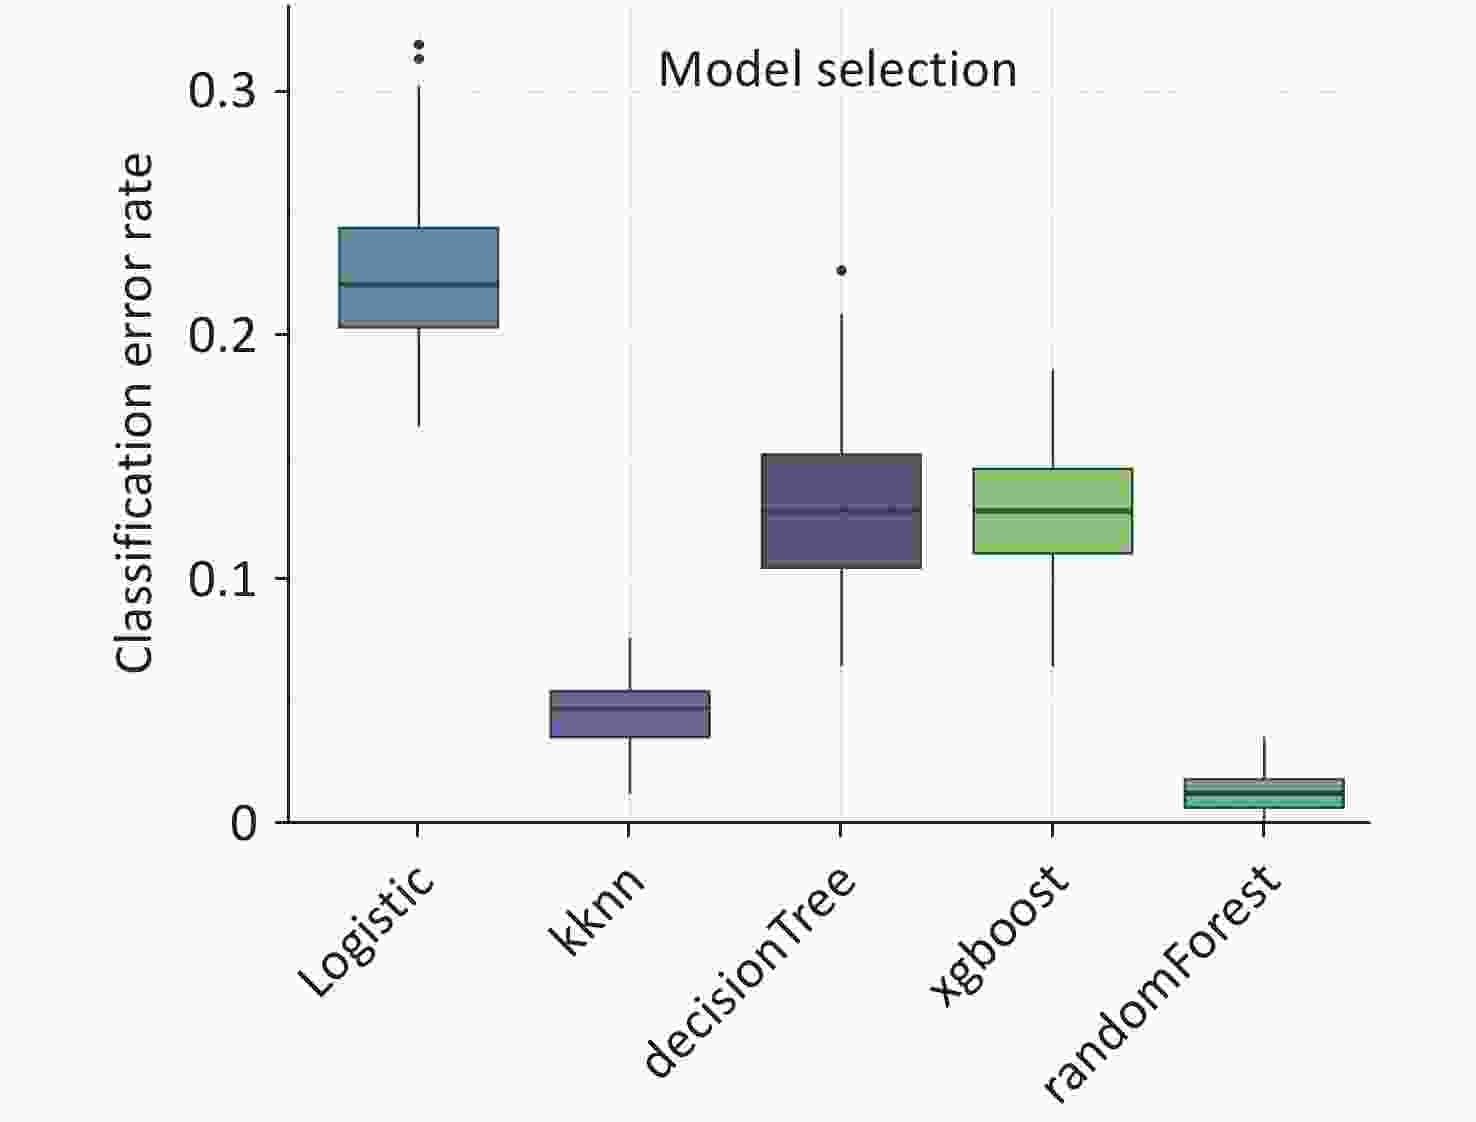
Figure 3. Model selection.
-
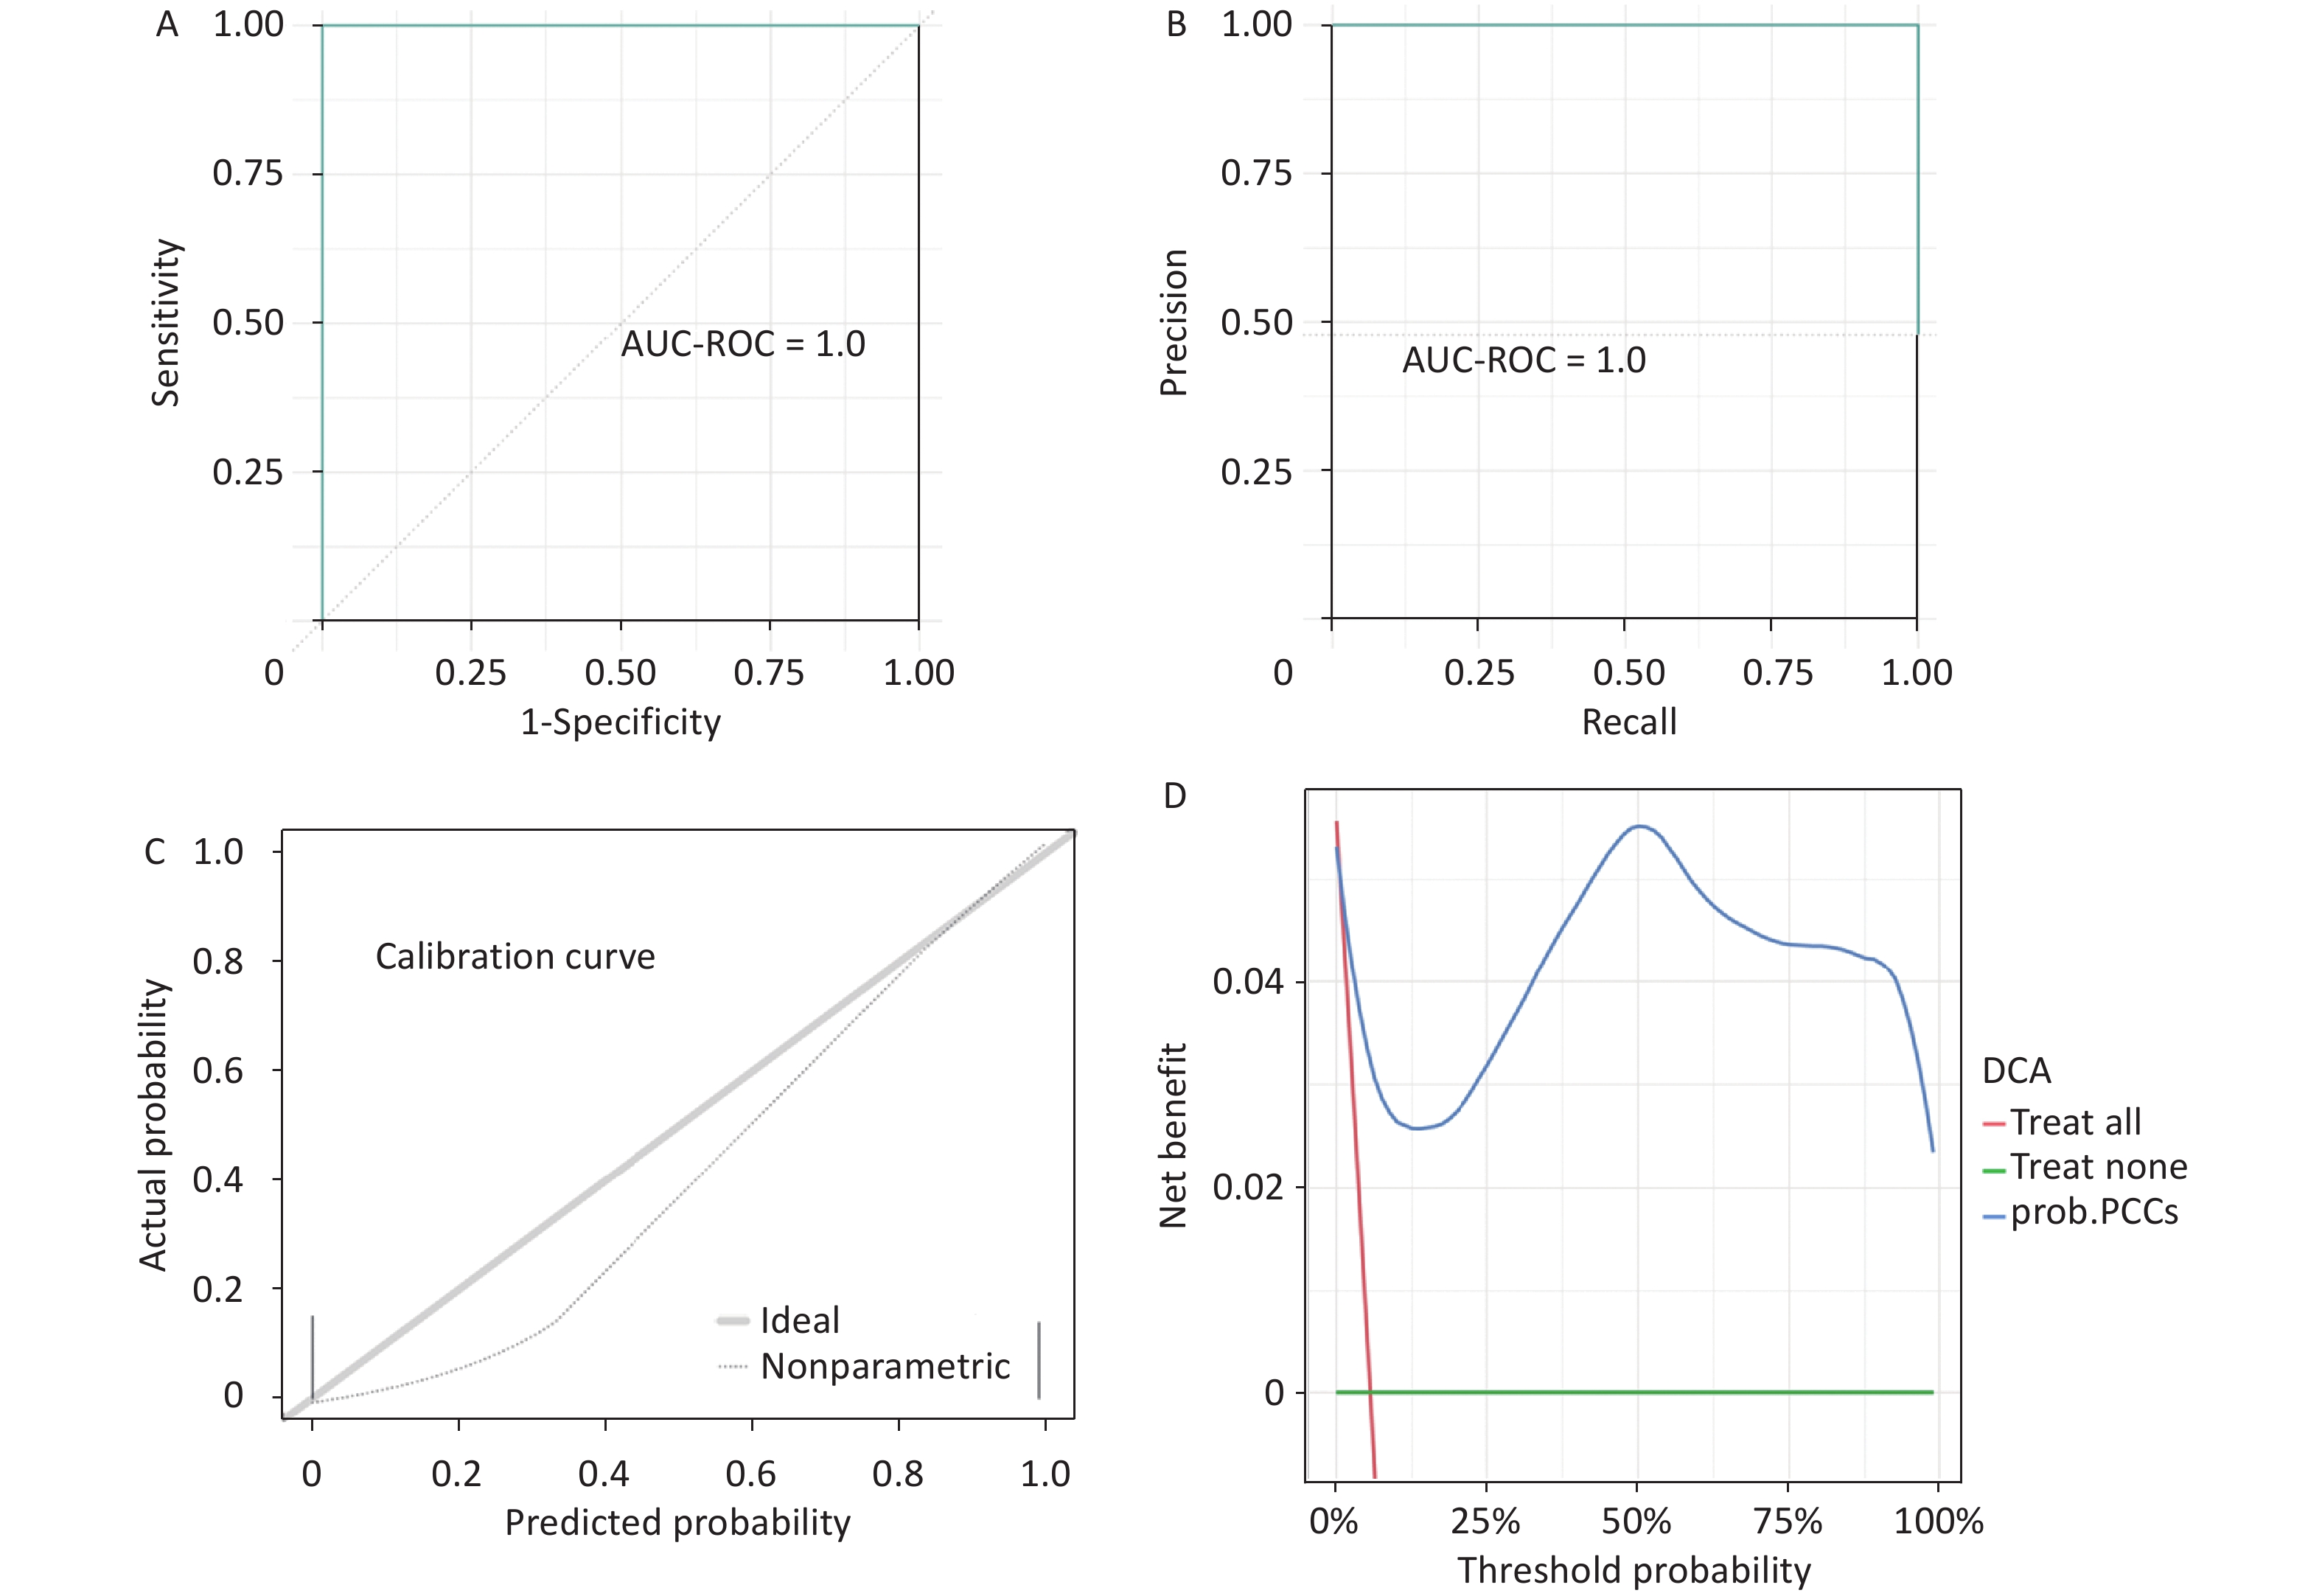
The RF model exhibits a high level of accuracy with an accuracy score of 0.9872 and a Matthews correlation coefficient (MCC) of 0.8734. Both the AUC-ROC and the AUC-PRC are 1.0. The ROC curve, PRC, calibration curve, and DCA further substantiate the model’s reliability and predictive precision (Figure 4).
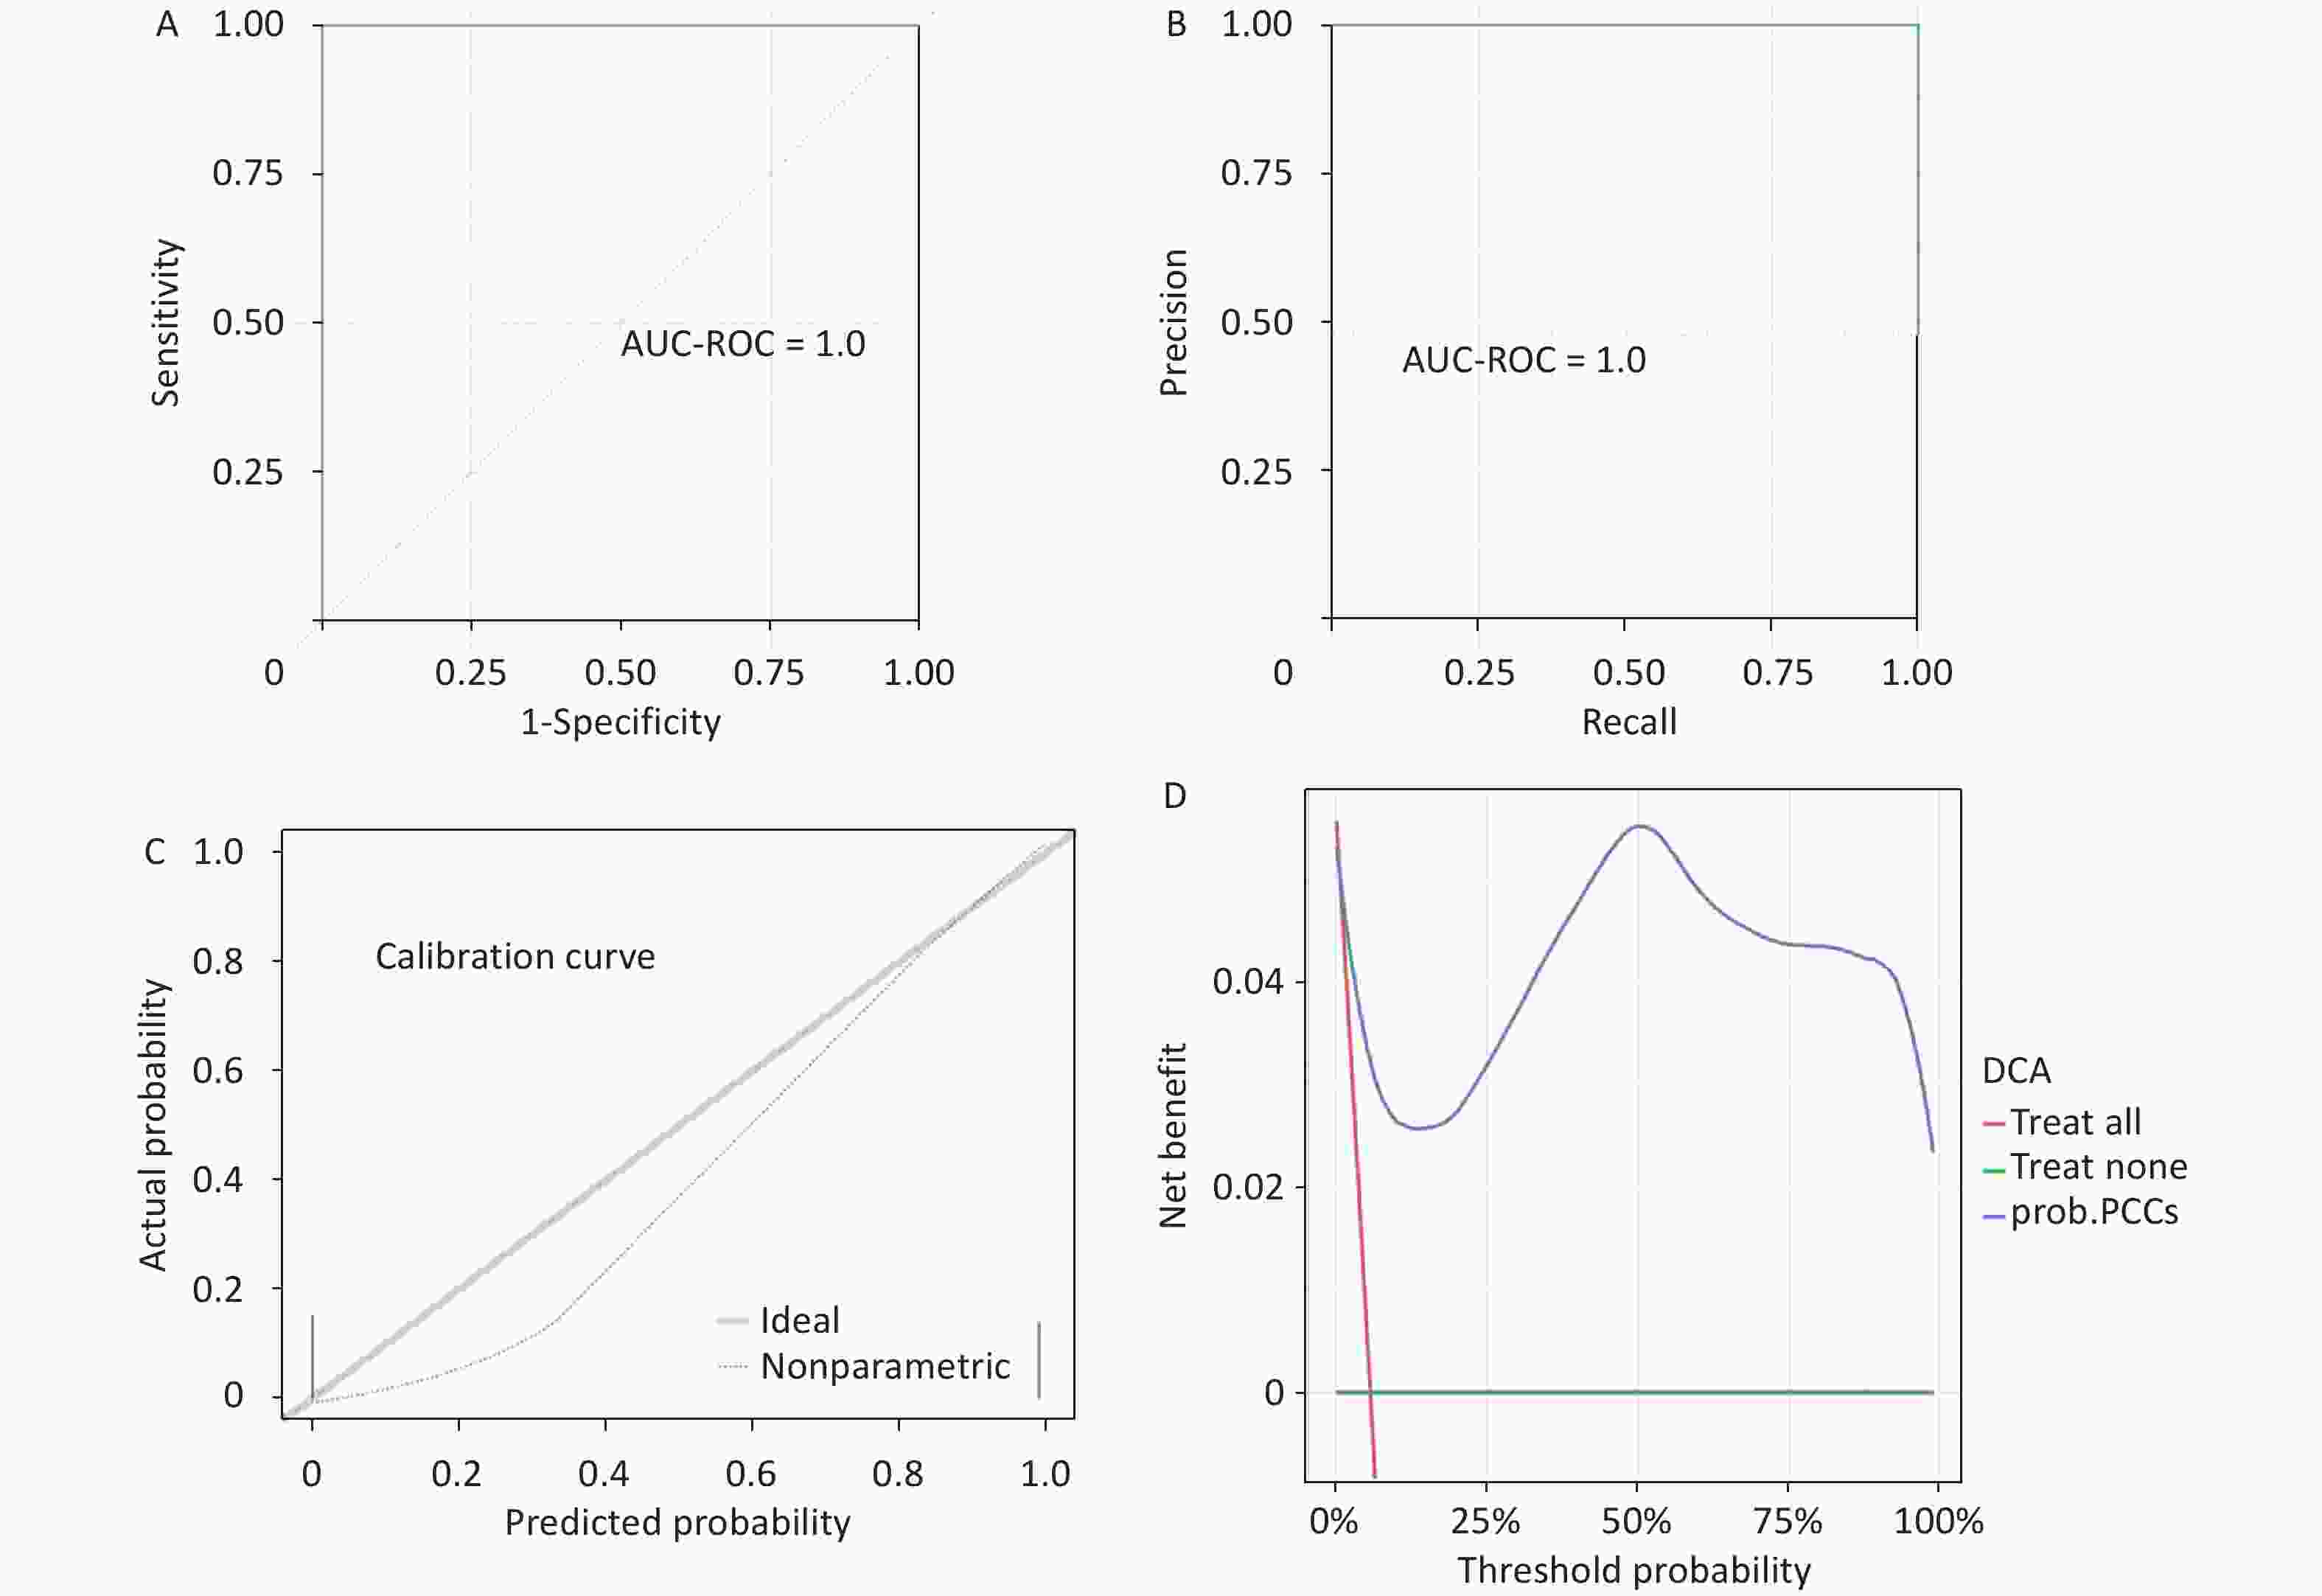
Figure 4. ROC, PRC, calibration curve, and DCA.
-
A ranking chart of feature variables was established using the RF model in Figure 5. In importance ranking, it is possible to visually see the contribution of each feature variable to the predicted variable.
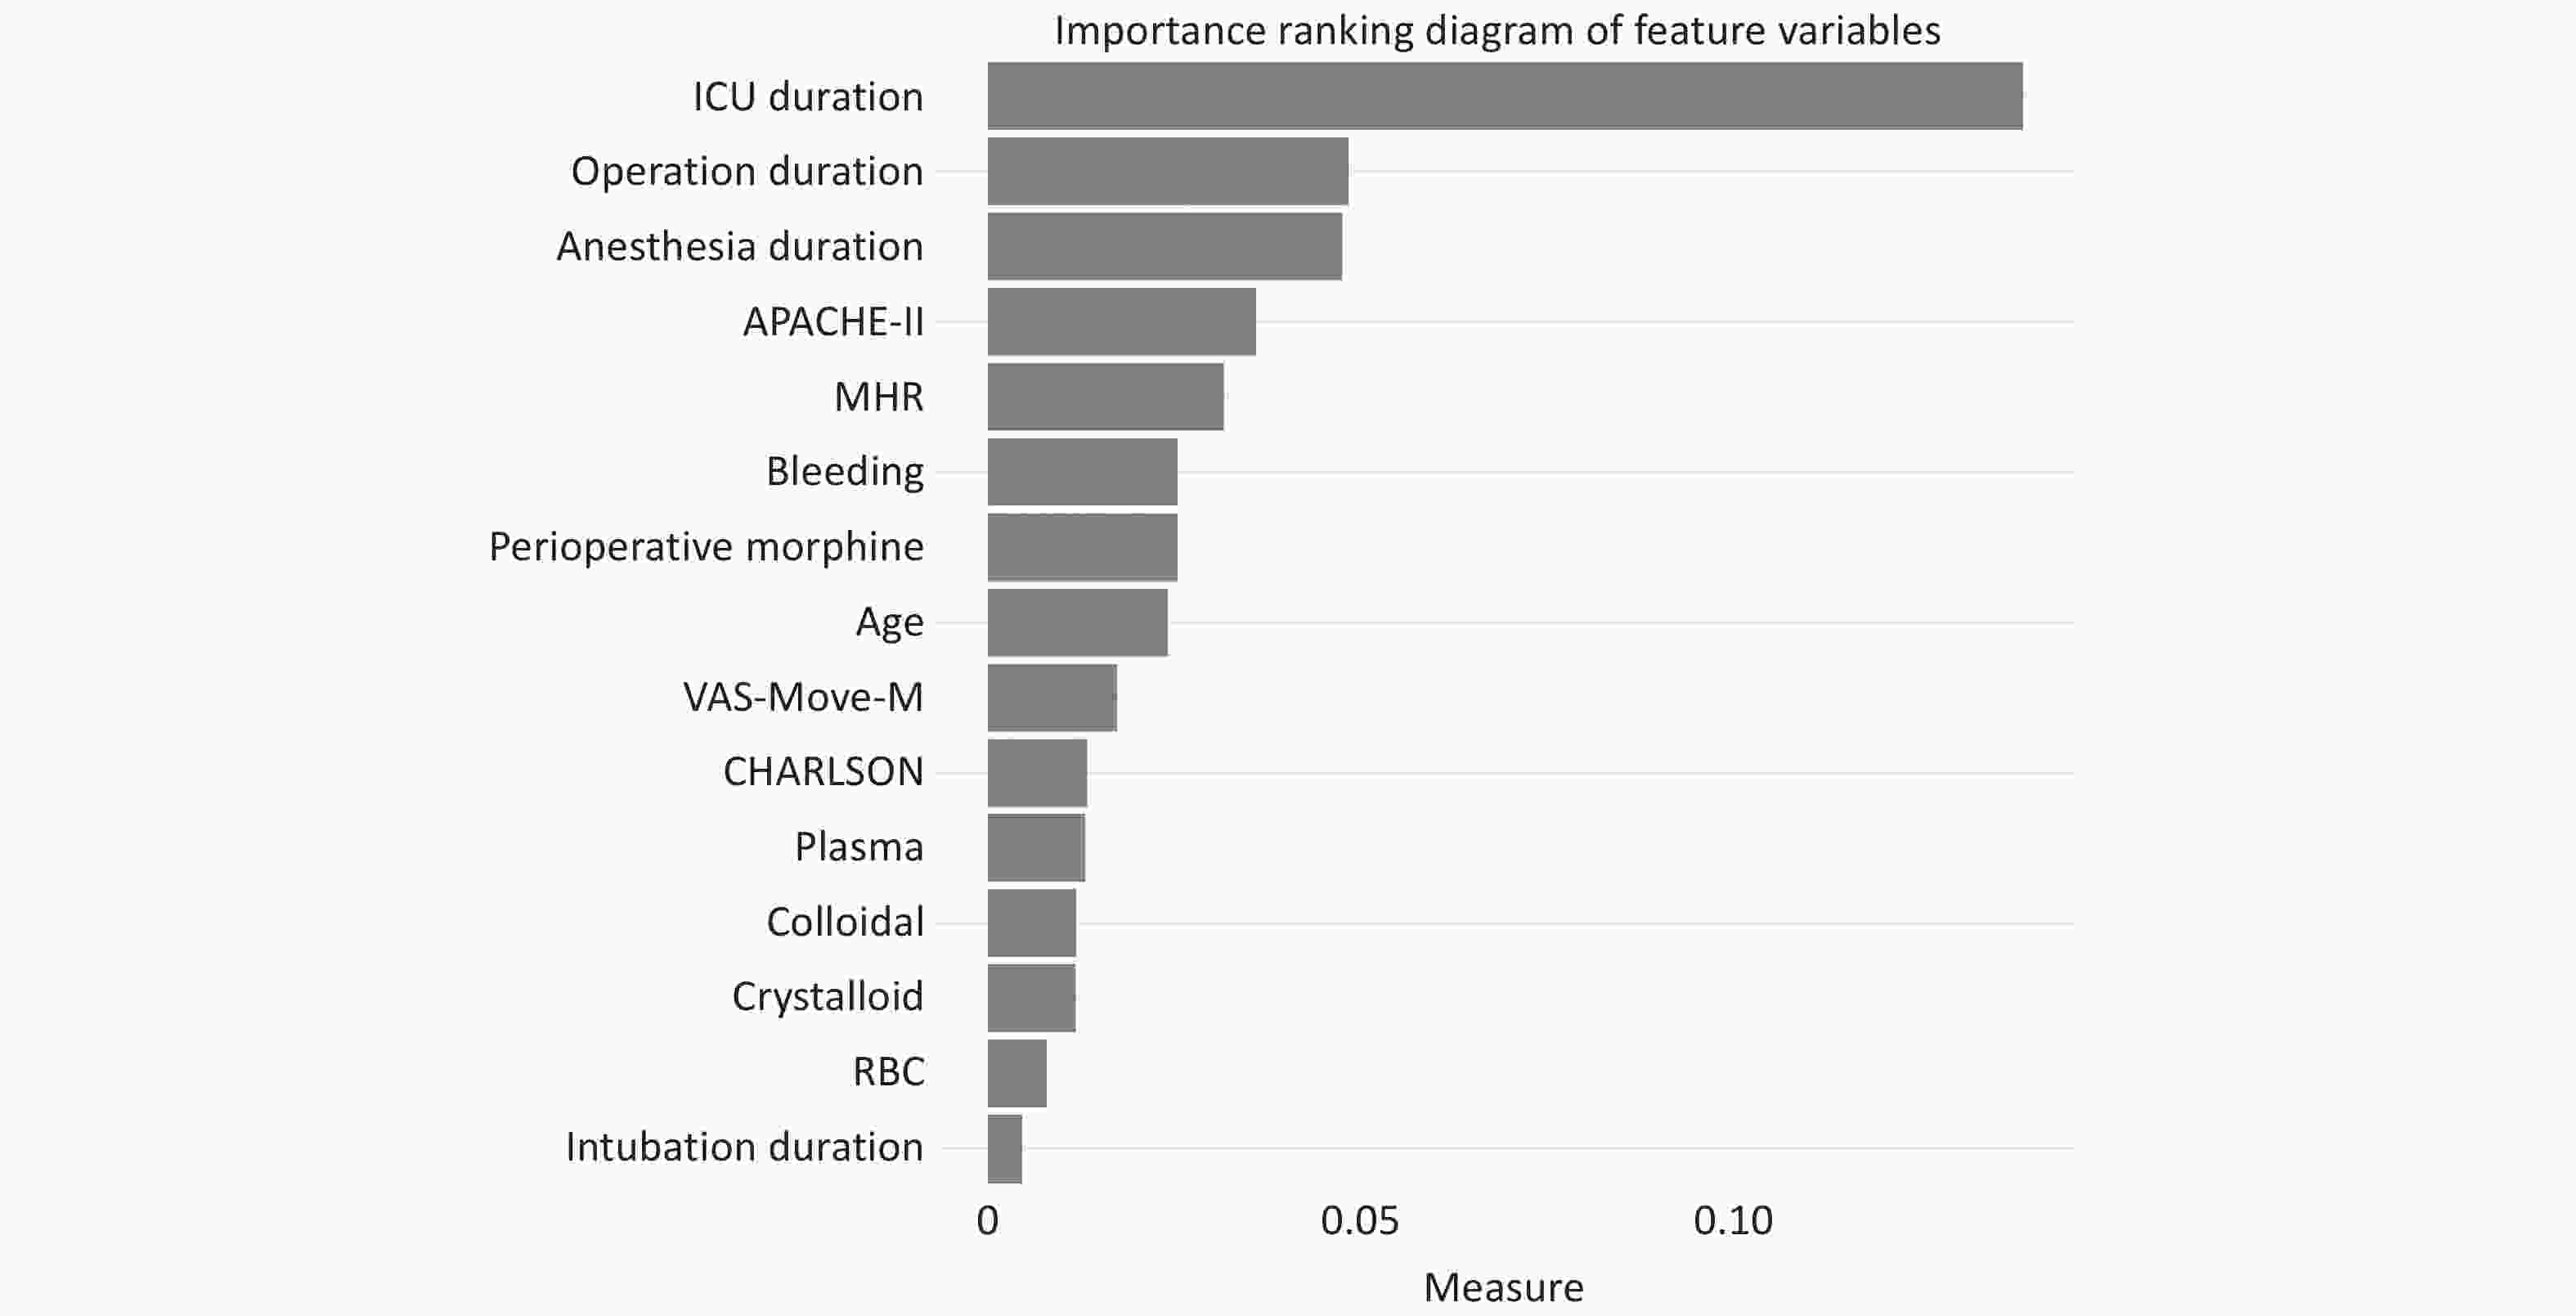
Figure 5. Importance ranking diagram of feature variables.
-
A partial dependency profile of the univariate feature variables was established using the RF model in Figure 6. Partial dependency curves are used to analyze the RF model, displaying the impact of each feature in the sample and the trend of PCCs with each feature variable.
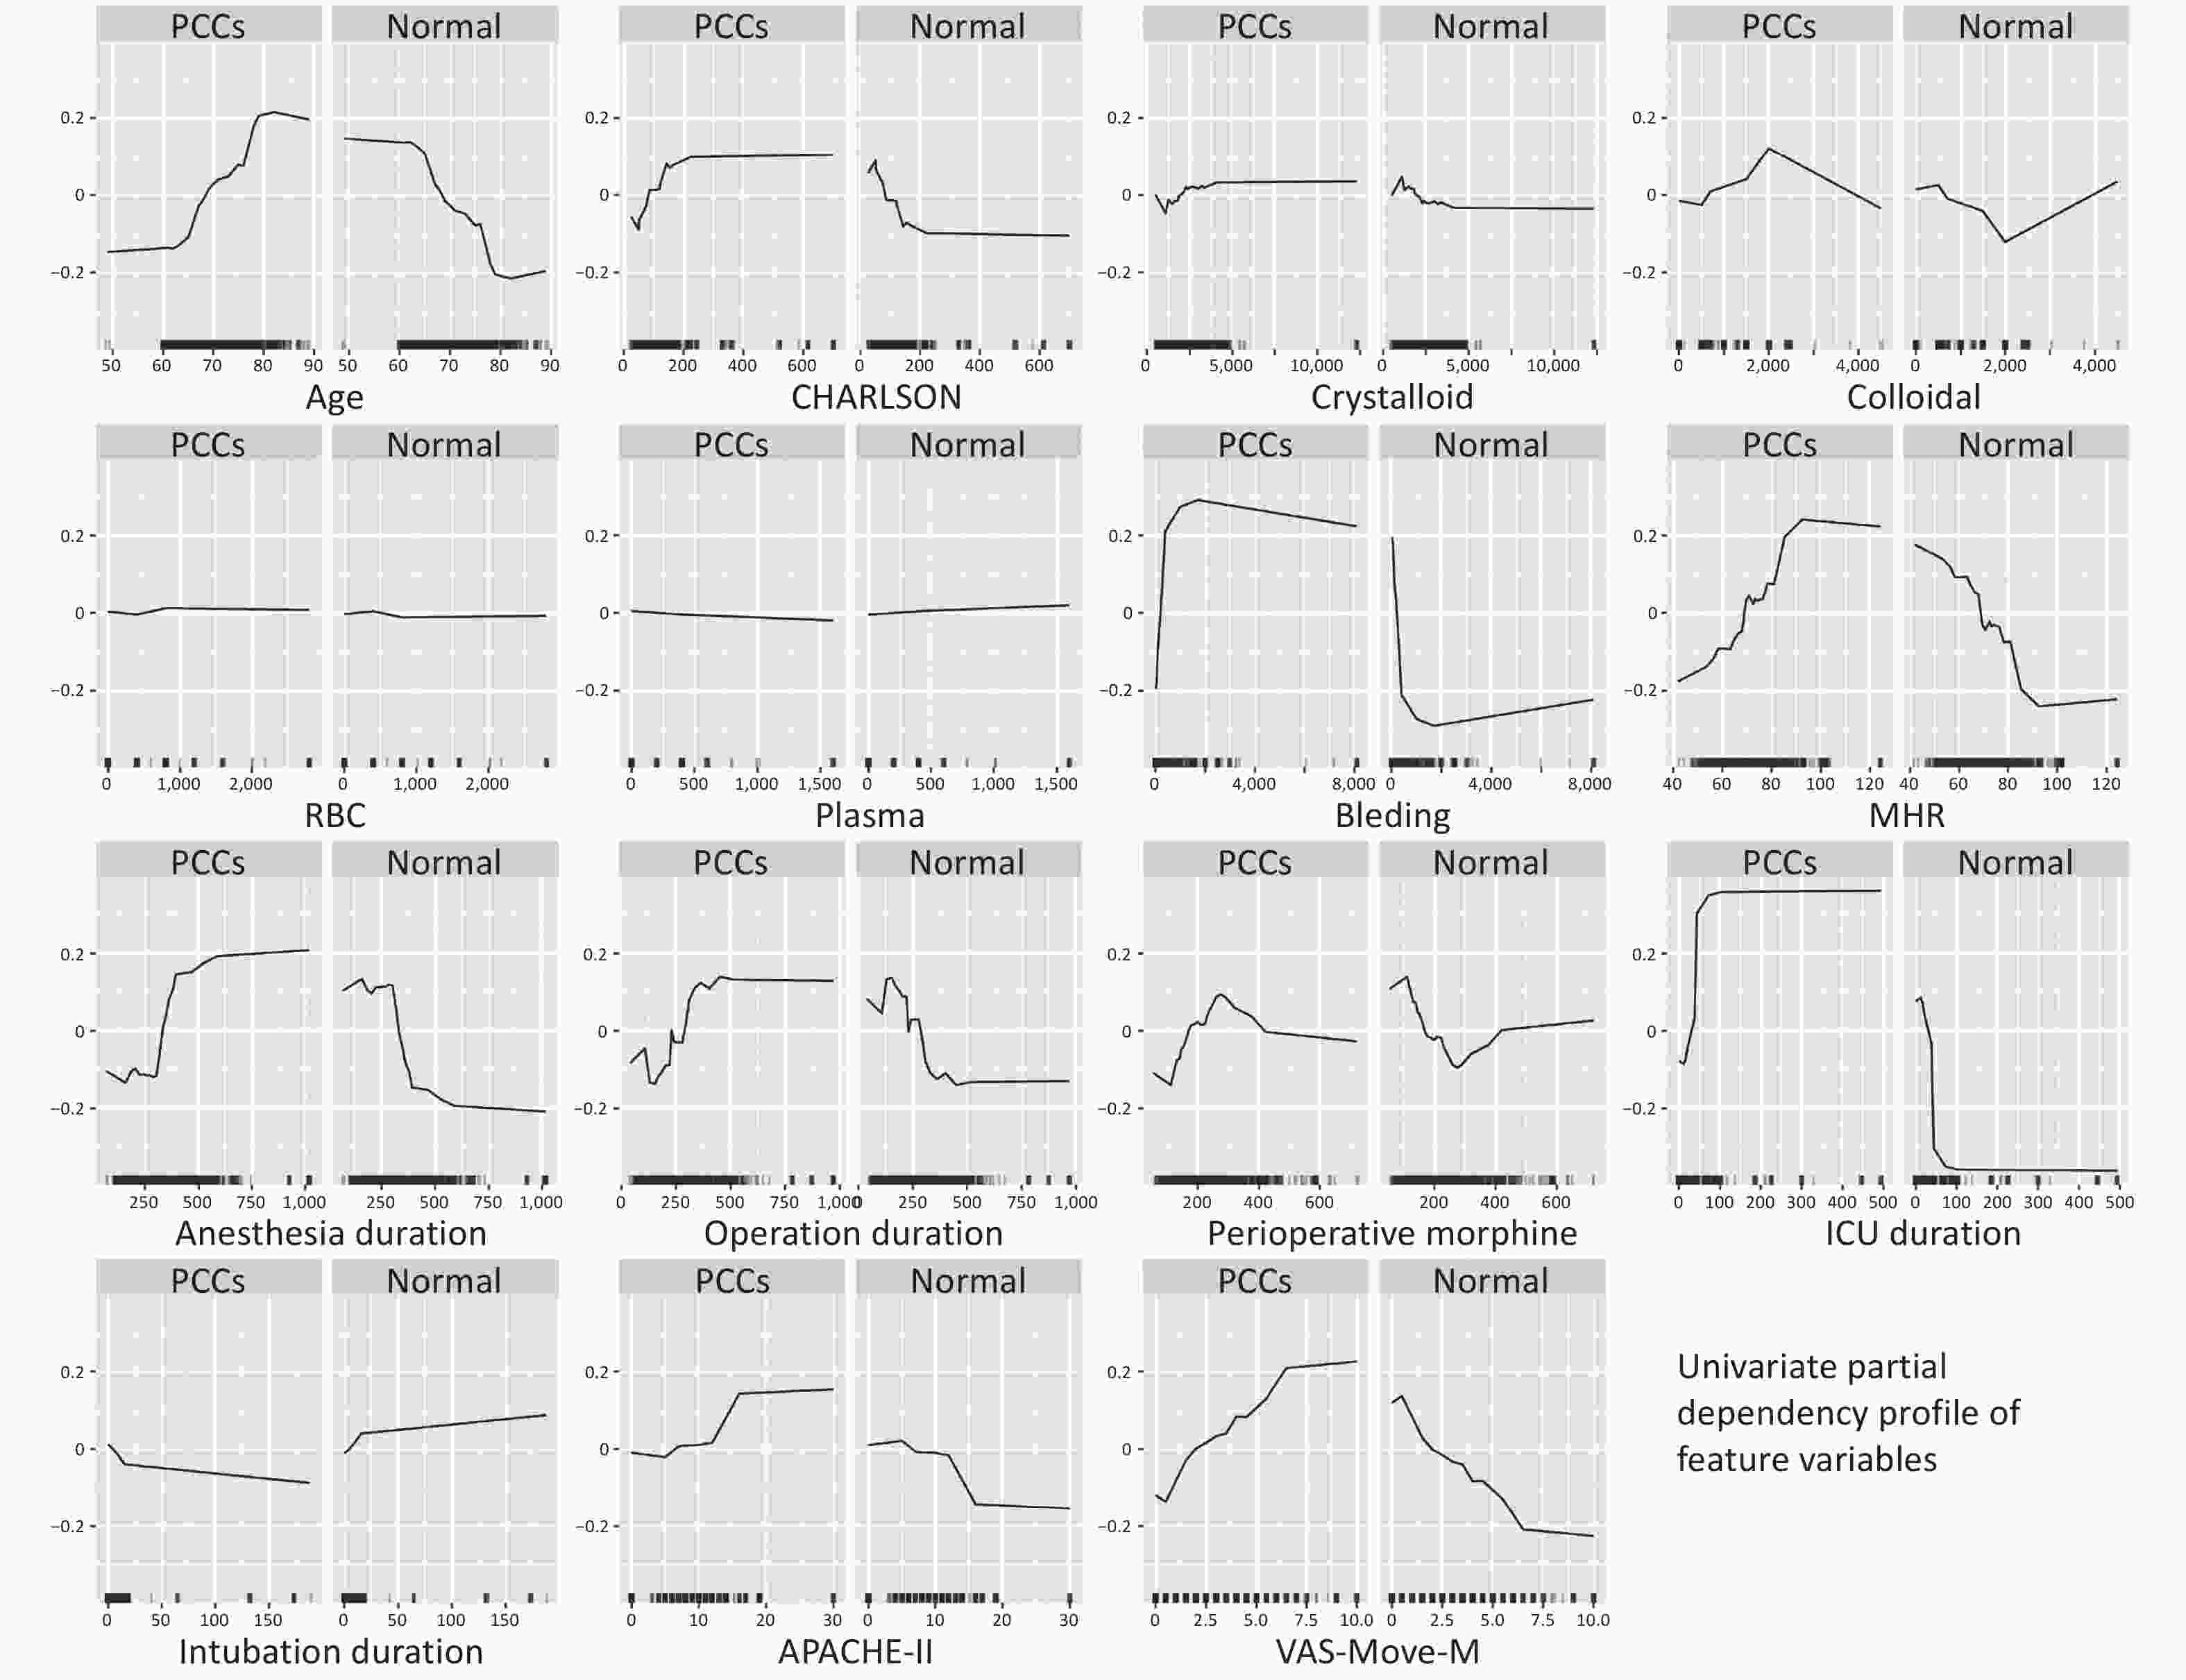
Figure 6. Univariate partial dependence profile of feature variables.
-
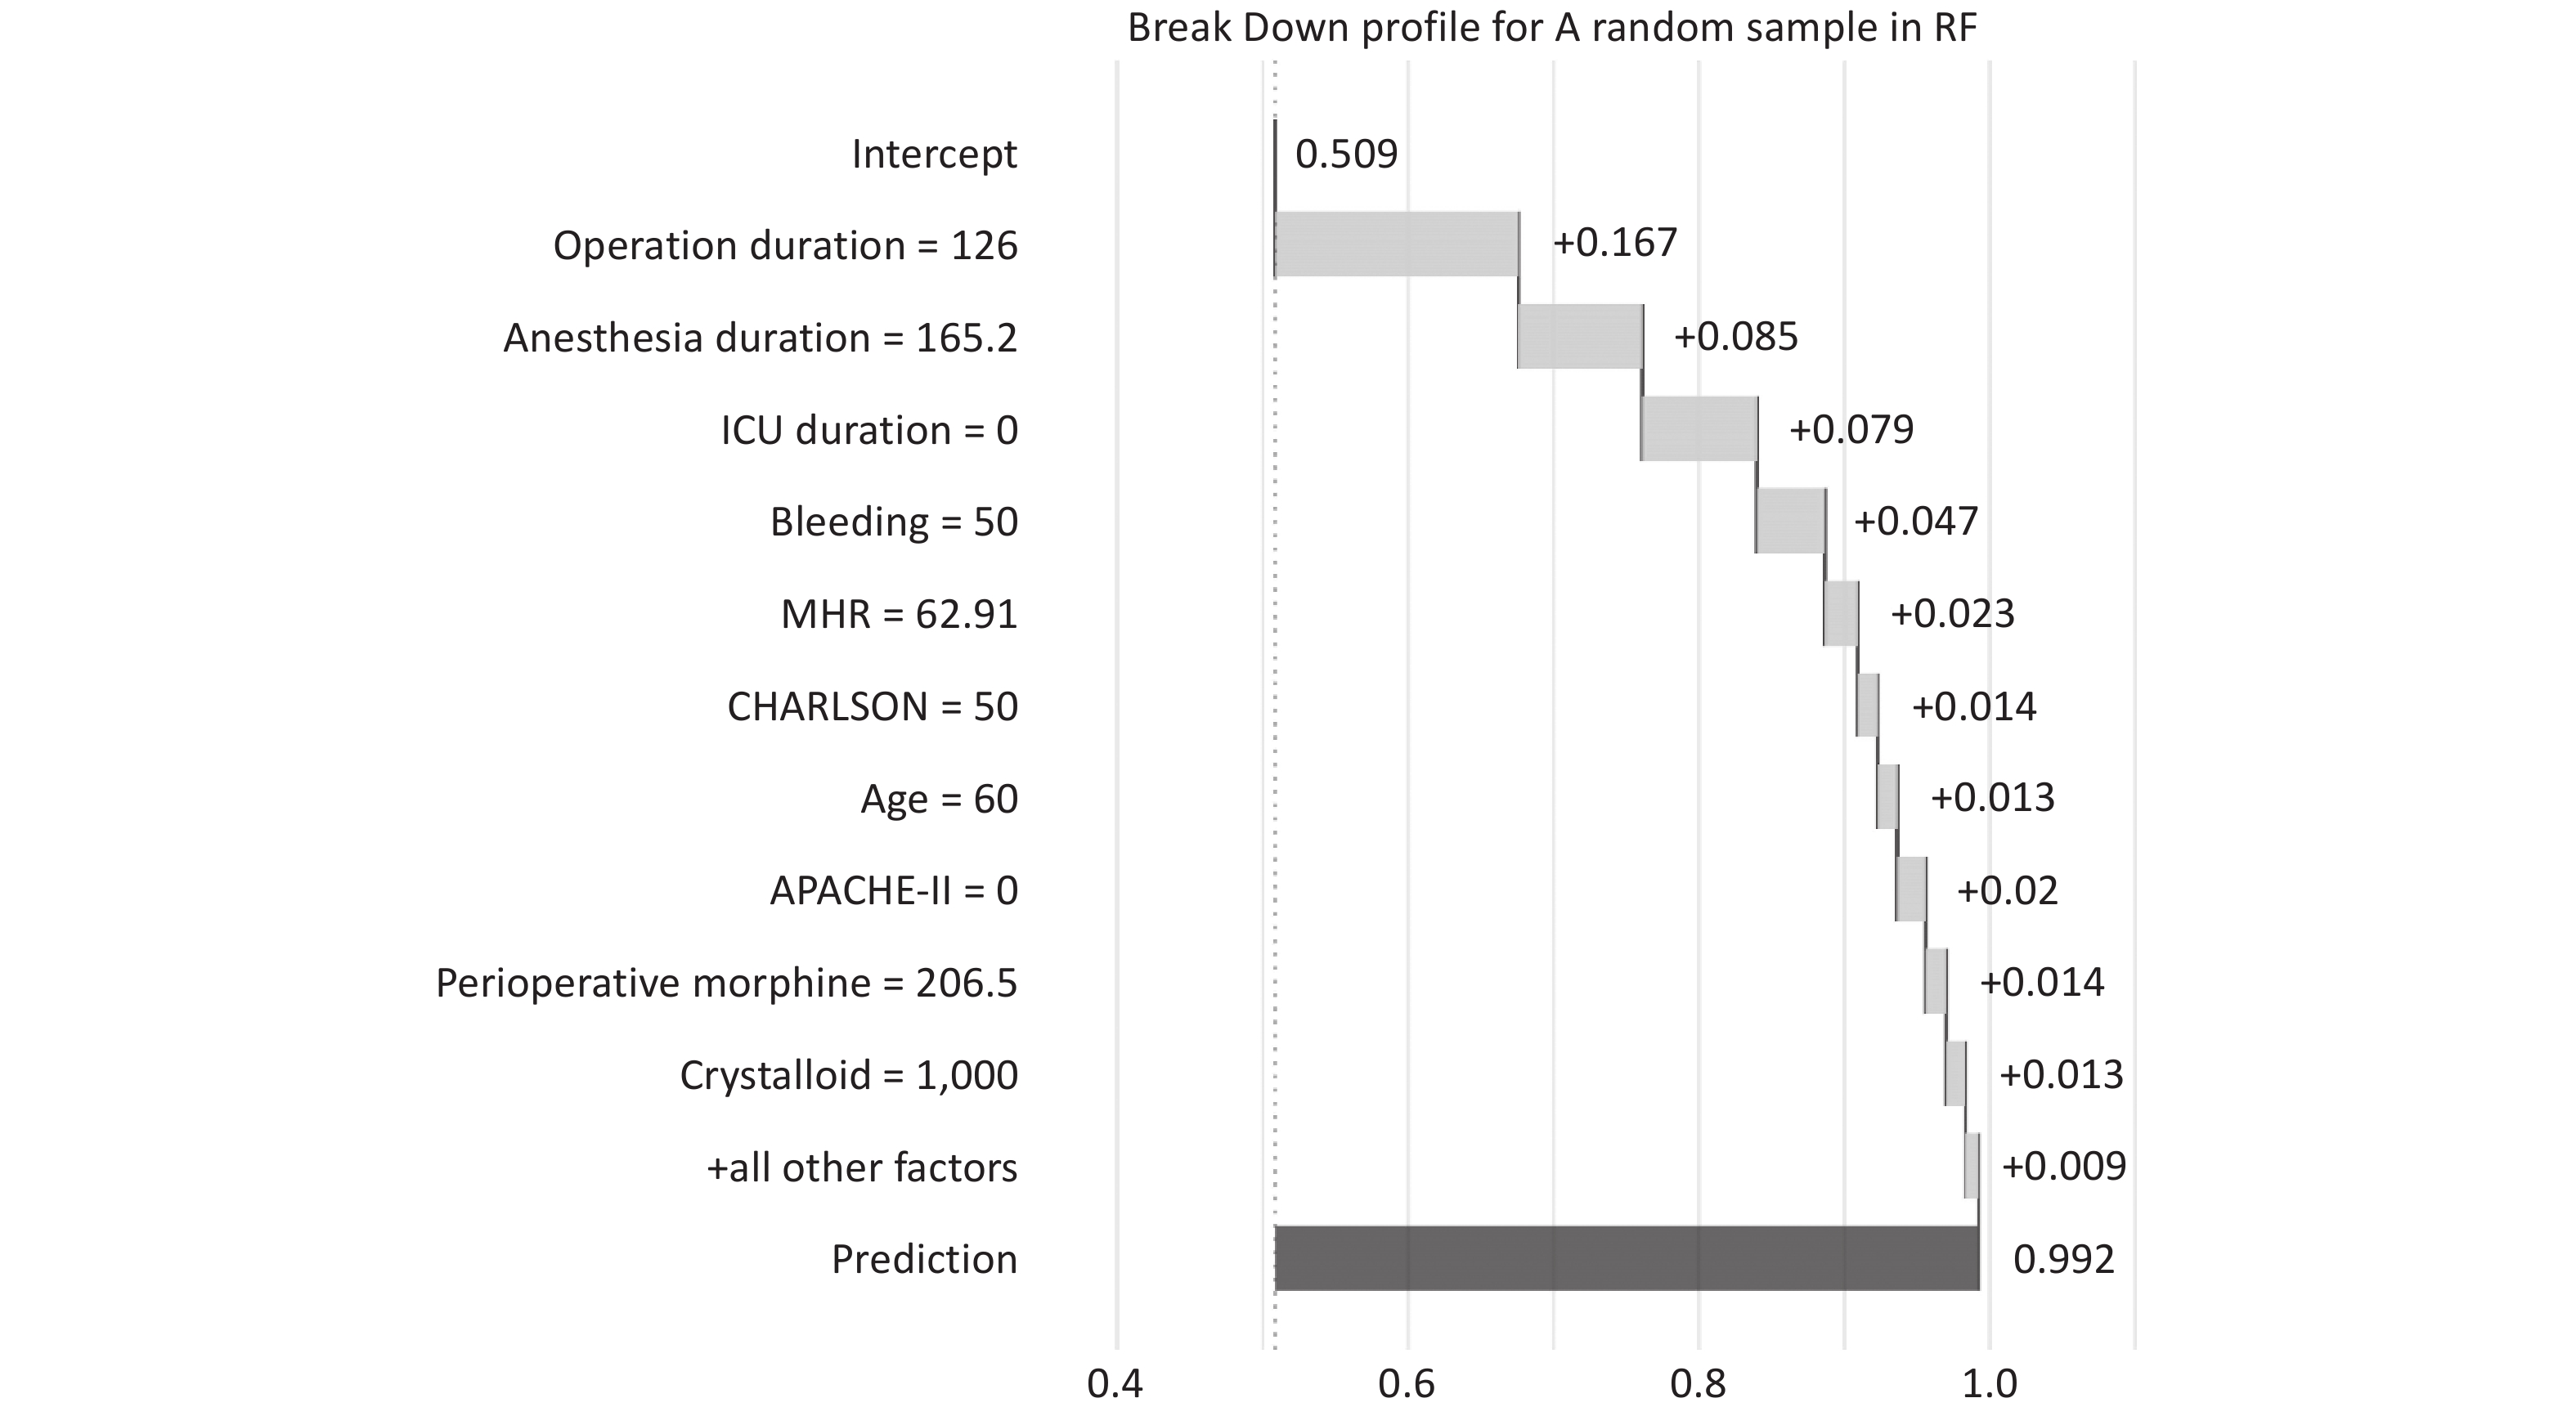
In Figure 7, the decomposition profile visualizes the contribution of each variable to the prediction of a single sample. The model predicts a probability of 0.992 for the occurrence of sample PCCs (the outcome variable of this sample is PCCs), with red or blue bars displaying the impact of each variable on the prediction. The predicted value is equal to the sum of the contributions of each feature.
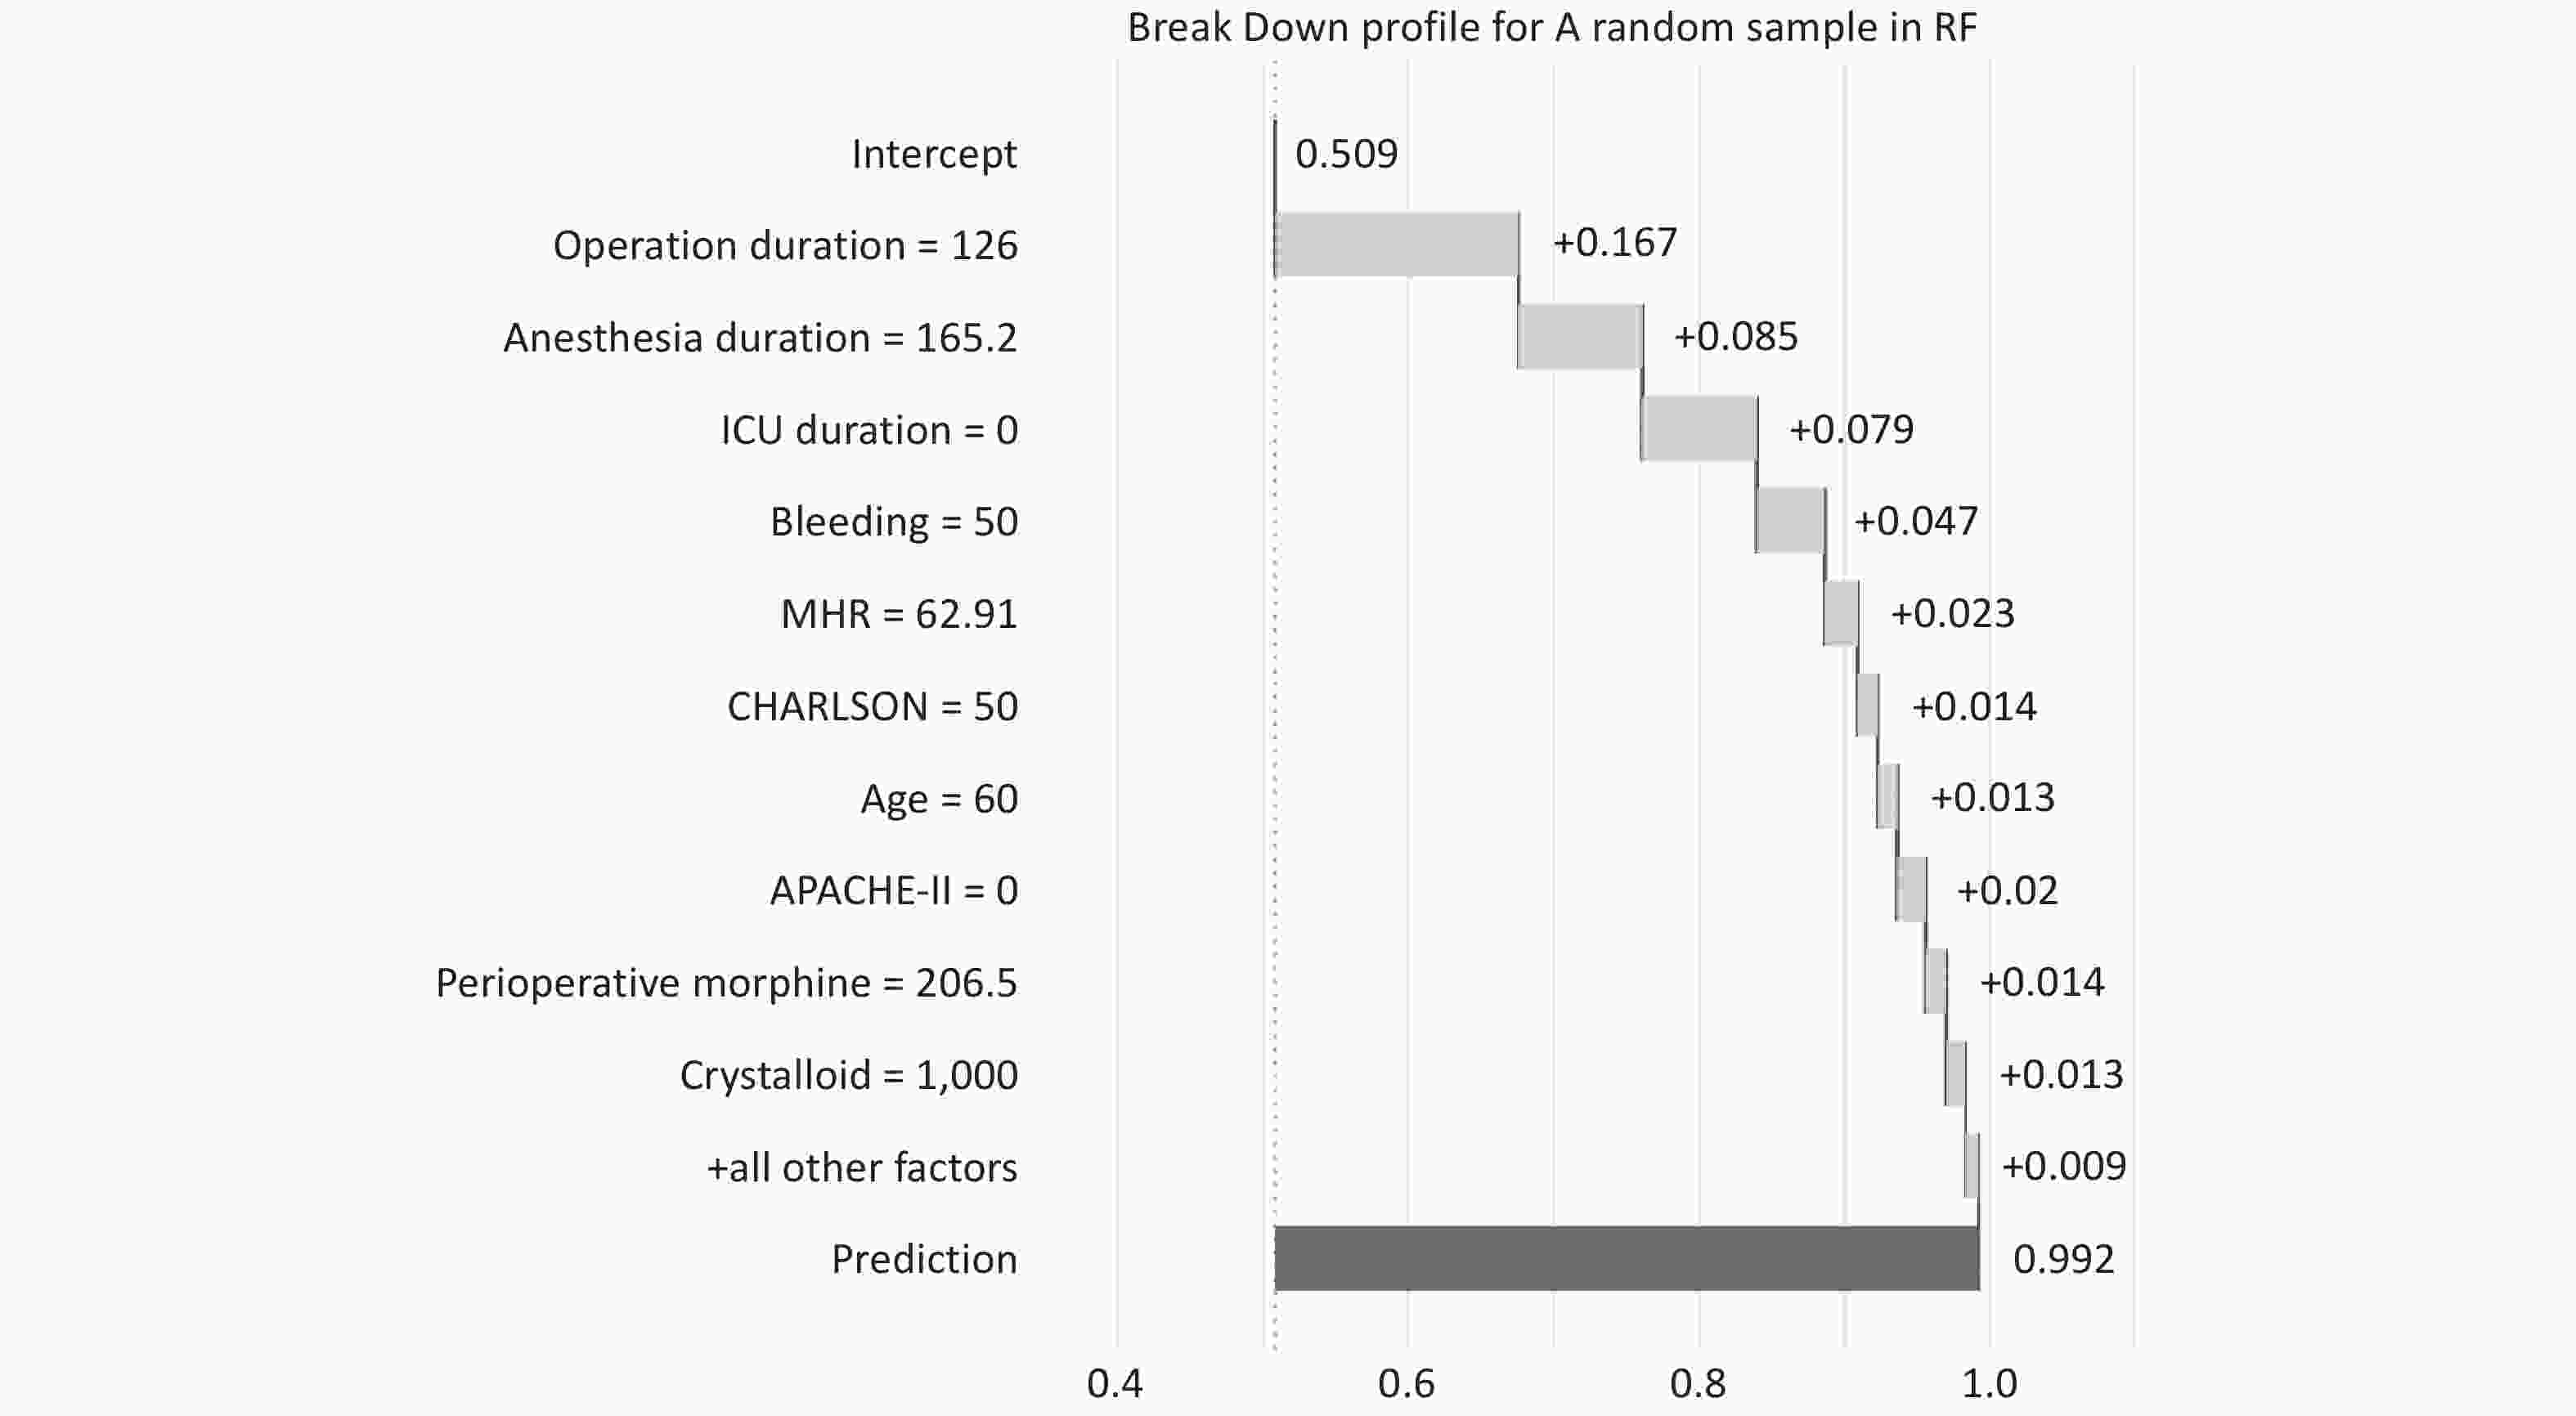
Figure 7.
-
In the results derived from our application of the Boruta feature selection method, certain features were found to be significantly associated with the risk of postoperative cardiovascular complications in elderly patients. Notably, the duration of surgery, anesthesia time, and the APACHE-II score were deemed critically important predictors. These findings are consistent with earlier research. In a 2014 study, Fleisher et al. highlighted that pre-existing cardiovascular diseases, diabetes, and hypertension were all linked to an increased risk of postoperative cardiovascular complications in the elderly[30]. Additionally, Devereaux et al., in a 2012 study, pointed out that certain surgical attributes, such as the surgery duration and preoperative comorbidities, might also heighten the risk of cardiovascular complications post-surgery for older patients[31]. Moreover, Weiser et al., in a study concerning surgical complications, noted that age, gender, BMI, and some surgery-related factors might also influence the risk of postoperative cardiovascular issues[2].
Nevertheless, according to the feature importance ranking from the RF model, besides the surgery duration, anesthesia time, and patients’ underlying diseases, our study identified that the length of stay in the ICU emerged as the most decisive factor determining postoperative cardiovascular complications in elderly patients. This might imply that an extended ICU treatment duration could be associated with cardiovascular complications. A 2021 study mentioned that in patients with an ICU stay exceeding 72 hours, the incidence rates for atrial and ventricular arrhythmias were elevated, but no study has conclusively linked other postoperative cardiovascular complications with prolonged ICU stays[32]. The duration of ICU stays, surgical time, anesthesia duration, and the APACHE-II score stand out as paramount indicators of postoperative cardiovascular complications in the elderly. The “Break Down” analysis of random samples in the Random Forest model allows for individualized risk assessment in the clinic, quantifying possible risk factors for each patient to guide preoperative interventions. For example, in patients who are expected to have longer surgery times or who may have higher bleeding, physicians can take more thoughtful monitoring and interventions in advance to reduce the risk of postoperative cardiovascular complications[33]. This model analysis also reveals the importance of variables to consider when developing patient management strategies, such as adjusting surgical and anesthetic plans, optimizing perioperative management, and actively controlling and monitoring relevant physiological parameters before and after surgery. Clinicians and medical teams should particularly attend to these features while making clinical decisions, bearing in mind the potential risks they may pose.
Contrasting our findings, Kristensen et al., in 2018, suggested that preoperative β-blocker usage was associated with a reduced risk of postoperative cardiovascular complications in the elderly[34]. Also, London et al., in a 2016 study, emphasized that preoperative hemoglobin levels were significantly related to the risk of postoperative cardiovascular complications[35]. However, these feature variables were not significant in our study. Hence, for a more accurate prediction of complication risks, a holistic analysis of all relevant factors is essential.
Our research also engaged in producing univariate partial dependence plots. Mirroring previous studies[36], as age escalates, so does the risk of cardiovascular diseases, especially beyond the age of 70, where the risk of postoperative cardiovascular complications evidently surges. This might be influenced by the characteristics of our cohort. For patients under 70, a larger sample size may be requisite for a more comprehensive analysis of their incidence trend relating to cardiovascular complications. The CHARLSON Index, a widely adopted comorbidity scoring system, aims to offer a classification method for patients in clinical studies. For cardiovascular complications, the CHARLSON Index encompasses conditions like heart failure, myocardial infarction, vascular diseases, and other cardiovascular-related ailments[37], all of which relate to the overall health status of a patient and the risk of postoperative cardiovascular complications, especially when the CHARLSON score exceeds 200. In our findings, an increase in bleeding volume seemed to correlate with a heightened risk of cardiovascular complications. Earlier reports also identified that excessive bleeding post-surgery increases the risk of cardiovascular events[38]. It’s noteworthy that apart from surgical duration, anesthesia time, and ICU stay duration, perioperative morphine also significantly impacts postoperative cardiovascular complications. At lower dose ranges, the use of morphine augments the risk of cardiovascular complications, but beyond a certain dose, this risk seems to plateau, emphasizing the pivotal role of analgesics in postoperative management and their consequential implications on the cardiovascular system. Lastly, a dependence plot analysis for the VAS scale revealed that patients with lower VAS-Move-M scores experienced a reduced incidence of postoperative cardiovascular complications. Earlier studies have noted that groups with lower VAS scores post-surgery demonstrated reduced incidences of hypotension, bradycardia, and other cardiovascular complications compared to groups with higher VAS scores, resonating with our findings[39].
Feature selection, a critical step in enhancing machine learning model performance and generalizability, involves identifying the most pertinent features from a vast dataset. This study introduces a novel approach by initially employing univariate analysis for preliminary feature selection, followed by the Boruta algorithm for final refinement. Boruta’s objective is to identify all features related to the response variable, contrasting with traditional methods that focus on minimizing the model’s cost function. This comprehensive approach, targeting all relevant variables, presents a more challenging task than selecting a minimal optimal set[39,40].
In managing imbalanced datasets, we utilized Synthetic Minority Over-sampling Technique (SMOTE), an oversampling method designed to rectify sample imbalances. SMOTE augments the minority class by generating synthetic samples, thereby equalizing the distribution across different categories. This technique synthesizes new samples leveraging the feature space characteristics of neighboring minority class instances[41]. Finally, standardize the processed dataset before establishing the model.
In constructing our model, we employed the latest mlr3 version, offering a range of machine learning algorithms for classification tasks. We utilized repeated cross-validation coupled with hyperparameter optimization for model selection, ensuring optimal solutions. Furthermore, our evaluation transcended mere accuracy; we used a confusion matrix encompassing accuracy, AUC-ROC, AUC-PRC, and MMC scores for a holistic assessment[42].
The main challenge of applying machine learning lies in the lack of interpretability and reproducibility of the results generated by machine learning, which may limit its application. The method provided by mlr3 package in this article effectively opens the “black box” of machine learning[43]. This study elucidated each feature’s impact using an importance ranking chart, and demonstrated outcome variable trends against feature changes via univariate partial dependency profiles and individual sample predictions through decomposition profiles, enhancing model interpretability.
Nonetheless, there are limitations to this study. In this study, internal validation was used and no external validation set was performed, which could certainly lead to the occurrence of problems such as overfitting. K-fold cross-validation was utilized to assess model performance and reduce the risk of overfitting. However, the lack of an independent external validation set restricts our capacity to thoroughly evaluate the generalizability of the predictive model. Our study was RCT (Randomized Controlled Trial) and the sample was strictly selected (Study Subjects and Data Collection). Therefore, the results should be cautiously interpreted until further validation is performed using independent datasets. Future efforts will focus on acquiring external validation datasets to refine the model.
In summary, our work involves data collection and organization, feature variable screening, model establishment, selection, validation, and visualization to develop machine learning algorithms for predicting postoperative circulatory complications following non-cardiac thoracic and abdominal surgeries.
doi: 10.3967/bes2025.005
Predicting Postoperative Circulatory Complications in Older Patients: A Machine Learning Approach
-
Abstract:All authors contributed to the study conception and design. Xiaoyun Hu, Weixuan Sheng and Kang Yu wrote the main manuscript, Jietai Duo, Pengfei Liu and Yawei Li helped collected and analysis the data. Dongxin Wang and Huihui Miao designed this project. All authors reviewed the manuscript.
Objective This study examines utilizes the advantages of machine learning algorithms to discern key determinants in prognosticate postoperative circulatory complications (PCCs) for older patients. Methods This secondary analysis of data from a randomized controlled trial involved 1,720 elderly participants in five tertiary hospitals in Beijing, China. Participants aged 60–90 years undergoing major non-cardiac surgery under general anesthesia. The primary outcome metric of the study was the occurrence of PCCs, according to the European Society of Cardiology and the European Society of Anaesthesiology diagnostic criteria. The analysis metrics contained 67 candidate variables, including baseline characteristics, laboratory tests, and scale assessments. Results Our feature selection process identified key variables that significantly impact patient outcomes, including the duration of ICU stay, surgery, and anesthesia; APACHE-II score; intraoperative average heart rate and blood loss; cumulative opioid use during surgery; patient age; VAS-Move-Median score on the 1st to 3rd day; Charlson comorbidity score; volumes of intraoperative plasma, crystalloid, and colloid fluids; cumulative red blood cell transfusion during surgery; and endotracheal intubation duration. Notably, our Random Forest model demonstrated exceptional performance with an accuracy of 0.9872. Conclusion We have developed and validated an algorithm for predicting PCCs in elderly patients by identifying key risk factors.
The authors declare no competing interests.
The current study was carried out in accordance with the principles of the Declaration of Helsinki. The trial protocol was approved by the Institutional Review Board of Peking University (approval number 00001052-11048) and the ethics committees of the five participating centers, and was registered with the China Clinical Trial Registry (www.chictr.org.cn; identifier: Chi CTR-TRC-09000543) and ClinicalTrials.gov (identifier: NCT01661907). The original trial was conducted at five tertiary care hospitals in Beijing, China and all subjects provided written informed consent. This was a secondary analysis of a database of previous trials, no new subjects were recruited, so informed consent was not required and the requirement was waived by the institutional review board and ethics committee.
&These authors contributed equally to this work.
注释:1) Authors’ Contributions: 2) Competing Interests: 3) Ehics: -
Figure 1. Clinical Data Analysis Flowchart.
PPCs, Postoperative Cardiovascular Complications; LR, Logistic Regression; KNN, k-Nearest Neighbors; CART, Classification and Regression Trees; Xgboost, Extreme Gradient Boosting; RF, Random Forest; SMOTE, Synthetic Minority Over-sampling Technique.
Figure 2. Feature Variable Selection using Boruta.
This graph illustrates the importance of feature variables as determined by the Boruta algorithm. The independent variables on the right side of ShadowMax are the feature variables filtered by Boruta. The x-axis displays the individual feature variables, while the y-axis represents their importance scores.
Figure 3. Model selection.
The figure shows the process of model selection. The x-axis displays the algorithms of each machine learning, while the y-axis represents their classification error rate after repeated cross validation and hyperparameter optimization.
Figure 4. ROC, PRC, calibration curve, and DCA.
ROC (top left), PRC (top right), calibration curve (bottom left), DCA (bottom right).
Figure 5. Importance ranking diagram of feature variables.
The figure shows the importance ranking of feature variables filtered by Boruta in the optimal model (RF). The y-axis displays each feature variable, while the x-axis represents the contribution level of its corresponding outcome variable.
Figure 6. Univariate partial dependence profile of feature variables.
This graph shows the quantitative trend of each feature variable filtered by Boruta for the outcome variable in the optimal model (RF). “Normal” is the probability of having no postoperative complication cluster (PCC). The y-axis displays the probability of occurrence of outcome variable, while the x-axis represents the value of its corresponding feature variable.
Figure 7.
Break Down Profile shows the visualization process of placing a random sample into the optimal model (RF) for prediction. The graph shows the name, value, and contribution level to the outcome variable of each feature variable in this sample, as well as the model’s intercept and the predicted value of the outcome variable.
Table 1. Baseline characteristics of patients
Factor Non-PCCs PCCs P-value N 1,645 75 Age (years) 69.00 [64.00, 74.00] 71.00 [66.50, 76.50] 0.035* Education (years) 9.00 [6.00, 13.00] 9.00 [5.00, 14.00] 0.990 BMI (kg/m2) 23.53 [21.45, 25.81] 24.22 [21.21, 26.07] 0.414 MMSE score 29.00 [27.00, 30.00] 29.00 [27.00, 30.00] 0.293 Anxiety score 0.00 [0.00, 2.00] 0.00 [0.00, 2.00] 0.293 Depression score 0.00 [0.00, 2.00] 0.00 [0.00, 2.00] 0.440 CHARLSON score 92.00 [50.00, 121.00] 120.00 [75.06, 151.32] < 0.001* Hct (%) 38.60 [35.30, 41.90] 37.70 [35.10, 40.70] 0.249 ALB (g/L) 40.70 [37.50, 43.10] 38.30 [36.00, 42.70] 0.011* GLU (mmol/L) 5.38 [4.86, 6.13] 5.56 [5.06, 6.36] 0.059 Serum Na (mmol/L) 141.90 [140.00, 143.00] 141.70 [140.00, 142.90] 0.536 Serum K (mmol/L) 4.02 [3.75, 4.29] 4.04 [3.66, 4.48] 0.462 CREA (μmol/L) 86.00 [75.00, 98.00] 88.00 [77.00, 102.50] 0.284 BUN (mmol/L) 5.60 [4.60, 6.79] 5.89 [4.91, 7.35] 0.047* BUN/CREA 16.06 [13.26, 19.48] 17.21 [13.85, 19.54] 0.208 Nitrousoxide (%) 1.00 [0.00, 2.00] 1.00 [0.00, 1.00] 0.002* Sevoflurance (%) 0.50 [0.00, 1.00] 0.80 [0.00, 1.00] 0.366 Midazolam (mg) 1.50 [1.00, 2.00] 2.00 [1.50, 2.00] 0.020* Lidocaine (mg) 0.00 [0.00, 60.00] 0.00 [0.00, 60.00] 0.980 Ropivacaine (mg) 0.00 [0.00, 85.00] 0.00 [0.00, 102.50] 0.856 Crystalloid (mL) 1,850.00 [1,600.00, 2,550.00] 2,200.00 [1,600.00, 3,100.00] 0.003* Colloidal (mL) 500.00 [500.00, 1,000.00] 700.00 [500.00, 1,500.00] 0.005* RBC (mL) 0.00 [0.00, 0.00] 0.00 [0.00, 0.00] 0.002* Plasma (mL) 0.00 [0.00, 0.00] 0.00 [0.00, 0.00] 0.001* Urine (mL) 400.00 [100.00, 600.00] 400.00 [150.00, 775.00] 0.173 Bleeding (mL) 100.00 [50.00, 300.00] 350.00 [125.00, 600.00] < 0.001* MAP (mmHg) 80.54 [75.12, 85.98] 78.67 [74.26, 85.33] 0.135 MHR (times/min) 66.38 [60.59, 73.33] 73.00 [64.75, 79.32] < 0.001* Anesthesia duration (min) 283.00 [219.82, 357.08] 364.68 [289.08, 453.47] < 0.001* Operation duration (min) 226.00 [165.00, 298.00] 309.00 [232.00, 385.50] < 0.001* Perioperative morphine (mg) 183.00 [145.00, 250.00] 212.00 [163.50, 289.10] 0.008* Postoperative morphine (mg) 54.00 [50.00, 120.00] 50.00 [50.00, 120.00] 0.331 ICU duration (min) 0.00 [0.00, 0.00] 14.28 [0.00, 52.80] < 0.001* Intubation duration (min) 0.00 [0.00, 0.00] 0.00 [0.00, 4.38] < 0.001* APACHE-II 0.00 [0.00, 0.00] 4.00 [0.00, 9.50] < 0.001* VAS-Rest-M 0.00 [0.00, 1.00] 0.50 [0.00, 2.00] 0.003* VAS-Move-M 2.00 [1.00, 3.50] 2.50 [1.75, 4.00] 0.031* VAS-Rest-Max 2.00 [0.00, 3.00] 2.00 [1.00, 3.00] 0.459 VAS-Move-Max 4.00 [2.00, 5.00] 4.00 [2.00, 6.00] 0.337 VAS-Rest-Min 0.00 [0.00, 0.00] 0.00 [0.00, 1.00] 0.002* VAS-Move-Min 1.00 [0.00, 2.00] 2.00 [0.00, 3.00] 0.024* Gender Male 1,075 (65.3) 48 (64.0) 0.908 Female 570 (34.7) 27 (36.0) ASA ASA-I 123 (7.5) 0 (0.0) 0.001* ASA-II 1,409 (85.7) 63 (84.0) ASA-III 113 (6.9) 12 (16.0) Group GEA-PCEA 823 (50.0) 40 (53.3) 0.659 GA-PCIA 822 (50.0) 35 (46.7) Stroke Yes 73 (4.4) 12 (16.0) < 0.001* No 1,572 (95.6) 63 (84.0) TIA Yes 23 (1.4) 0 (0.0) 0.605 No 1,622 (98.6) 75 (100.0) COPD Yes 31 (1.9) 1 (1.3) 1 No 1,614 (98.1) 74 (98.7) Chronic bronchitis Yes 30 (1.8) 2 (2.7) 0.927 No 1,615 (98.2) 73 (97.3) Asthma Yes 26 (1.6) 1 (1.3) 1 No 1,619 (98.4) 74 (98.7) Smoke Yes 393 (23.9) 23 (30.7) 0.229 No 1,252 (76.1) 52 (69.3) CHD Yes 153 (9.3) 13 (17.3) 0.035* No 1,492 (90.7) 62 (82.7) HT Yes 667 (40.5) 44 (58.7) 0.003* No 978 (59.5) 31 (41.3) Arrhythmia Yes 57 (3.5) 6 (8.0) 0.084 No 1,588 (96.5) 69 (92.0) NYHA I 1,250 (76.0) 49 (65.3) 0.050 II 395 (24.0) 26 (34.7) DM Yes 299 (18.2) 15 (20.0) 0.805 No 1,346 (81.8) 60 (80.0) Thyroid diseases Yes 43 (2.6) 2 (2.7) 1 No 1,602 (97.4) 73 (97.3) Liver
dysfunctionYes 14 (0.9) 1 (1.3) 1 No 1,631 (99.1) 74 (98.7) HLP Yes 42 (2.6) 4 (5.3) 0.274 No 1,603 (97.4) 71 (94.7) Renal
dysfunctionYes 6 (0.4) 1 (1.3) 0.718 No 1,639 (99.6) 74 (98.7) Drinking history Yes 403 (24.5) 23 (30.7) 0.283 No 1,242 (75.5) 52 (69.3) Atropine use Yes 1,237 (75.2) 47 (62.7) 0.021* No 408 (24.8) 28 (37.3) Anti-nausea use Yes 1,466 (89.1) 62 (82.7) 0.122 No 179 (10.9) 13 (17.3) NSAIDs use Yes 1,289 (78.4) 60 (80.0) 0.846 No 356 (21.6) 15 (20.0) Surgicalsite Yes 1,271 (77.3) 45 (60.0) 0.001* No 374 (22.7) 30 (40.0) Endoscope Yes 1,103 (67.1) 65 (86.7) 0.001* No 542 (32.9) 10 (13.3) Intraoperative
hypotensionYes 973 (59.1) 38 (50.7) 0.180 No 672 (40.9) 37 (49.3) Postoperative
hypotensionYes 1,585 (96.4) 64 (85.3) < 0.001* No 60 (3.6) 11 (14.7) Note. Values for continuous variables are presented as means with 95% confidence intervals (95% CI), binary variable values represent the number of people (percentage). P value < 0.05 is considered statistically significant and has been marked with "*". BMI, Body Mass Index; MMSE, Mini-Mental State Examination; CHARLSON, Charlson Comorbidity Index; Hct, Hematocrit; ALB, Albumin; GLU, Glucose; Na, Sodium; K, Potassium; CREA, Creatinine; BUN, Blood Urea Nitrogen; RBC, red blood cell; MAP, Mean Arterial Pressure; MHR, Maximum Heart Rate; ICU, Intensive Care Unit; APACHE-II, Acute Physiology and Chronic Health Evaluation II; VAS, Visual Analog Scale; ASA, American Society of Anesthesiologists; TIA, Transient Ischemic Attack; COPD, Chronic Obstructive Pulmonary Disease; CHD, Coronary Heart Disease; HT, Hypertension; NYHA, New York Heart Association; DM, Diabetes Mellitus; HLP, Hyperlipidemia; NSAIDs, Non-Steroidal Anti-Inflammatory Drugs.  下载: 导出CSV
-
[1] Writing Committee for the VISION Study Investigators, Devereaux PJ, Biccard BM, et al. Association of postoperative high-sensitivity troponin levels with myocardial injury and 30-day mortality among patients undergoing noncardiac surgery. JAMA, 2017; 317, 1642−51. doi: 10.1001/jama.2017.4360 [2] Weiser TG, Regenbogen SE, Thompson KD, et al. An estimation of the global volume of surgery: a modelling strategy based on available data. Lancet, 2008; 372, 139−44. doi: 10.1016/S0140-6736(08)60878-8 [3] Polanczyk CA, Goldman L, Marcantonio ER, et al. Supraventricular arrhythmia in patients having noncardiac surgery: clinical correlates and effect on length of stay. Ann Intern Med, 1998; 129, 279−85. doi: 10.7326/0003-4819-129-4-199808150-00003 [4] Fleisher LA, Beckman JA, Brown KA, et al. ACC/AHA 2007 guidelines on perioperative cardiovascular evaluation and care for noncardiac surgery: executive summary: a report of the american college of cardiology/american heart association task force on practice guidelines (writing committee to revise the 2002 guidelines on perioperative cardiovascular evaluation for noncardiac surgery). Anesth Analg, 2008; 106, 685−712. doi: 10.1213/01/ane.0000309024.28586.70 [5] Devereaux PJ, Goldman L, Yusuf S, et al. Surveillance and prevention of major perioperative ischemic cardiac events in patients undergoing noncardiac surgery: a review. Can Med Assoc J, 2005; 173, 779−88. doi: 10.1503/cmaj.050316 [6] Kristensen SD, Knuuti J, Saraste A, et al. 2014 ESC/ESA Guidelines on non-cardiac surgery: cardiovascular assessment and management: the Joint Task Force on non-cardiac surgery: cardiovascular assessment and management of the European Society of Cardiology (ESC) and the European Society of Anaesthesiology (ESA). Eur J Anaesthesiol, 2014; 31, 517−73. doi: 10.1097/EJA.0000000000000150 [7] Pearse RM, Moreno RP, Bauer P, et al. Mortality after surgery in Europe: a 7 day cohort study. Lancet, 2012; 380, 1059−65. doi: 10.1016/S0140-6736(12)61148-9 [8] Rodseth RN, Biccard BM, Le Manach Y, et al. The prognostic value of pre-operative and post-operative B-type natriuretic peptides in patients undergoing noncardiac surgery. J Am Coll Cardiol, 2014; 63, 170−80. doi: 10.1016/j.jacc.2013.08.1630 [9] Maile MD, Jewell ES, Engoren MC. Timing of preoperative troponin elevations and postoperative mortality after noncardiac surgery. Anesth Analg, 2016; 123, 135−40. doi: 10.1213/ANE.0000000000001309 [10] Larmann J, Handke J, Scholz AS, et al. Preoperative neutrophil to lymphocyte ratio and platelet to lymphocyte ratio are associated with major adverse cardiovascular and cerebrovascular events in coronary heart disease patients undergoing non-cardiac surgery. BMC Cardiovasc Disord, 2020; 20, 230. doi: 10.1186/s12872-020-01500-6 [11] Shaydenfish D, Scheffenbichler FT, Kelly BJ, et al. Effects of anticholinesterase reversal under general anesthesia on postoperative cardiovascular complications: a retrospective cohort study. Anesth Analg, 2020; 130, 685−95. doi: 10.1213/ANE.0000000000004099 [12] Nicklas JY, Diener O, Leistenschneider M, et al. Personalised haemodynamic management targeting baseline cardiac index in high-risk patients undergoing major abdominal surgery: a randomised single-centre clinical trial. Br J Anaesth, 2020; 125, 122−32. doi: 10.1016/j.bja.2020.04.094 [13] Gan TJ. Poorly controlled postoperative pain: prevalence, consequences, and prevention. J Pain Res, 2017; 10, 2287−98. doi: 10.2147/JPR.S144066 [14] Khuri SF, Henderson WG, Depalma RG, et al. Determinants of long-term survival after major surgery and the adverse effect of postoperative complications. Ann Surg, 2005; 242, 326−43. doi: 10.1097/01.sla.0000179621.33268.83 [15] Dimick JB, Chen SL, Taheri PA, et al. Hospital costs associated with surgical complications: a report from the private-sector national surgical quality improvement program. J Am Coll Surg, 2004; 199, 531−7. doi: 10.1016/j.jamcollsurg.2004.05.276 [16] Eappen S, Lane BH, Rosenberg B, et al. Relationship between occurrence of surgical complications and hospital finances. JAMA, 2013; 309, 1599−606. doi: 10.1001/jama.2013.2773 [17] Wijeysundera DN, Pearse RM, Shulman MA, et al. Assessment of functional capacity before major non-cardiac surgery: an international, prospective cohort study. Lancet, 2018; 391, 2631−40. doi: 10.1016/S0140-6736(18)31131-0 [18] Lee TH, Marcantonio ER, Mangione CM, et al. Derivation and prospective validation of a simple index for prediction of cardiac risk of major noncardiac surgery. Circulation, 1999; 100, 1043−9. doi: 10.1161/01.CIR.100.10.1043 [19] Gupta PK, Gupta H, Sundaram A, et al. Development and validation of a risk calculator for prediction of cardiac risk after surgery. Circulation, 2011; 124, 381−7. doi: 10.1161/CIRCULATIONAHA.110.015701 [20] Bilimoria KY, Liu YM, Paruch JL, et al. Development and evaluation of the universal ACS NSQIP surgical risk calculator: a decision aid and informed consent tool for patients and surgeons. J Am Coll Surg, 2013; 217, 833-42. e3. [21] Miotto R, Wang F, Wang S, et al. Deep learning for healthcare: review, opportunities and challenges. Brief Bioinform, 2018; 19, 1236−46. doi: 10.1093/bib/bbx044 [22] Oh AR, Park J, Shin SJ, et al. Prediction model for myocardial injury after non-cardiac surgery using machine learning. Sci Rep, 2023; 13, 1475. doi: 10.1038/s41598-022-26617-w [23] Shin SJ, Park J, Lee SH, et al. Predictability of mortality in patients with myocardial injury after noncardiac surgery based on perioperative factors via machine learning: retrospective study. JMIR Med Inform, 2021; 9, e32771. doi: 10.2196/32771 [24] Weng SF, Reps J, Kai J, et al. Can machine-learning improve cardiovascular risk prediction using routine clinical data? PLoS One, 2017; 12, e0174944. [25] Goldstein BA, Navar AM, Carter RE. Moving beyond regression techniques in cardiovascular risk prediction: applying machine learning to address analytic challenges. Eur Heart J, 2017; 38, 1805−14. [26] Canet J, Gallart L, Gomar C, et al. Prediction of postoperative pulmonary complications in a population-based surgical cohort. Anesthesiology, 2010; 113, 1338−50. doi: 10.1097/ALN.0b013e3181fc6e0a [27] Cao SJ, Zhang Y, Zhang YX, et al. Long-term survival in older patients given propofol or sevoflurane anaesthesia for major cancer surgery: follow-up of a multicentre randomised trial. Br J Anaesth, 2023; 131, 266−75. doi: 10.1016/j.bja.2023.01.023 [28] Kursa MB, Rudnicki WR. Feature selection with the boruta package. J Stat Software, 2010; 36, 1−13. [29] Riley RD, Snell KI, Ensor J, et al. Minimum sample size for developing a multivariable prediction model: PART II - binary and time-to-event outcomes. Stat Med, 2019; 38, 1276−96. doi: 10.1002/sim.7992 [30] Fleisher LA, Fleischmann KE, Auerbach AD, et al. 2014 ACC/AHA guideline on perioperative cardiovascular evaluation and management of patients undergoing noncardiac surgery: a report of the american college of cardiology/American heart association task force on practice guidelines. Circulation, 2014; 130, E278−333. [31] Devereaux PJ, Sessler DI. Cardiac complications in patients undergoing major noncardiac surgery. N Engl J Med, 2015; 373, 2258−69. doi: 10.1056/NEJMra1502824 [32] Zhang XY, Zhang WX, Lou HY, et al. Risk factors for prolonged intensive care unit stays in patients after cardiac surgery with cardiopulmonary bypass: a retrospective observational study. Int J Nurs Sci, 2021; 8, 388−93. [33] Aseni P, Orsenigo S, Storti E, et al. Current concepts of perioperative monitoring in high-risk surgical patients: a review. Patient Saf Surg, 2019; 13, 32. doi: 10.1186/s13037-019-0213-5 [34] Kristensen SD, Knuuti J, Saraste A, et al. 2014 ESC/ESA Guidelines on non-cardiac surgery: cardiovascular assessment and management: the Joint Task Force on non-cardiac surgery: cardiovascular assessment and management of the European Society of Cardiology (ESC) and the European Society of Anaesthesiology (ESA). Eur Heart J, 2014; 35, 2383−431. doi: 10.1093/eurheartj/ehu282 [35] London MJ, Hur K, Schwartz GG. Association of perioperative β-blockade with mortality and cardiovascular morbidity following major noncardiac surgery. J Vasc Surg, 2013; 58, 550. [36] Lloyd-Jones DM, Wang TJ, Leip EP, et al. Lifetime risk for development of atrial fibrillation: the framingham heart study. Circulation, 2004; 110, 1042−6. doi: 10.1161/01.CIR.0000140263.20897.42 [37] Charlson ME, Pompei P, Ales KL, et al. A new method of classifying prognostic comorbidity in longitudinal studies: development and validation. J Chronic Dis, 1987; 40, 373−83. doi: 10.1016/0021-9681(87)90171-8 [38] Mangano DT, Tudor IC, Dietzel C. The risk associated with aprotinin in cardiac surgery. N Engl J Med, 2006; 354, 353−65. doi: 10.1056/NEJMoa051379 [39] Xin NX, Yan W, Jin SF. Efficacy of analgesic propofol/esketamine and propofol/fentanyl for painless induced abortion: a randomized clinical trial. Biomed Res Int, 2022; 2022, 5095282. [40] Chawla NV, Bowyer KW, Hall LO, et al. SMOTE: synthetic minority over-sampling technique. J Artif Intell Res, 2002; 16, 321−57. doi: 10.1613/jair.953 [41] Han H, Wang WY, Mao BH. Borderline-SMOTE: a new over-sampling method in imbalanced data sets learning. In: Proceedings of the International Conference on Intelligent Computing on Advances in Intelligent Computing. Springer. 2005, 878-87. [42] Lang M, Binder M, Richter J, et al. mlr3: a modern object-oriented machine learning framework in R. J Open Sour Softw, 2019; 4, 1903. doi: 10.21105/joss.01903 [43] Petch J, Di S, Nelson W. Opening the black box: the promise and limitations of explainable machine learning in cardiology. Can J Cardiol, 2022; 38, 204−13. doi: 10.1016/j.cjca.2021.09.004 -

 点击查看大图
计量
- 文章访问数: 7107
- HTML全文浏览量: 3498
- PDF下载量: 48
- 被引次数: 0

 Quick Links