

 下载:
下载:

-
Asthma is a chronic lung disease that affects people of all ages. It is caused by inflammation and constriction of the muscles surrounding the airways, making breathing difficult. Symptoms include coughing, wheezing, shortness of breath, and chest tightness. These symptoms can range from mild to severe and may fluctuate over time. Asthma is a serious global health concern, affecting approximately 300 million people worldwide and causing about 1,000 deaths per day. Most of these deaths occur in low- and middle-income countries, and the majority are preventable[1]. The prevalence of asthma is increasing in many developing economies, and the cost of asthma treatment is rising for health systems, communities, and individuals. According to the Global Burden of Disease (GBD) 2021 data, the global asthma mortality rate in 2021 was estimated at 5.53 per 100,000, with 44,000 deaths and 2,142 million disability-adjusted life years (DALYs) attributable to asthma[2].
The asthma burden in China is also concerning, with a large and growing number of patients with asthma. The disease is characterized by a prolonged duration, frequent exacerbations, and multiple associated comorbidities. In 2019, the asthma incidence, mortality, and DALY rates in China were 376.13 per 10,000, 2.48 per 10,000, and 141.32 per 10,000, respectively[3]. Although China’s asthma mortality rate is not among the highest globally, the sheer size of its population means that asthma deaths in China accounted for 5.37% of the total global asthma-related deaths in 2019, ranking third worldwide[4]. Given this substantial burden, analyzing asthma-related mortality trends in China is crucial.
In this study, we examined the asthma-related disease burden in China using estimates from the GBD study for 204 countries from 1990 to 2021. We employed two epidemiological measures—mortality and DALYs to assess and compare the asthma burden in China over this period. Finally, we projected asthma mortality and DALYs for 2050 under two different intervention scenarios. The findings of this study may provide new evidence to support policymakers, offering governments and health authorities more comprehensive information on asthma. These insights could help public health managers evaluate the impact of past interventions and guide the development of future policies.
-
The GBD Study 2021 provides comprehensive data on the incidence, prevalence, mortality, and DALYs associated with asthma in China. The GBD study is a large-scale initiative designed to estimate population health metrics, including fertility rates, disease burden, and mortality, across 204 countries and territories using consistent and comparable methodologies. For further details on the GBD 2021 study, refer to the primary source[5]. Cause-specific mortality estimates in this study were derived using the Cause-of-Death Ensemble Model, a sophisticated modeling framework developed by Foreman et al. Additional methodological aspects of the GBD estimation system, including the diverse range of health indicators it computes, are discussed elsewhere[6]. The 95% uncertainty interval (UI) presented in this study accounts for variability arising from differences in data availability, data quality, and modeling techniques. We report average estimates, accompanied by their respective UIs in parentheses, for clarity.
-
Asthma is a chronic respiratory disease characterized by bronchospasm, often triggered by allergic reactions, leading to breathing difficulties. In this study, asthma was defined as a physician-diagnosed condition accompanied by wheezing within the past year. The relevant International Classification of Diseases (ICD) codes for asthma are J45 and J46 under the ICD-10 system, and 493 under ICD-9[6].
-
In this study, we conducted a comprehensive analysis of the age-standardized incidence, prevalence, mortality, and DALY rates for asthma in China for the year 2021. We compared China’s age-standardized DALY rates with global averages and those of the Group of 20 (G20) countries, excluding the European Union. To identify temporal trends, we used year as a regression variable and applied a Joinpoint regression model, with age-standardized asthma metrics as the dependent variables. The annual percentage change (APC) was calculated to evaluate trends, where an APC > 0 indicates an upward trend, an APC < 0 signifies a downward trend, and an APC = 0 suggests no significant trend change. A P-value < 0.05 was considered statistically significant. All statistical analyses were performed using Joinpoint software (version 5.2.0) and R software (version 4.4.0).
Furthermore, we employed data from the GBD 2021 to forecast future trends in asthma-related deaths, mortality rates, DALYs, and DALY rates in China from 2022 to 2050 under two distinct scenarios: the reference and the combined scenario. The combined scenario integrates goal-based trends aimed at creating safer environments, improving behavioral and metabolic risk factors, and enhancing child nutrition and vaccination. Our multi-stage modeling approach leverages predictions of independent health drivers to forecast health outcomes for specific causes. The disease and injury burden of asthma was estimated for the years 1990, 2022, and 2050, presenting both death counts and DALY estimates, as well as all-age and age-standardized rates per 100,000 population[7].
-
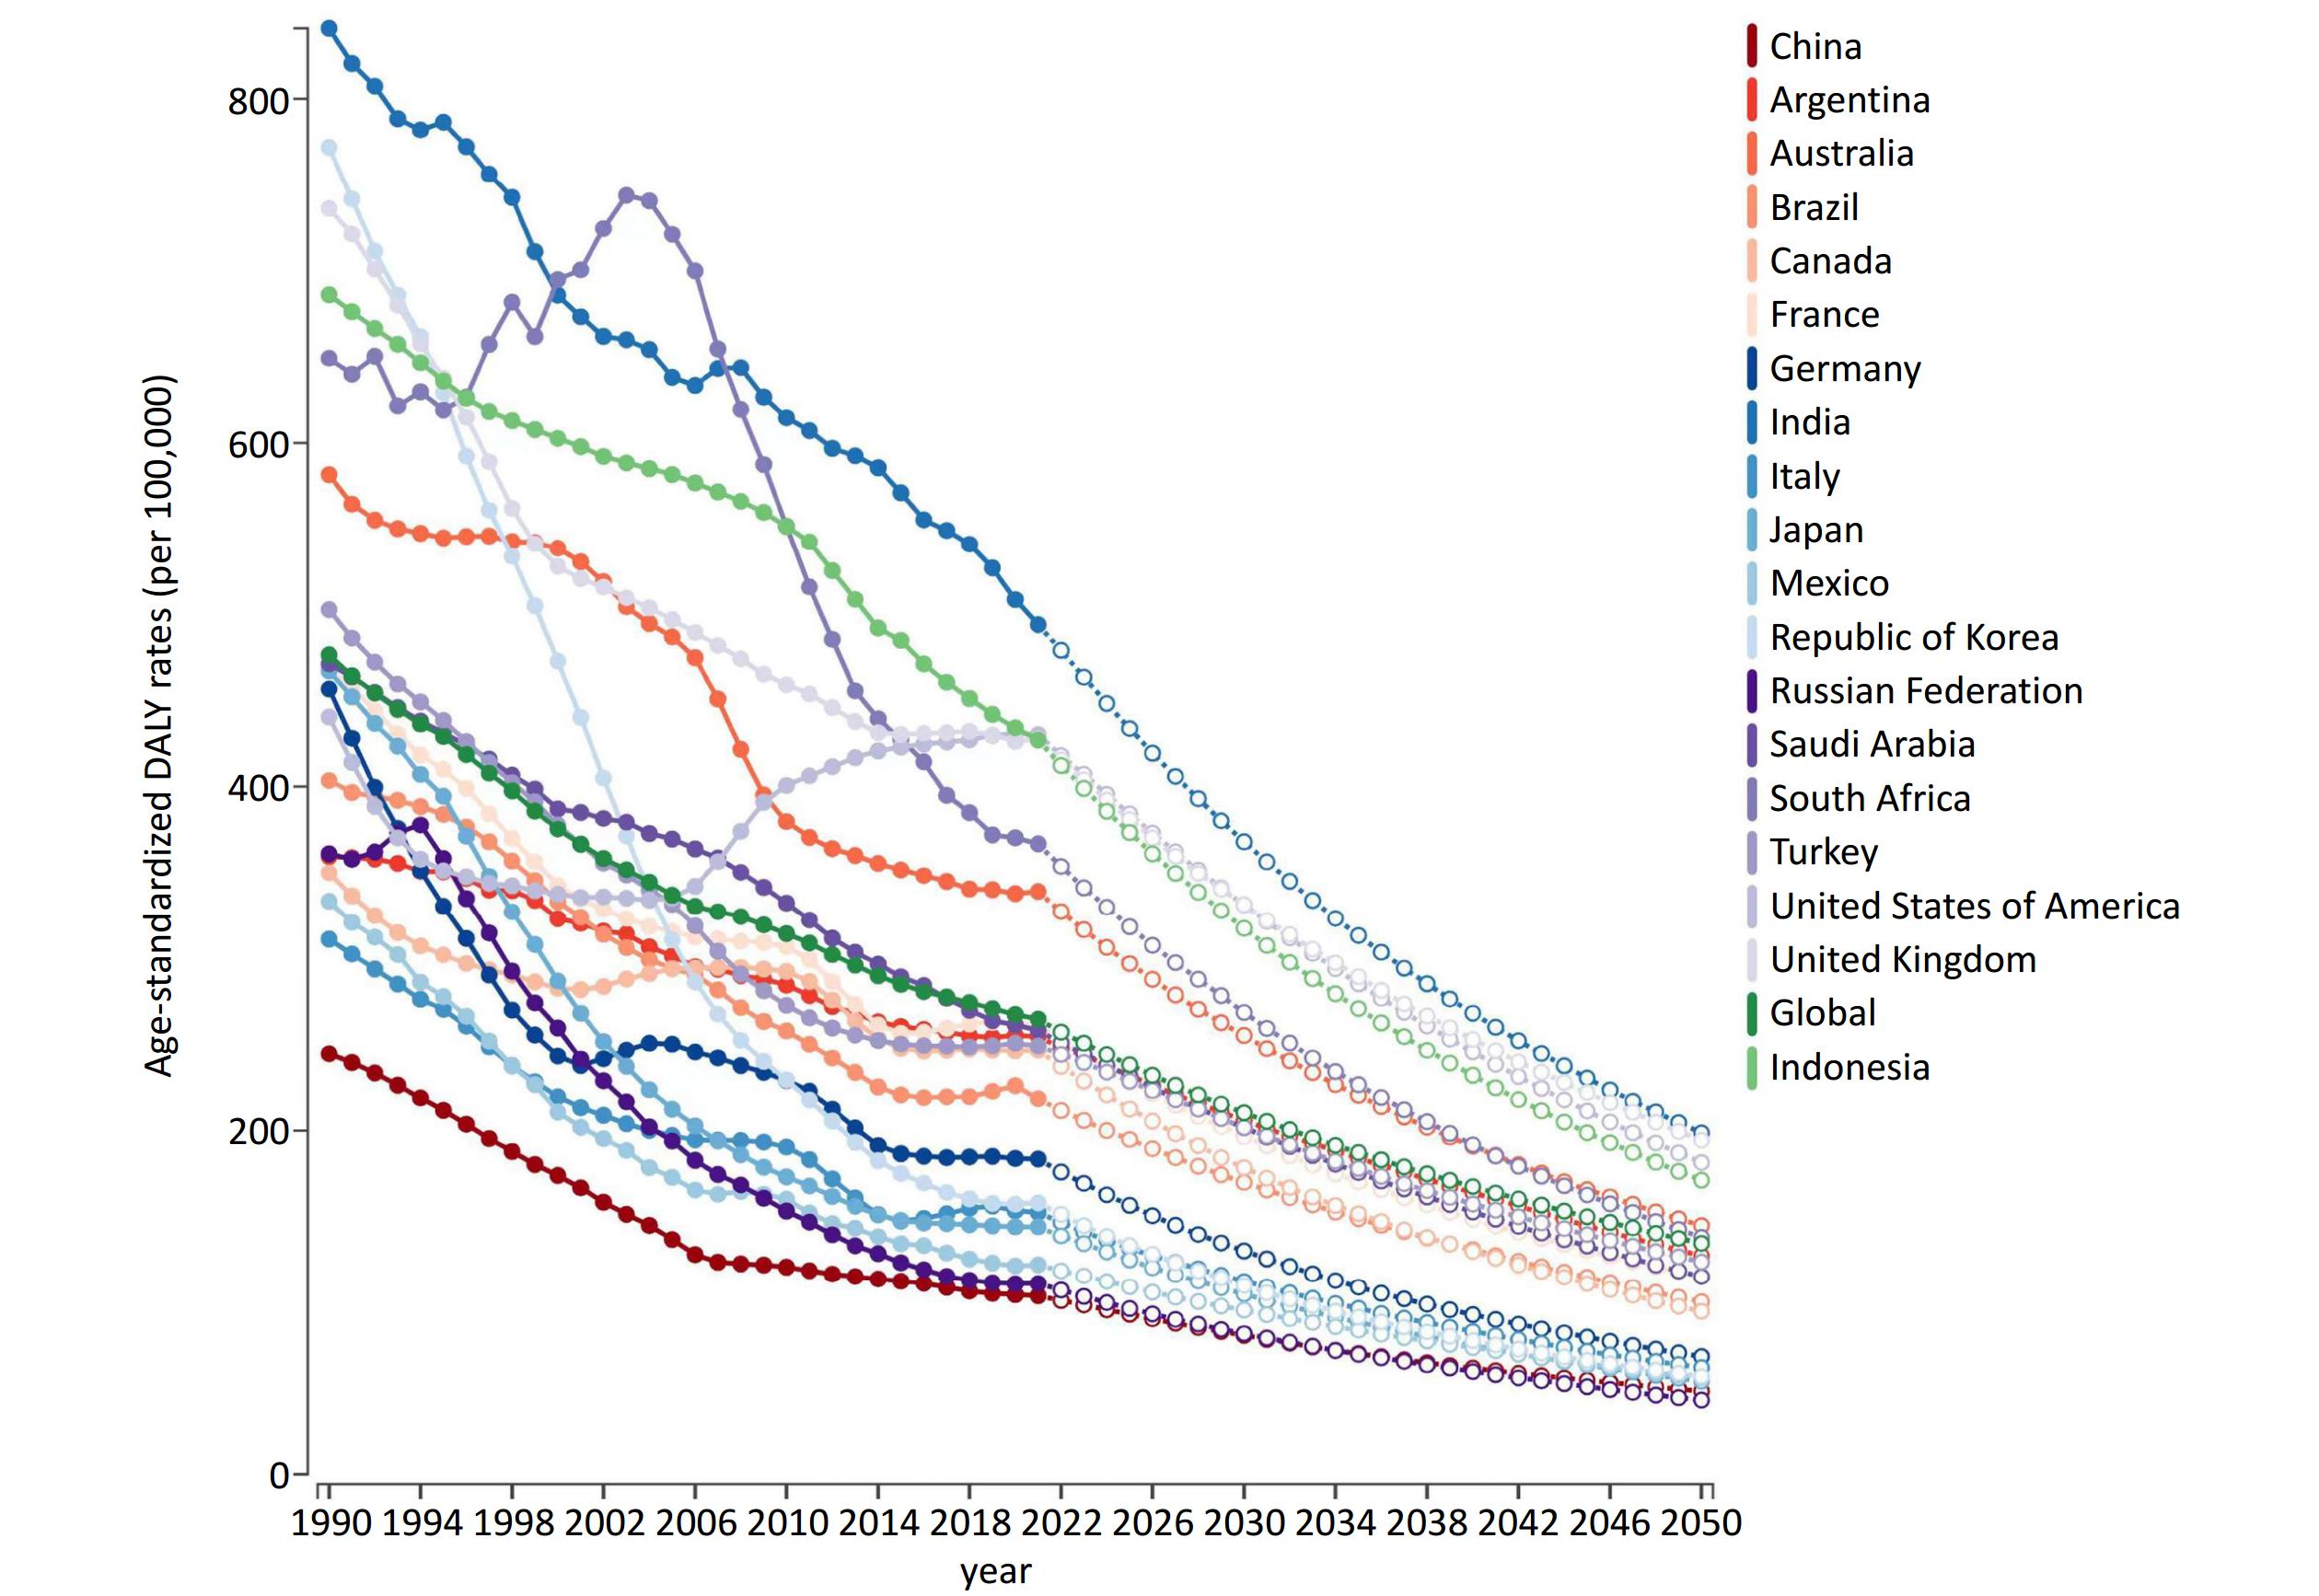
Figure 1 illustrates the variation in age-standardized DALY rates for asthma across 19 G20 member countries and the global average. The overall trend indicates a decline in DALY rates attributable to asthma. As of 2021 and earlier, China had the lowest standardized DALY rates for asthma among these countries. However, if current trends persist, the reduction in asthma-related DALYs in China by 2050 is projected to be smaller compared to other nations.
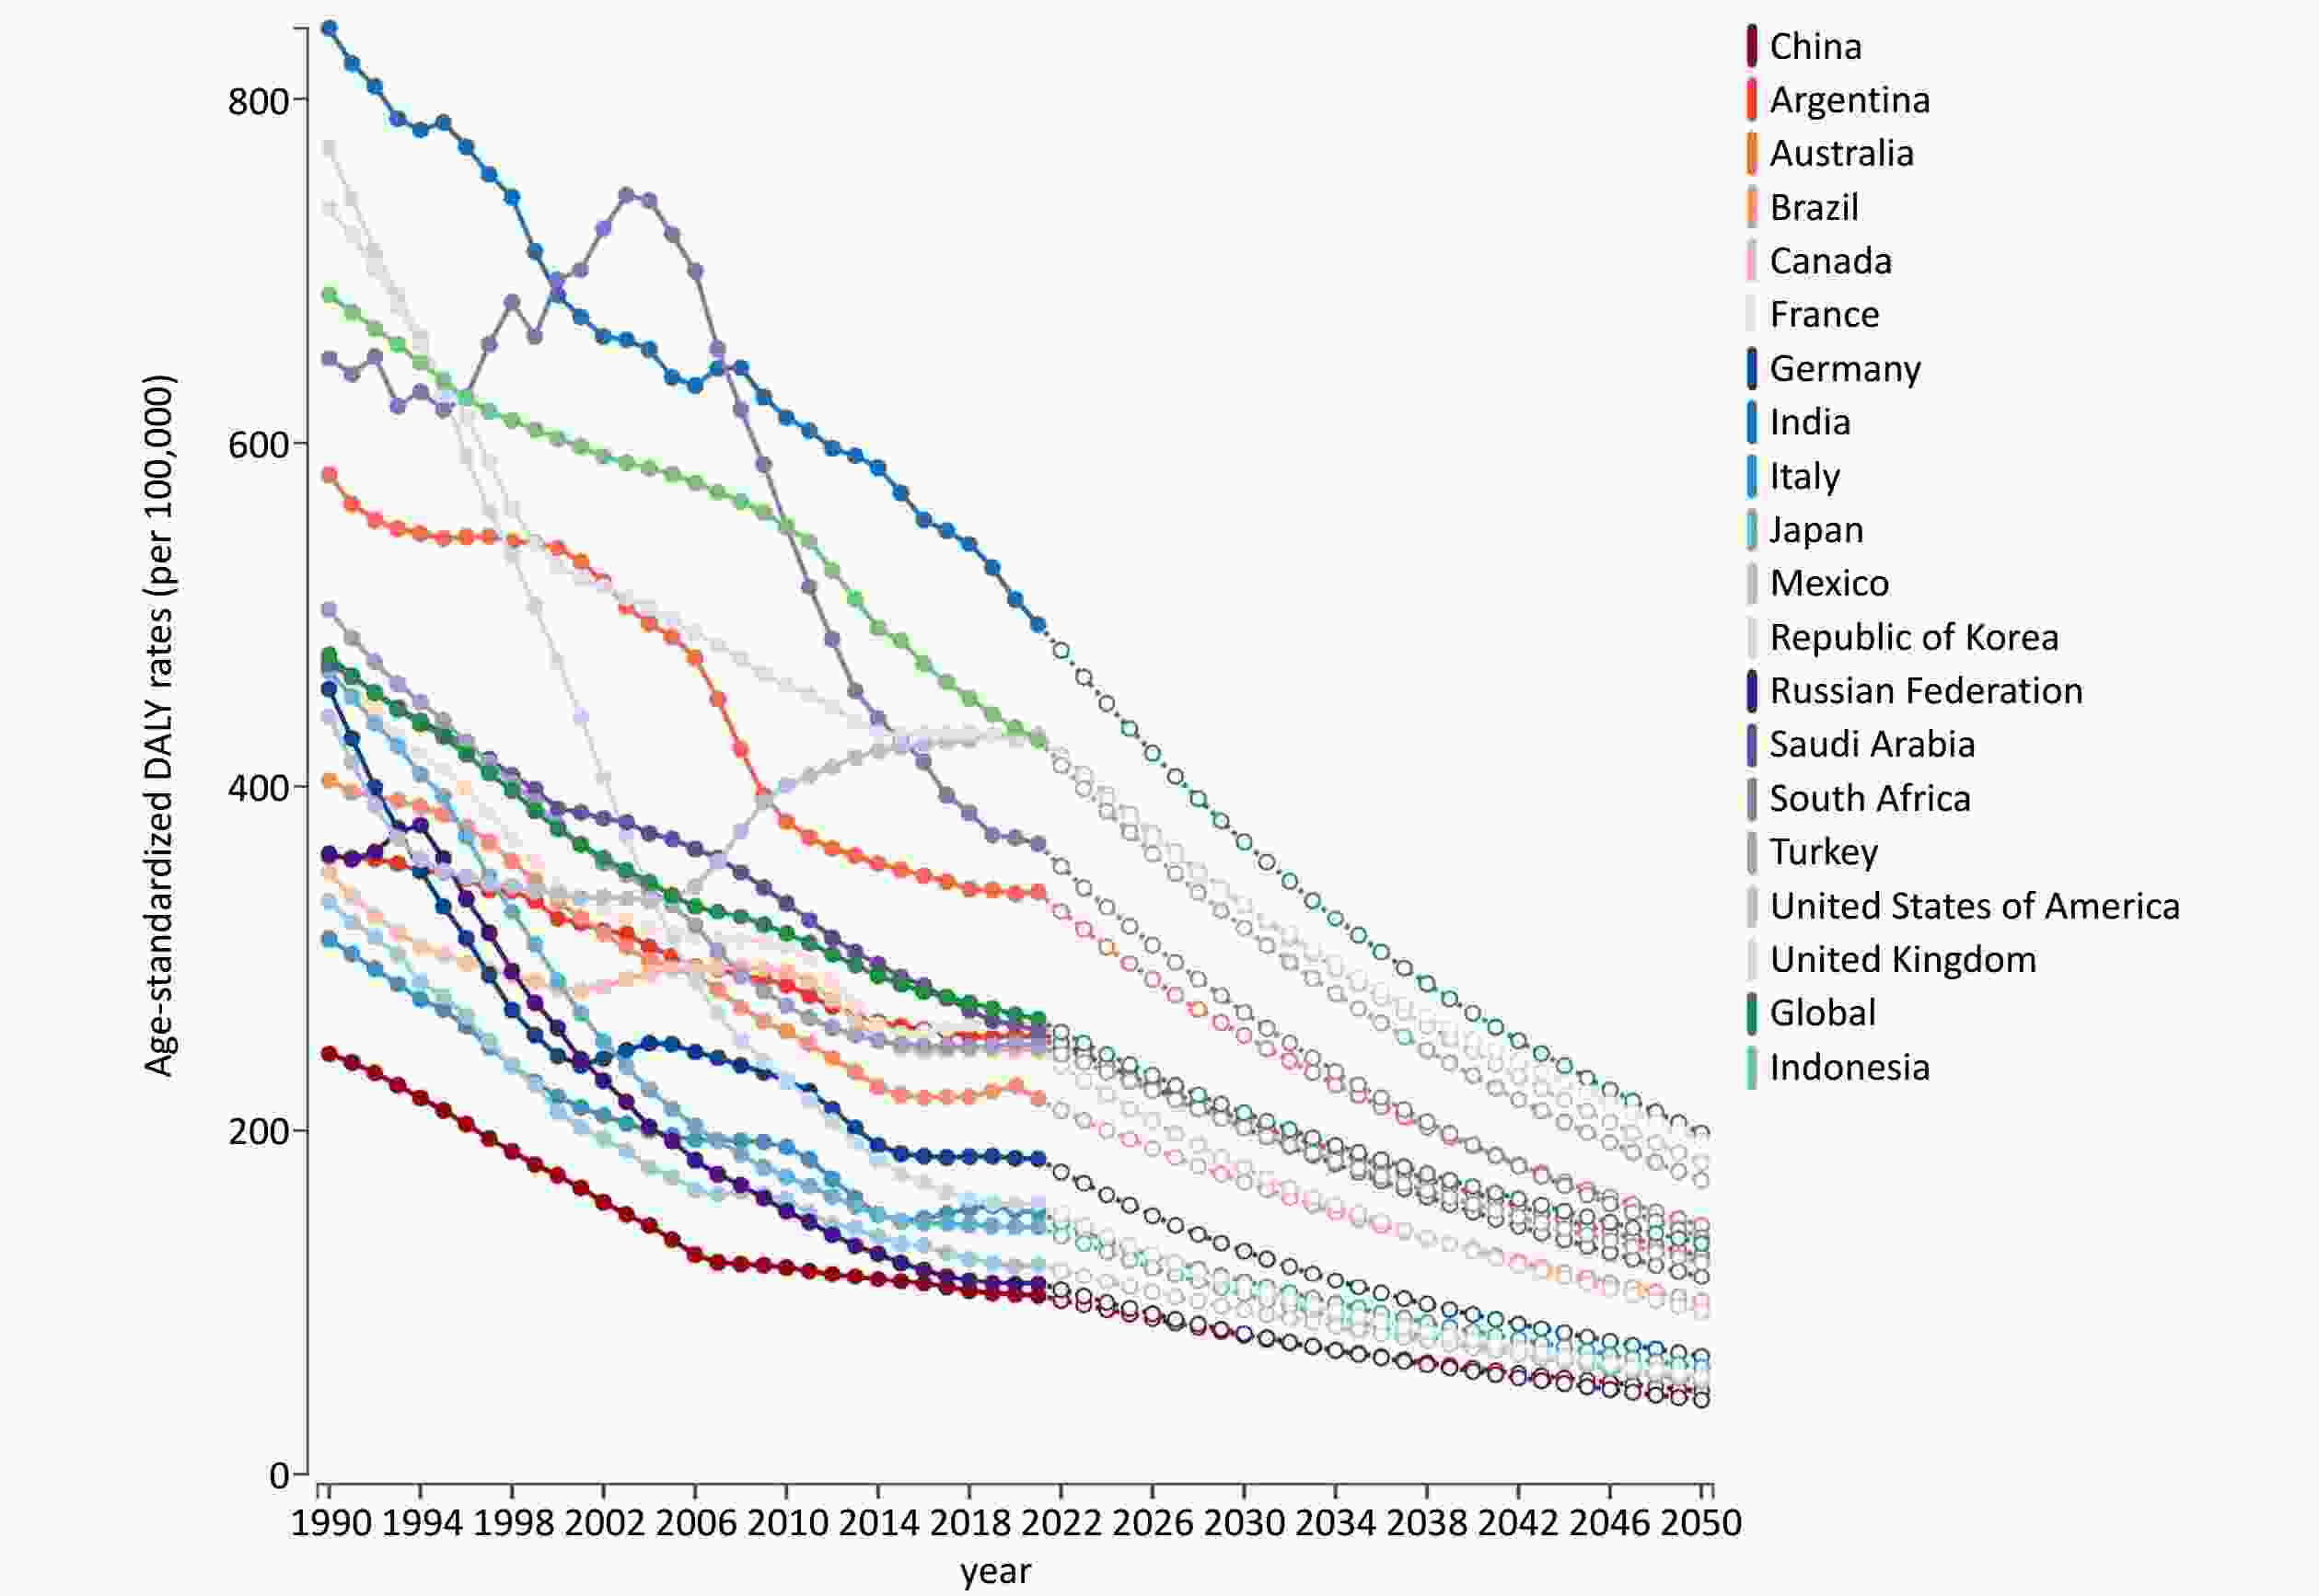
Figure 1. Trends in age-standardized DALY rates for asthma across 19 G20 member countries (with the 20th member represented by the European Union) and the global average.
Table 1 provides a detailed breakdown of China’s asthma disease burden for 2021, categorized by gender and age group. In 2021, China recorded 3,934,870 new asthma cases, affecting approximately 25.02 million individuals. The age-standardized incidence and prevalence rates were 364.17 per 100,000 (95% UI: 283.22–494.10) and 1,956.49 per 100,000 (95% UI: 1,566.68–2,491.87), respectively. Asthma resulted in 26,200 deaths and 1,467,420 DALYs, with a mortality rate of 1.47 per 100,000 (95% UI: 1.15–1.79) and a DALY rates of 103.76 per 100,000 (95% UI: 72.50–145.46). According to percentage change data, the incidence, prevalence, mortality, and DALY rates of asthma in China all declined to varying degrees in 2021 compared to 1990.
Table 1. Incidence, prevalence, mortality, and DALYs of asthma in 2021 by sex and age group, with percentage change in rates from 1990 to 2021
Age, years Incidence Prevalence Deaths DAYLs Number, in thousand, 2021 Rate, per 100,000, 2021 Percentage change of rate, 1990 to 2021 Number, in thousand, 2021 Rate, per 100,000, 2021 Percentage change of rate, 1990 to 2021 Number, in thousand, 2021 Rate, per 100,000, 2021 Percentage change of rate, 1990 to 2021 Number, in thousand, 2021 Rate, per 100,000, 2021 Percentage change of rate, 1990 to 2021 Male < 5 712.00 (415.68
to
1,173.65)1,710.28 (998.48
to
2,819.20)−0.28 (−0.38
to
−0.20)1,527.32 (874.59
to
2,329.66)3,668.75 (2,100.82
to
5,596.01)−0.26 (−0.34
to
−0.18)0.01 (0.01
to
0.02)0.03 (0.02
to
0.04)−0.98 (−0.99
to
−0.96)63.39 (30.47
to
110.90)152.27 (73.20
to
266.39)−0.52 (−0.69
to
−0.40)5–14 650.60 (345.82
to
1,071.35)671.17 (356.75
to
1,105.22)−0.09 (−0.13
to
−0.04)4,092.87 (2,700.33
to
6,339.83)4,222.26 (2,785.70
to
6,540.26)−0.21 (−0.34
to
−0.18)0.03 (0.02
to
0.04)0.03 (0.02
to
0.04)−0.94 (−0.95
to
−0.89)169.32 (90.57
to
307.99)174.68 (93.43
to
317.73)−0.32 (−0.42
to
−0.25)15–49 412.03 (303.43
to
529.35)119.57 (88.05
to
153.61)−0.34 (−0.40
to
−0.27)4,131.27 (3,119.41
to
5,289.55)1,198.85 (905.22
to
1,534.97)−0.28 (−0.34
to
−0.23)0.78 (0.58
to
1.03)0.23 (0.17
to
0.30)−0.67 (−0.82
to
−0.47)205.48 (135.36
to
292.86)59.63 (39.28
to
84.98)−0.43 (−0.55
to
−0.34)50–69 270.82 (212.29
to
343.66)142.24 (111.50
to
180.50)−0.59 (−0.62
to
−0.55)2,431.46 (2,039.68
to
2,884.72)1,277.10 (1,071.32
to
1,515.16)−0.54 (−0.57
to
−0.49)3.06 (2.14
to
4.28)1.61 (1.12
to
2.25)−0.79 (−0.89
to
−0.64)182.61 (137.76
to
237.82)95.91 (72.36
to
124.91)−0.71 (−0.82
to
−0.60)≥ 70 230.31 (173.44
to
290.99)422.23 (317.98
to
533.49)−0.38 (−0.48
to
−0.25)1,847.90 (1,543.54
to
2,193.15)3,387.86 (2,829.87
to
4,020.83)−0.53 (−0.58
to
−0.46)10.86 (7.62
to
14.02)19.91 (13.97
to
25.70)−0.67 (−0.86
to
−0.46)215.36 (165.08
to
264.09)394.82 (302.64
to
484.17)−0.67 (−0.83
to
−0.53)Subtotal 2,275.76 (1,833.61
to
2,996.79)404.54 (312.57
to
547.88)−0.28 (−0.33
to
−0.24)14,030.82 (11,637.94
to
17,253.95)2,155.10 (1,729.36
to
2,757.98)−0.33 (−0.37
to
−0.28)14.74 (10.32
to
19.30)1.95 (1.38
to
2.50)−0.73 (−0.88
to
−0.55)836.16 (609.77
to
1,142.17)118.88 (83.53
to
166.81)−0.56 (−0.70
to
−0.45)Female < 5 464.93 (266.67
to
783.39)1,290.12 (739.99
to
2,173.81)−0.32 (−0.40
to
−0.24)1,068.20 (609.50
to
1,625.49)2,964.12 (1,691.28
to
4,510.53)−0.31 (−0.39
to
−0.23)0.01 (0.00
to
0.02)0.02 (0.01
to
0.05)−0.98 (−0.99
to
−0.95)44.49 (21.66
to
77.66)123.44 (60.11
to
215.50)−0.59 (−0.74
to
−0.46)5–14 431.79 (233.98
to
705.89)507.82 (275.18
to
830.18)−0.09 (−0.14
to
−0.01)2,679.89 (1,747.91
to
4,132.93)3,151.77 (2,055.69
to
4,860.67)−0.23 (−0.29
to
−0.18)0.02 (0.01
to
0.03)0.02 (0.01
to
0.04)−0.95 (−0.97
to
−0.88)110.74 (58.57
to
200.39)130.24 (68.89
to
235.68)−0.34 (−0.44
to
−0.26)15–49 372.32 (277.42
to
474.66)116.83 (87.05
to
148.94)−0.45 (−0.50
to
−0.38)3,599.73 (2,750.97
to
4,559.78)1,129.51 (863.19
to
1,430.75)−0.37 (−0.43
to
−0.31)0.55 (0.38
to
0.84)0.17 (0.12
to
0.26)−0.72 (−0.83
to
−0.48)170.75 (108.10
to
245.06)53.58 (33.92
to
76.89)−0.49 (−0.58
to
−0.40)50–69 214.60 (161.04
to
273.64)112.87 (84.70
to
143.93)−0.67 (−0.70
to
−0.64)2,139.23 (1,751.24
to
2,583.54)1,125.20 (921.12
to
1,358.90)−0.63 (−0.66
to
−0.59)1.85 (1.20
to
2.72)0.97 (0.63
to
1.43)−0.80 (−0.90
to
−0.60)135.64 (99.18
to
174.60)71.35 (52.17
to
91.83)−0.72 (−0.81
to
−0.61)70+ 175.48 (130.98
to
221.84)270.97 (202.25
to
342.56)−0.53 (−0.59
to
−0.42)1,497.81 (1,253.71
to
1,767.98)2,312.88 (1,935.95
to
2,730.07)−0.65 (−0.69
to
−0.60)9.06 (6.08
to
12.62)13.99 (9.39
to
19.48)−0.70 (−0.86
to
−0.41)169.64 (128.02
to
217.09)261.95 (197.69
to
335.22)−0.72 (−0.83
to
−0.54)Subtotal 1,659.12 (1,355.46
to
2,126.97)319.56 (248.24
to
429.99)−0.34 (−0.39
to
−0.30)10,984.85 (9,212.87
to
13,218.70)1,746.77 (1,403.11
to
2,206.59)−0.41 (−0.46
to
−0.34)11.49 (7.87
to
16.02)1.14 (0.78
to
1.59)−0.77 (−0.88
to
−0.56)631.25 (452.13
to
838.67)89.68 (62.21
to
124.99)−0.60 (−0.71
to
−0.50)Total < 5 1,176.93 (681.39
to
1,961.19)1,515.33 (877.31
to
2,525.09)−0.30 (−0.38
to
−0.21)2,595.53 (1,489.39
to
3,954.25)3,341.81 (1,917.63
to
5,091.20)−0.28 (−0.36
to
−0.20)0.02 (0.01
to
0.03)0.03 (0.02
to
0.04)−0.98 (−0.99
to
−0.96)107.88 (52.11
to
188.20)138.90 (67.09
to
242.32)−0.55 (−0.71
to
−0.42)5–14 1,082.39 (587.66
to
1,783.02)594.84 (322.95
to
979.88)−0.09 (−0.12
to
−0.03)6,772.75 (4,448.85
to
10,433.86)3,722.04 (2,444.92
to
5,734.05)−0.21 (−0.27
to
−0.17)0.05 (0.04
to
0.07)0.03 (0.02
to
0.04)−0.94 (−0.96
to
−0.89)280.06 (149.33
to
509.47)153.91 (82.07
to
279.98)−0.32 (−0.42
to
−0.25)15–49 784.35 (580.80
to
1,004.93)118.25 (87.56
to
151.51)−0.40 (−0.45
to
−0.34)7,730.99 (5,890.46
to
9,781.03)1,165.53 (888.05
to
1,474.60)−0.33 (−0.38
to
−0.27)1.33 (1.06
to
1.68)0.20 (0.16
to
0.25)−0.69 (−0.80
to
−0.56)376.23 (246.50
to
540.08)56.72 (37.16
to
81.42)−0.46 (−0.54
to
−0.39)50–69 485.42 (370.62
to
620.91)127.57 (97.40
to
163.18)−0.63 (−0.66
to
−0.59)4,570.69 (3,786.65
to
5,457.26)1,201.20 (995.15
to
1,434.19)−0.58 (−0.62
to
−0.55)4.91 (3.80
to
6.23)1.29 (1.00
to
1.64)−0.79 (−0.88
to
−0.69)318.26 (242.81
to
398.80)83.64 (63.81
to
104.81)−0.71 (−0.79
to
−0.65)70+ 405.79 (304.41
to
512.06)340.13 (255.16
to
429.21)−0.45 (−0.53
to
−0.33)3,345.70 (2,805.37
to
3,960.70)2,804.35 (2,351.44
to
3,319.84)−0.59 (−0.63
to
−0.53)19.92 (15.51
to
24.15)16.70 (13.00
to
20.24)−0.69 (−0.82
to
−0.53)384.99 (308.54
to
459.36)322.70 (258.61
to
385.03)−0.69 (−0.80
to
−0.59)Subtotal 3,934.87 (3,183.31
to
5,136.13)364.17 (283.22
to
494.10)−0.31 (−0.35
to
−0.27)25,015.67 (20,898.41
to
30,448.11)1,956.49 (1,566.68
to
2,491.87)−0.37 (−0.41
to
−0.33)26.23 (20.58
to
31.84)1.47 (1.15
to
1.79)−0.75 (−0.85
to
−0.63)1,467.42 (1,072.76
to
1,947.20)103.76 (72.50
to
145.46)−0.58 (−0.68
to
−0.50)Note. DALYs: disability−adjusted life years. In 2021, we observed a notably higher incidence rate of asthma among children under five years old, with a rate of 1,515.33 per 100,000 (95% UI: 877.31–2,525.09) in China. This age group experienced the highest asthma burden, emphasizing the urgent need for targeted interventions in early childhood. Additionally, the prevalence rate for individuals aged 5 to 14 years peaked at 3,722.04 per 100,000 (95% UI: 2,444.92–5,734.05), indicating that this period is critical for asthma management during adolescence. The mortality and DALY rates for asthma were highest among the elderly, with rates of 16.70 per 100,000 (95% UI: 13.00–20.24) and 322.70 per 100,000 (95% UI: 258.61–385.03), respectively. These findings were consistent across both genders, underscoring the widespread impact of asthma. However, in 2021, the data revealed that Chinese men had higher incidence, prevalence, mortality, and DALY rates for asthma compared to women, as detailed in Table 1.
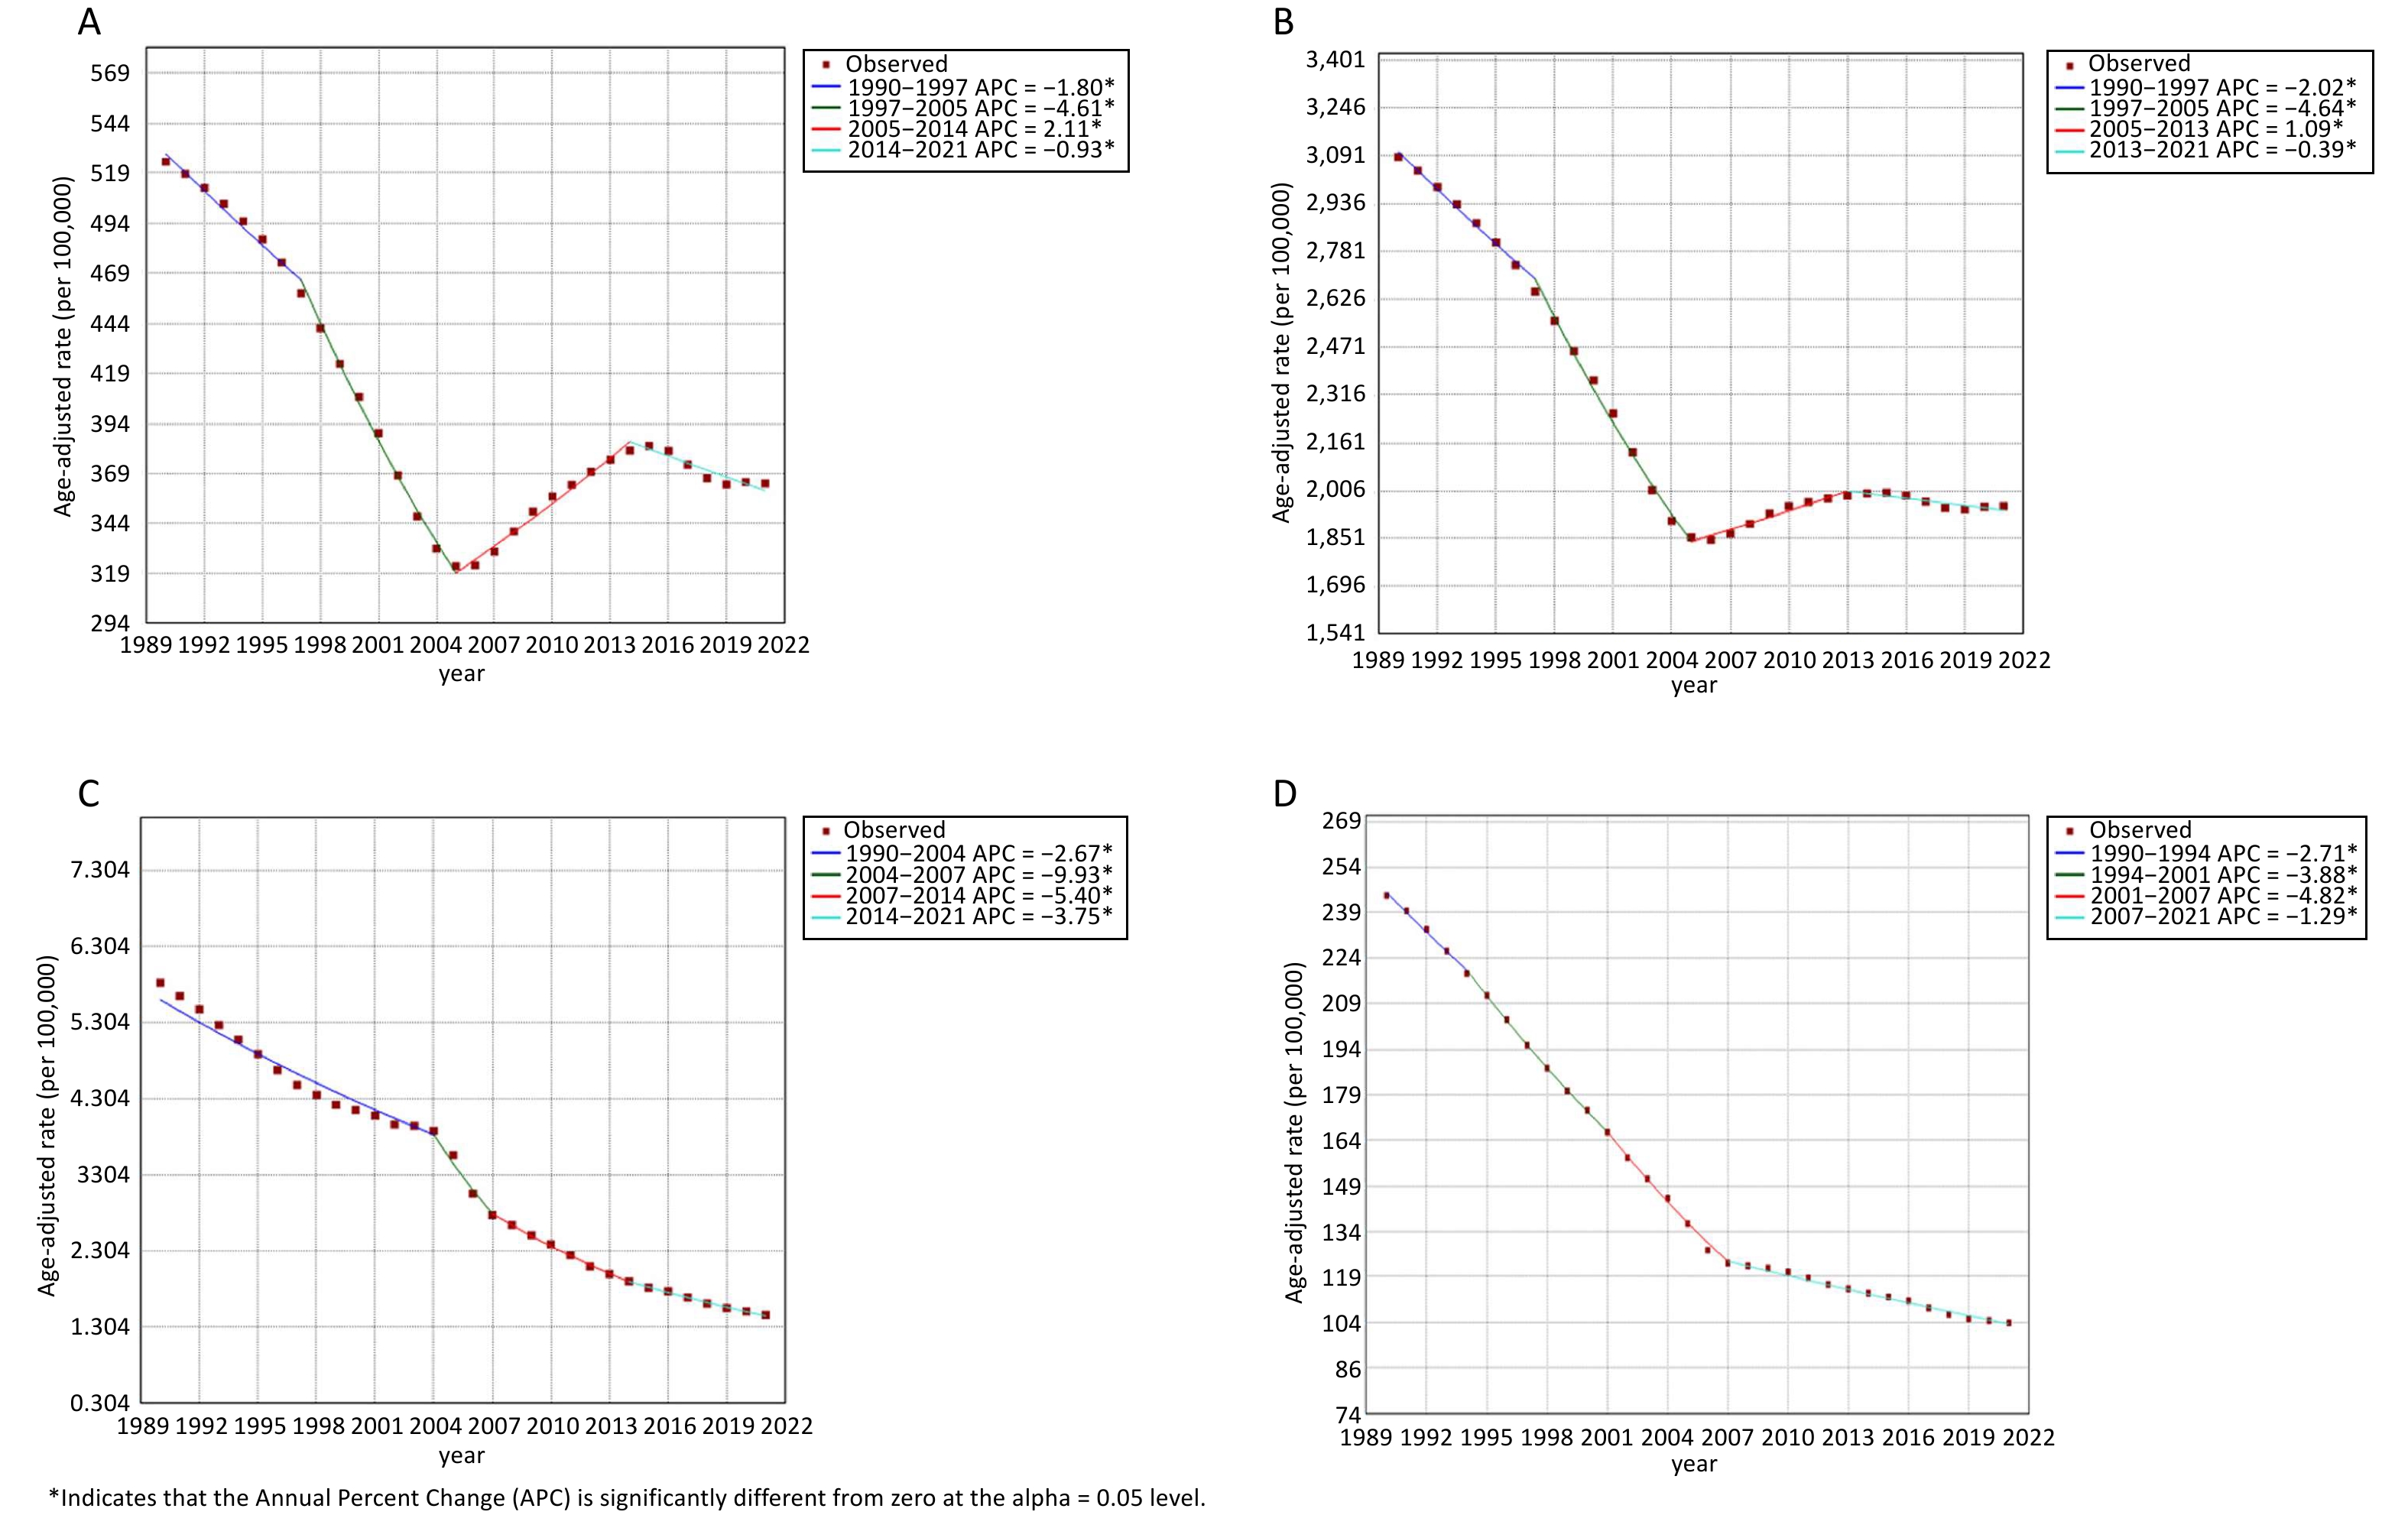
Figure 2 illustrates the Joinpoint regression analysis of age-standardized asthma incidence, prevalence, mortality, and DALY rates in China from 1990 to 2021. Using Joinpoint regression analysis, we observed an upward trajectory in asthma incidence from 2005 to 2014, and a similar trend in prevalence from 2005 to 2013. Conversely, both the mortality and DALY rates exhibited a downward trend, with the most pronounced declines occurring between 2004 and 2007 for mortality and from 2001 to 2007 for DALYs.
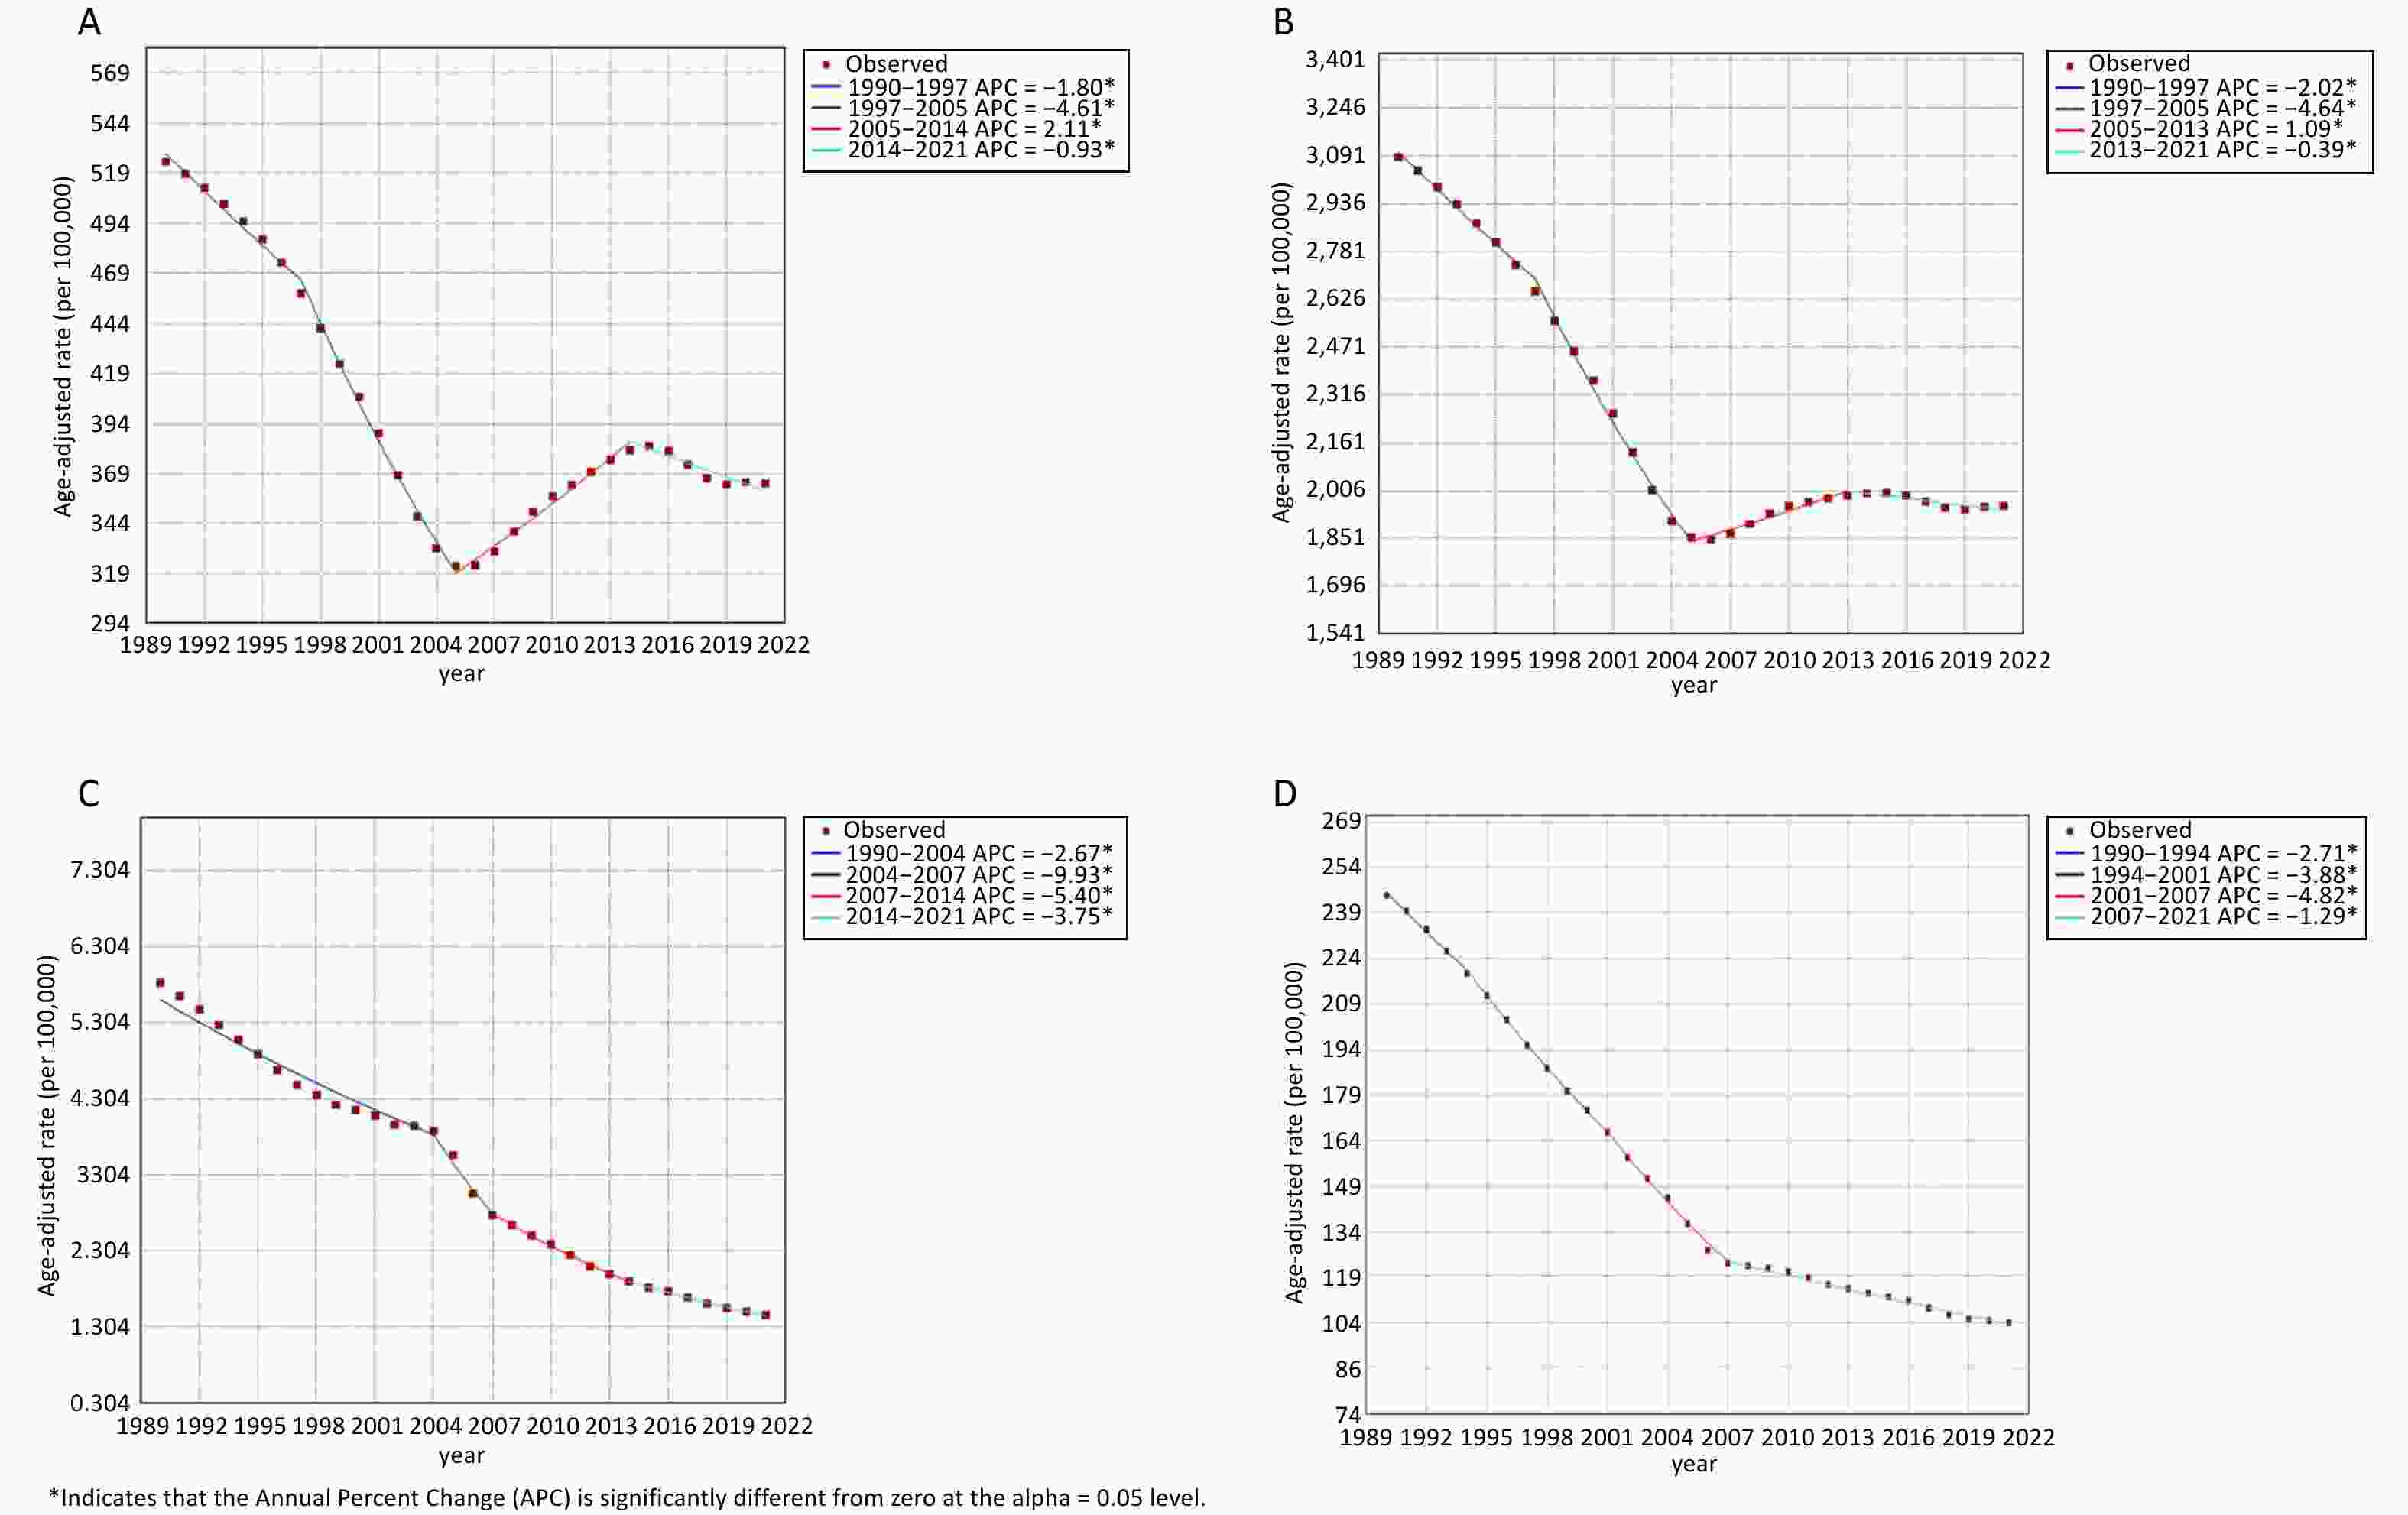
Figure 2. Joinpoint analysis of age-standardized asthma incidence, prevalence, mortality, and DALY rates in China (1990–2021). DALY, disability−adjusted life years; APC, annual percentage change.
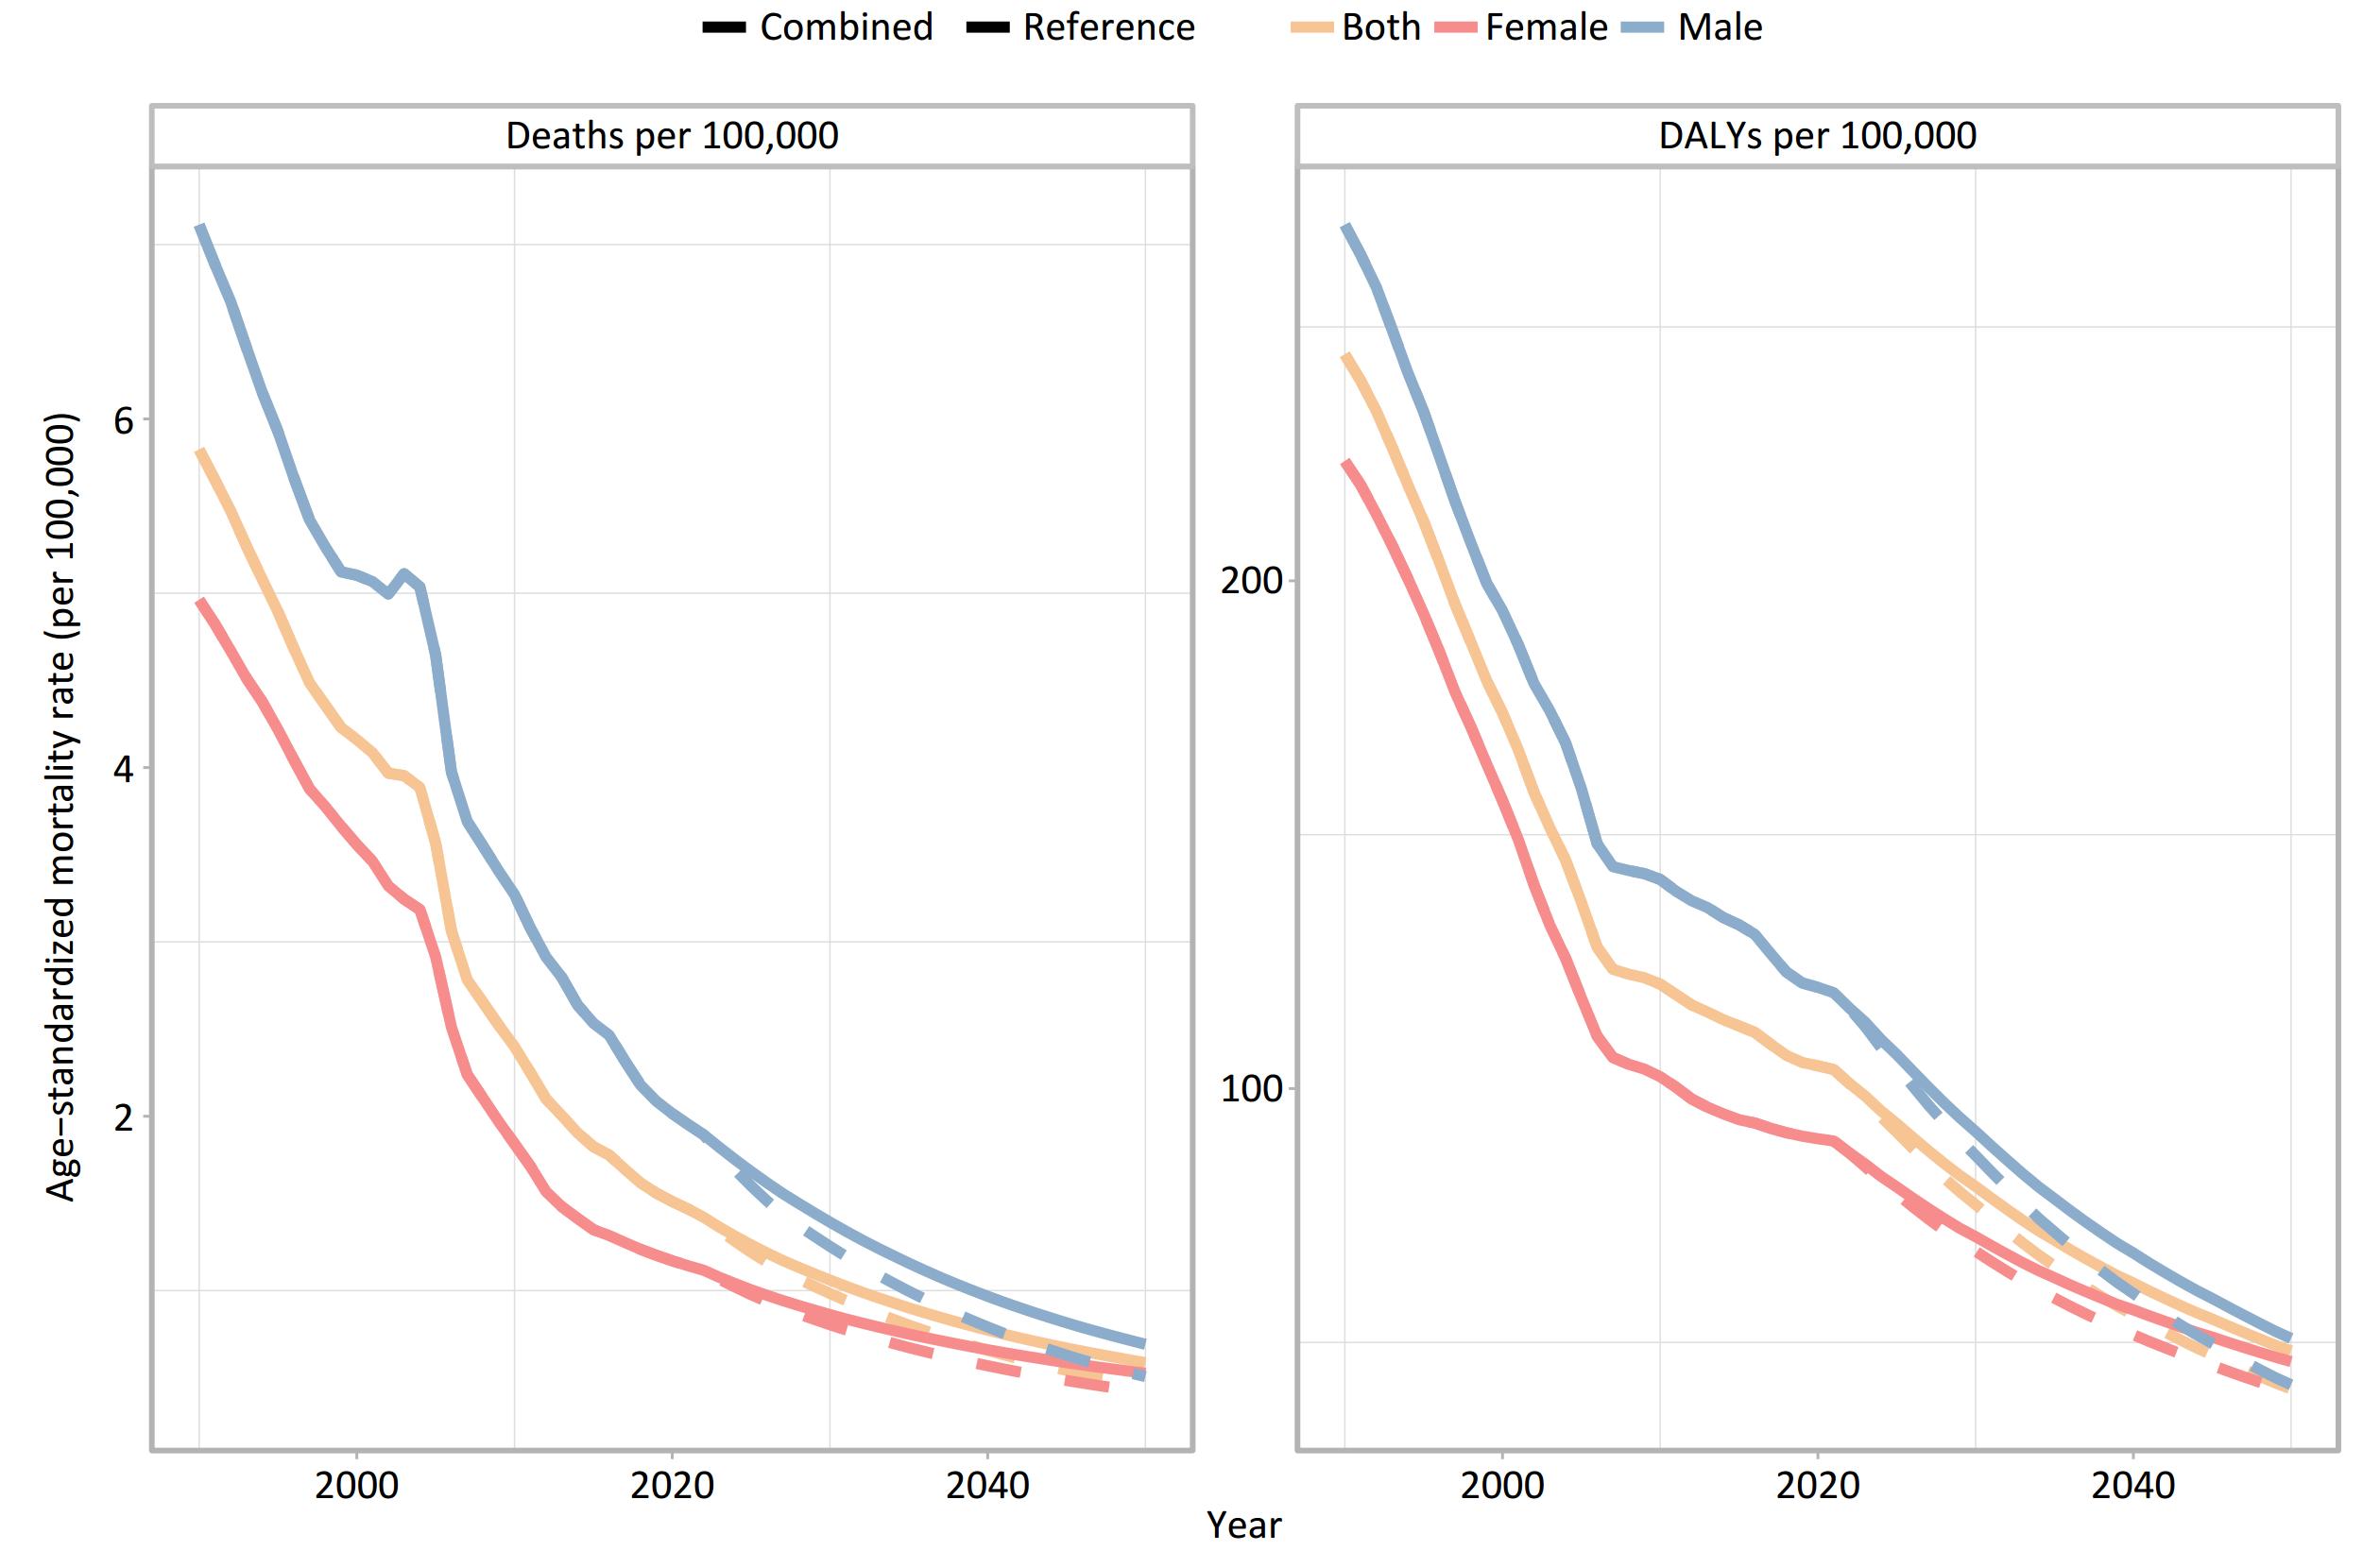
Figure 3 presents a gender-disaggregated analysis of the asthma burden in China from 1990 to 2021, along with projections for 2050 under two scenarios: the reference scenario and the combined scenario. Over the observed period, age-standardized mortality and DALY rates for asthma have exhibited a declining trend, with males consistently experiencing a higher disease burden than females. This pattern is expected to persist into 2050 under the reference scenario. However, in the combined scenario, where all modifiable risk factors are addressed, the projected reduction in DALYs for males is significantly greater than that for females.

Figure 3. Trends in age-standardized mortality and DALY rates for asthma by sex in China from 1990 to 2050. DALY, disability−adjusted life years.
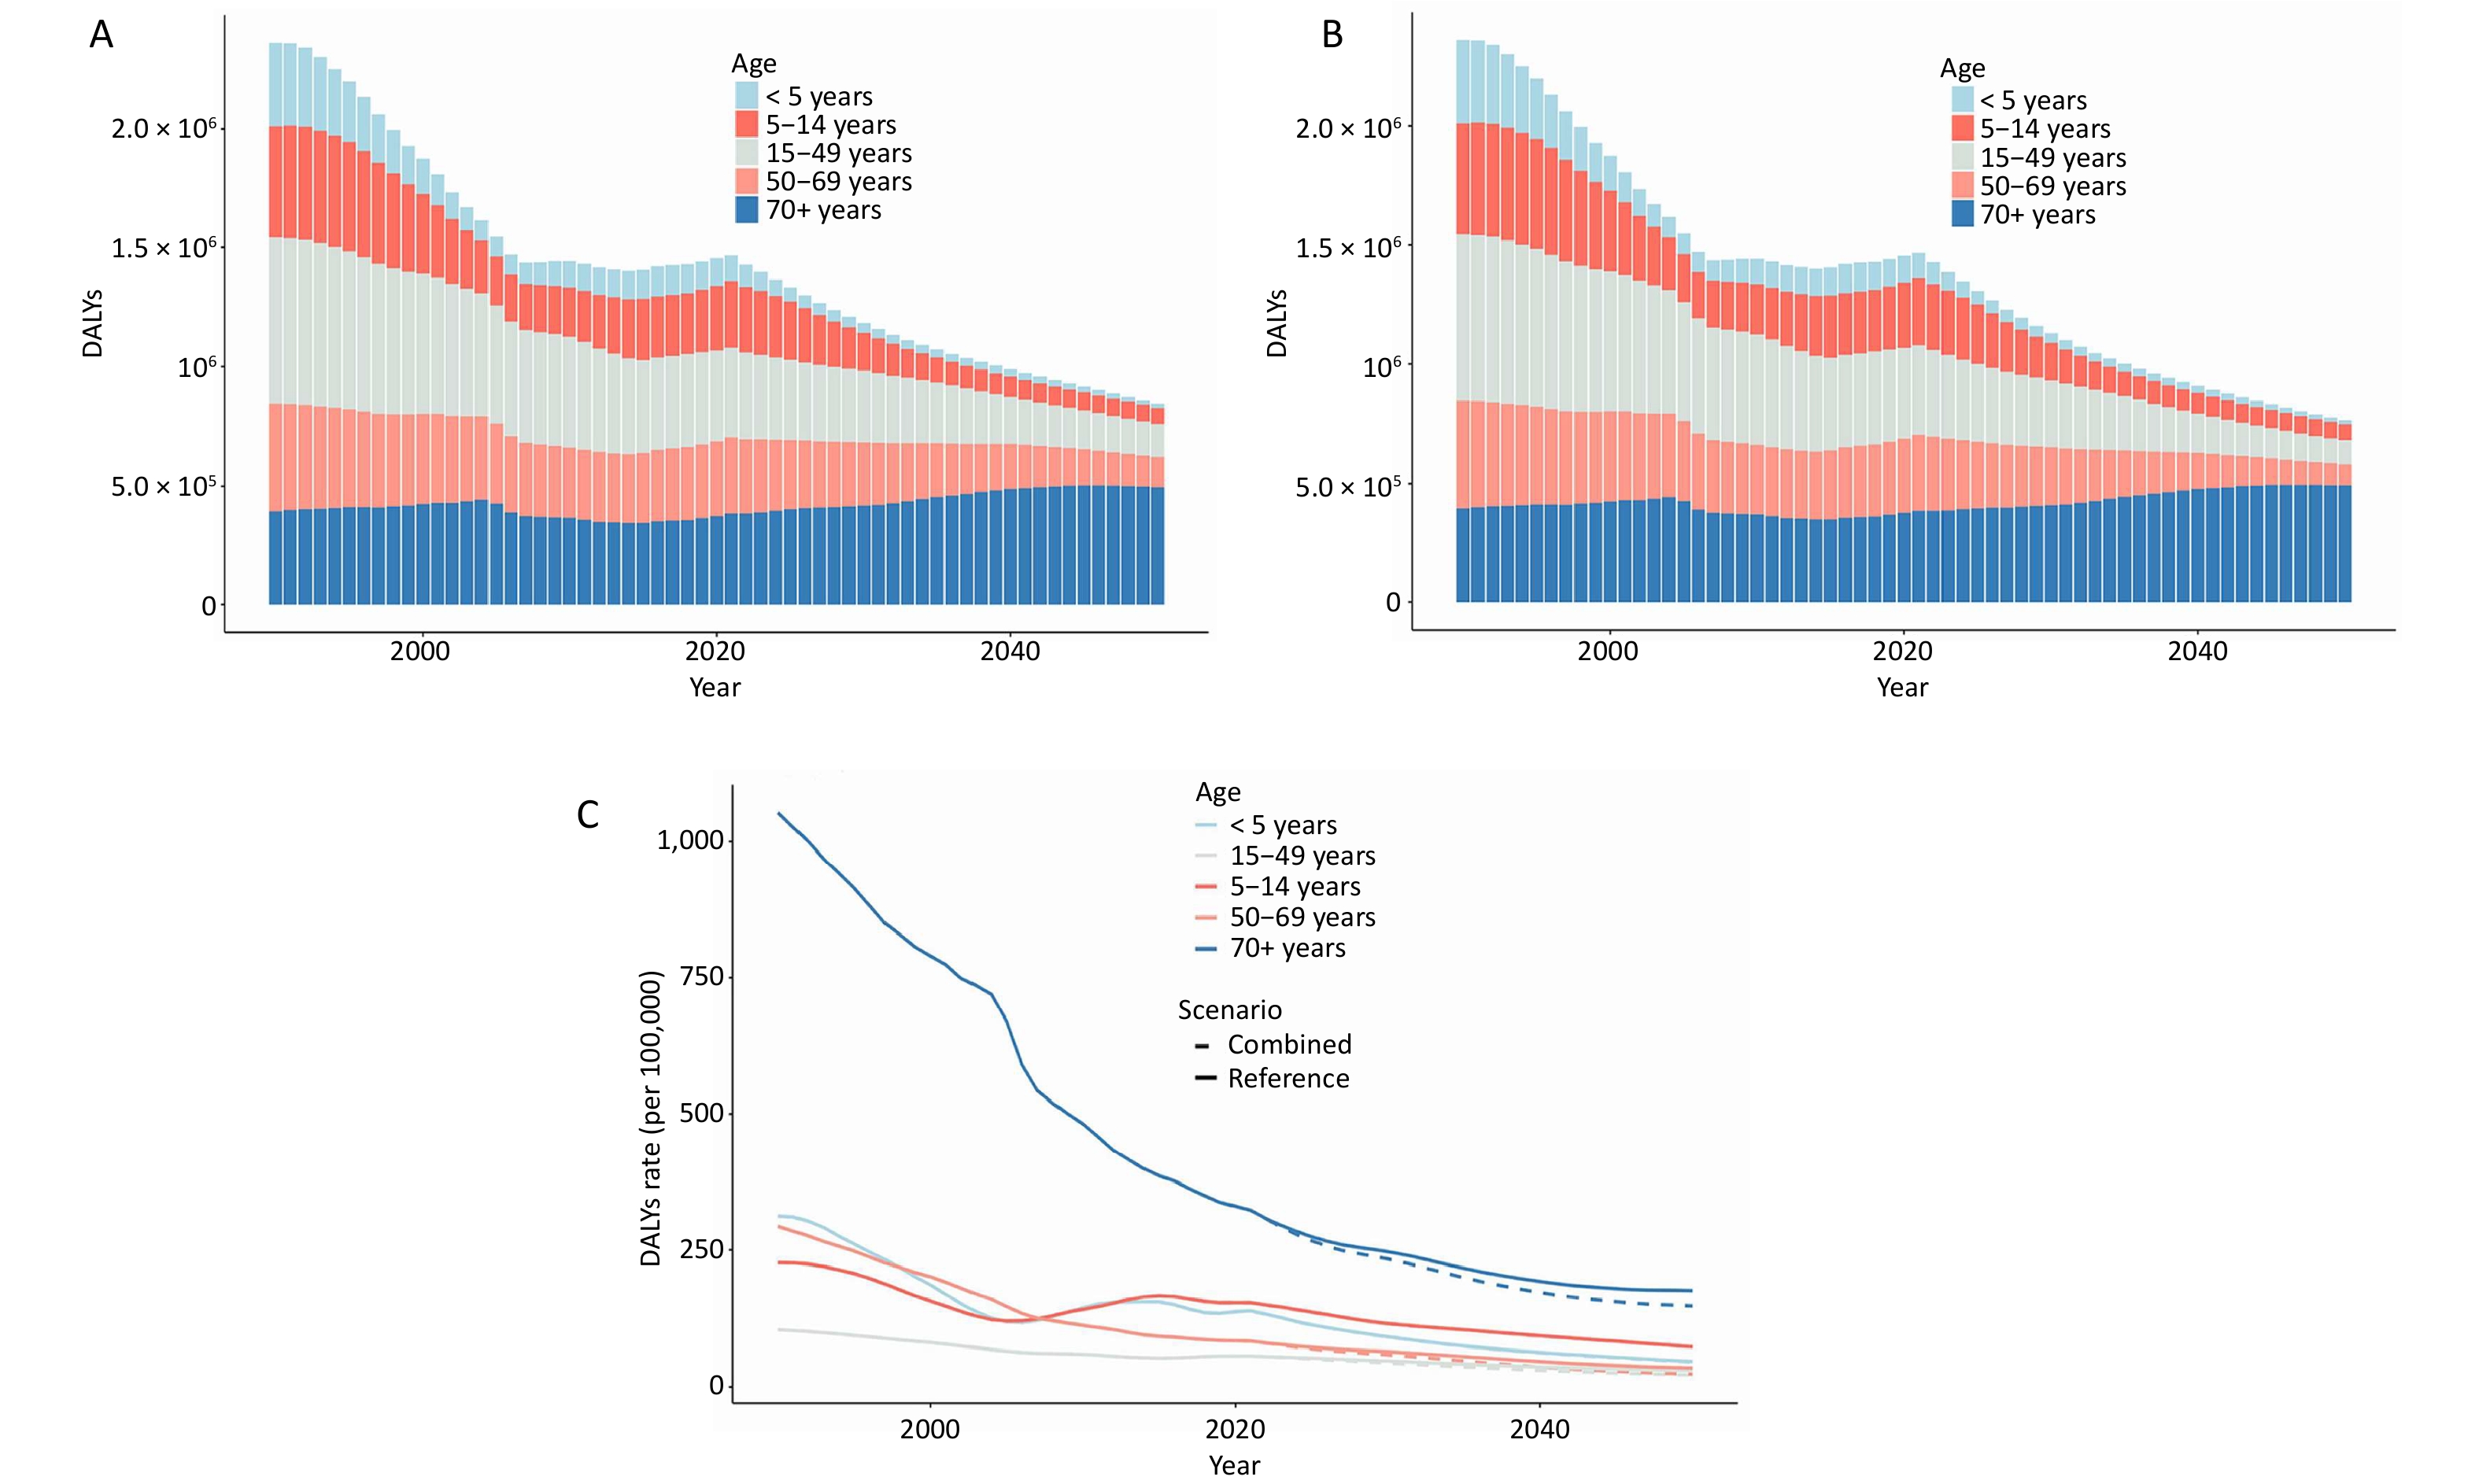
Figure 4 illustrates the temporal evolution of both the number and rate of DALYs across different age cohorts of asthma sufferers in China from 1990 to 2021. Additionally, it projects the asthma disease burden in 2050 under two distinct scenarios: the reference scenario and the combined scenario. Notably, the ≥ 70 age group exhibited the highest asthma-related burden in both 1990 and 2021. Projections based on the reference scenario suggest that this demographic will continue to bear the greatest burden in 2050. However, if all modifiable risk factors are effectively addressed, the DALY rates for the ≥ 70 age group is expected to undergo the most substantial reduction compared to the reference scenario.
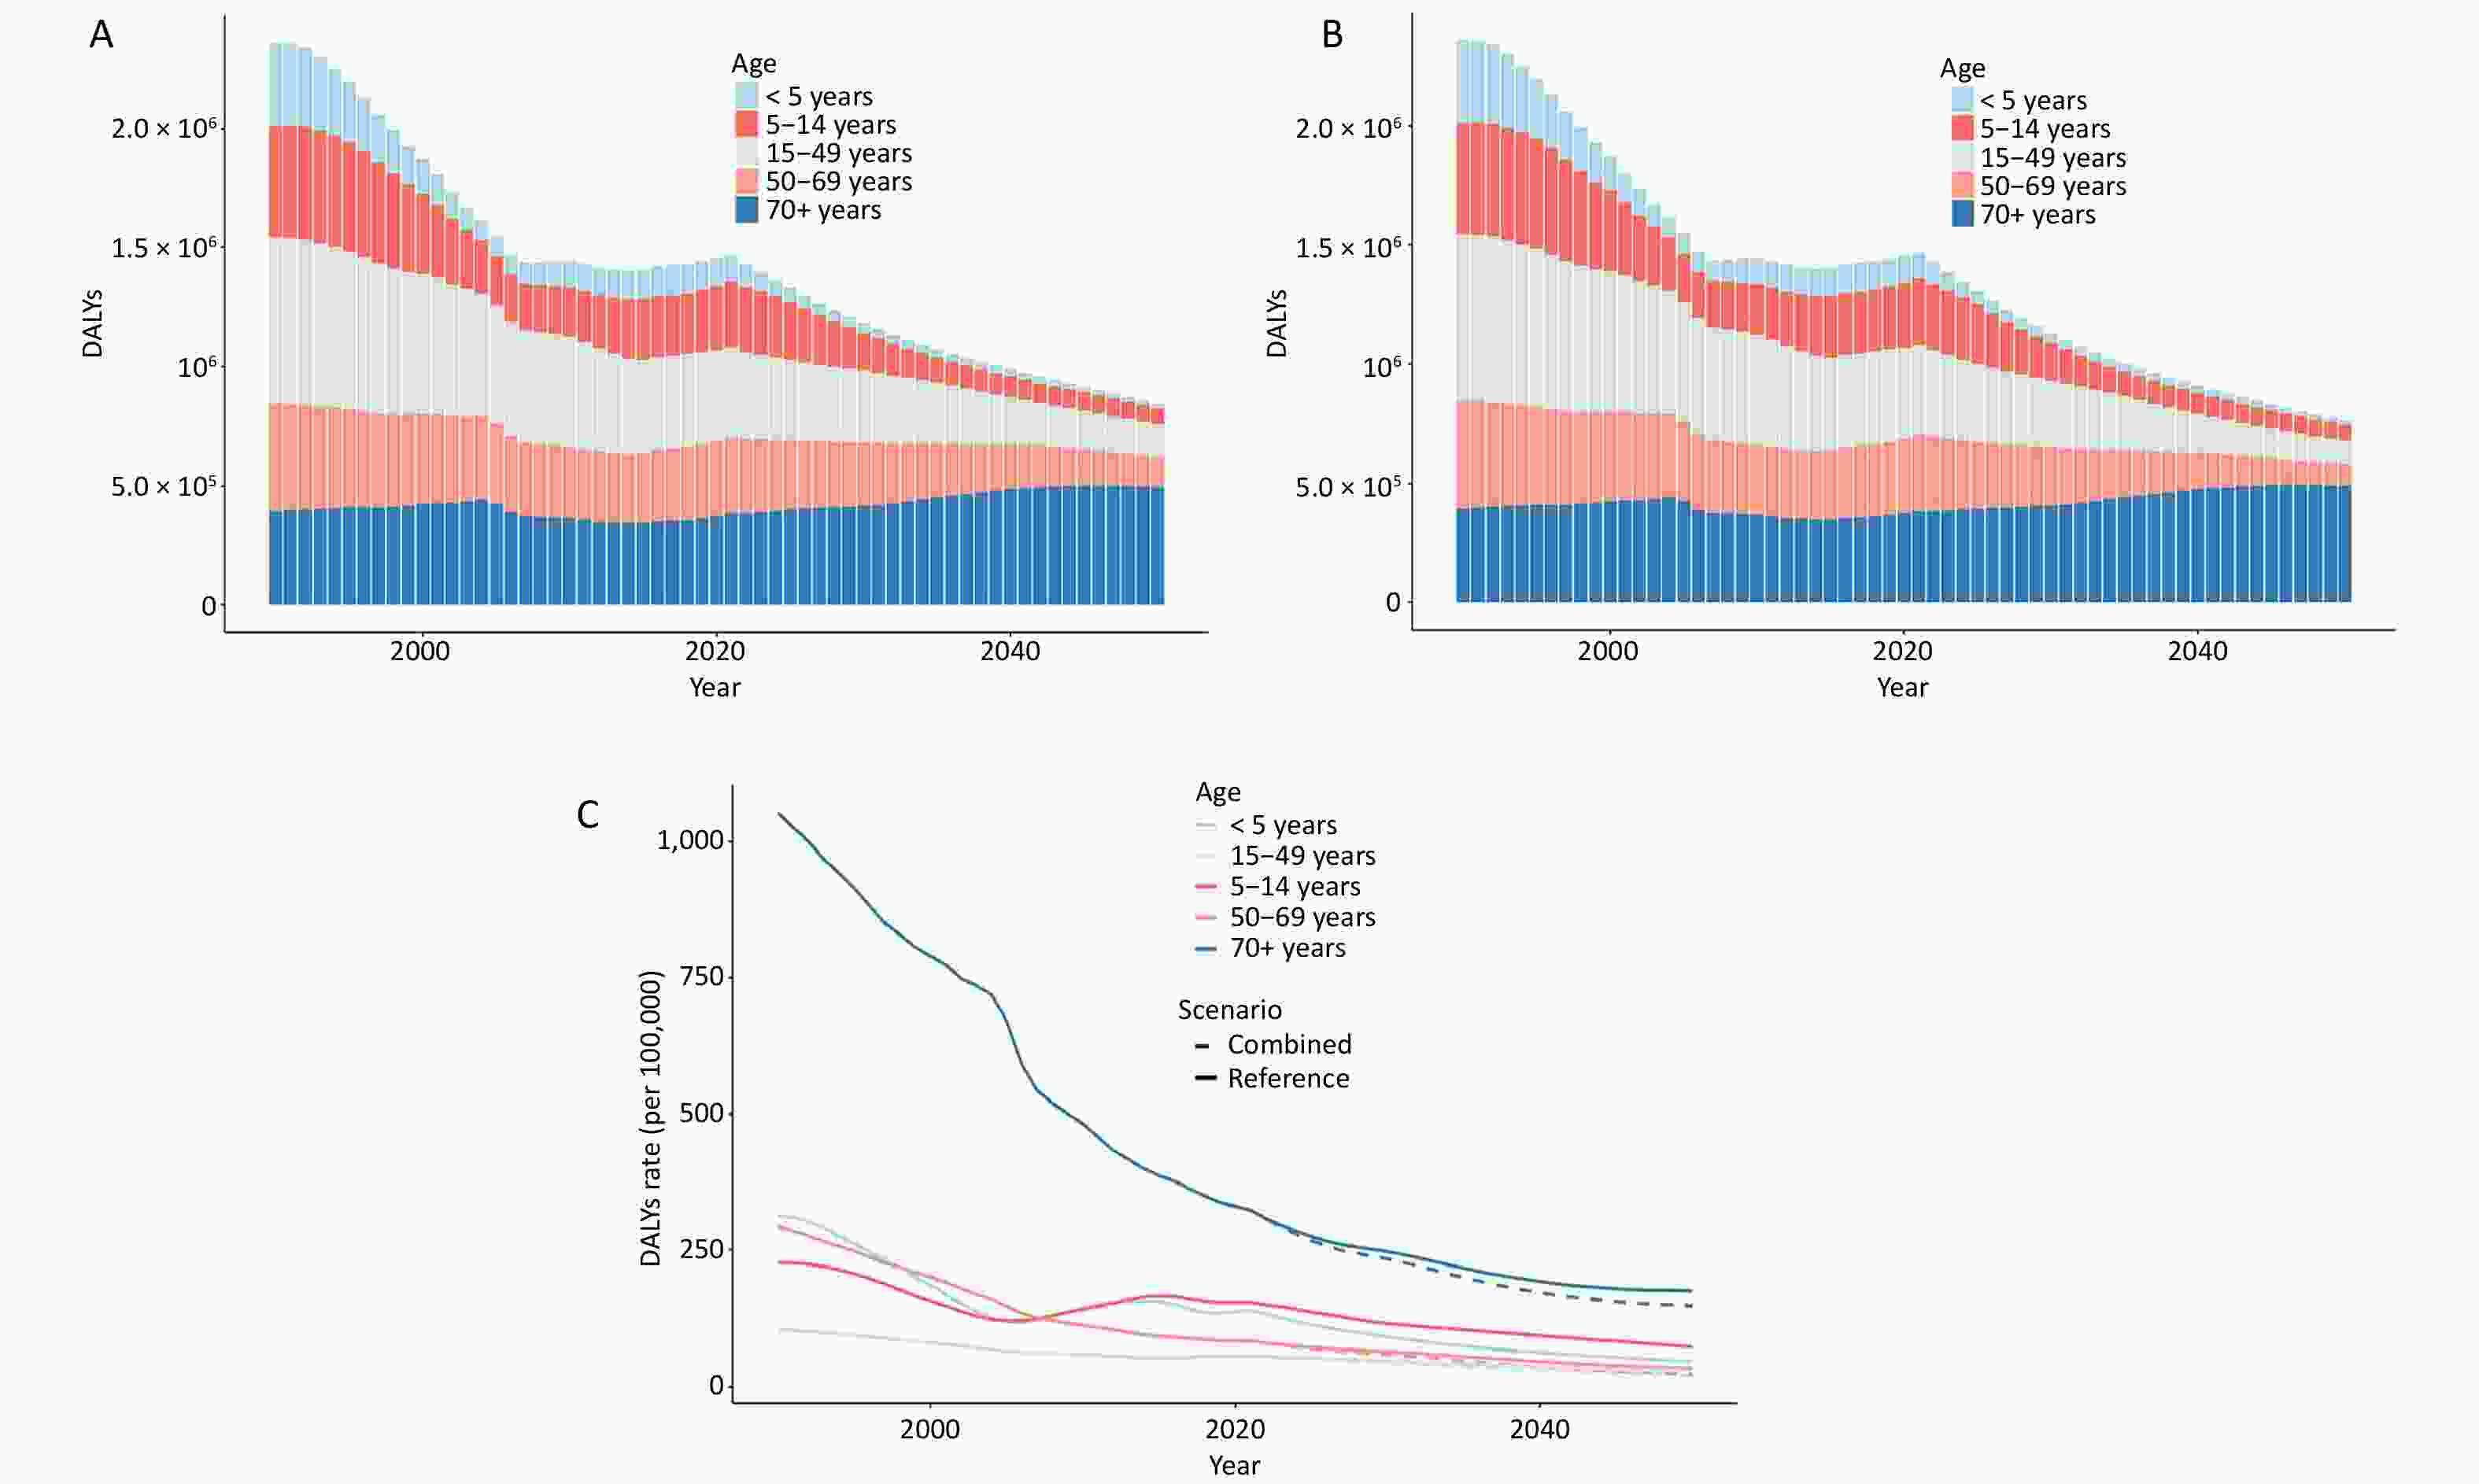
Figure 4. Trends in the number and rate of DALYs for asthma in China by age group from 1990 to 2050. (A) Changes in DALY numbers under the reference scenario. (B) Change in DALY numbers under the combined scenario. (C) Changes in DALY rates across different scenarios. DALY, disability−adjusted life years.
-
From 1990 to 2021, there has been a consistent decline in global age-standardized DALY rates, as well as in those of G20 countries, excluding the European Union. This trend aligns with findings from other studies[8] and can be attributed to several factors, including economic growth, advancements in medical technology, and improvements in living standards. Additionally, since 1993, the Global Asthma Initiative has played a crucial role in regularly publishing and annually updating the Global Strategy for Asthma Management and Prevention. This initiative has provided essential guidelines for asthma management across numerous countries, potentially contributing to improved disease control. Furthermore, the ongoing refinement of healthcare systems, particularly in medication management and the provision of standardized care for asthma patients, has likely played a significant role in the observed reduction in asthma-related DALYs. Among the G20 nations, China is notable for having the lowest age-standardized DALY rates for asthma. A key development in this context was the establishment of the China Asthma Alliance in 2005, which has been dedicated to promoting standardized asthma treatment protocols. These collective efforts may have contributed to the reduction in asthma mortality rates and the mitigation of life-years lost due to asthma. However, the relatively modest decline in age-standardized DALY rates for asthma in China may reflect ongoing disparities in access to preventive and therapeutic services among lower socioeconomic groups. Such inequalities could hinder sustained improvements in asthma outcomes, emphasizing the need for targeted interventions to address these disparities and ensure equitable access to asthma care for all segments of the population.
The study identified an upward trend in asthma incidence from 2005 to 2014 and in prevalence from 2005 to 2013, which aligns with findings from certain existing studies[9]. The rapid pace of urbanization is thought to influence the incidence and progression of asthma, with a discernible link between changes in environmental factors and disease onset[10]. Empirical evidence suggests that both indoor and outdoor allergens are associated with asthma symptoms and incidence[11]. However, the effects of these environmental factors on allergic mechanisms are likely influenced by multiple variables, including host genetics, immune system responses, timing of exposure, and other concurrent exposures[12]. The precise mechanisms underlying these interactions require further investigation to better understand the complex relationship between environmental triggers and asthma development. This research is essential for developing targeted preventive strategies and personalized treatment approaches in asthma management.
Research consistently shows that asthma disproportionately affects Chinese men compared to women, a trend also observed in other studies[3,13,14]. This phenomenon may be attributed to differences in gender composition between China and other countries, as China has a higher male population than female[15]. Additionally, physiological and immunological differences between men and women, such as variations in lung and airway size, may also contribute to this disparity[3]. Furthermore, the higher smoking prevalence among Chinese men[16], a well-established risk factor for asthma mortality, could impair the effectiveness of essential asthma medications, such as inhaled corticosteroids[13]. Future research should further explore the underlying factors driving these sex-based disparities in asthma mortality. From 1990 to 2021, the demographic profile of asthma patients in China has largely included children and the elderly, with an initial increase followed by a decrease with age, reflecting general epidemiological patterns[3,4,14]. Managing asthma in elderly populations is particularly challenging due to declining immune responses and the presence of multiple comorbidities[17]. Elevated asthma mortality rates in older age groups may be linked to challenges in accurate diagnosis and limited healthcare access, particularly in less-developed regions[13].
The etiology and progression of asthma are multifactorial, with various influences shaping its epidemiological landscape. Over the past three decades, there has been a significant increase in asthma-related deaths associated with high body mass index (BMI), which has emerged as a primary risk factor for asthma mortality. Elevated BMI is linked to higher asthma prevalence and reduced lung function[18]. Effectively managing asthma is particularly critical in the context of obesity, as well-controlled asthma mitigates adverse health effects more effectively than poorly managed asthma[19]. Environmental factors, including ambient temperature, nitrogen dioxide, particulate matter with a diameter of less than 10 micrometers, traffic-related air pollution, and mold or humidity, contribute to the risk of asthma, rhinitis, and respiratory symptoms in preschool children in China. Meanwhile, breastfeeding has been identified as a protective factor[20]. Asthma, hypertension, and diabetes interact in complex ways[21], with each condition influencing the clinical presentation of the others[22]. Dysregulation of glucose metabolism has been implicated in asthma exacerbation[23] . Additionally, the elderly population is prone to multiple chronic conditions. The reduced likelihood of concurrent chronic diseases in older adults may explain the more pronounced decrease in DALYs attributed to asthma in this age group compared to others. Pertussis, pneumonia, and asthma share etiological links, suggesting that vaccination could play a crucial role in reducing asthma incidence[24,25]. This study identifies a significant reduction in asthma disease burden following the control of risk factors. However, due to China’s declining birth rate, the reduction in asthma burden among children under five and those aged 5–14 years is less substantial than anticipated, indicating that further investigation is needed to understand the underlying reasons.
This study also has certain limitations. It assessed the disease burden of asthma with a focus on gender, age groups, and temporal trends, but did not include a detailed analysis of provincial disparities or urban versus rural distinctions. Future research should incorporate these dimensions to provide a more comprehensive understanding of asthma’s epidemiological impact. Additionally, the study’s findings are based on data from the GBD 2021, which relies on estimates and models rather than direct empirical observations. As a result, the findings may exhibit a degree of conservatism. The dependence on modeled data necessitates cautious interpretation and underscores the importance of empirical studies to validate and refine GBD estimates.
-
In summary, although asthma is a serious disease, controlling modifiable risk factors can help reduce its disease burden. Scientific prevention strategies can significantly lower the risk of asthma, and implementing effective primary and secondary prevention measures, particularly for high-risk population groups, is essential for reducing asthma-related mortality. This study found that individuals aged ≥ 70 years currently constitute the primary group affected by asthma-related deaths, highlighting the need for targeted interventions based on the specific characteristics of different population groups. Additionally, under the framework of the “Healthy China Action (2019–2030)”, and considering local cultural and socio-economic conditions, all relevant public health sectors in China should actively pursue the outlined goals in environmental health, tobacco control, and national fitness by promoting health education, encouraging healthy eating habits, and supporting regular physical activity. Preventive measures should focus on avoiding known asthma triggers (e.g., allergens, air pollution), attending regular medical check-ups, adjusting treatment plans under medical supervision, and adhering to prescribed medications, including preventive and emergency treatments. Early prevention and timely intervention can significantly reduce morbidity and mortality in high-risk populations, further lowering asthma-related deaths while also providing substantial economic benefits by minimizing healthcare costs and disease burden.
doi: 10.3967/bes2025.042
The Disease Burden of Asthma in China, 1990 to 2021 and Projections to 2050: Based on the Global Burden of Disease 2021
-
Abstract:
Objective Asthma imposes a significant global health burden. This study examines changes in the asthma-related disease burden from 1990 to 2021 and projects future burdens for 2050 under different scenarios. Methods Using data from the Global Burden of Disease 2021 study, we analyzed asthma incidence, prevalence, mortality, and disability-adjusted life years (DALYs) from 1990 to 2021. We projected the disease burden for 2050 based on current trends and hypothetical scenarios in which all risk factors are controlled. Temporal trends in age-standardized incidence, prevalence, mortality, and DALY rates were explored using Annual Percent Change. Results In 2021, the age-standardized rates for asthma incidence, prevalence, mortality, and DALYs in China were 364.17 per 100,000 (95% uncertainty interval [UI]: 283.22–494.10), 1,956.49 per 100,000 (95% UI: 1,566.68–2,491.87), 1.47 per 100,000 (95% UI: 1.15–1.79), and 103.76 per 100,000 (95% UI: 72.50–145.46), respectively. A higher disease burden was observed among Chinese men and individuals aged 70 years or older. Compared to the current trend, a combined scenario involving improvements in environmental factors, behavioral and metabolic health, child nutrition, and vaccination resulted in a greater reduction in the disease burden caused by asthma. Conclusion Addressing modifiable risk factors is essential for further reducing the asthma-related disease burden. -
Key words:
- China /
- Asthma /
- Disability-adjusted life year
All the authors declare no conflict of interest.
The data in this study were obtained from public databases and did not require an ethical review.
注释:1) Authors’ Contributions: 2) Competing Interests: 3) Ethics: -
Figure 1. Trends in age-standardized DALY rates for asthma across 19 G20 member countries (with the 20th member represented by the European Union) and the global average.
Figure 2. Joinpoint analysis of age-standardized asthma incidence, prevalence, mortality, and DALY rates in China (1990–2021). DALY, disability−adjusted life years; APC, annual percentage change.
Figure 3. Trends in age-standardized mortality and DALY rates for asthma by sex in China from 1990 to 2050. DALY, disability−adjusted life years.
Figure 4. Trends in the number and rate of DALYs for asthma in China by age group from 1990 to 2050. (A) Changes in DALY numbers under the reference scenario. (B) Change in DALY numbers under the combined scenario. (C) Changes in DALY rates across different scenarios. DALY, disability−adjusted life years.
Table 1. Incidence, prevalence, mortality, and DALYs of asthma in 2021 by sex and age group, with percentage change in rates from 1990 to 2021
Age, years Incidence Prevalence Deaths DAYLs Number, in thousand, 2021 Rate, per 100,000, 2021 Percentage change of rate, 1990 to 2021 Number, in thousand, 2021 Rate, per 100,000, 2021 Percentage change of rate, 1990 to 2021 Number, in thousand, 2021 Rate, per 100,000, 2021 Percentage change of rate, 1990 to 2021 Number, in thousand, 2021 Rate, per 100,000, 2021 Percentage change of rate, 1990 to 2021 Male < 5 712.00 (415.68
to
1,173.65)1,710.28 (998.48
to
2,819.20)−0.28 (−0.38
to
−0.20)1,527.32 (874.59
to
2,329.66)3,668.75 (2,100.82
to
5,596.01)−0.26 (−0.34
to
−0.18)0.01 (0.01
to
0.02)0.03 (0.02
to
0.04)−0.98 (−0.99
to
−0.96)63.39 (30.47
to
110.90)152.27 (73.20
to
266.39)−0.52 (−0.69
to
−0.40)5–14 650.60 (345.82
to
1,071.35)671.17 (356.75
to
1,105.22)−0.09 (−0.13
to
−0.04)4,092.87 (2,700.33
to
6,339.83)4,222.26 (2,785.70
to
6,540.26)−0.21 (−0.34
to
−0.18)0.03 (0.02
to
0.04)0.03 (0.02
to
0.04)−0.94 (−0.95
to
−0.89)169.32 (90.57
to
307.99)174.68 (93.43
to
317.73)−0.32 (−0.42
to
−0.25)15–49 412.03 (303.43
to
529.35)119.57 (88.05
to
153.61)−0.34 (−0.40
to
−0.27)4,131.27 (3,119.41
to
5,289.55)1,198.85 (905.22
to
1,534.97)−0.28 (−0.34
to
−0.23)0.78 (0.58
to
1.03)0.23 (0.17
to
0.30)−0.67 (−0.82
to
−0.47)205.48 (135.36
to
292.86)59.63 (39.28
to
84.98)−0.43 (−0.55
to
−0.34)50–69 270.82 (212.29
to
343.66)142.24 (111.50
to
180.50)−0.59 (−0.62
to
−0.55)2,431.46 (2,039.68
to
2,884.72)1,277.10 (1,071.32
to
1,515.16)−0.54 (−0.57
to
−0.49)3.06 (2.14
to
4.28)1.61 (1.12
to
2.25)−0.79 (−0.89
to
−0.64)182.61 (137.76
to
237.82)95.91 (72.36
to
124.91)−0.71 (−0.82
to
−0.60)≥ 70 230.31 (173.44
to
290.99)422.23 (317.98
to
533.49)−0.38 (−0.48
to
−0.25)1,847.90 (1,543.54
to
2,193.15)3,387.86 (2,829.87
to
4,020.83)−0.53 (−0.58
to
−0.46)10.86 (7.62
to
14.02)19.91 (13.97
to
25.70)−0.67 (−0.86
to
−0.46)215.36 (165.08
to
264.09)394.82 (302.64
to
484.17)−0.67 (−0.83
to
−0.53)Subtotal 2,275.76 (1,833.61
to
2,996.79)404.54 (312.57
to
547.88)−0.28 (−0.33
to
−0.24)14,030.82 (11,637.94
to
17,253.95)2,155.10 (1,729.36
to
2,757.98)−0.33 (−0.37
to
−0.28)14.74 (10.32
to
19.30)1.95 (1.38
to
2.50)−0.73 (−0.88
to
−0.55)836.16 (609.77
to
1,142.17)118.88 (83.53
to
166.81)−0.56 (−0.70
to
−0.45)Female < 5 464.93 (266.67
to
783.39)1,290.12 (739.99
to
2,173.81)−0.32 (−0.40
to
−0.24)1,068.20 (609.50
to
1,625.49)2,964.12 (1,691.28
to
4,510.53)−0.31 (−0.39
to
−0.23)0.01 (0.00
to
0.02)0.02 (0.01
to
0.05)−0.98 (−0.99
to
−0.95)44.49 (21.66
to
77.66)123.44 (60.11
to
215.50)−0.59 (−0.74
to
−0.46)5–14 431.79 (233.98
to
705.89)507.82 (275.18
to
830.18)−0.09 (−0.14
to
−0.01)2,679.89 (1,747.91
to
4,132.93)3,151.77 (2,055.69
to
4,860.67)−0.23 (−0.29
to
−0.18)0.02 (0.01
to
0.03)0.02 (0.01
to
0.04)−0.95 (−0.97
to
−0.88)110.74 (58.57
to
200.39)130.24 (68.89
to
235.68)−0.34 (−0.44
to
−0.26)15–49 372.32 (277.42
to
474.66)116.83 (87.05
to
148.94)−0.45 (−0.50
to
−0.38)3,599.73 (2,750.97
to
4,559.78)1,129.51 (863.19
to
1,430.75)−0.37 (−0.43
to
−0.31)0.55 (0.38
to
0.84)0.17 (0.12
to
0.26)−0.72 (−0.83
to
−0.48)170.75 (108.10
to
245.06)53.58 (33.92
to
76.89)−0.49 (−0.58
to
−0.40)50–69 214.60 (161.04
to
273.64)112.87 (84.70
to
143.93)−0.67 (−0.70
to
−0.64)2,139.23 (1,751.24
to
2,583.54)1,125.20 (921.12
to
1,358.90)−0.63 (−0.66
to
−0.59)1.85 (1.20
to
2.72)0.97 (0.63
to
1.43)−0.80 (−0.90
to
−0.60)135.64 (99.18
to
174.60)71.35 (52.17
to
91.83)−0.72 (−0.81
to
−0.61)70+ 175.48 (130.98
to
221.84)270.97 (202.25
to
342.56)−0.53 (−0.59
to
−0.42)1,497.81 (1,253.71
to
1,767.98)2,312.88 (1,935.95
to
2,730.07)−0.65 (−0.69
to
−0.60)9.06 (6.08
to
12.62)13.99 (9.39
to
19.48)−0.70 (−0.86
to
−0.41)169.64 (128.02
to
217.09)261.95 (197.69
to
335.22)−0.72 (−0.83
to
−0.54)Subtotal 1,659.12 (1,355.46
to
2,126.97)319.56 (248.24
to
429.99)−0.34 (−0.39
to
−0.30)10,984.85 (9,212.87
to
13,218.70)1,746.77 (1,403.11
to
2,206.59)−0.41 (−0.46
to
−0.34)11.49 (7.87
to
16.02)1.14 (0.78
to
1.59)−0.77 (−0.88
to
−0.56)631.25 (452.13
to
838.67)89.68 (62.21
to
124.99)−0.60 (−0.71
to
−0.50)Total < 5 1,176.93 (681.39
to
1,961.19)1,515.33 (877.31
to
2,525.09)−0.30 (−0.38
to
−0.21)2,595.53 (1,489.39
to
3,954.25)3,341.81 (1,917.63
to
5,091.20)−0.28 (−0.36
to
−0.20)0.02 (0.01
to
0.03)0.03 (0.02
to
0.04)−0.98 (−0.99
to
−0.96)107.88 (52.11
to
188.20)138.90 (67.09
to
242.32)−0.55 (−0.71
to
−0.42)5–14 1,082.39 (587.66
to
1,783.02)594.84 (322.95
to
979.88)−0.09 (−0.12
to
−0.03)6,772.75 (4,448.85
to
10,433.86)3,722.04 (2,444.92
to
5,734.05)−0.21 (−0.27
to
−0.17)0.05 (0.04
to
0.07)0.03 (0.02
to
0.04)−0.94 (−0.96
to
−0.89)280.06 (149.33
to
509.47)153.91 (82.07
to
279.98)−0.32 (−0.42
to
−0.25)15–49 784.35 (580.80
to
1,004.93)118.25 (87.56
to
151.51)−0.40 (−0.45
to
−0.34)7,730.99 (5,890.46
to
9,781.03)1,165.53 (888.05
to
1,474.60)−0.33 (−0.38
to
−0.27)1.33 (1.06
to
1.68)0.20 (0.16
to
0.25)−0.69 (−0.80
to
−0.56)376.23 (246.50
to
540.08)56.72 (37.16
to
81.42)−0.46 (−0.54
to
−0.39)50–69 485.42 (370.62
to
620.91)127.57 (97.40
to
163.18)−0.63 (−0.66
to
−0.59)4,570.69 (3,786.65
to
5,457.26)1,201.20 (995.15
to
1,434.19)−0.58 (−0.62
to
−0.55)4.91 (3.80
to
6.23)1.29 (1.00
to
1.64)−0.79 (−0.88
to
−0.69)318.26 (242.81
to
398.80)83.64 (63.81
to
104.81)−0.71 (−0.79
to
−0.65)70+ 405.79 (304.41
to
512.06)340.13 (255.16
to
429.21)−0.45 (−0.53
to
−0.33)3,345.70 (2,805.37
to
3,960.70)2,804.35 (2,351.44
to
3,319.84)−0.59 (−0.63
to
−0.53)19.92 (15.51
to
24.15)16.70 (13.00
to
20.24)−0.69 (−0.82
to
−0.53)384.99 (308.54
to
459.36)322.70 (258.61
to
385.03)−0.69 (−0.80
to
−0.59)Subtotal 3,934.87 (3,183.31
to
5,136.13)364.17 (283.22
to
494.10)−0.31 (−0.35
to
−0.27)25,015.67 (20,898.41
to
30,448.11)1,956.49 (1,566.68
to
2,491.87)−0.37 (−0.41
to
−0.33)26.23 (20.58
to
31.84)1.47 (1.15
to
1.79)−0.75 (−0.85
to
−0.63)1,467.42 (1,072.76
to
1,947.20)103.76 (72.50
to
145.46)−0.58 (−0.68
to
−0.50)Note. DALYs: disability−adjusted life years.  下载: 导出CSV
-
[1] Global Initiative for Asthma. Global strategy for asthma management and prevention, 2024. Updated May 2024. [2] IHME. Global burden of disease study 2021 (GBD2021) data resources. https://vizhub.healthdata.org/gbd-results/. [2024-10-11]. [3] Tang KL, Huang JF, Xie SJ, et al. Temporal trend in burden of asthma in China, South Korea, and Japan, 1990-2019: results from the global burden of disease study 2019. J Thorac Dis, 2023; 15, 2559−70. doi: 10.21037/jtd-23-22 [4] Cao Y, Chen SQ, Chen XY, et al. Global trends in the incidence and mortality of asthma from 1990 to 2019: an age-period-cohort analysis using the global burden of disease study 2019. Front Public Health, 2022; 10, 1036674. doi: 10.3389/fpubh.2022.1036674 [5] GBD 2021 Demographics Collaborators. Global age-sex-specific mortality, life expectancy, and population estimates in 204 countries and territories and 811 subnational locations, 1950-2021, and the impact of the COVID-19 pandemic: a comprehensive demographic analysis for the global burden of disease study 2021. Lancet, 2024; 403, 1989−2056. doi: 10.1016/S0140-6736(24)00476-8 [6] GBD 2021 Diseases and Injuries Collaborators. Global incidence, prevalence, years lived with disability (YLDs), disability-adjusted life-years (DALYs), and healthy life expectancy (HALE) for 371 diseases and injuries in 204 countries and territories and 811 subnational locations, 1990-2021: a systematic analysis for the global burden of disease study 2021. Lancet, 2024; 403, 2133−61. doi: 10.1016/S0140-6736(24)00757-8 [7] GBD 2021 Forecasting Collaborators. Burden of disease scenarios for 204 countries and territories, 2022-2050: a forecasting analysis for the global burden of disease study 2021. Lancet, 2024; 403, 2204−56. doi: 10.1016/S0140-6736(24)00685-8 [8] Wang ZF, Li Y, Gao Y, et al. Global, regional, and national burden of asthma and its attributable risk factors from 1990 to 2019: a systematic analysis for the global burden of disease study 2019. Respir Res, 2023; 24, 169. doi: 10.1186/s12931-023-02475-6 [9] Luo Y, Wang M, Tian YM. Trends and age-period-cohort effects on incidence and mortality of asthma in Sichuan Province, China, 1990-2019. BMC Pulm Med, 2022; 22, 298. doi: 10.1186/s12890-022-02059-y [10] Dharmage SC, Perret JL, Custovic A. Epidemiology of asthma in children and adults. Front Pediatr, 2019; 7, 246. doi: 10.3389/fped.2019.00246 [11] Sterling YM. Impact of the environment on asthma control. J Community Health Nurs, 2012; 29, 143−53. doi: 10.1080/07370016.2012.697844 [12] Murrison LB, Brandt EB, Myers JB, et al. Environmental exposures and mechanisms in allergy and asthma development. J Clin Invest, 2019; 129, 1504−15. doi: 10.1172/JCI124612 [13] Tong XL, Yin P, Liu W, et al. Spatial, temporal and demographic patterns in asthma mortality in China: a systematic analysis from 2014 to 2020. World Allergy Organ J, 2023; 16, 100735. doi: 10.1016/j.waojou.2022.100735 [14] Li XC, Guo MZ, Niu Y, et al. Secular trends of asthma mortality in China and the United States from 1990 to 2019. Chin Med J (Engl), 2024; 137, 273−82. doi: 10.1097/CM9.0000000000002855 [15] World Economic Forum. Global gender gap report 2024. https://www.weforum.org/publications/gender-gap-report-2024/. [2024-10-11]. [16] Gonzalez-Garcia M, Caballero A, Jaramillo C, et al. Prevalence, risk factors and underdiagnosis of asthma and wheezing in adults 40 years and older: a population-based study. J Asthma, 2015; 52, 823−30. doi: 10.3109/02770903.2015.1010733 [17] Baptist AP, Busse PJ. Asthma over the age of 65: all's well that ends well. J Allergy Clin Immunol Pract, 2018; 6, 764−73. doi: 10.1016/j.jaip.2018.02.007 [18] Skaaby T, Taylor AE, Thuesen BH, et al. Estimating the causal effect of body mass index on hay fever, asthma and lung function using Mendelian randomization. Allergy, 2018; 73, 153−64. doi: 10.1111/all.13242 [19] Lin P, Zhao YA, Shi YJ, et al. Associations of asthma control with hypertension, cardiovascular disease, and mortality in obese individuals. Intern Emerg Med, 2024; 19, 951−7. doi: 10.1007/s11739-024-03554-2 [20] Norbäck D, Lu C, Wang J, et al. Asthma and rhinitis among Chinese children - Indoor and outdoor air pollution and indicators of socioeconomic status (SES). Environ Int, 2018; 115, 1−8. doi: 10.1016/j.envint.2018.02.023 [21] Boulet LP, Boulay MÈ. Asthma-related comorbidities. Expert Rev Respir Med, 2011; 5, 377−93. doi: 10.1586/ers.11.34 [22] Kosmalski M, Różycka-Kosmalska M, Witusik A, et al. The coincidence of diabetes mellitus and asthma, their probable causal relationships and therapeutic opportunities. Adv Respir Med, 2020; 88, 590−8. doi: 10.5603/ARM.a2020.0168 [23] Wu TD. Diabetes, insulin resistance, and asthma: a review of potential links. Curr Opin Pulm Med, 2021; 27, 29−36. doi: 10.1097/MCP.0000000000000738 [24] Mitchell EA, Beasley R, Keil U, et al. The association between tobacco and the risk of asthma, rhinoconjunctivitis and eczema in children and adolescents: analyses from phase three of the ISAAC programme. Thorax, 2012; 67, 941−9. doi: 10.1136/thoraxjnl-2011-200901 [25] Rhedin S, Lundholm C, Osvald EC, et al. Pneumonia in infancy and risk for asthma: the role of familial confounding and pneumococcal vaccination. Chest, 2021; 160, 422−31. doi: 10.1016/j.chest.2021.03.006 -

 点击查看大图
计量
- 文章访问数: 1624
- HTML全文浏览量: 877
- PDF下载量: 136
- 被引次数: 0

 Quick Links