

 下载:
下载:

-
Healthy life expectancy (HLE) is widely used in health assessment and policymaking[1]. With the ability to simultaneously account for both mortality and health status, HLE has been measured across many countries and organizations[2]. Sullivan’s method, which incorporates age-specific mortality and disability rates using life table models, is one of the most commonly applied techniques for estimating HLE due to its reliance on representative data. However, because the definition of “health” varies, the measurement of disability also differs[3]. Most countries assess disability rates through questionnaires that focus on activity limitations.
HLE estimation is typically conducted via routine government surveys or policy initiatives, such as the EU-SILC[4], EHIS[5], and SHARE[6] in European countries; Healthy People 2030 in the United States[7,8]; Healthy China 2030 in China[9]; and the Comprehensive Survey of Living Conditions in Japan[10]. With the global trend of population aging, the World Health Organization (WHO) has also incorporated healthy life expectancy at 60 (HLE60) into the reporting framework of the Global Health Observatory.
Previous studies have identified a temporal increase in HLE and a narrowing of the sex disparity—commonly referred to as the male-female health-survival paradox[11,12]. However, the underlying reasons for these changes and disparities remain unclear. Decomposition methods can be used to assess the contribution of specific diseases to changes in HLE[13,14]. Although a few studies have applied these methods to disease impact on HLE[13,15-18], none have done so in a Chinese population.
Quantifying disease-specific contributions to changes in HLE and sex disparities may inform public health policies aimed at improving HLE and promoting health equity. Estimating disability rates from questionnaires requires age-specific disability weights (DWs), especially in the context of comorbidity. Nusselder et al. proposed a method using regression models stratified by age group, incorporating all diseases and modeling age patterns with splines[13]. However, in surveys with limited sample sizes, the estimation of DWs by age groups could be distorted by collinearity. Furthermore, in previous applications, stroke-related DWs for men required additional adjustment[13], suggesting that a single parameterization may not be appropriate for age-specific DW estimation.
In this study, we aimed to decompose changes in HLE by assessing the impact of mortality and disability from various diseases using an age-specific DW estimation approach. By analyzing these decomposition results by sex, we quantified the contribution of major chronic diseases to HLE change from 2011 to 2020, thereby identifying potential strategies for HLE improvement.
-
In this study, cause-specific mortality rates by age and sex for the years 2011 and 2020 were obtained from the cause-of-death database of the National Health Commission, China. For sensitivity analysis and comparison, mortality data from the GBD2021 project[19] were also used. Details on mortality rate aggregation and analysis procedures are provided in the Supplementary Methods.
Nationally representative cause-specific disability rates were derived from the China Health and Retirement Longitudinal Study (CHARLS) data through appropriate weighting and aggregation. Age-specific DWs were also estimated using CHARLS data. CHARLS is a nationally representative longitudinal study with a four stage sampling design[20]. The baseline survey was conducted in 2011, followed by four 4 follow-up waves in 2013, 2015, 2018, and 2020. Sample weights accounting for the survey design and nonresponse probability were constructed for each wave.
Because the estimation of age-specific DWs required data across all age groups to model nonlinearity, neither age nor survey year was used as an exclusion criterion in DW estimation. A total of 55,861 participants who responded to the Activities of Daily Living (ADL) questionnaires and self-reported disease status from 2011 to 2020 were included in the DW estimation. Of these, 5,465 participants in 2011 and 9,910 participants in 2020, all aged 60 and above were included in the analyses for estimating HLE for the respective years.
-
Disability in this study was defined as activity limitation, as assessed by the ADL questionnaire. Participants answered six questions regarding difficulty in performing daily tasks such as dressing, eating, bathing, getting in/out of bed, using the toilet, and controlling bowel movements[21]. Individuals who reported no difficulty in all six tasks were classified as having no activity limitations; others were classified as having limitations.
Disease prevalence was determined using self-reported responses from the survey. The chronic diseases assessed included diabetes, cancer, chronic respiratory diseases (CRDs), ischemic heart disease (IHD), stroke, mental disorders (including emotional, nervous, or psychiatric problems), arthritis (including rheumatism), liver diseases, kidney diseases, digestive diseases, and memory-related diseases (including dementia, brain atrophy, and Parkinson’s disease). Covariates included age, sex, education level (primary school and below, secondary school and above), tobacco use, and alcohol use.
-
Unlike life expectancy (LE) decomposition, where each individual has only one underlying cause of death, HLE decomposition in the presence of comorbidities necessitated apportioning disability to multiple diseases. This allocation depends on both disability rates and DWs. The disability rates were estimated from the CHARLS data. In this study, we estimated age-specific DWs for participants with disabilities.
We used a generalized linear model with a logit link function and included interactions between each disease and both linear and quadratic terms of age to capture the nonlinearity of age-specific DWs:
$$ \begin{aligned} \text{log}\left(\frac{{P}_{j}}{1-{P}_{j}}\right)= & \sum _{k=1}^{n}{\gamma }_{0k}{E}_{jk}+\sum _{k=1}^{n}{\gamma }_{1k}{E}_{jk}{age}_{j}+\sum _{k=1}^{n}{\gamma }_{2k}{E}_{jk}{age}_{j}^{2}\\ & +{\beta }_{1}{age}_{j}+{\beta }_{2}{age}_{j}^{2} \end{aligned}$$ (1) Here, $ {E}_{jk} $ is the disease status of individual $ j $ for disease $ k $ (1 if present, 0 otherwise), and $ {P}_{j} $ represents the probability of disability for individual $ j $ (1 for disability, 0 otherwise).Parameters $ \gamma $ and $ \beta $ were estimated by the model, reflecting the effects of diseases, age, and their interactions.
The age-specific coefficients of disease $ k $ for age group $ x $ to $ x+i $ was calculated as:
$$ {{}_{i}\gamma }_{xk}={\gamma }_{0k}+{\gamma }_{1k}{{}_{i}midage}_{x}^{}+{\gamma }_{2k}{{}_{i}midage}_{x}^{2} $$ (2) where$ {{}_{i}midage}_{x}^{} $ indicates the midpoint of each 5-year age-group (e.g., 52.5, 57.5, …, 82.5) to align with age groups in the life table. For individuals over 85, DWs were assumed to be the same as those at age 85, rather than using a midpoint.
To address potential collinearity, we applied a Bayesian logistic regression model (BLRM) with non-negative priors. Additionally, eXtreme Gradient Boosting (XGBoost) was used as a machine learning-based algorithm to assess disease importance[22]. SHAP (SHapley Additive exPlanations) was employed to interpret disease contributions across age groups, corresponding to the age-specific DWs in the XGBoost model[23].
We normalized the sum of DWs to 1, allowing the weights of multiple diseases to be expressed as proportional shares. For example, if an individual with a disability reported having diabetes, cancer, and stroke, and the estimated DWs were 0.8, 0.4, and 1.2 respectively, they were rescaled to 0.33, 0.17, and 0.5. This proportional representation ensures that the total disability weight sums to 1, enabling proper decomposition of disability, consistent with previous studies[13].
-
$ {{}_{i}E}_{xjk}^{} $ was generated as a dummy variable from a binomial distribution. The DWs for each disease were assumed to increase with age; thus, we simulated $ {{}_{i}DIS}_{xjk}^{} $ as the DWs for disease $ k $ in individuals aged between $ x $ and $ x+i $, using a quadratic function constrained to produce values between 0 and 1. The quadratic and constant terms were restricted to be greater than zero to ensure an increasing trend of DWs with age. $ {{}_{i}P}_{xj} $, the probability of disability for individual j aged between $ x $ and $ x+i $, was defined as:
$$ {{}_{i}P}_{xj}=1-\prod _{k=1}^{n}{1-{}_{i}E}_{xjk}^{}\times {{}_{i}DIS}_{xjk}^{} $$ (3) The disability status of individual $ j $ in age group $ x $ to $ x+i $ was then generated based on $ {{}_{i}P}_{xj} $ using a binomial distribution.
Model selection was based on comparing the gold standard rescaled DWs generated through simulation with the estimated rescaled DWs from each model. Sample sizes ranging from 50 to 10,000 were simulated with 100 bootstrap iterations. We evaluated model performance using metrics such as Mean Absolute Error, Mean Absolute Percentage Error, and Root Mean Square Error. The leave-one-out cross-validation method was used to identify the best-performing model. In addition, perturbation analysis was conducted to assess the robustness of the models using real-world data.
-
LE60 and HLE60 were used to assess the health status of individuals aged 60 and above, as recommended by the World Health Organization (WHO)[24]. We applied Sullivan’s method to calculate LE60 and HLE60 using abridged period life tables, with 5-year age bands from 60 to 84 years and a final age group of 85 years and older.
Cause-specific disability rates were calculated as the weighted sum of each individual’s rescaled DWs, as previously described. Using the cause-specific mortality and disability rates, HLE decomposition was performed following established methodologies, separating the total effects into mortality effects and disability effects[13,18].
Continuous variables were presented as means and standard deviations (mean ± SD), while categorical variables were summarized using frequencies (n) and proportions (%). We employed two-sample t-tests and Chi-square tests for group comparisons. Average percentage change was calculated to describe trends in DWs across age groups. All descriptive statistics derived from CHARLS were weighted based on the sampling weights from the 2011 and 2020 surveys, unless otherwise specified.
All p-values were two-tailed, with statistical significance set at P < 0.05. All analyses were performed using R version 4.0.2 (R Foundation for Statistical Computing, Vienna, Austria).
-
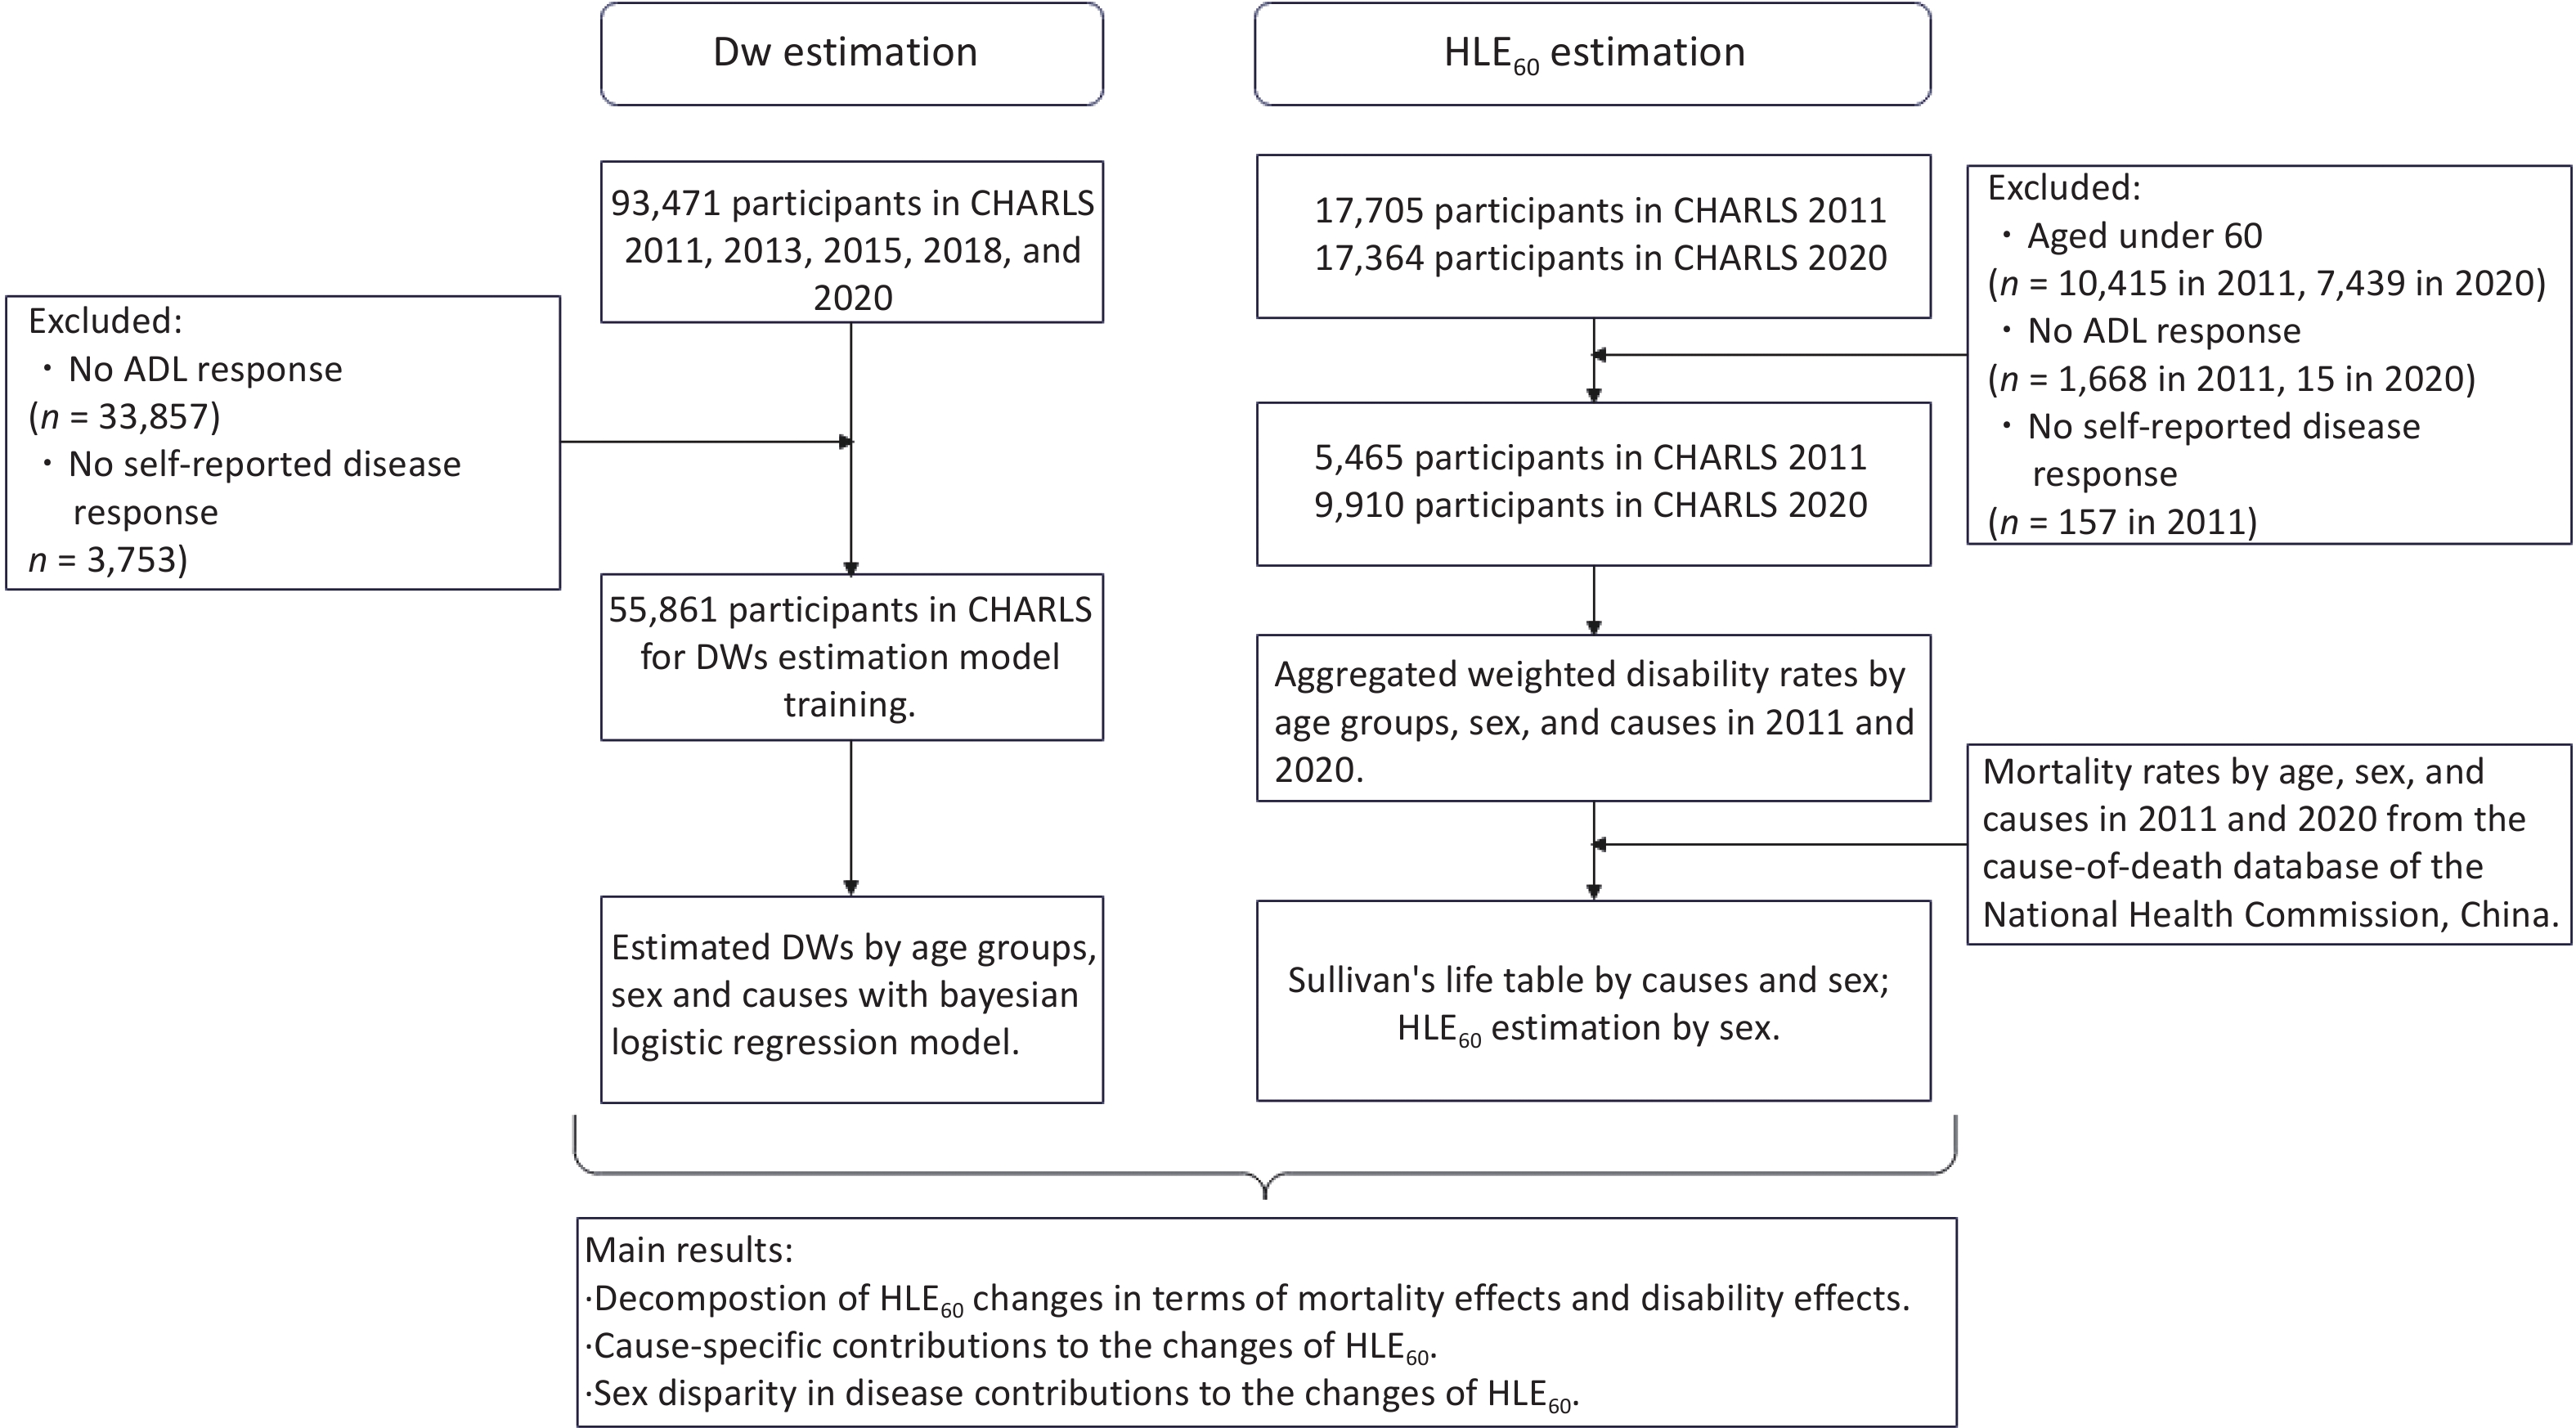
A total of 5,465 participants in 2011 and 9,910 participants in 2020 were included in the analysis (Figure 1). Participants without disability tended to be younger, male, better educated, and had a lower prevalence of disease (Table 1 and Supplementary Table S1 for weighted results). Compared to 2011, participants in 2020 were better educated, had a higher proportion of smokers, and exhibited greater disease prevalence (Supplementary Table S2 and Supplementary Table S3 for weighted results). The most prevalent disease was arthritis, followed by digestive diseases and IHD (Supplementary Figure S1). The most common comorbidity combination was arthritis and digestive diseases (Supplementary Table S4).
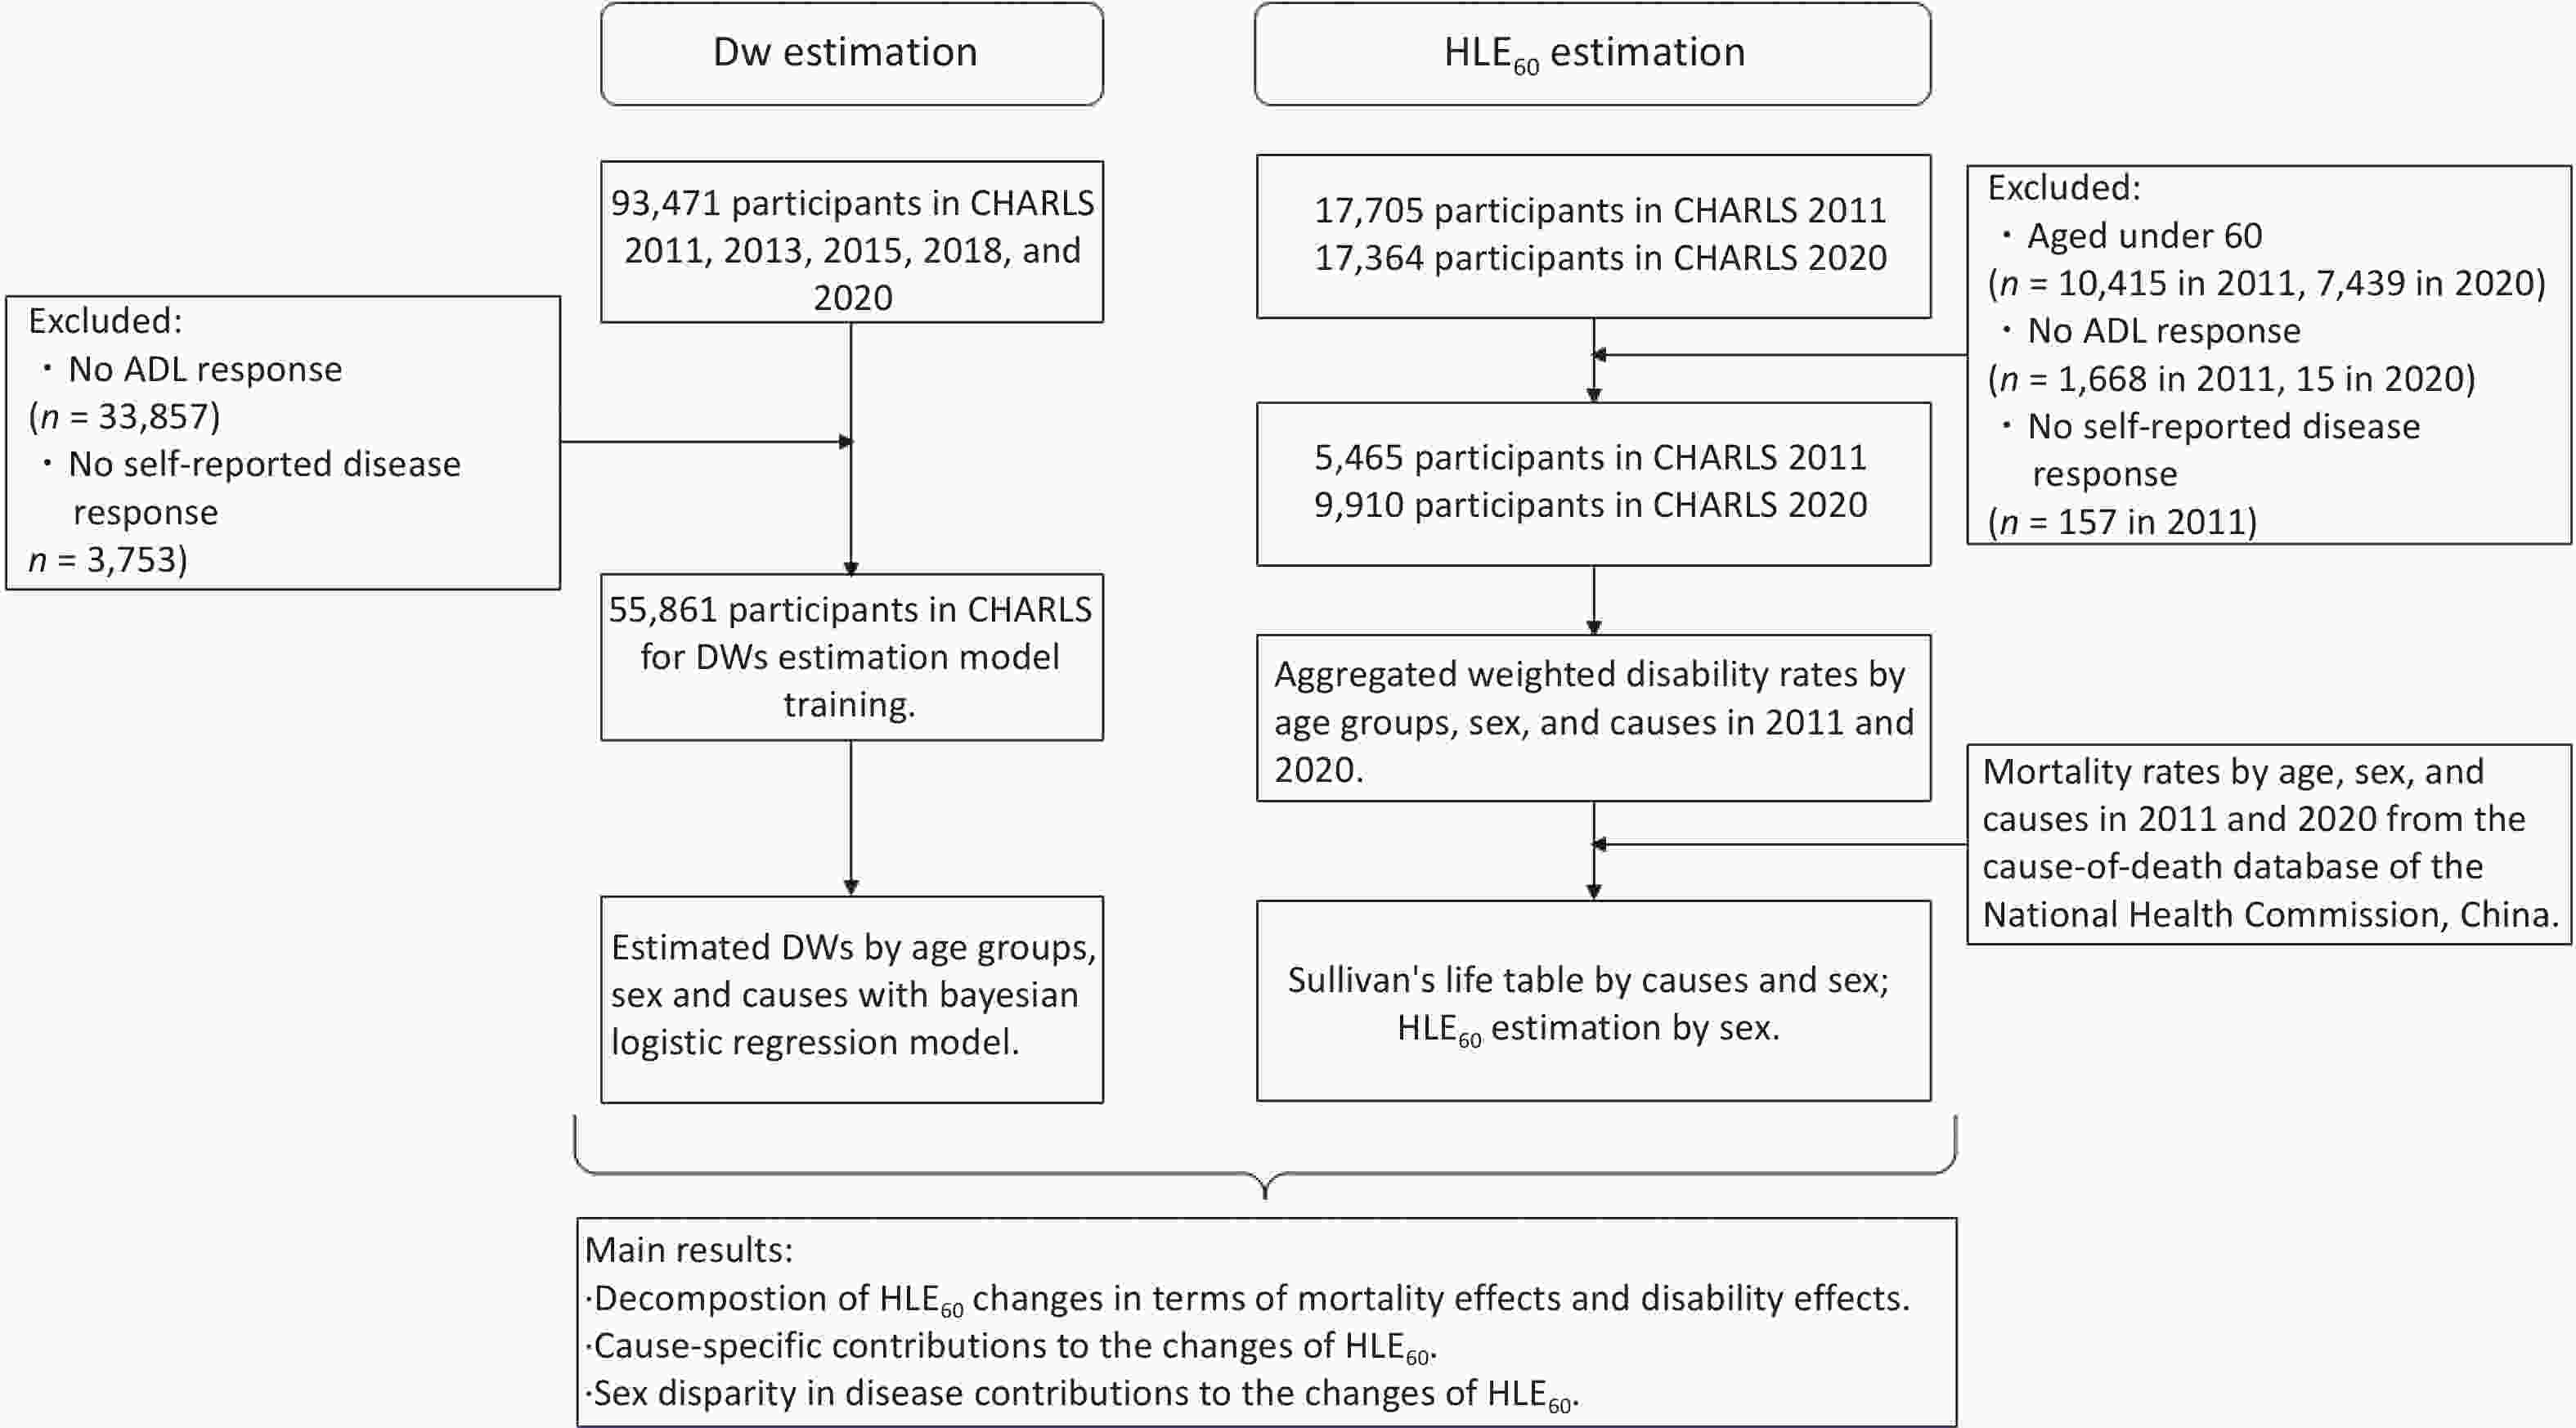
Figure 1. Process chart of participants' inclusion and exclusion, and the workflow of decomposition.
Table 1. Baseline characteristics of participants stratified by disability
Characteristics Overall No disability Disability P Sample size 15375 10660 4715 Age (mean (SD)) 68.98 (6.95) 68.26 (6.56) 70.60 (7.51) <0.001 Female (%) 8074 (52.5) 5300 (49.7) 2774 (58.8) <0.001 Secondary school and above (%) 3305 (21.5) 2614 (24.5) 691 (14.7) <0.001 Current smokers (%) 6620 (43.1) 4756 (44.6) 1864 (39.5) <0.001 Alcohol use (%) 3536 (23.0) 2683 (25.2) 853 (18.1) <0.001 Diabetes (%) 2150 (14.0) 1341 (12.6) 809 (17.2) <0.001 Cancer (%) 350 (2.3) 221 (2.1) 129 (2.7) 0.013 CRDs (%) 2601 (16.9) 1591 (14.9) 1010 (21.4) <0.001 IHD (%) 3610 (23.5) 2248 (21.1) 1362 (28.9) <0.001 Stroke (%) 1295 (8.4) 597 (5.6) 698 (14.8) <0.001 Mental diseases (%) 422 (2.7) 204 (1.9) 218 (4.6) <0.001 Arthritis (%) 6554 (42.6) 3872 (36.3) 2682 (56.9) <0.001 Liver diseases (%) 968 (6.3) 599 (5.6) 369 (7.8) <0.001 Kidney disease (%) 1556 (10.1) 868 (8.1) 688 (14.6) <0.001 Digestive diseases (%) 4483 (29.2) 2813 (26.4) 1670 (35.4) <0.001 Memory-related diseases (%) 945 (6.1) 384 (3.6) 561 (11.9) <0.001 Note. All results presented were calculated based on unweighted data. Mental diseases included emotional, nervous, or psychiatric problems; Arthritis included the rheumatism; Memory-related diseases (including dementia, brain atrophy, and Parkinson’s disease).
Abbreviations: CRDs: chronic respiratory diseases; IHD: ischemic heart disease; SD: standard deviation. -
In the results of the MCMC simulation, the BLRM outperformed other models, especially when the sample size was less than 5,000 (Supplementary Figures S2-S3). We applied this method to estimate age-specific DWs by sex among 55,861 participants from 2011 to 2020 in CHARLS (Supplementary Figure S4). Perturbation analysis indicated that a misclassification rate below 0.05 could result in an additional 5% margin of error (Supplementary Figure S5). DWs for most diseases increased with age. The steepest increases were observed for CRDs in males and liver diseases in females. Stroke, memory-related diseases, and arthritis had the highest DWs across all ages in both sexes (Supplementary Table S5). These DWs were then used to estimate cause-specific disability rates for decomposition (Supplementary Figure S6).
-
From 2011 to 2020, HLE60 increased from 11.90 to 12.73 years. Of the total 0.83-year gain in HLE60, reductions in all-cause mortality and decreases in disability rates contributed 0.41 and 0.42 years, respectively. The number of years lived with disability (YLDs) decreased from 5.60 to 5.43 years.
When stratified by sex, the increase in HLE60 due to reduced mortality was higher in females (0.45 years) than in males (0.36 years). However, the contribution from changes in disability was positive for males (0.90 years) but negative for females (−0.14 years). The proportion of HLE60 in LE60 increased for males between 2011 and 2020 but decreased for females. YLDs in females increased from 6.55 to 6.99 years, while in males, YLDs decreased from 4.76 to 4.07 years (Table 2).
Table 2. Contribution of mortality and disability to changes in LE60 and HLE60
Parameter Both sexes Male Female LE60 HLE60 LE60−HLE60 HLE60/LE60 (%) LE60 HLE60 LE60−HLE60 HLE60/LE60 (%) LE60 HLE60 LE60−HLE60 HLE60/LE60 (%) 2011 17.50 11.90 5.60 68.02 15.85 11.09 4.76 69.96 19.38 12.83 6.55 66.21 2020 18.16 12.73 5.43 70.09 16.42 12.35 4.07 75.20 20.13 13.14 6.99 65.29 Changes 0.67 0.83 − − 0.57 1.26 − − 0.74 0.31 − − Mortality effect 0.67 0.41 − − 0.57 0.36 − − 0.74 0.45 − − Disability effect 0.00 0.42 − − 0.00 0.90 − − 0.00 −0.14 − − Note. Abbreviations: LE60: Life expectancy at 60; HLE60: Healthy life expectancy at 60. -
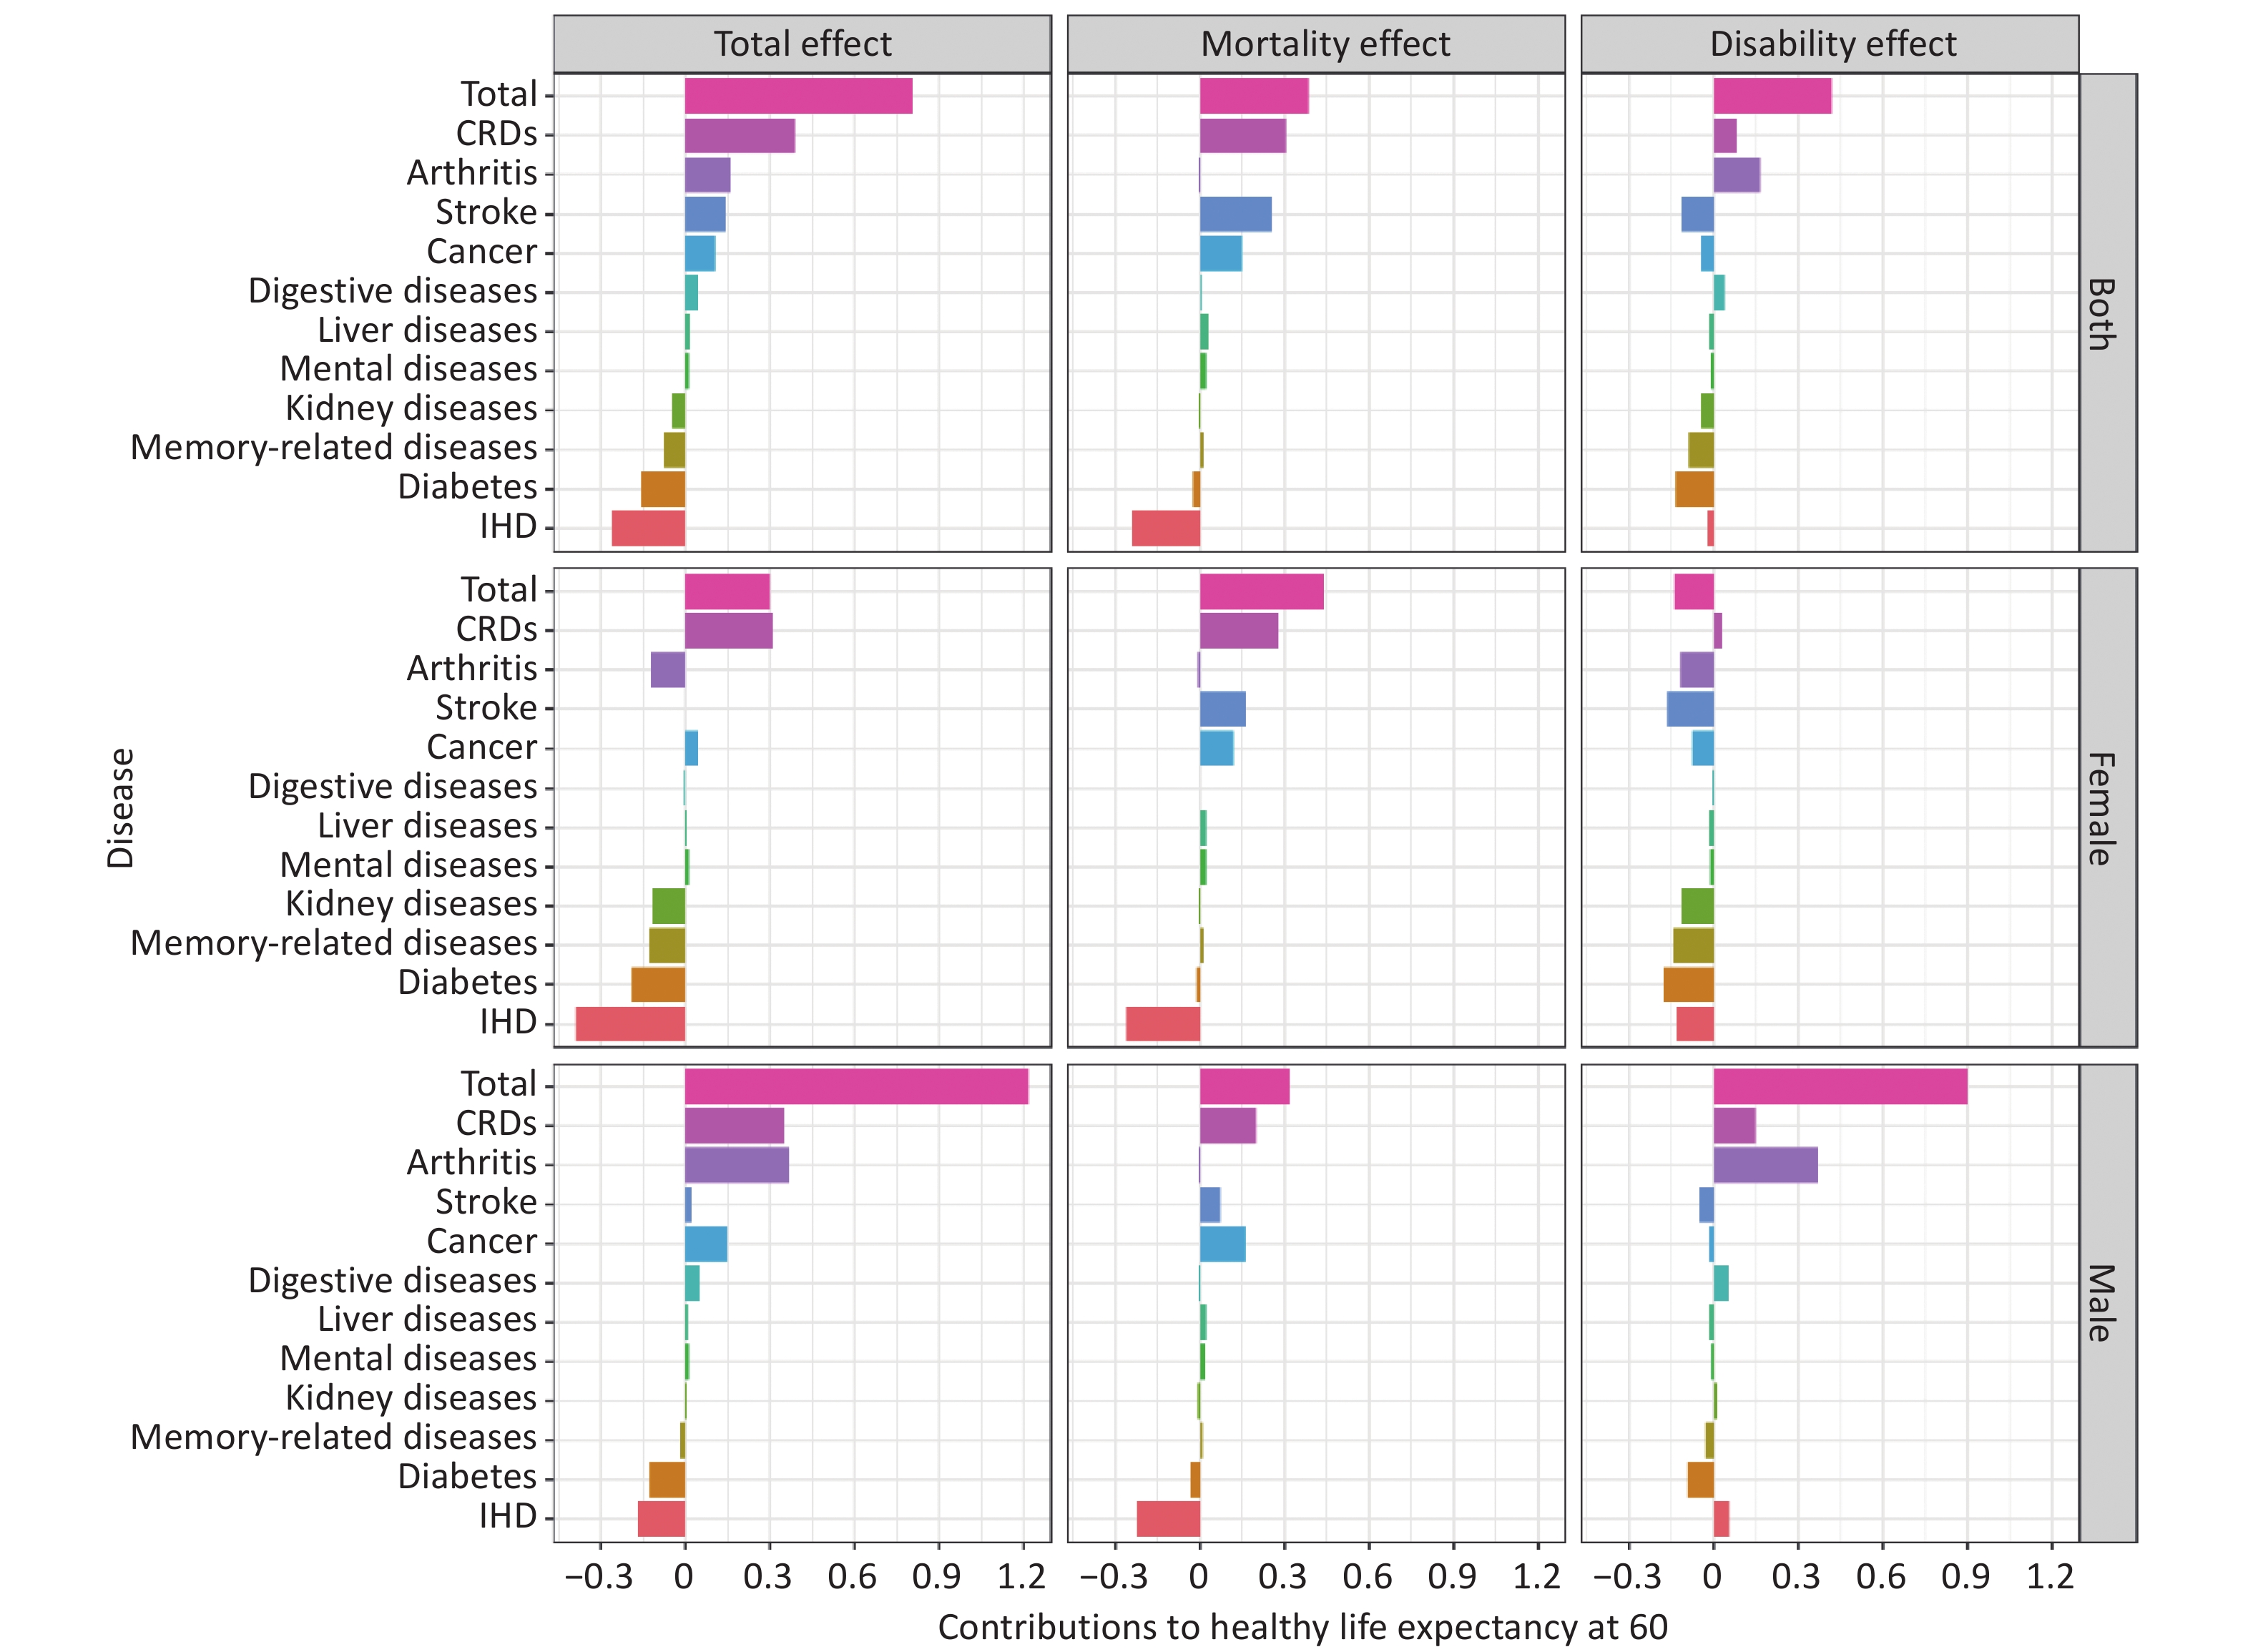
The decomposition results indicated that in both sexes, IHD led to the greatest reduction in HLE60 (−0.27 years), followed by diabetes (−0.16 years), memory-related diseases (−0.08 years), and kidney diseases (−0.05 years). In contrast, CRDs contributed the most to increases in HLE60 (0.39 years), followed by arthritis (0.16 years), stroke (0.14 years), and cancer (0.10 years).
From the perspective of mortality effects, reductions in mortality were mainly observed in CRDs (0.31 years), stroke (0.26 years), and cancer (0.15 years). However, elevated mortality rates from IHD led to a 0.24-year decrease in HLE60.
Regarding disability effects, arthritis (0.16 years), CRDs (0.08 years), and digestive diseases (0.04 years) had positive impacts, whereas diabetes (−0.13 years), stroke (−0.12 years), memory-related diseases (−0.09 years), cancer (−0.05 years), and kidney diseases (−0.04 years) had negative impacts. Other diseases contributed less substantially. Notably, the disability effects of arthritis on HLE60 differed by sex, with a significant positive impact in males (0.37 years) and a negative impact in females (−0.13 years) (Figure 2, Supplementary Table S6).
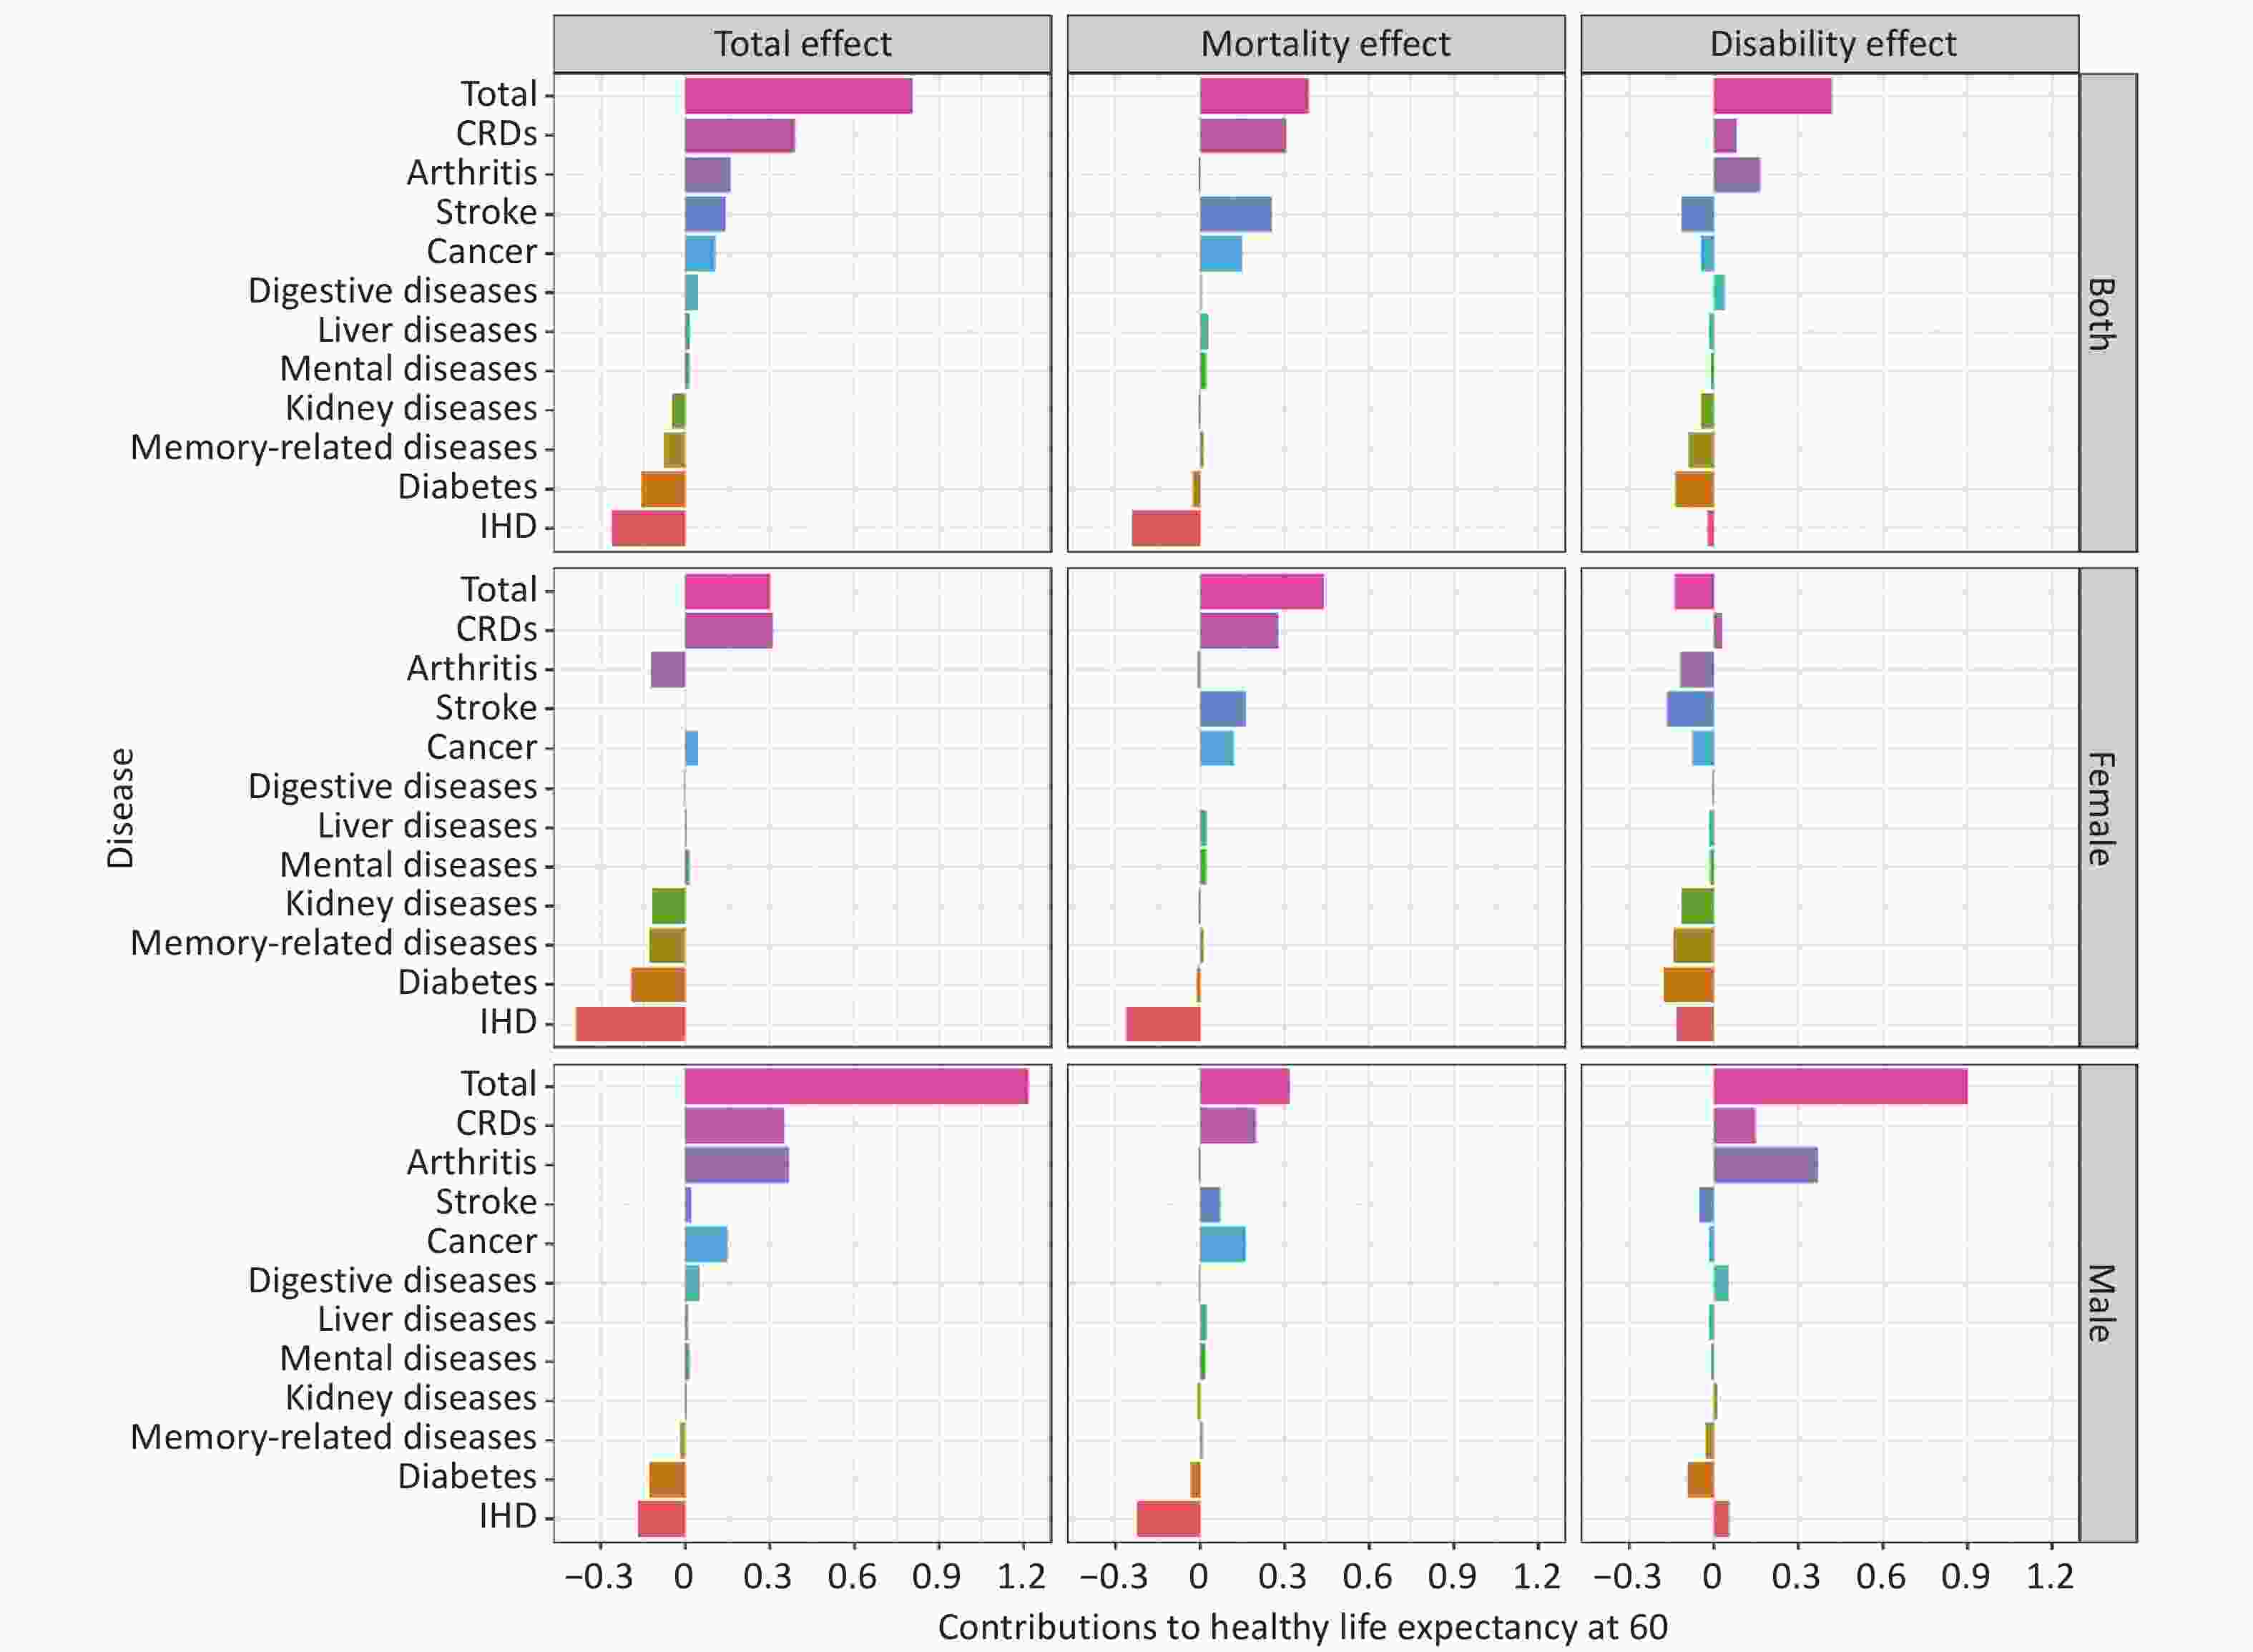
Figure 2. Total, mortality and disability effects of diseases in HLE60 changes in China, from 2011 to 2020.
Estimates based on the GBD2021 projects are presented in the supplementary materials (Supplementary Tables S7-S8, Supplementary Figure S7). Overall, the estimates using GBD2021 mortality rates were similar to those based on official mortality data from China. However, the contribution of IHD to HLE60 showed an opposite trend, which was mainly attributable to differing temporal trends in IHD mortality rates (Supplementary Figure S8).
-
In this study, we found that the increase in HLE60 from 2011 to 2020 was primarily attributable to the reduction in mortality rates—especially among females—based on age-specific DWs and the decomposition of HLE60 changes using data from the nationally representative CHARLS. IHD was the leading cause of the decline in HLE60, primarily due to its mortality effects. Regarding disability effects, diabetes and stroke were the main contributors to the reduction in HLE60. The disability rates for arthritis decreased in males but increased in females, which mainly contributed to the observed sex differences in HLE60 trends.
We identified IHD as the disease with the greatest mortality burden among older adults in China. The increasing trend in IHD-related mortality has also been reported by Zhao et al[25]. Notably, nearly half of IHD deaths in China occur outside hospitals[26-28], highlighting the urgent need for enhanced prehospital or community-based health education, services, and personal awareness regarding IHD.
For disability effects, diabetes and stroke were the most influential. As reported by Jia et al., China faces a significant disease burden from diabetes and its complications, which cannot be addressed effectively through treatment alone[29]. Therefore, the implementation of integrated hospital–community hierarchical diabetes management is essential[30].
Although the decline in stroke-related mortality contributed to increased HLE60—second only to CRDs—the associated disability burden remains a serious concern. Our previous research found that while stroke contributed an additional 0.29 years to LE in China from 2013 to 2018, its disability sequelae resulted in a 0.14-year reduction[31]. This study confirmed those findings, revealing that stroke-related disability reduced HLE60 by 0.12 years. Stroke remains the leading cause of disability-adjusted life years among all diseases in China; however, secondary prevention and long-term treatment adherence remained inadequate[32]. Nationwide promotion of three-stage stroke rehabilitation[33]—including long-term rehabilitation at a rehabilitation center or the community or at home with appropriate functional training—is urgently needed.
We further identified that the major disability effects contributing to the difference in HLE60 between males and females were primarily due to arthritis. Previous studies have found that the burden of morbidity-driven diseases is higher in females, whereas the burden of mortality-driven diseases was higher in males. Low back pain has been identified as the condition with the largest difference in disability-adjusted life expectancy between the sexes[34]. Both low back pain and osteoarthritis-related pain in elderly women may be partially explained by changes in estrogen levels after menopause, as estrogen deficiency can cause intervertebral disc degeneration and osteoarthritis through molecular mechanisms affecting cell proliferation and viability[35]. Therefore, more attention should be paid to disability among older adult females, particularly those with arthritis (including rheumatism).
Faced with elevated mortality rates from IHD and rising disability rates due to diabetes, stroke, and arthritis in China, it is necessary to shift the focus toward integrated, people-centered health services. Despite growth in the primary care workforce, the traditional healthcare system in China remains hospital-centered and treatment-dominated, with healthcare providers’ income still tied to service volume. Primary care facilities continue to lack adequately trained medical staff and advanced diagnostic equipment[36]. Moreover, collaboration between community health stations and hospitals remains limited, and patients often prefer to seek care at hospitals[37].
The WHO and the World Bank jointly released a report titled Deepening health reform in China, calling for the creation of a people-centered, high-quality, integrated healthcare system and for elevating the status of the health workforce, especially primary care providers[38]. In response, healthcare reform programs were initiated in Shenzhen, including the establishment of a referral system between community health centers and hospitals and the implementation of a performance measurement system[39,40]. These reforms have encouraged more healthcare professionals to pursue careers in community health service centers and have motivated hospitals to engage in early screening, prevention, and the management of high-risk individuals at the community level. The practice of integrated care has made progress in managing chronic diseases and promoting population health[41,42]. An integrated healthcare system is increasingly valued and being adopted in more cities across China to help delay the early onset of major chronic diseases.
Hypertension, hyperlipidemia, hyperglycemia, and high body mass index are common risk factors for cardiometabolic diseases. The Healthy China Action (2019-2030) initiative proposes promoting the co-management of these conditions[43]. Recently, initiatives such as the "Weight Management Year" campaign have been launched. Meanwhile, attention should be paid to regional differences in the burden of cardiometabolic diseases across China[25]. For example, the standardized incidence of stroke is higher in Northeast China, while the standardized mortality rate of stroke is higher in Southwest China[44]. Therefore, in the context of limited medical resources, it is necessary to identify key risk factors and potential interventions in each region and to strengthen locally tailored intervention strategies.
Valuable lessons can be drawn from cholesterol management practices in the United States. Studies have shown that reductions in total cholesterol contributed most significantly to the reduction in coronary heart disease (CHD) mortality in the United States, accounting for a 24% decrease[45]. In contrast, an increase in CHD mortality between 1984 and 1999 in Beijing, China, was 77% attributable to rising cholesterol levels[46]. In 1985, the United States launched the National Cholesterol Education Program[47] and developed guidelines for the detection, evaluation, and treatment of high cholesterol in adults (Adult Treatment Panel, ATP)[48]. With aging and urbanization in China, the disease spectrum is changing, and primary prevention of lipid disorders has been incorporated into national guidelines[49]. Low- and middle-income developing countries may face an even heavier disease burden in the future than China[50]. Therefore, early implementation of prospective risk factor prevention and the development of integrated, community-centered healthcare systems are imperative.
In our research, we estimated cause-specific disability rates using data from the nationally representative Chinese survey CHARLS, and mortality rate data were directly obtained from the national health authority, rather than relying on DWs and mortality rates from GBD2021. We compared our results with those from the GBD2021 project and found that the main difference was the temporal trend of mortality rates among the elderly in China. Previous studies have identified the issues of garbage coding when comparing cardiovascular diseases data across years in China[51]. Additionally, the cause-specific mortality estimates in GBD2021 may be influenced by constraints inherent in data availability[52]. By incorporating official vital statistics from China, we provided a more accurate population mortality rate than the estimation of the GBD2021 project.
Furthermore, we defined disability as activity limitation, consistent with the HLE definition used by the government. This differs from the disease-based Health-Adjusted Life Expectancy approach used in the GBD project. By considering individual disease patterns and disabilities, the importance of prognosis can be better emphasized. Moreover, the DWs used in GBD2021 were derived primarily from web-based surveys conducted in European populations[53], which may not accurately reflect disease patterns in China[54].
There were several limitations to this study. First, CHARLS was designed for older adults in China, which limited our analysis across all age groups. Second, the self-reported diseases in CHARLS were pre-defined, and some of the residual changes in HLE60 may be better explained if a broader range of conditions were investigated. Additionally, varying self-reporting rates across different diseases may introduce discrepancies, potentially leading to inaccurate estimations of the burden of certain conditions. As healthcare big data become more accessible and refined, more accurate outpatient and inpatient health records for participants will be available. The COVID-19 epidemic may also have impacted diagnostic resources, potentially leading to an underestimation of disease prevalence at the time and contributing to an increased disease burden in subsequent years.
In conclusion, to improve HLE in China, establishing and enhancing an integrated healthcare system that prioritizes the prevention, diagnosis, treatment, and rehabilitation of IHD should be a top public health priority. Additionally, special attention should be paid to the disability burden from diabetes, stroke, and arthritis among females. Future medical services at community health centers focusing on the rehabilitation of patients with these conditions are warranted.
doi: 10.3967/bes2025.064
The Impacts of Major Chronic Diseases on Changes in Healthy Life Expectancy Among Older Adults in China from 2011 to 2020
-
Abstract:
Objectives This study aimed to quantify the impact of major chronic diseases on changes in healthy life expectancy (HLE) from 2011 to 2020 in China using an age-specific disability weights (DW) estimation method. Methods HLE at age 60 (HLE60) was used as the indicator of HLE in China. Cause-specific mortality rates were obtained from the cause-of-death database of the National Health Commission. Self-reported disease and disability status were derived from the China Health and Retirement Longitudinal Study. A total of 55,861 participants were included for DW estimation. Rates of disability, which was assessed using the Activities of Daily Living questionnaires, were estimated using data from 5,465 participants in 2011 and 9,910 participants in 2020. Age-specific DWs were calculated using a Bayesian logistic regression model. Changes in HLE60 were decomposed into mortality and disability effects by cause, based on the estimated DWs. Results HLE60 in China increased by 0.83 years from 2011 to 2020. Ischemic heart disease (IHD) contributed the most to the decline in HLE60, remaining the leading cause of reduction in terms of mortality effects. Diabetes showed the greatest impact on HLE60 due to disability, followed by stroke. The largest sex disparities in HLE60 were associated with disability from arthritis. Conclusion HLE60 in China improved from 2011 to 2020 and IHD remained the leading contributor to its decline, particularly through increased mortality. Disabilities related to diabetes, stroke, and arthritis had significant negative impacts. These findings highlight the need to strengthen integrated chronic disease prevention and rehabilitation services at community health centers. -
Key words:
- Healthy life expectancy /
- Decomposition /
- Bayesian approach /
- Integrated healthcare /
- Community-based health services
The authors declare no competing interests.
All data used were derived from publicly available data. The ethnical approval for CHARLS was from the Biomedical Ethics Committee of Peking University (IRB00001052-11015).
注释:1) Authors’ Contributions: 2) Competing interests: 3) Ethics: -
Figure 1. Process chart of participants' inclusion and exclusion, and the workflow of decomposition.
Abbreviations: LE60: Life expectancy at 60; HLE60: Healthy life expectancy at 60; ADL: Activities of Daily Living (ADL) questionnaires; BLRM: Bayesian logistic regression model; GBD: Global Burden of Disease; DWs: disability weights; CHARLS: China Health and Retirement Longitudinal Study.
Figure 2. Total, mortality and disability effects of diseases in HLE60 changes in China, from 2011 to 2020.
Mental diseases included emotional, nervous, or psychiatric problems; Arthritis included the rheumatism; Memory-related diseases (including dementia, brain atrophy, and Parkinson’s disease). Abbreviations: CRDs: chronic respiratory diseases; IHD: ischemic heart disease.
Table 1. Baseline characteristics of participants stratified by disability
Characteristics Overall No disability Disability P Sample size 15375 10660 4715 Age (mean (SD)) 68.98 (6.95) 68.26 (6.56) 70.60 (7.51) <0.001 Female (%) 8074 (52.5) 5300 (49.7) 2774 (58.8) <0.001 Secondary school and above (%) 3305 (21.5) 2614 (24.5) 691 (14.7) <0.001 Current smokers (%) 6620 (43.1) 4756 (44.6) 1864 (39.5) <0.001 Alcohol use (%) 3536 (23.0) 2683 (25.2) 853 (18.1) <0.001 Diabetes (%) 2150 (14.0) 1341 (12.6) 809 (17.2) <0.001 Cancer (%) 350 (2.3) 221 (2.1) 129 (2.7) 0.013 CRDs (%) 2601 (16.9) 1591 (14.9) 1010 (21.4) <0.001 IHD (%) 3610 (23.5) 2248 (21.1) 1362 (28.9) <0.001 Stroke (%) 1295 (8.4) 597 (5.6) 698 (14.8) <0.001 Mental diseases (%) 422 (2.7) 204 (1.9) 218 (4.6) <0.001 Arthritis (%) 6554 (42.6) 3872 (36.3) 2682 (56.9) <0.001 Liver diseases (%) 968 (6.3) 599 (5.6) 369 (7.8) <0.001 Kidney disease (%) 1556 (10.1) 868 (8.1) 688 (14.6) <0.001 Digestive diseases (%) 4483 (29.2) 2813 (26.4) 1670 (35.4) <0.001 Memory-related diseases (%) 945 (6.1) 384 (3.6) 561 (11.9) <0.001 Note. All results presented were calculated based on unweighted data. Mental diseases included emotional, nervous, or psychiatric problems; Arthritis included the rheumatism; Memory-related diseases (including dementia, brain atrophy, and Parkinson’s disease).
Abbreviations: CRDs: chronic respiratory diseases; IHD: ischemic heart disease; SD: standard deviation. 下载: 导出CSV
Table 2. Contribution of mortality and disability to changes in LE60 and HLE60
Parameter Both sexes Male Female LE60 HLE60 LE60−HLE60 HLE60/LE60 (%) LE60 HLE60 LE60−HLE60 HLE60/LE60 (%) LE60 HLE60 LE60−HLE60 HLE60/LE60 (%) 2011 17.50 11.90 5.60 68.02 15.85 11.09 4.76 69.96 19.38 12.83 6.55 66.21 2020 18.16 12.73 5.43 70.09 16.42 12.35 4.07 75.20 20.13 13.14 6.99 65.29 Changes 0.67 0.83 − − 0.57 1.26 − − 0.74 0.31 − − Mortality effect 0.67 0.41 − − 0.57 0.36 − − 0.74 0.45 − − Disability effect 0.00 0.42 − − 0.00 0.90 − − 0.00 −0.14 − − Note. Abbreviations: LE60: Life expectancy at 60; HLE60: Healthy life expectancy at 60.
下载: 导出CSV
-
[1] World Health Organization. Evidence, policy, impact: WHO guide for evidence-informed decision-making. World Health Organization. 2022. [2] Robine JM, Jagger C. Creating a coherent set of indicators to monitor health across Europe: the Euro-REVES 2 project. Eur J Public Health, 2003; 13, 6−14. doi: 10.1093/eurpub/13.suppl_1.6 [3] Saito Y, Robine JM, Crimmins EM. The methods and materials of health expectancy. Stat J IAOS, 2014; 30, 209−23. doi: 10.3233/SJI-140840 [4] Arora VS, Karanikolos M, Clair A, et al. Data resource profile: the European Union Statistics on income and living conditions (EU-SILC). Int J Epidemiol, 2015; 44, 451−61. doi: 10.1093/ije/dyv069 [5] Hintzpeter B, Finger JD, Allen J, et al. European health interview survey (EHIS) 2 - background and study methodology. J Health Monit, 2019; 4, 66−79. [6] Börsch-Supan A, Brandt M, Hunkler C, et al. Data resource profile: the survey of health, ageing and retirement in Europe (SHARE). Int J Epidemiol, 2013; 42, 992−1001. doi: 10.1093/ije/dyt088 [7] Madans JH, Weeks JD. A framework for monitoring progress using summary measures of health. J Aging Health, 2016; 28, 1299−314. doi: 10.1177/0898264316656510 [8] Overall health and well-being measures. https://health.gov/healthypeople/objectives-and-data/overall-health-and-well-being-measures. [9] Chen PJ, Li FZ, Harmer P. Healthy China 2030: moving from blueprint to action with a new focus on public health. Lancet Public Health, 2019; 4, E447. doi: 10.1016/S2468-2667(19)30160-4 [10] Tsuji I. Current status and issues concerning health Japan 21 (second term). Nutr Rev, 2020; 78, 14−7. doi: 10.1093/nutrit/nuaa079 [11] Oksuzyan A, Brønnum-Hansen H, Jeune B. Gender gap in health expectancy. Eur J Ageing, 2010; 7, 213−8. doi: 10.1007/s10433-010-0170-4 [12] Di Lego V, Lazarevič P, Luy M. The male-female health-mortality paradox. In: Gu D, Dupre ME. Encyclopedia of Gerontology and Population Aging. Springer. 2019, 1-8. [13] Nusselder WJ, Looman CWN. Decomposition of differences in health expectancy by cause. Demography, 2004; 41, 315−34. doi: 10.1353/dem.2004.0017 [14] Andreev EM, Shkolnikov V, Begun A. Algorithm for decomposition of differences between aggregate demographic measures and its application to life expectancies, healthy life expectancies, parity-progression ratios and total fertility rates. Demogr Res, 2002; 7, 499−522. doi: 10.4054/DemRes.2002.7.14 [15] Banham D, Woollacott T, Lynch J. Healthy life gains in South Australia 1999-2008: analysis of a local Burden of Disease series. Popul Health Metr, 2011; 9, 13. doi: 10.1186/1478-7954-9-13 [16] Yokota RTC, Nusselder WJ, Robine JM, et al. Contribution of chronic conditions to gender disparities in health expectancies in Belgium, 2001, 2004 and 2008. Eur J Public Health, 2019; 29, 82−7. doi: 10.1093/eurpub/cky105 [17] Zhao Y, Unnikrishnan R, Chondur R, et al. Decomposing the gaps in healthy and unhealthy life expectancies between Indigenous and non-Indigenous Australians: a burden of disease and injury study. Popul Health Metr, 2024; 22, 15. doi: 10.1186/s12963-024-00335-z [18] Chen H, Chen G, Zheng XY, et al. Contribution of specific diseases and injuries to changes in health adjusted life expectancy in 187 countries from 1990 to 2013: retrospective observational study. BMJ, 2019; 364, l969. [19] GBD 2021 Causes of Death Collaborators. Global burden of 288 causes of death and life expectancy decomposition in 204 countries and territories and 811 subnational locations, 1990-2021: a systematic analysis for the Global Burden of Disease Study 2021. Lancet, 2024; 403, 2100−32. doi: 10.1016/S0140-6736(24)00367-2 [20] Zhao YH, Hu YS, Smith JP, et al. Cohort profile: the China health and retirement longitudinal study (CHARLS). Int J Epidemiol, 2014; 43, 61−8. doi: 10.1093/ije/dys203 [21] Katz S, Ford AB, Moskowitz RW, et al. Studies of illness in the aged. The index of ADL: a standardized measure of biological and psychosocial function. JAMA, 1963; 185, 914−9. doi: 10.1001/jama.1963.03060120024016 [22] Chen TQ, Guestrin C. XGBoost: a scalable tree boosting system. In: Proceedings of the 22nd ACM SIGKDD International Conference on Knowledge Discovery and Data Mining. Association for Computing Machinery. 2016, 785-94. [23] Liu Y, Allan, J. SHAPforxgboost: SHAP Plots for 'XGBoost'. R package version 0.1. 0. https://github.com/liuyanguu/SHAPforxgboost/. [24] World Health Organization. Evidence, policy, impact: WHO guide for evidence-informed decision-making. World Health Organization. 2022. [25] Zhao D, Liu J, Wang M, et al. Epidemiology of cardiovascular disease in China: current features and implications. Nat Rev Cardiol, 2019; 16, 203−12. doi: 10.1038/s41569-018-0119-4 [26] Wan H, Li Y, Liu J, et al. [The epidemiology of out-of-hospital deaths due to acute coronary events in young Beijing adults]. Zhonghua Nei Ke Za Zhi, 2012; 51, 274−8. [27] Gao YL, Su JT, Wei ZH, et al. [Characteristics of out-of-hospital acute coronary heart disease deaths of Beijing permanent residents at the age of 25 or more from 2007 to 2009]. Zhonghua Xin Xue Guan Bing Za Zhi, 2012; 40, 199−203. [28] Zhao D. [The epidemiology of coronary heart disease (CHD) in 16 provinces of China. multi-province cooperative group of cardiovascular disease surveillance (MONICA Project)]. Zhonghua Liu Xing Bing Xue Za Zhi, 1993; 14, 10−3. [29] Jia WP, Chan JC, Wong TY, et al. Diabetes in China: epidemiology, pathophysiology and multi-omics. Nat Metab, 2025; 7, 16−34. doi: 10.1038/s42255-024-01190-w [30] Jia WP. Diabetes care in China: innovations and implications. J Diabetes Invest, 2022; 13, 1795−7. doi: 10.1111/jdi.13908 [31] Xia X, Cai Y, Cui X, et al. Temporal trend in mortality of cardiovascular diseases and its contribution to life expectancy increase in China, 2013 to 2018. Chin Med J, 2022; 135, 2066−75. doi: 10.1097/CM9.0000000000002082 [32] Wu SM, Wu B, Liu M, et al. Stroke in China: advances and challenges in epidemiology, prevention, and management. Lancet Neurol, 2019; 18, 394−405. doi: 10.1016/S1474-4422(18)30500-3 [33] Asakawa T, Zong L, Wang L, et al. Unmet challenges for rehabilitation after stroke in China. Lancet, 2017; 390, 121−2. [34] Patwardhan V, Gil GF, Arrieta A, et al. Differences across the lifespan between females and males in the top 20 causes of disease burden globally: a systematic analysis of the Global Burden of Disease Study 2021. Lancet Public Health, 2024; 9, E282−94. doi: 10.1016/S2468-2667(24)00053-7 [35] Pang HW, Chen SH, Klyne DM, et al. Low back pain and osteoarthritis pain: a perspective of estrogen. Bone Res, 2023; 11, 42. doi: 10.1038/s41413-023-00280-x [36] Liu LY. Major challenges and solutions of deepening health system reforms. Adm Reform, 2024; 11, 4−12. (In Chinese) [37] Lancet T. A tiered health-care delivery system for China. Lancet, 2019; 393, 1178. [38] Healthy China: deepening health reform in China: building high-quality and value-based service delivery (Chinese). Washington: World Bank Group, http://documents.worldbank.org/curated/en/295711578038265140/Building-High-Quality-and-Value-Based-Service-Delivery. [39] Wang X, Sun XZ, Gong FF, et al. The Luohu Model: a template for integrated urban healthcare systems in China. Int J Integr Care, 2018; 18, 3. [40] Wang X, Sun XZ, Birch S, et al. People-centred integrated care in urban China. Bull World Health Organ, 2018; 96, 843−52. doi: 10.2471/BLT.18.214908 [41] Liang D, Mei L, Chen YY, et al. Building a people-centred integrated care model in urban China: a qualitative study of the health reform in Luohu. Int J Integr Care, 2020; 20, 9. [42] Liu FY, Liu FC, Lin JC, et al. The early impact of the people-centred integrated care on the hypertension management in Shenzhen. Int J Integr Care, 2023; 23, 6. [43] 健康中国行动推进委员会. 健康中国行动(2019—2030年). https://www.gov.cn/xinwen/2019-07/15/content_5409694.htm. (查阅网上资料,未找到本条文献引用日期信息,请确认) (查阅所有网上资料,未找到本条文献英文翻译,请确认) [44] Tu WJ, Zhao ZP, Yin P, et al. Estimated burden of stroke in China in 2020. JAMA Netw Open, 2023; 6, e231455. doi: 10.1001/jamanetworkopen.2023.1455 [45] Ford ES, Ajani UA, Croft JB, et al. Explaining the decrease in U. S. deaths from coronary disease, 1980-2000. N Engl J Med, 2007; 356, 2388−98. doi: 10.1056/NEJMsa053935 [46] Critchley J, Liu J, Zhao D, et al. Explaining the increase in coronary heart disease mortality in Beijing between 1984 and 1999. Circulation, 2004; 110, 1236−44. doi: 10.1161/01.CIR.0000140668.91896.AE [47] Cleeman JI, Lenfant C. The national cholesterol education program. JAMA, 1998; 280, 2099−104. doi: 10.1001/jama.280.24.2099 [48] Report of the National Cholesterol Education Program Expert Panel on Detection, Evaluation, and Treatment of High Blood Cholesterol in Adults. The Expert Panel. Arch Intern Med, 1988; 148, 36-69. [49] Li JJ, Zhao SP, Zhao D, et al. 2023 China guidelines for lipid management. J Geriatr Cardiol, 2023; 20, 621−63. doi: 10.26599/1671-5411.2023.09.008 [50] Bygbjerg IC. Double burden of noncommunicable and infectious diseases in developing countries. Science, 2012; 337, 1499−501. doi: 10.1126/science.1223466 [51] Wan X, Yang GH. Is the mortality trend of ischemic heart disease by the GBD2013 study in China real?. Biomed Environ Sci, 2017; 30, 204−9. [52] GBD 2021 Demographics Collaborators. Global age-sex-specific mortality, life expectancy, and population estimates in 204 countries and territories and 811 subnational locations, 1950-2021, and the impact of the COVID-19 pandemic: a comprehensive demographic analysis for the Global Burden of Disease Study 2021. Lancet, 2024; 403, 1989−2056. doi: 10.1016/S0140-6736(24)00476-8 [53] Salomon JA, Haagsma JA, Davis A, et al. Disability weights for the Global Burden of Disease 2013 study. Lancet Glob Health, 2015; 3, e712−23. doi: 10.1016/S2214-109X(15)00069-8 [54] Liu XX, Wang F, Yu CH, et al. Eliciting national and subnational sets of disability weights in mainland China: Findings from the Chinese disability weight measurement study. Lancet Reg Health West Pac, 2022; 26, 100520. -

 点击查看大图
计量
- 文章访问数: 13
- HTML全文浏览量: 5
- PDF下载量: 2
- 被引次数: 0

 Quick Links