

 下载:
下载:

-
Kashin-Beck disease (KBD) is an endemic, deformative osteoarthropathy characterized by distinct geographic clusters[1]. Historically, 13 provinces and autonomous regions in China have been designated as KBD-affected areas. In severely endemic areas, the radiographic detection rate had reached up to 80%[1]. Although comprehensive prevention and control measures, including dietary restructuring, grain substitution, and relocation of educational facilities, have successfully halted new pediatric cases, the persistent threat posed by environmental risk factors suggests that the relaxation of these measures could lead to the resurgence of KBD.
The most widely accepted etiological hypothesis for KBD is the combined “environmental selenium deficiency–fungal toxin exposure” model. Selenium deficiency creates a critical nutritional environment, while exposure to the T-2 toxin, produced by Fusarium spp. in cereals, directly triggers pathogenesis. Natural environmental factors associated with KBD-affected areas include cold and humid climates, significant diurnal temperature variations, and mountainous topography[2]. Soil characteristics, such as water-holding capacity, organic matter, nitrogen content, and salinization-alkalization processes, directly influence soil microecology in these regions. These conditions favor fungal proliferation and toxin production while simultaneously regulating the biogeochemical cycling of selenium[3]. Additionally, previous studies suggest that KBD predominantly affects economically disadvantaged areas with poorly developed transportation infrastructure[4].
The current understanding of the environmental etiology of KBD primarily relies on descriptive summaries, with limited quantitative analysis of synergistic environmental factors. Furthermore, traditional statistical methods are inadequate for analyzing hierarchical data structures such as villages nested within different selenium zones. Ignoring within-cluster correlations may severely underestimate parameter standard errors, artificially narrow confidence intervals, and consequently, increase type-I error rates[5]. To address these gaps, this study aimed to (1) quantify the impact of key environmental factors on KBD severity in endemic villages and (2) identify environmental factor combinations that present high risk, thereby providing a scientific basis for targeted prevention.
We used data from the National KBD Surveillance System of the Chinese Center for Disease Control and Prevention, which covers the 13 historically endemic provinces (including autonomous regions) in China. The analysis included 16,512 endemic villages (Supplementary Figure S1A; administrative map sourced from the National Platform for Common Geospatial Information Services; Review No. GS(2024)0650). KBD-endemic villages were categorized as mild, moderate, or severe according to the national criteria for designating and classifying endemic areas of KBD (GB 16395-2011; Supplementary Tables S1 and S2). Stratified random sampling was employed to select control villages without a history of KBD from each endemic province. In the present study, the outcome variable was ordinal. “Risk” refers to the probability or odds ratio of a village being classified within a more severe KBD category, serving as a measure of association between environmental factors and increased disease severity.
The environmental and socioeconomic predictive variables used in this study were obtained from publicly available national databases. Detailed descriptions and coding of the variables are presented in Supplementary Table S3. The topographic factors included altitude and slope. The climatic variables included mean annual temperature (Bio1), annual precipitation (Bio12), relative humidity (RH), and isothermality (Bio3). The soil physical properties included gravel content (T_GRAVEL), sand content (T_SAND), silt content (T_SILT), and porosity. The soil chemical properties included the exchangeable sodium percentage (T_ESP), electrical conductivity (T_ECE), pH, alkali-hydrolysable nitrogen (AN), and organic matter. Socioeconomic indicators included gross domestic product (GDP) and distance to the nearest railway (rail). Selenium zones were classified into three categories: low, marginal, and moderately-high selenium (Supplementary Table S4).
Univariate screening was performed before multilevel modeling. Continuous variables are expressed as mean ± standard deviation (x±s). Differences among severity groups were tested using one-way analysis of variance (ANOVA). Categorical variables were summarized as frequencies (percentages), and differences between groups were assessed using the chi-square test. Statistical significance was set at α = 0.01. All continuous variables were standardized using Z-scores before inclusion in the model. Multicollinearity was assessed using Pearson’s correlation coefficients (with |r| > 0.8 indicating strong correlation) and variance inflation factors (VIF; a VIF > 5 indicated severe multicollinearity).
A Bayesian two-level ordinal logistic regression model was employed to address the hierarchical structure of villages (level-1) nested within the selenium zones (level-2). Village-level environmental variables and selenium zone categories were modeled as fixed effects. Random intercepts captured between-zone variability, allowing a systematic analysis of the associations between each variable and KBD severity in endemic villages.
Let yij represent the KBD severity grade (ranging from 0 to 3) of the i-th village within the j-th selenium zone. Then,
$$ {Pr(y_{ij}} \ge {k} | x_{ij},\kappa ,u_j)=H(x_{ij}\beta +z_{ij}u_j-\kappa_{\kappa }) $$ (1) To evaluate the significance of the random effects associated with selenium zones, a null model containing only an intercept and random effects was initially fitted. The model components are defined as follows:
$$ \text{Pr(yij} \ge \text{k}| \text{κ,uj)=H(kκ-uj) } $$ (2) In the above equations, yij denotes the severity grade of the i-th village within the j-th selenium zone; κk represents the k-th threshold parameter for ordinal classification; xij represents village-level predictors; zij indicates the selenium zone; uj is the random intercept for the j-th selenium zone, assumed to follow uj ~ N(0, σ2); and H(·) denotes the cumulative logistic distribution function, used to compute cumulative probabilities.
The model estimation employs weakly informative priors. Fixed-effect parameters (β) were assigned N(0, 1.5) priors for regularization. The model was constructed using the brms package in R with the cmdstanr backend employing the No-U-Turn Sampler (NUTS) for Markov chain Monte Carlo (MCMC) sampling (three chains, 1,200 iterations each). Posterior odds ratios (ORs) and 95% credible intervals (CrIs) were calculated to evaluate predictor effects. Model convergence was assessed using the potential scale reduction factor (Rhat), with values approaching 1.0 indicating stable convergence. To investigate nonlinear dose–response relationships, restricted cubic splines (RCS, four degrees of freedom) were incorporated for significant predictors. The knot positions were automatically selected using splines::ns() based on variable quantiles. The P for overall assessed global significance and P for nonlinear tested deviations from linearity (significance level < 0.01).
The final analysis included 33,022 villages: control (50.0%), mildly endemic (28.0%), moderately endemic (7.3%), and severely endemic (14.7%). Significant differences (P < 0.01) among these groups were observed in altitude, slope, climatic factors (Bio1, Bio12, RH, and Bio3), soil properties (T_GRAVEL, T_SAND, T_SILT, porosity, T_ESP, T_ECE, pH, AN, and organic matter), socioeconomic factors (GDP and distance to railways), and selenium backgrounds (Supplementary Table 5S). Eighty-four villages were located in areas with undefined selenium landscapes; these were excluded from the analyses. However, sensitivity analyses remained statistically significant after their exclusion (Supplementary Table 6S). Further analysis revealed a strong negative correlation between T_SAND and T_SILT (r = −0.91), with VIF exceeding 5, indicating severe multicollinearity. T_SAND was retained in the final model, whereas the other variables showed acceptable multicollinearity (VIF < 5; |r| < 0.8) (Supplementary Figure 2S; Supplementary Table 7S).
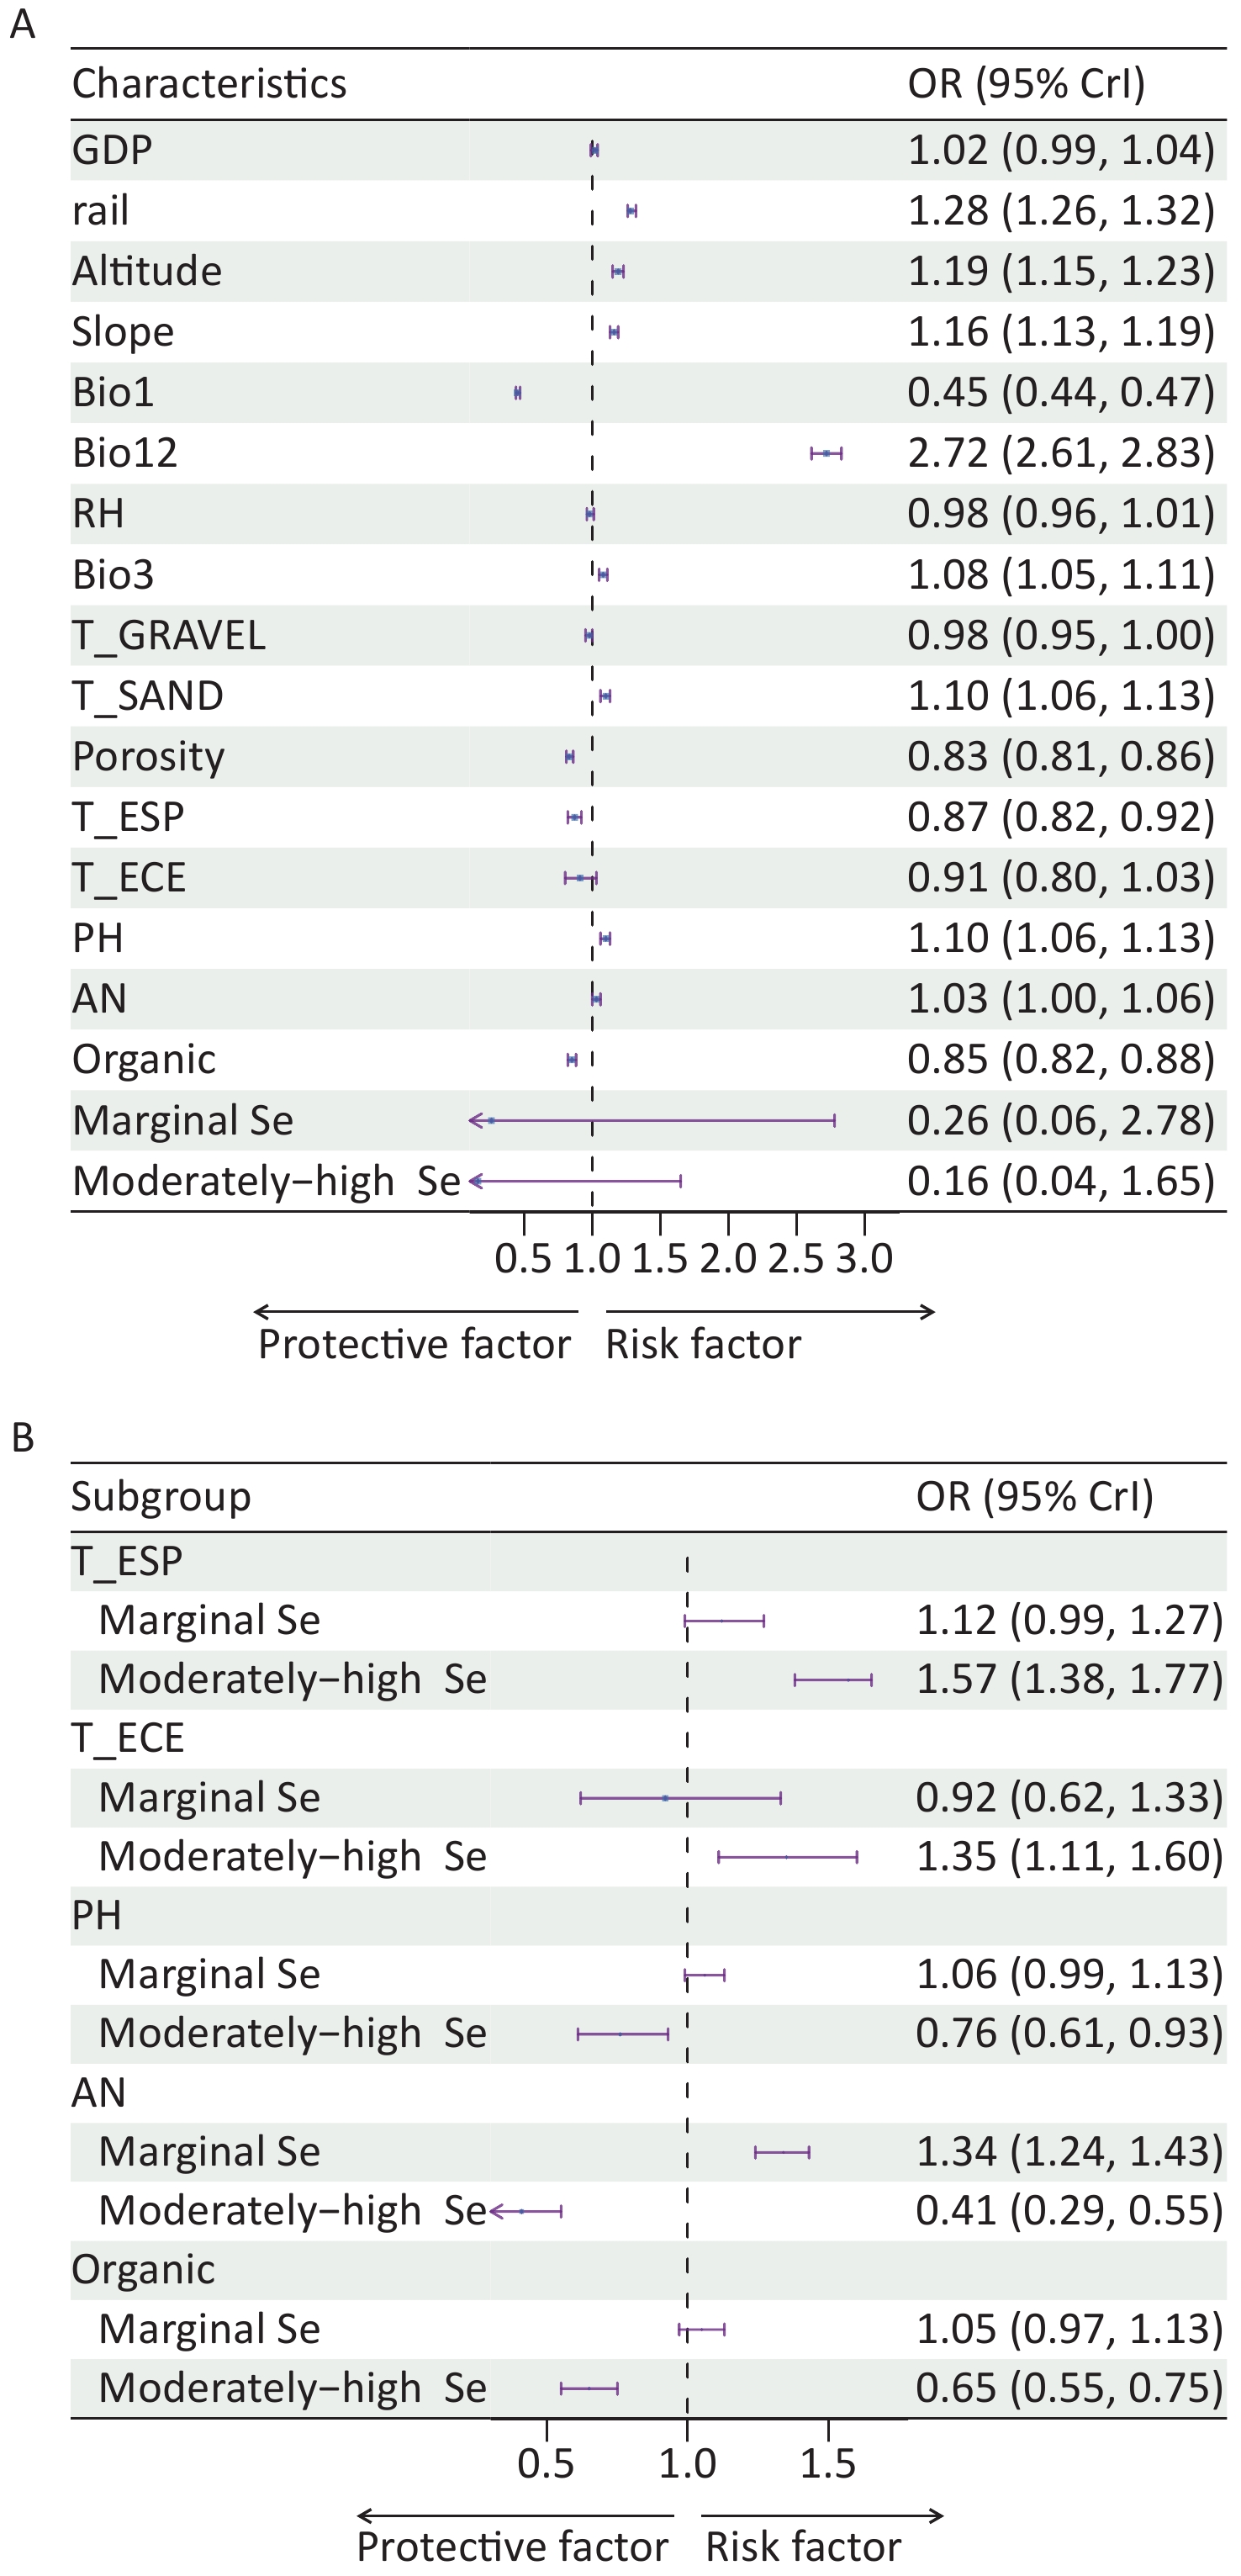
The Bayesian multilevel ordinal logistic regression model showed strong convergence (Rhat ≤ 1.01). A significant random effect at the selenium zone level (ICC = 0.47; σ = 1.87; P ≤ 0.01) justified the use of hierarchical modeling (Supplementary Table 8S). The primary analysis indicated that altitude, slope, Bio3, Bio12, T_SAND, pH, and increased distance to railways were associated with greater disease severity in KBD-endemic villages. Conversely, Bio1, porosity, T_ESP, and organic matter exhibited protective effects. GDP, RH, T_GRAVEL, T_ECE, and AN were not significantly associated with the severity of KBD. Compared to low-selenium zones, marginal and moderately-high selenium zones tended toward reduced risk, although their credible intervals included zero (Table 1, Figure 1A). Sensitivity analyses further validated these findings: (1) combining marginal and moderately-high selenium zones into a non-low selenium group provided results consistent with the primary analysis (Supplementary Table 9S; Supplementary Figure 3S); (2) converting the outcome into a binary classification (endemic/non-endemic villages) also revealed significant clustering (ICC = 0.42), with T_ECE emerging as a risk factor, whereas the effects of other predictors remained consistent (Supplementary Tables 10S–11S, Supplementary Figure 4S).
Table 1. Results of Bayesian multilevel ordinal logistic regression
Type Variables Estimate Est. Error 95% CrI (β) Rhat Fixed effects Intercept Intercept 1 (control vs mild+) −0.24 0.55 (−1.46, 0.98) 1.004 Intercept 2 (mild vs moderate+) 1.48 0.55 (0.25, 2.68) 1.004 Intercept 3 (moderate vs severe) 2.06 0.55 (0.82, 3.25) 1.004 Level 1 (village) GDP 0.02 0.01 (−0.01, 0.04) 1.000 rail 0.25 0.01 (0.23, 0.27) 1.001 Altitude 0.18 0.02 (0.14, 0.21) 1.001 Slope 0.15 0.01 (0.12, 0.17) 1.001 Bio1 −0.79 0.02 (−0.83, −0.76) 1.000 Bio12 1.00 0.02 (0.96, 1.04) 1.003 RH −0.02 0.01 (−0.04, 0.01) 1.001 Bio3 0.08 0.02 (0.05, 0.11) 1.000 T_GRAVEL −0.02 0.01 (−0.05, 0.00) 1.001 T_SAND 0.09 0.02 (0.06, 0.12) 1.001 Porosity −0.18 0.02 (−0.22, −0.15) 1.001 T_ESP −0.14 0.03 (−0.20, −0.08) 1.001 T_ECE −0.09 0.07 (−0.23, 0.03) 1.000 PH 0.09 0.02 (0.06, 0.13) 1.001 AN 0.03 0.02 (−0.00, 0.06) 1.002 Organic −0.17 0.02 (−0.20, −0.13) 1.001 Level 2 (Se) (Reference: Low Se) Marginal Se −1.35 0.98 (−2.82, 1.02) 1.001 Moderately-high Se −1.81 0.98 (−3.21, 0.50) 1.001 Random effects Level 2 (between-Se zone) 0.82 − (0.02, 2.45) 1.004 Note. Estimate, posterior mean of the fixed-effect regression coefficient; β, regression coefficient; SE, standard error; CrI, credible interval; Rhat, Gelman–Rubin statistic; GDP, gross domestic product; rail, railway length; Bio1, mean annual temperature; Bio12, annual precipitation; RH, relative humidity; Bio3, isothermality; T_GRAVEL, gravel content; T_SAND, sand content; T_ESP, exchangeable sodium percentage; T_ECE, electrical conductivity; AN, alkali-hydrolysable nitrogen; Se, selenium. Note: The estimates are from a Bayesian two-level ordinal logistic regression model with villages (level-1) nested within selenium zones (level-2). Fixed effects included village-level environmental and socioeconomic factors and selenium zone categories (reference: low Se). Random effects captured the between-selenium zone variability. 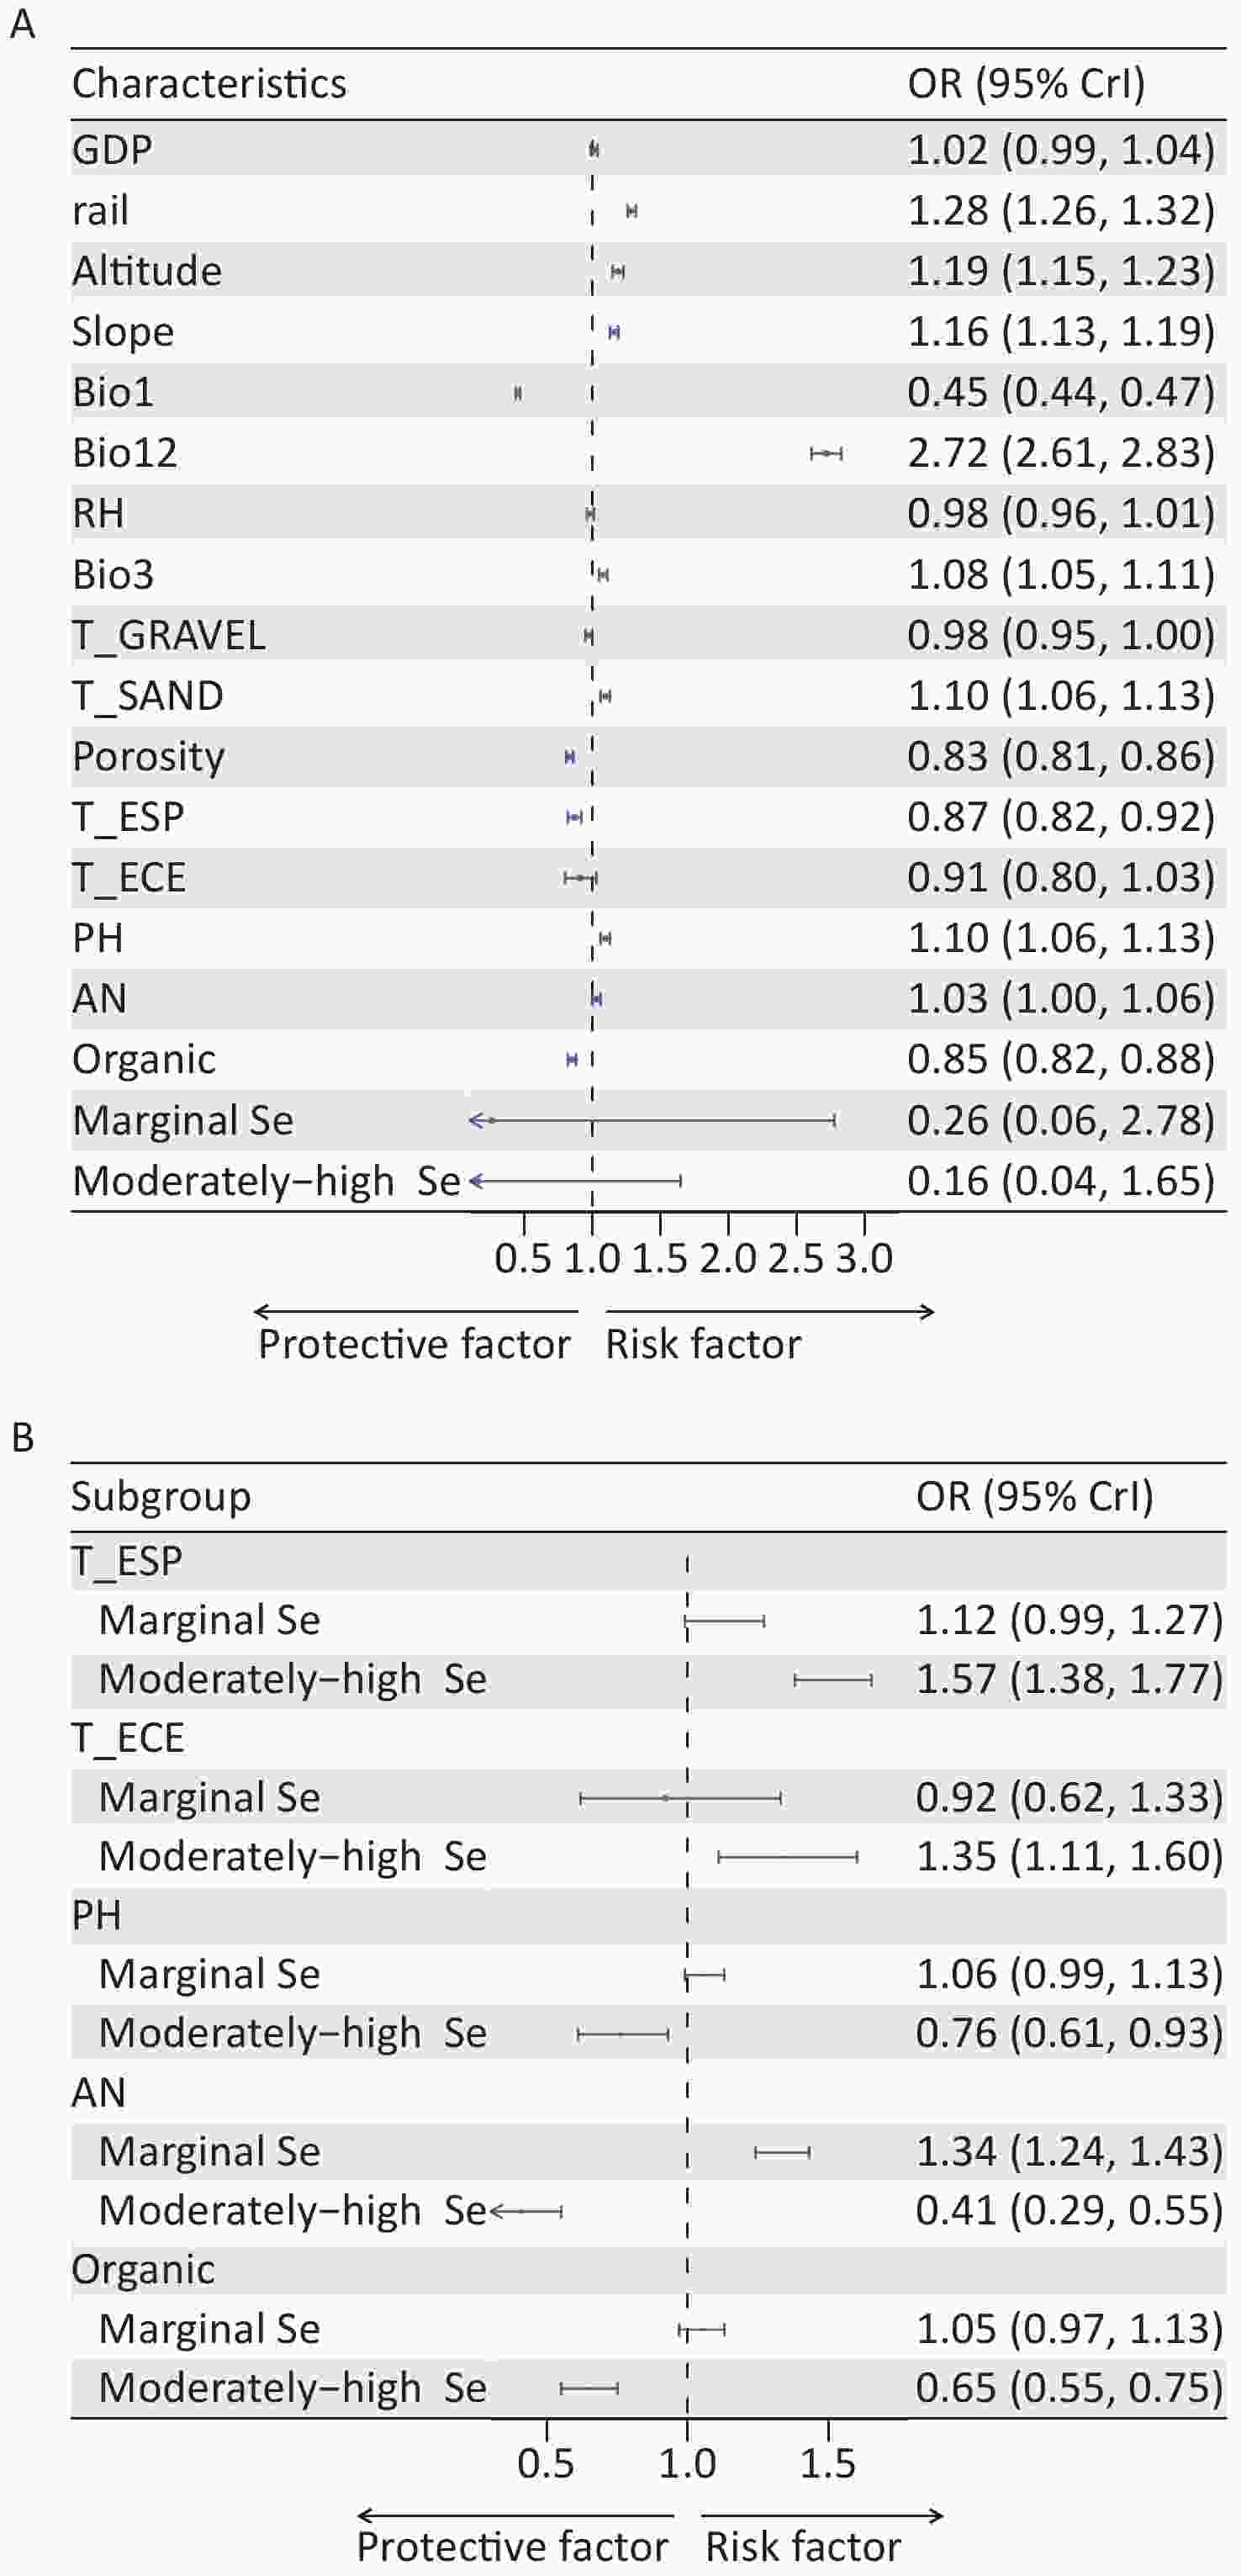
Figure 1. Association of environmental factors with KBD severity based on Bayesian multilevel ordinal logistic regression. (A) Forest plot of the fixed effects for primary environmental factors. (B) Forest plot of the interaction effects between selenium zones and soil properties. Green squares represent the posterior OR, with their size proportional to the estimation precision. The horizontal lines depict the 95% CrIs. The vertical dashed line indicates the null effect (OR = 1). Abbreviations: OR, odds ratio; CrI, credible interval; GDP, gross domestic product; rail, railway length; Bio1, mean annual temperature; Bio12, annual precipitation; RH, relative humidity; Bio3, isothermality; T_GRAVEL, gravel content; T_SAND, sand content; T_ESP, exchangeable sodium percentage; T_ECE, electrical conductivity; AN, alkali-hydrolysable nitrogen; Se, selenium.
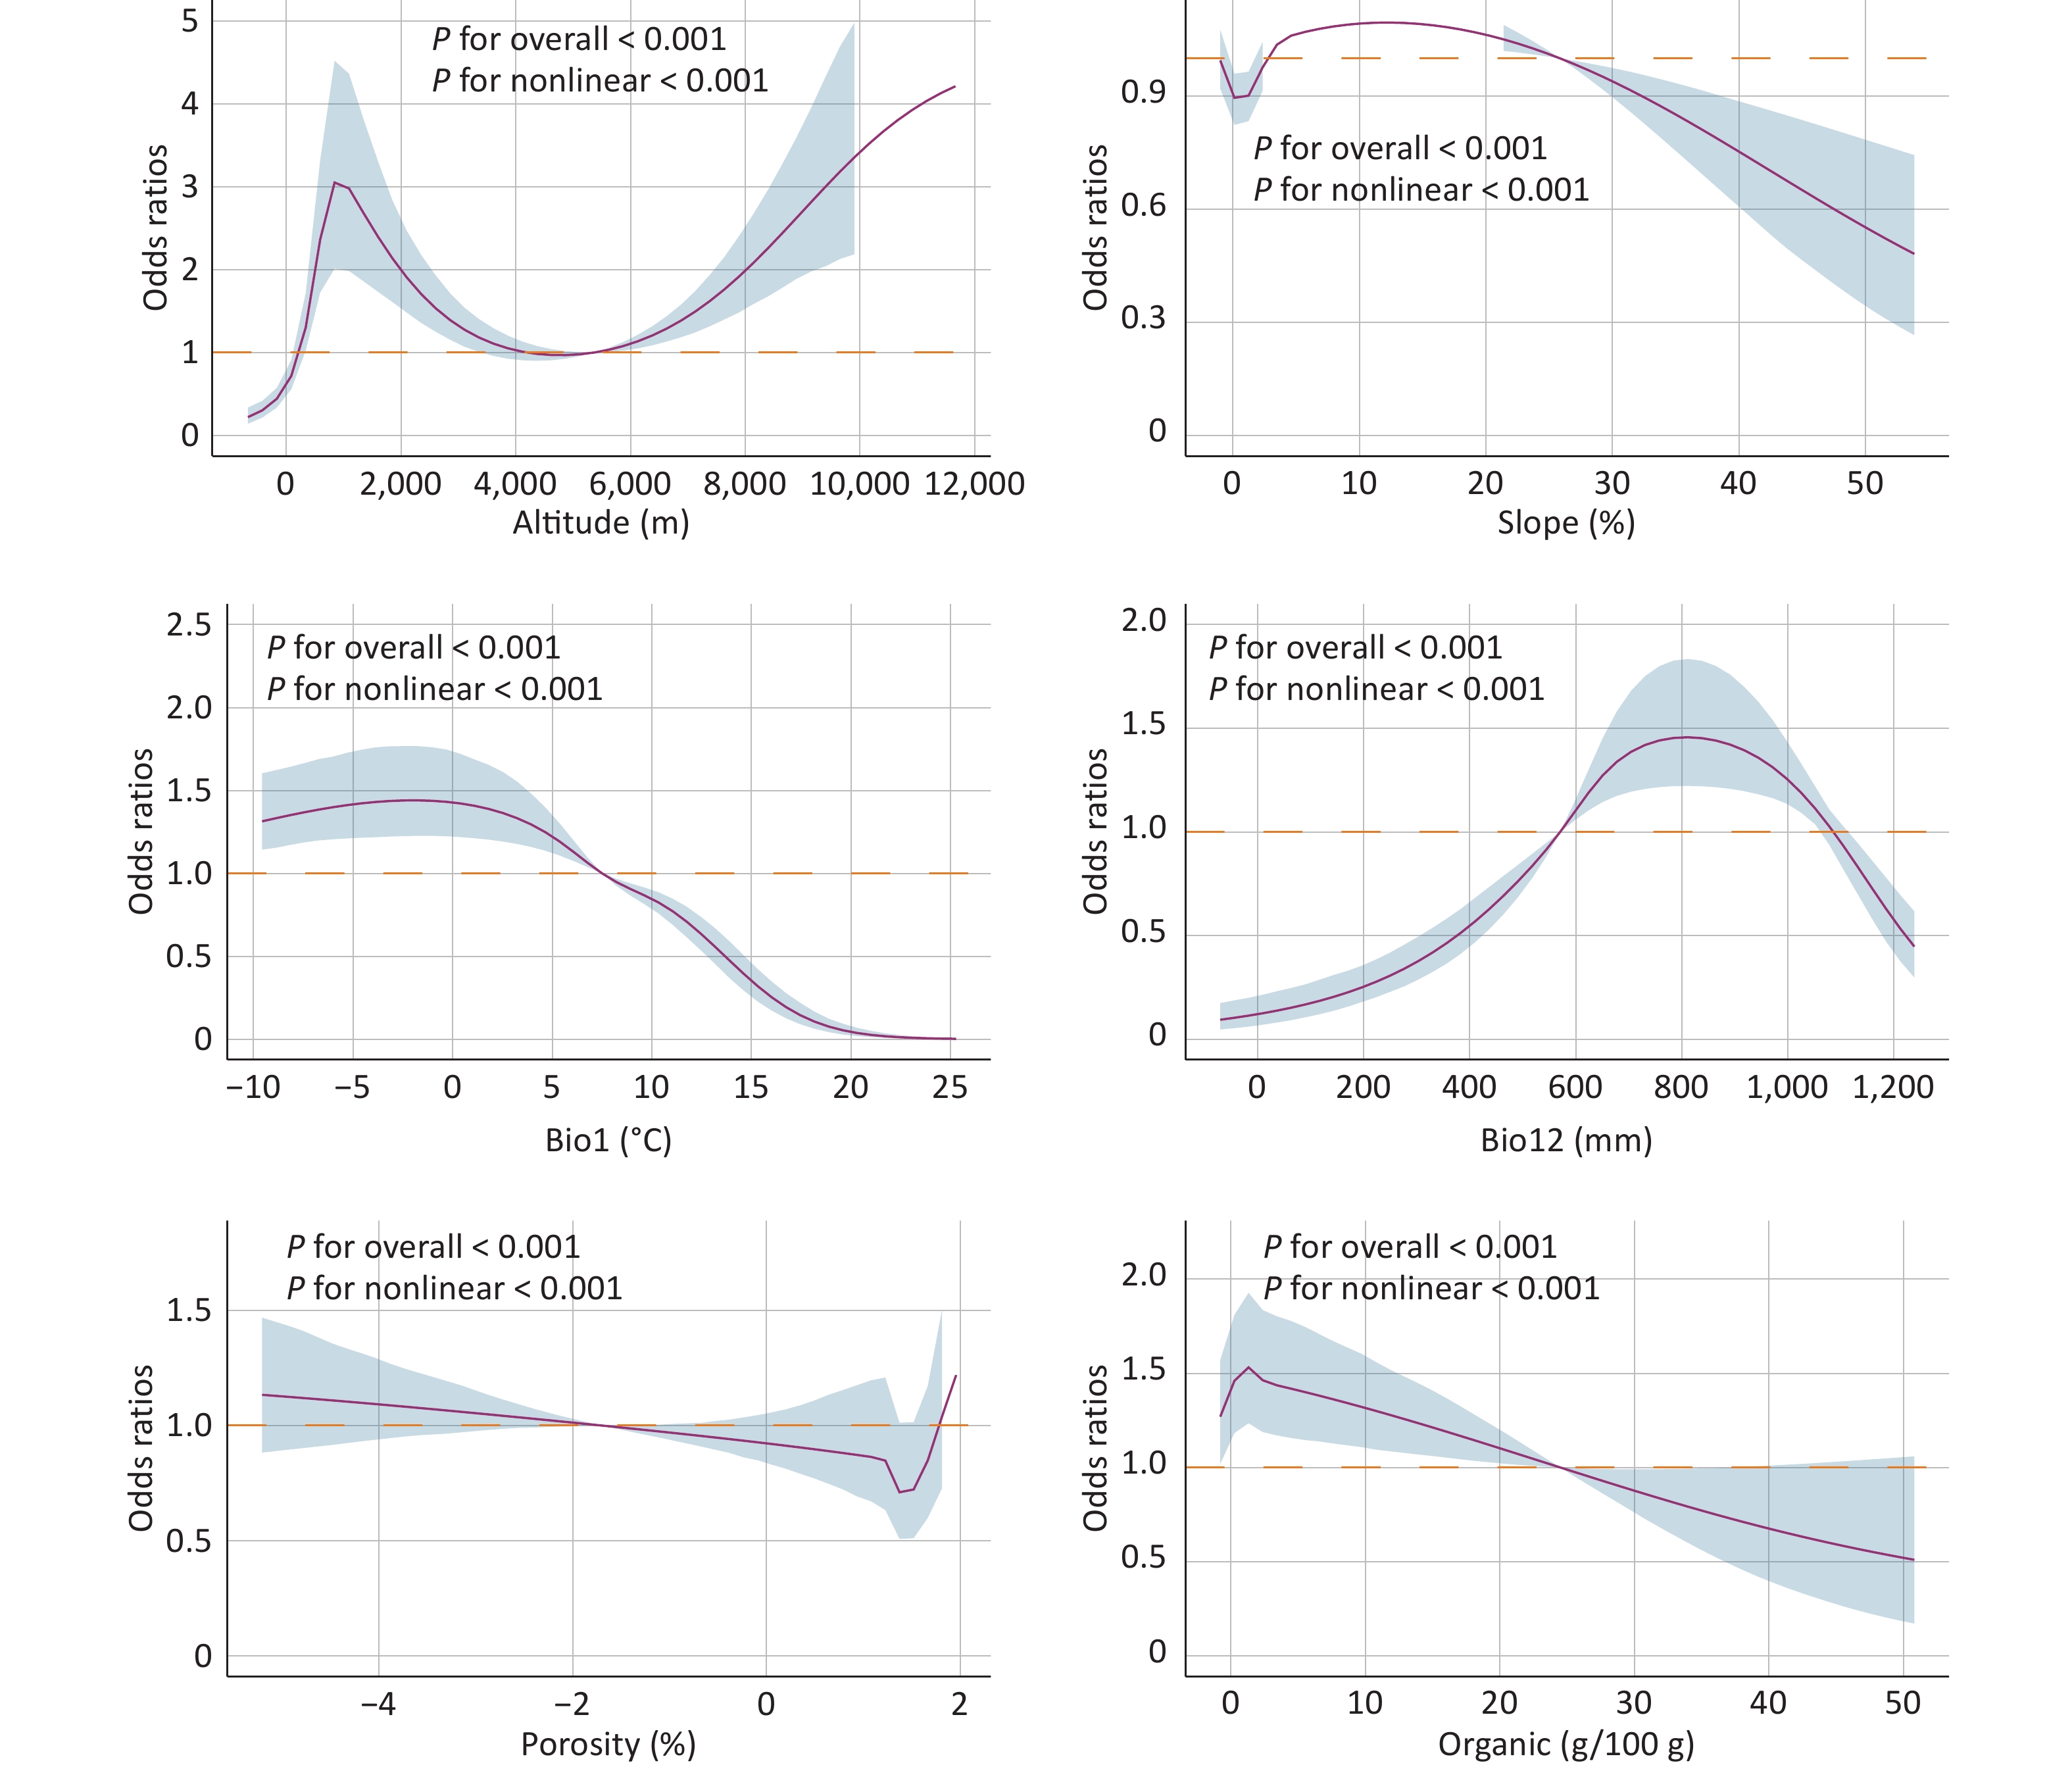
RCS analysis identified significant nonlinear relationships (P < 0.001) between KBD severity and altitude, slope, Bio1, Bio12, porosity, and organic matter. Specifically, at altitudes ranging from 237 to 4111 m, the risk of KBD first increased, reaching a peak at 953 m, followed by a decline, and then a sharp rise above 4111 m. Slope and Bio12 displayed N-shaped associations with disease risk. The risk initially increased and then decreased for slope values between 2.7% and 26.2%, peaking at 12.3%. For Bio12, the highest risk occurred at approximately 816 mm, within the range of 578–1079 mm. Consistent with the linear analysis, Bio1, porosity, and organic matter negatively correlated with the severity of KBD (Figure 2). The spatial distribution of KBD-endemic villages overlaid with key environmental determinants is shown in Supplementary Figure 5S.
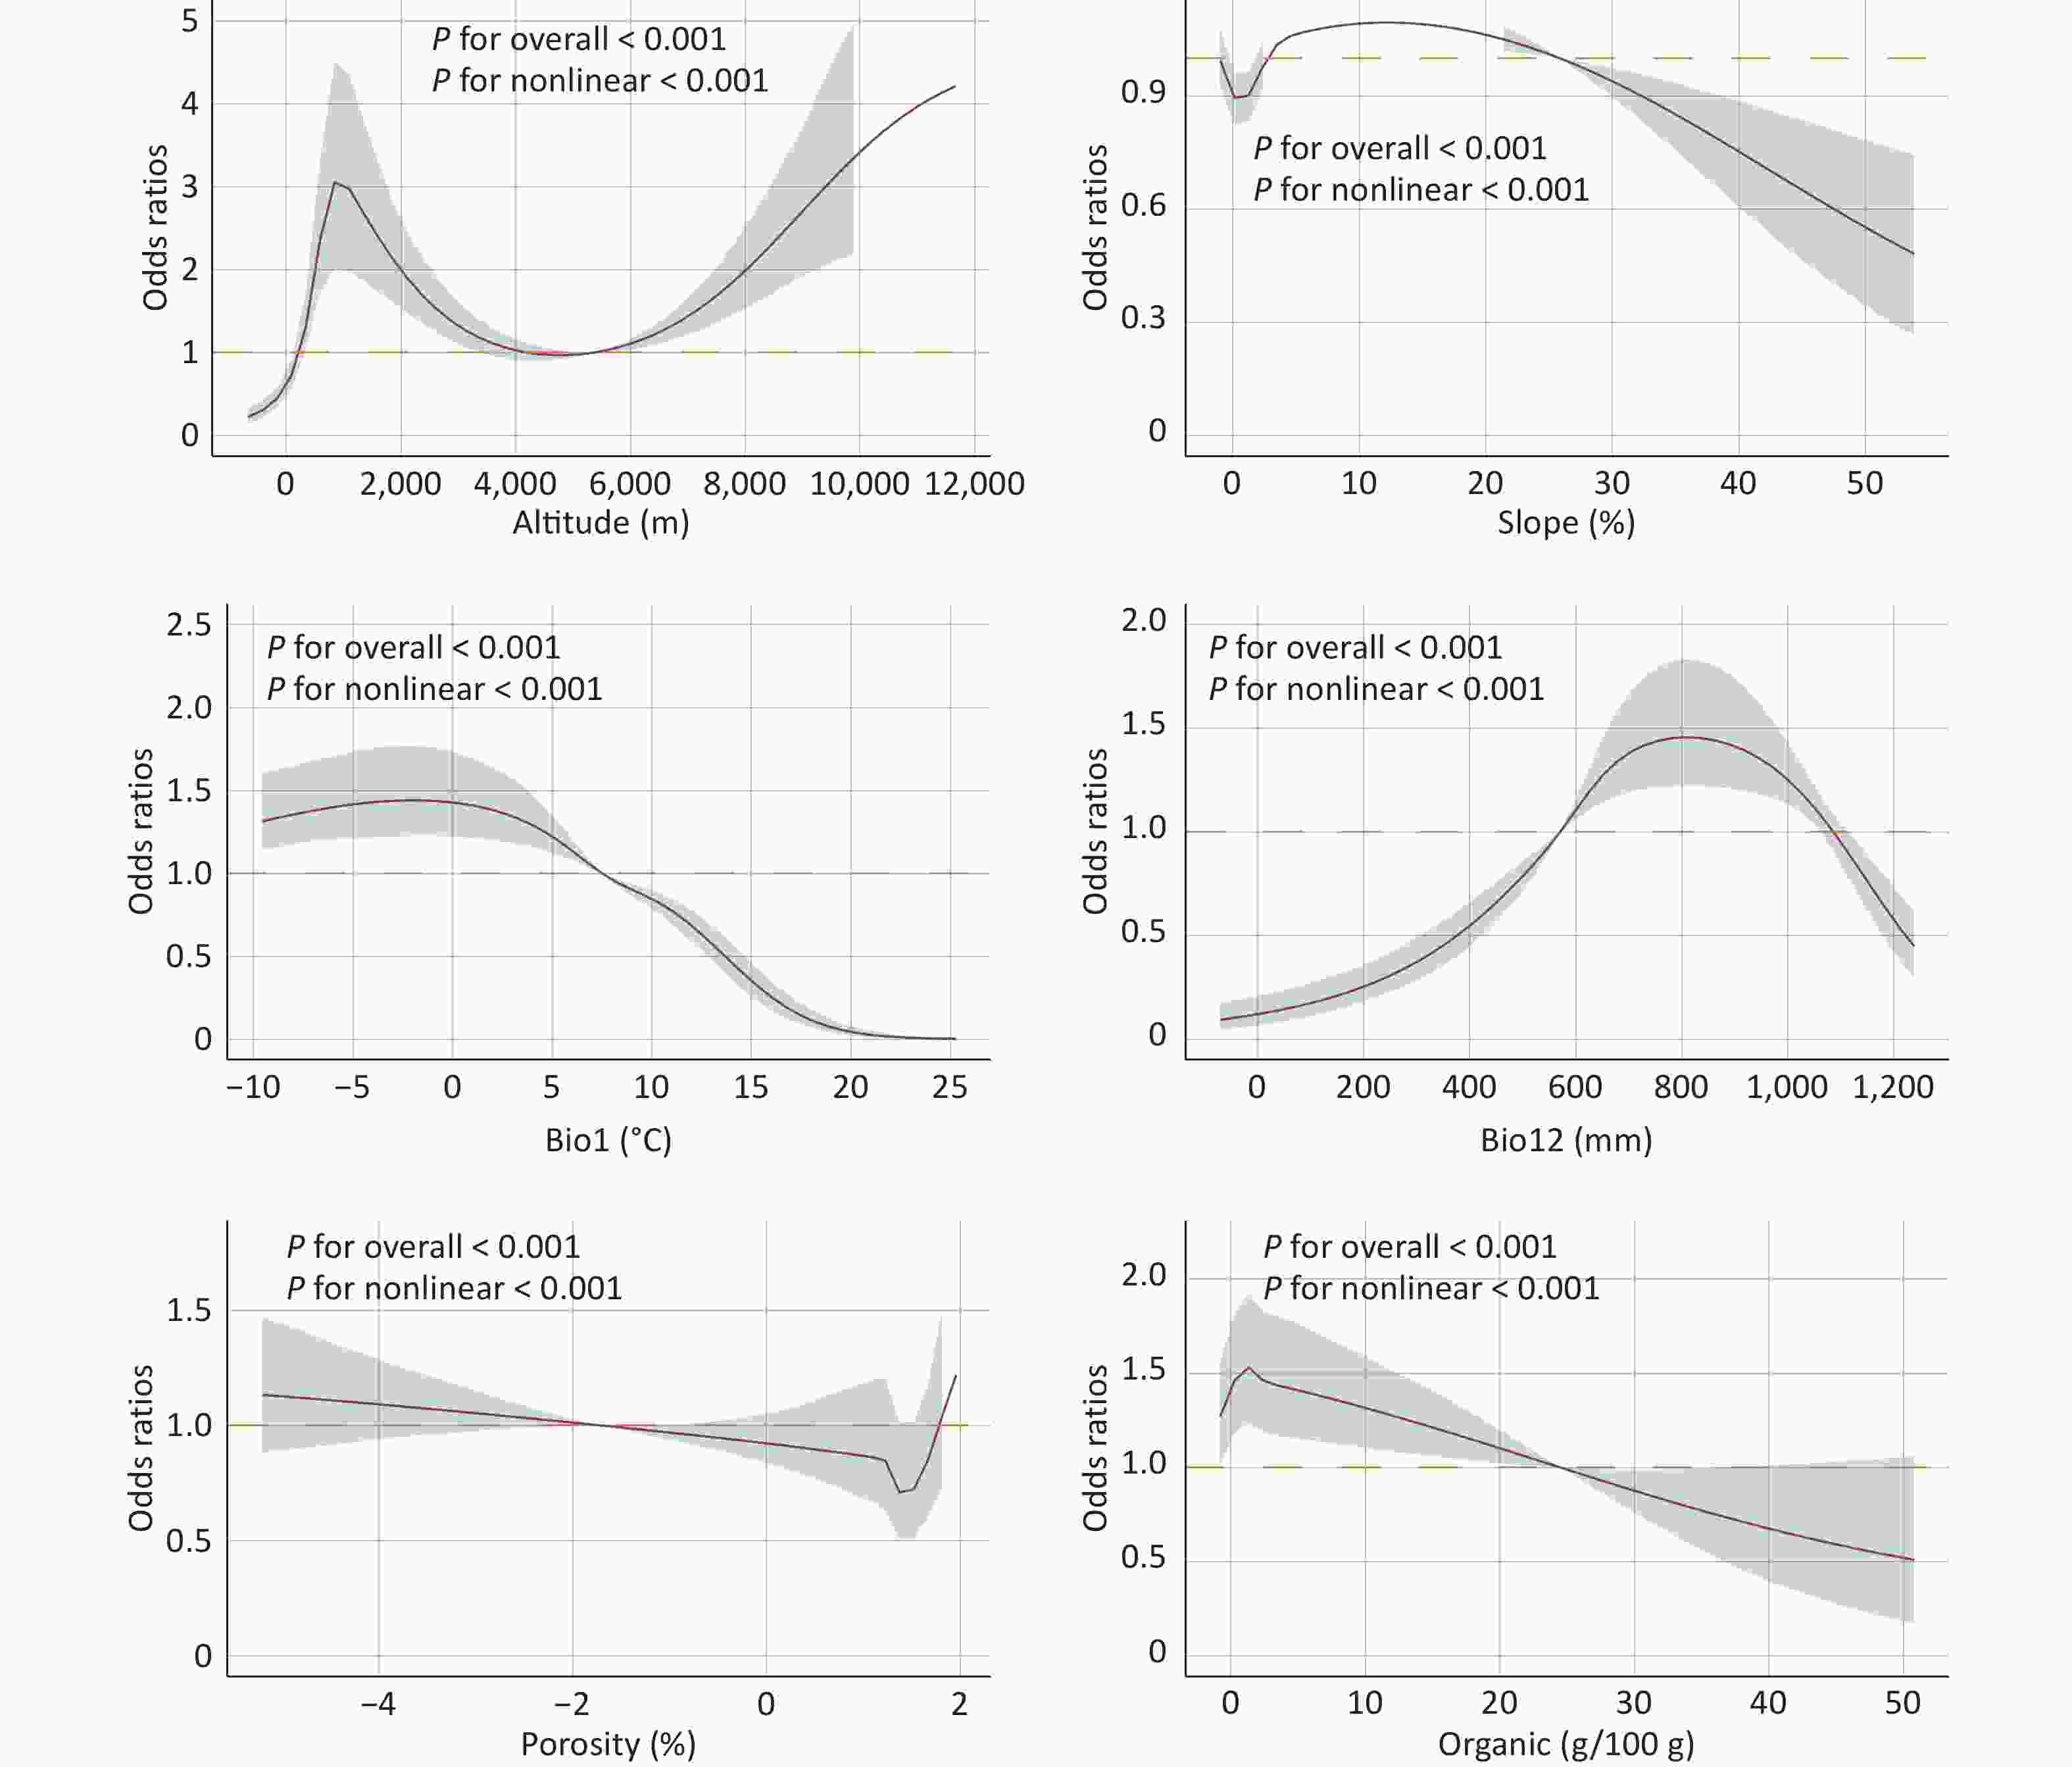
Figure 2. Nonlinear dose-response relationships of environmental factors with the risk of being classified as KBD-endemic areas (RCS analysis). Note: The red solid line represents the estimated ORs of KBD severity across the range of each environmental variable, and the blue shaded area indicates the 95% CrI. The P for overall assesses the overall significance of the variable, while the P for nonlinear evaluates the degree of deviation from linearity. Abbreviations: OR, odds ratio; CrI, credible interval; Bio1, annual mean temperature; Bio12, annual precipitation.
Overall, this study systematically evaluated the environmental determinants influencing the severity of KBD-endemic villages. Among the socioeconomic factors, regional GDP was not significantly associated with KBD risk, suggesting that natural environmental influences may outweigh regional economic status. In agreement with previous findings, villages farther from railways exhibited an increased risk, potentially because of poor grain storage conditions, limited access to external food sources, and inadequate coverage of nutritional intervention in remote areas[4].
The findings of this study revealed that cold and humid conditions increase the risk for villages being classified as KBD-endemic. This aligns with previous experimental evidence that cold and damp storage significantly increases T-2 toxin accumulation in grains[5], suggesting a critical pathogenic mechanism. Disease risk increased notably when annual precipitation ranged from 578 to 1079 mm and slope gradients varied between 2.7% and 26.2%. This might be because steep slopes form cold, humid, and poorly drained valley microenvironments, favoring mold growth and exacerbating soil erosion, thereby reducing trace elements such as selenium[6]. Contrary to conventional assumptions, isothermality exhibited a weak positive correlation with KBD risk, suggesting the need for further examination using more precise climate–temperature variability indicators[6]. Additionally, precipitation was significantly correlated with an increased KBD risk, whereas relative humidity showed no significant association. This discrepancy may arise because rainfall directly elevates grain moisture, promoting Fusarium infestation and toxin production, whereas macroscale relative humidity measures may inadequately reflect the humidity within grain storage microenvironments.
This study identified soil sand content as a risk factor for KBD, which is consistent with previous findings that sandy soils promote Fusarium survival, decrease selenium retention, and limit selenium uptake by plants[7]. Conversely, soil porosity (defined as the pore space relative to soil volume, influencing water retention and aeration) acted as a protective factor, likely by reducing waterlogging conditions that facilitate Fusarium toxin production[7].
Interaction analysis indicated that the selenium zone classification served as both an essential background context and a significant modifier, substantially influencing local environmental risk (Figure 1B, Supplementary Table 12S). Exchangeable sodium (reflecting soil alkalization) and electrical conductivity (indicating salinization) emerged as significant risk factors within moderately high selenium zones. This effect is likely mediated by enhancing Fusarium proliferation, pathogenicity, and toxin production, thereby overwhelming the antioxidant defense mechanisms in the host[8]. In contrast, alkali-hydrolysable nitrogen, soil pH, and organic matter exhibited protective roles, potentially because adequate selenium improves plant disease resistance, alkaline conditions increase selenium bioavailability, and organic matter facilitates selenium chelation and availability[9]. In marginal selenium zones, alkali-hydrolysable nitrogen was a risk factor, possibly because elevated nitrogen levels dilute the already limited selenium availability and provide additional nutrients that the pathogens can exploit[10].
Methodologically, this study utilized a Bayesian multilevel model to effectively manage hierarchical data structures and address the biases inherent in traditional methods. Theoretically, these findings further substantiate the “environmental selenium deficiency–mycotoxin poisoning” hypothesis. These results provide a foundation for targeted zoning of KBD risk. However, this study also has some limitations. First, the use of categorical selenium zones rather than quantitative selenium measurements may compromise the accurate characterization of exposure–response relationships. Second, this ecological study, conducted at the village level, did not include individual-level factors (e.g., age and dietary habits), restricting the assessment of personal risk determinants. Third, although the multilevel approach accounted for clustering within selenium zones, it did not adjust for spatial autocorrelations. Finally, although historical environmental data largely coincided with the main KBD epidemic period and the chosen factors were generally stable across time and space, precise temporal alignment with individual disease onset was not achieved. Future studies should incorporate quantitative selenium measurements and integrate critical individual-level covariates, account for spatial effects, and acquire temporally aligned exposure data. Such advancements would enable more precise predictive modeling and enhance early warning in high-risk regions.
The risk of villages for being KBD-endemic results from the synergistic influence of multiple environmental factors, notably cold and humid climates, steep terrain, and soil with low porosity and limited organic matter. Considerable heterogeneity was observed among the different selenium zones. Specifically, high soil nitrogen content emerged as a significant risk factor in marginal selenium zones, whereas soil salinization–alkalization presented as the primary threat in moderately-high selenium areas. These results offer a scientific basis for effective risk zoning and targeted interventions, including improved grain mold prevention strategies and enhanced selenium nutrition monitoring.
doi: 10.3967/bes2026.030
A Nationwide Analysis of Key Environmental Determinants Shaping the Spatial Distribution of Kashin-Beck Disease in China
-
This work was supported by the National Key Research and Development Program of China (grant number 2022YFC2503101) and the National Natural Science Foundation of China (grant number 82473744).
The authors declare no competing interests.
The study protocol was approved by the Ethics Committee of Harbin Medical University, with approval number (hrbmuecdc20221102). All the participants provided written informed consent before participating in the study. This study was conducted in accordance with the ethical guidelines and principles outlined in the Declaration of Helsinki.
Conceptualization, Data curation, Methodology, Visualization, Writing–original draft: Fang Qi. Data curation, Visualization: Ying Liu. Investigation, Formal analysis: Bing Zhang. Investigation, Resources: Qian Yu, Songyao Zhang, Haoyu Du, Jiaxin Li, Yue Zhao, Chenxi Wang and Jiayuan Li. Funding acquisition, Writing–review and editing: Silu Cui and Jun Yu.
Data is provided in the manuscript and supplementary information files. These datasets are available from the corresponding author upon request.
注释:1) Funding: 2) Competing Interests: 3) Ethics: 4) Authors’ Contributions: 5) Data Sharing: -
Figure 1. Association of environmental factors with KBD severity based on Bayesian multilevel ordinal logistic regression. (A) Forest plot of the fixed effects for primary environmental factors. (B) Forest plot of the interaction effects between selenium zones and soil properties. Green squares represent the posterior OR, with their size proportional to the estimation precision. The horizontal lines depict the 95% CrIs. The vertical dashed line indicates the null effect (OR = 1). Abbreviations: OR, odds ratio; CrI, credible interval; GDP, gross domestic product; rail, railway length; Bio1, mean annual temperature; Bio12, annual precipitation; RH, relative humidity; Bio3, isothermality; T_GRAVEL, gravel content; T_SAND, sand content; T_ESP, exchangeable sodium percentage; T_ECE, electrical conductivity; AN, alkali-hydrolysable nitrogen; Se, selenium.
Figure 2. Nonlinear dose-response relationships of environmental factors with the risk of being classified as KBD-endemic areas (RCS analysis). Note: The red solid line represents the estimated ORs of KBD severity across the range of each environmental variable, and the blue shaded area indicates the 95% CrI. The P for overall assesses the overall significance of the variable, while the P for nonlinear evaluates the degree of deviation from linearity. Abbreviations: OR, odds ratio; CrI, credible interval; Bio1, annual mean temperature; Bio12, annual precipitation.
Table 1. Results of Bayesian multilevel ordinal logistic regression
Type Variables Estimate Est. Error 95% CrI (β) Rhat Fixed effects Intercept Intercept 1 (control vs mild+) −0.24 0.55 (−1.46, 0.98) 1.004 Intercept 2 (mild vs moderate+) 1.48 0.55 (0.25, 2.68) 1.004 Intercept 3 (moderate vs severe) 2.06 0.55 (0.82, 3.25) 1.004 Level 1 (village) GDP 0.02 0.01 (−0.01, 0.04) 1.000 rail 0.25 0.01 (0.23, 0.27) 1.001 Altitude 0.18 0.02 (0.14, 0.21) 1.001 Slope 0.15 0.01 (0.12, 0.17) 1.001 Bio1 −0.79 0.02 (−0.83, −0.76) 1.000 Bio12 1.00 0.02 (0.96, 1.04) 1.003 RH −0.02 0.01 (−0.04, 0.01) 1.001 Bio3 0.08 0.02 (0.05, 0.11) 1.000 T_GRAVEL −0.02 0.01 (−0.05, 0.00) 1.001 T_SAND 0.09 0.02 (0.06, 0.12) 1.001 Porosity −0.18 0.02 (−0.22, −0.15) 1.001 T_ESP −0.14 0.03 (−0.20, −0.08) 1.001 T_ECE −0.09 0.07 (−0.23, 0.03) 1.000 PH 0.09 0.02 (0.06, 0.13) 1.001 AN 0.03 0.02 (−0.00, 0.06) 1.002 Organic −0.17 0.02 (−0.20, −0.13) 1.001 Level 2 (Se) (Reference: Low Se) Marginal Se −1.35 0.98 (−2.82, 1.02) 1.001 Moderately-high Se −1.81 0.98 (−3.21, 0.50) 1.001 Random effects Level 2 (between-Se zone) 0.82 − (0.02, 2.45) 1.004 Note. Estimate, posterior mean of the fixed-effect regression coefficient; β, regression coefficient; SE, standard error; CrI, credible interval; Rhat, Gelman–Rubin statistic; GDP, gross domestic product; rail, railway length; Bio1, mean annual temperature; Bio12, annual precipitation; RH, relative humidity; Bio3, isothermality; T_GRAVEL, gravel content; T_SAND, sand content; T_ESP, exchangeable sodium percentage; T_ECE, electrical conductivity; AN, alkali-hydrolysable nitrogen; Se, selenium. Note: The estimates are from a Bayesian two-level ordinal logistic regression model with villages (level-1) nested within selenium zones (level-2). Fixed effects included village-level environmental and socioeconomic factors and selenium zone categories (reference: low Se). Random effects captured the between-selenium zone variability.  下载: 导出CSV
-
[1] Cui SL, Que WJ, Jiao Z, et al. Disease and economic burden of Kashin-Beck disease—China, 2021. China CDC Wkly, 2024; 6, 40−4. [2] Xu G, Yun MY, Cong MY. Analysis on the relationship between climate characteristics and Kaschin-Beck disease in Aba state based on geographic information system. Chin J Ctrl Endem Dis, 2012; 27, 436−8. (In Chinese) [3] Silva MA, de Sousa GF, Van Opbergen GAZ, et al. Foliar application of Selenium associated with a multi-nutrient fertilizer in soybean: yield, grain quality, and critical se threshold. Plants (Basel), 2023; 12, 2028. doi: 10.3390/plants12102028 [4] Wang J, Li RN, Wei BG, et al. Spatiotemporal process and mechanism of Kashin-Beck disease regression in Xizang during 2000-2015. Acta Geogr Sin, 2024; 79, 2849−63. (In Chinese) [5] Kiš M, Vulić A, Kudumija N, et al. A two-year occurrence of Fusarium T-2 and HT-2 toxin in Croatian cereals relative of the regional weather. Toxins, 2021; 13, 39. doi: 10.3390/toxins13010039 [6] Wang KW, Yu J, Sun DJ. Cold weather and Kashin-Beck disease. Frigid Zone Med, 2023; 3, 30−6. doi: 10.2478/fzm-2023-0005 [7] Amir H, Alabouvette C. Involvement of soil abiotic factors in the mechanisms of soil suppressiveness to Fusarium wilts. Soil Biol Biochem, 1993; 25, 157−64. doi: 10.1016/0038-0717(93)90022-4 [8] Otlewska A, Migliore M, Dybka-Stępień K, et al. When salt meddles between plant, soil, and microorganisms. Front Plant Sci, 2020; 11, 553087. doi: 10.3389/fpls.2020.553087 [9] Dinh QT, Li Z, Tran TAT, et al. Role of organic acids on the bioavailability of selenium in soil: a review. Chemosphere, 2017; 184, 618−35. doi: 10.1016/j.chemosphere.2017.06.034 [10] Sun YM, Wang M, Mur LAJ, et al. Unravelling the roles of nitrogen nutrition in plant disease defences. Int J Mol Sci, 2020; 21, 572. doi: 10.3390/ijms21020572 -

 点击查看大图
计量
- 文章访问数: 0
- HTML全文浏览量: 0
- PDF下载量: 0
- 被引次数: 0

 Quick Links