


HTML
-
Non-Hodgkin's lymphoma (NHL) remains an important cause of morbidity and mortality in cancer patients worldwide. More than half of patients with NHL were diagnosed with aggressive B cell lymphomas[1-2], which include diffuse large B cell lymphoma (DLBCL), lymphoblastic B cell lymphoma, Burkitt lymphoma, mantle cell lymphoma, and other lymphoma entities. DLBCL, the largest subgroup of aggressive B cell lymphomas, can be further classified into two subtypes, such as germinal center B cell like subtype and non-germinal center B cell subtype, based on gene expression profiles or immune phenotypes[3-4]. The clinical causes and prognosis of different subtypes of DLBCL and other aggressive B cell lymphomas are quite different due to complex intrinsic mechanisms[5-7]. In recent years, the combination of chemotherapy, antibody-based target therapy, and radiation therapy has significantly improved the survival of patients with aggressive B cell lymphomas, but relapse, refractory diseases, and poor clinical outcomes remain major treatment challenges[8-10].
Multiple risk stratification systems have been developed to identify the cancer patients' prognosis[11-15]. The International Prognostic Index (IPI), based on clinical parameters, such as age, lactate dehydrogenase (LDH), number of extranodal sites, Ann Arbor stage, and ECOG performance status, was one of the most commonly used tools for predicting therapeutic response and prognosis of patients with aggressive NHL in the pre-rituximab era. New versions of the IPI, including the revised IPI (R-IPI) and the NCCN-IPI, are reportedly superior to the previous standard IPI scoring system after the combination of rituximab and chemotherapy was introduced. The lymphoma tumor microenvironment plays an important role in tumor development and progression through interactions between tumor cells and the immune system and influences tumor prognosis and the treatment response[16-24]. Immune checkpoint pathways, particularly the PD-1/PD-L1 pathway, have been reported to mediate exhaustion of tumor-infiltrating cytotoxic T lymphocytes. Therefore, inhibiting the PD-1/PD-L1 pathway is believed to be a highly promising method for treating various advanced tumors, including lymphomas[25-28]. In addition, the components of the differential white blood cell count (WBC-DC), systematic inflammatory and metabolic markers, such as LDH, β2-microglobulin (β2MG), and iron, in peripheral blood are useful inexpensive parameters to categorize the prognoses of malignant diseases including solid and hematological malignancies[29-36]. However, the relationship between the tumor cell microenvironment and risk based on the commonly used score models (IPI, R-IPI, and NCCN-IPI) remains unknown. In this study, we evaluated the densities of CD4, Foxp3, CD8, CD68, and CD163 positive immune cells, the expression of PD-1/PD-L1, counted the systemic immune-inflammatory cells, and measured serum levels of LDH and β2MG in 127 patients with aggressive B cell lymphomas, to analyze the correlation between these immune related factors and the risk stratification in patients with aggressive B cell lymphomas. Our aim was to investigate the relationship between the tumor immune microenvironment as well as systematic inflammatory and metabolic factors and the prognosis of patients with aggressive B cell lymphomas.
-
A total of 127 patients diagnosed with aggressive B cell lymphomas at Chongqing Cancer Institute/Hospital between January 2014 and December 2015 were enrolled in this retrospective study. Informed consent was obtained from all patients, and the study was approved by the Ethics Committee of Chongqing Cancer Institute/Hospital. All cases were reviewed by two experienced pathologists according to the criteria of the World Health Organization classification. Patients' medical history review, physical examination, WBC-DC, renal and liver function tests, such as serum albumin, globulin, β2MG, and bone marrow biopsy, and imaging examinations (ultrasound and radiological examinations of the brain, chest, abdomen, and pelvis) were carried out, and the results were reviewed. Patients were staged according to the Ann Arbor classification, and a risk stratification was performed according to the IPI, R-IPI, and NCCN-IPI scoring systems[16-18].
-
Slides of formalin-fixed, paraffin-embedded tissues were stained with primary monoclonal antibodies to anti-CD4 (clone SP35, rabbit monoclonal; Abcam, Cambridge, MA, USA), anti-Foxp3 (clone 236A/E7, mouse monoclonal; Abcam), anti-CD8 (clone SP16, rabbit monoclonal; Abcam), anti-CD68 (clone KP-1, mouse monoclonal; Abcam), anti-CD163 (clone 10D6, mouse monoclonal; Abcam), anti-PD-1 (clone MRQ22, mouse monoclonal; ORIGENE, Rockville, MD, USA), and anti-PD-L1 (clone SP142, rabbit monoclonal; ORIGENE) using the GTVision Ⅲ detection system (DAKO, Carpinteria, CA USA) according to the manufacturer's instructions. Tumor-infiltrating immune cell subsets were quantified as total counts of CD3, CD4, CD8, Foxp3, CD68, and CD163 positive cells per high power field (0.2 mm2) by manual inspection of stained sections with at least 10 fields of high staining density. Membranous immunostaining for PD-1 and PD-L1 was considered as positive and scored by a staining density ranging from 0 to 3 (0 = no staining, 1 = weak, 2 = moderate, 3 = strong).
-
All data were analyzed with SPSS 18.0 software (IBM Corp., Armonk, NY, USA). Categorical variables were compared using the chi-square test. The difference between continuous variables was assessed using analysis of variance (ANOVA). All P-values < 0.05 were considered significant. A multinomial logistic regression model was developed and probability was estimated in a single model using a maximum likelihood technique. The three scoring models (IPI, R-IPI, and NCCN-IPI) were used as the dependent variable in the multinominal logistic regression. Significant factors selected from the ANOVA and chi-square test were used as control variables. Concordance rates for methods using these factors with or without the Ann Arbor stage data were analyzed with paired t-tests.
The predicted probabilities from the model were calculated with the following Equations:
$$ \begin{array}{l} p1 = p\left( {y \le 1\left| {{x_1}, {x_2}, \cdots {x_{\rm{K}}}} \right.} \right) = \frac{{\exp \left( {{\rm{a + }}{{\rm{b}}_1}{{\rm{x}}_1} + {{\rm{b}}_2}{{\rm{x}}_2} + \cdots {{\rm{b}}_{\rm{k}}}{{\rm{x}}_{\rm{k}}}} \right)}}{{1 + \exp \left( {{{\rm{a}}_1} + {{\rm{b}}_1}{{\rm{x}}_1} + {{\rm{b}}_2}{{\rm{x}}_2} + \cdots + {{\rm{b}}_{\rm{k}}}{{\rm{x}}_{\rm{k}}}} \right)}}\\ p2 = p\left( {y \le 2\left| {{x_1}, {x_2}, \cdots {x_{\rm{K}}}} \right.} \right) = \frac{{\exp \left( {{{\rm{a}}_2}{\rm{ + }}{{\rm{b}}_1}{{\rm{x}}_1} + {{\rm{b}}_2}{{\rm{x}}_2} + \cdots {{\rm{b}}_{\rm{k}}}{{\rm{x}}_{\rm{k}}}} \right)}}{{1 + \exp \left( {{{\rm{a}}_2} + {{\rm{b}}_1}{{\rm{x}}_1} + {{\rm{b}}_2}{{\rm{x}}_2} + \cdots + {{\rm{b}}_{\rm{k}}}{{\rm{x}}_{\rm{k}}}} \right)}}\\ p3 = p\left( {y \le 3\left| {{x_1}, {x_2}, \cdots {x_{\rm{K}}}} \right.} \right) = \frac{{\exp \left( {{{\rm{a}}_3}{\rm{ + }}{{\rm{b}}_1}{{\rm{x}}_1} + {{\rm{b}}_2}{{\rm{x}}_2} + \cdots {{\rm{b}}_{\rm{k}}}{{\rm{x}}_{\rm{k}}}} \right)}}{{1 + \exp \left( {{{\rm{a}}_3} + {{\rm{b}}_1}{{\rm{x}}_1} + {{\rm{b}}_2}{{\rm{x}}_2} + \cdots + {{\rm{b}}_{\rm{k}}}{{\rm{x}}_{\rm{k}}}} \right)}}\\ p4 = p\left( {y \le 4\left| {{x_1}, {x_2}, \cdots {x_{\rm{K}}}} \right.} \right) = 1-p1-p2-p3 \end{array} $$ Where, p is the predicted probability for different scores, and xnis the control variable selected from the ANOVA or chi-square test.
Patients and Samples
Immunohistochemistry for Tumor-infiltrating Immune Cell Subsets and PD-1/PD-L1 Expression
Statistical Analysis
-
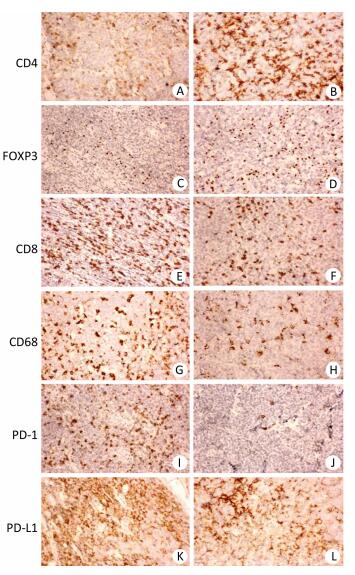
The clinicopathological characteristics of all 127 patients with aggressive B cell lymphomas are summarized in Supplementary Tables 1-3 (available in www.besjournal.com). Figure 1 demonstrated immunohistochemical staining of tumor-infiltrating immune cell subsets, PD1 and PD-L1 in DLBCL and mantle cell lymphoma, in which CD4, CD8 presented membrane positivity, and Foxp3 showed nuclear positivity in T lymphocytes, while CD68 showed membrane positivity in macrophage cells, PD-1 and PDL1 also showed membrane positivity both in tumor cells and microenvironment immune cells. As shown in Supplementary Table 1 (available in www.besjournal.com), no significant difference was found in 18 factors, including sex, histological classification, sites of involvement, absolute blood lymphocyte count, absolute blood lymphocyte count score, absolute blood neutrophil count score, absolute blood neutrophil count, platelet count, platelet count score, neutrophil-to-lymphocyte ratio (NLR), NLR score, monocyte-to-lymphocyte ratio (MLR), platelet-to-lymphocyte ratio (PLR), PLR score, lymphoma infiltrating CD4-positive T cells, lymphoma infiltrating Foxp3-positive T cells, lymphoma infiltrating CD68-positive macrophages, lymphoma infiltrating CD163-positive macrophages, or PD-1 score. The other 13 factors, including age, Ann Arbor stage, B symptoms, ECOG performance status, absolute blood monocyte count, CD8+ T cells, LDH, iron, albumin, and β2MG were significantly different among the four groups. The baseline characteristics with stratification using the revised IPI (Supplementary Table 2, available in www.besjournal.com) and NCCN-IPI (Supplementary Table 3, available in www.besjournal.com) showed similar results as those stratified using the IPI (Supplementary Table 1, available in www.besjournal.com). Table 1 summarizes the important factors from the three scoring systems and shows that there were differences in some of the factors, including blood lymphocyte score, blood monocytes, platelet count, NLR, MLR, and PLR among all three scoring systems. Only factors that were significantly different in the two scoring systems were chosen for further analysis to ensure the accuracy of further statistical analysis (Table 2).
Factors Low IPI Low to intermediate IPI High to intermediate IPI High IPI P value Sex 0.645 Male 19 (15.0%) 26 (20.47%) 19 (14.96%) 14 (11.02%) Female 15 (11.8%) 17 (13.39%) 12 (9.45%) 5 (3.94%) Age 49.18 ± 15.06 57.58 ± 12.97 56.61 ± 12.36 62.37 ± 14.28 0.005 Histological classification 0.571 DLBCL 13 (10.24%) 16 (12.60 %) 9 (7.09%) 4 (3.15%) GCB DLBCL 20 (15.75%) 24 (18.90%) 18 (14.17%) 12 (9.45%) Non-GCB MCL 1 (0.79%) 3 (2.36%) 4 (3.15%) 3 (2.36%) Sites of involvement 0.94 nodal 21 (16.54%) 29 (22.83%) 21 (16.54%) 13 (10.24%) extranodal 13 (10.24%) 14 (11.02%) 10 (7.87%) 6 (4.72%) Ann Arbor stage 0.000 Ⅰ 9 (7.09%) 1 (0.79%) 0 (0.00%) 0 (0.00%) Ⅱ 12 (9.45%) 16 (12.60%) 2 (1.57%) 1 (0.79%) Ⅲ 10 (7.87%) 19 (14.96%) 17 (13.39%) 3 (2.36%) Ⅳ 3 (2.36%) 7 (5.51%) 12 (9.45%) 15 (11.81%) B symptom 0.000 Yes 3 (2.36%) 8 (6.30%) 21 (16.54%) 10 (7.87%) No 31 (24.41%) 35 (27.56%) 10 (7.87%) 9 (7.09%) ECOG performance status 0.000 0 21 (16.54%) 25 (19.69%) 7 (5.51%) 4 (3.15%) 1 8 (6.30%) 4 (3.15%) 1 (0.79%) 2 (1.57%) 2 5 (3.94%) 13 (10.24%) 21 (16.54%) 13 (10.24%) 3 0 (0.00%) 1 (0.79%) 2 (1.57%) 0 (0.00%) Absolute count of lymphocytes in blood 1.47 ± 0.63 1.57 ± 0.70 1.49 ± 0.79 1.33 ± 0.82 0.717 Score of absolute count of lymphocytes in blood 0.27 0 ( < 1.1 × 10⁹/L) 10 (7.87%) 10 (7.87%) 14 (11.02%) 9 (7.09%) 1 (1.1-3.2 × 10⁹/L) 23 (18.11%) 32 (25.20%) 15 (11.81%) 9 (7.09%) 2 (≥ 3.2 × 10⁹/L) 1 (0.79%) 1 (0.79%) 2 (1.57%) 1 (0.79%) Absolute count of monocytes in blood 0.30 ± 0.21 0.43 ± 0.24 0.52 ± 0.28 0.32 ± 0.28 0.003 Score of absolute count of monocytes in blood 0.018 0 ( < 0.1 × 10⁹/L) 8 (6.30%) 6 (4.72%) 3 (2.36%) 5 (3.94%) 1 (0.1-0.6 × 10⁹/L) 24 (18.90%) 27 (21.26%) 16 (12.60%) 13 (10.24%) 2 (≥ 0.6 × 10⁹/L) 2 (1.57%) 10 (7.87%) 12 (9.45%) 1 (0.79%) Absolute count of neutrophils in blood 4.47 ± 1.78 4.28 ± 1.98 4.06 ± 1.95 4.33 ± 3.27 0.899 Score of absolute count of lymphocytes in blood 0.294 0 ( < 1.8 × 10⁹/L) 0 (0.00%) 1 (0.79%) 3 (2.36%) 1 (0.79%) 1 (1.8-6.3 × 10⁹/L) 28 (22.05%) 35 (27.56%) 26 (20.47%) 17 (13.39%) 2 (≥ 6.3 × 10⁹/L) 6 (4.72%) 7 (5.51%) 2 (1.57%) 1 (0.79%) Platelet count 202.41 ± 68.82 209.84 ± 115.95 179.13 ± 76.69 177.42 ± 101.30 0.42 Score of platelet count 0.102 0 ( < 125 × 109/L) 1 (0.79%) 8 (6.30%) 7 (5.51%) 6 (4.72%) 1 (125-350 × 109/L) 32 (25.20%) 31 (24.41%) 23 (18.11%) 12 (9.45%) 2 (≥ 350 × 109/L) 1 (0.79%) 4 (3.15%) 1 (0.79%) 1 (0.79%) NLR 3.50 ± 2.22 3.12 ± 1.68 3.38 ± 2.40 4.98 ± 5.01 0.098 Score of NLR 0.197 0 ( < 0.56) 0 (0.00%) 1 (0.79%) 2 (1.57%) 1 (0.79%) 1 (0.56-5.73) 30 (23.62%) 39 (30.71%) 27 (21.26%) 13 (10.24%) 2 (≥ 5.73) 4 (3.15%) 3 (2.36%) 2 (1.57%) 5 (3.94%) MLR 0.23 ± 0.17 0.33 ± 0.26 0.39 ± 0.28 0.35 ± 0.35 0.091 Score of MLR 0.048 0 ( < 0.03) 4 (3.15%) 0 (0.00%) 1 (0.79%) 1 (0.79%) 1 (0.03-0.19) 11 (8.66%) 15 (11.81%) 4 (3.15%) 8 (6.30%) 2 (≥ 0.19) 19 (14.96%) 28 (22.05%) 26 (20.47%) 10 (7.87%) PLR 155.56 ± 79.62 154.89 ± 105.42 149.83 ± 92.57 185.95 ± 140.75 0.645 Score of PLR 0.205 0 ( < 39.06) 0 (0.00%) 0 (0.00%) 2 (1.57%) 2 (1.57%) 1 (39.06-318.18) 33 (25.98%) 40 (31.50%) 27 (21.26%) 15 (11.81%) 2 (≥ 318.18/L) 1 (0.79%) 3 (2.36%) 2 (1.57%) 2 (1.57%) Infiltrating CD4+ T cells 305.74 ± 273.14 245.74 ± 186.81 286.94 ± 215.00 229.26 ± 230.87 0.546 Infiltrating Foxp3+ T cells 150.59 ± 122.05 126.74 ± 110.15 135.87 ± 144.27 147.00 ± 150.44 0.86 Infiltrating CD8+ T cells 304.41 ± 225.75 207.21 ± 144.33 194.52 ± 108.19 273.68 ± 123.21 0.017 Infiltrating CD68+ macrophages 153.24 ± 78.42 122.21 ± 64.64 116.77 ± 52.94 123.32 ± 58.99 0.106 Infiltrating CD163+ macrophages 122.06 ± 72.19 99.19 ± 63.68 113.65 ± 76.73 122.47 ± 77.20 0.481 Score of PD-1 0.359 0 (-) 16 (12.60%) 16 (12.60%) 16 (12.60%) 9 (7.09%) 1 (+) 10 (7.87%) 13 (10.24%) 3 (2.36%) 7 (5.51%) 2 (++) 4 (3.15%) 9 (7.09%) 5 (3.94%) 2 (1.57%) 3 (+++) 4 (3.15%) 5 (3.94%) 7 (5.51%) 1 (0.79%) Score of PD-L1 0.041 0 (-) 2 (1.57%) 11 (8.66%) 3 (2.36%) 2 (1.57%) 1 (+) 12 (9.45%) 10 (7.87%) 15 (11.81%) 5 (3.94%) 2 (++) 13 (10.24%) 19 (14.96%) 6 (4.72%) 7 (5.51%) 3 (+++) 7 (5.51%) 3 (2.36%) 7 (5.51%) 5 (3.94%) Serum LDH 199.76 ± 58.53 290.48 ± 214.14 372.89 ± 251.58 531.86 ± 540.27 0.000 Score of serum LDH 0.001 0 ( < 250 U/L) 30 (23.62%) 29 (22.83%) 13 (10.24%) 8 (6.30%) 1 (250-500 U/L) 4 (3.15%) 6 (4.72%) 11 (8.66%) 5 (3.94%) 2 (≥ 500 U/L) 0 (0.00%) 8 (6.30%) 7 (5.51%) 6 (4.72%) Serum iron 16.56 ± 9.00 12.28 ± 6.47 11.96 ± 6.50 8.91 ± 4.05 0.001 Score of serum iron 0.02 0 ( < 7.8 μmol) 2 (1.57%) 9 (7.09%) 7 (5.51%) 9 (7.09%) 1 (7.8-32.2 μmol) 32 (25.20%) 34 (26.77%) 24 (18.90%) 10 (7.87%) 2 (≥ 32.2 μmol) 1 (0.79%) 0 (0.00%) 0 (0.00%) 0 (0.00%) Serum albumin 43.33 ± 4.80 41.46 ± 5.32 39.99 ± 6.06 36.85 ± 6.80 0.001 Score of serum iron 0.003 0 ( < 40 g/L) 7 (5.51%) 14 (11.02%) 15 (11.81%) 13 (10.24%) 1 (40-55 g/L) 27 (21.26%) 29 (22.83%) 16 (12.60%) 6 (4.72%) 2 (≥ 55 g/L) 0 (0.00%) 0 (0.00%) 0 (0.00%) 0 (0.00%) Serum β2MG 1.98 ± 1.70 2.74 ± 1.58 3.30 ± 2.22 5.08 ± 4.63 0.000 Score of serum β2MG 0.000 0 ( < 3 mg/L) 31 (24.41%) 26 (20.47%) 15 (11.81%) 6 (4.72%) 1 (≥ 3 mg/L) 3 (2.36%) 17 (13.39%) 16 (12.60%) 13 (10.24%) Table Supplementary Table 1. Baseline Characteristics of Patients by IPI Stratification
Factors Very Good Good Poor P Value Sex 0.529 Male 16 (12.60%) 29 (22.83%) 33 (25.98%) Female 14 (11.02%) 18 (14.17%) 17 (13.39%) Age 48.73 ± 14.76 57.15 ± 13.412 58.80 ± 13.28 0.006 Histological classification 11 (8.66%) 18 (14.17%) 13 (10.24%) 0.369 DLBCL GCB 18 (14.17%) 26 (20.47%) 30 (23.62%) DLBCL Non-GCB 1 (0.79%) 3 (2.36%) 7 (5.51%) MCL Sites of involvement 0.908 Nodal 20 (15.75%) 30 (23.62%) 34 (26.77%) Extranodal 10 (7.87%) 17 (13.39%) 16 (12.60%) Ann Arbor stage 0.000 Ⅰ 7 (5.51%) 3 (2.36%) 0 (0.00%) Ⅱ 11 (8.66%) 17 (13.39%) 3 (2.36%) Ⅲ 9 (7.09%) 20 (15.75%) 20 (15.75%) Ⅳ 3 (2.36%) 7 (5.51%) 27 (21.26%) B symptom 0.000 Yes 0 (0.00%) 11 (8.66%) 31 (24.41%) No 30 (23.62%) 36 (28.35%) 19 (14.96%) ECOG performance status 0.000 0 21 (16.54%) 25 19.69 (%) 11 (8.66%) 1 8 (6.30%) 4 (3.15%) 3 (2.36%) 2 1 (0.79%) 17 (13.39%) 34 (26.77%) 3 0 (0.00%) 1 (0.79%) 2 (1.57%) Absolute count of lymphocytes in blood 1.44 ± 0.64 1.58 ± 0.69 1.43 ± 0.80 0.565 Score of absolute count of neutrophils in blood 0.074 0 ( < 1.1 × 10⁹/L) 10 (7.87%) 10 (7.87%) 23 (18.11%) 1 (1.1-3.2 × 10⁹/L) 19 (14.96%) 36 (28.35%) 24 (18.90%) 2 (≥ 3.2 × 10⁹/L) 1 (0.79%) 1 (0.79%) 3 (2.36%) Absolute count of monocytes in blood 0.29 ± 0.21 0.42 ± 0.24 0.44 ± 0.29 0.033 Sore of absolute count of monocytes in blood 0.191 0 ( < 0.1 × 10⁹/L) 8 (6.30%) 6 (4.72%) 8 (6.30%) 1 (0.1-0.6 × 10⁹/L) 20 (15.75%) 31 (24.41%) 29 (22.83%) 2 (≥ 0.6 × 10⁹/L) 2 (1.57%) 10 (7.87%) 13 (10.24%) Absolute count of neutrophils in blood 4.47 ± 1.76 4.30 ± 1.98 4.17 ± 2.51 0.832 Score of absolute count of neutrophils in blood 0.137 0 ( < 1.8 × 10⁹/L) 0 (0.00%) 1 (0.79%) 4 (3.15%) 1 (1.8-6.3 × 10⁹/L) 24 (18.90%) 39 (30.71%) 43 (33.86%) 2 (≥ 6.3 × 10⁹/L) 6 (4.72%) 7 (5.51%) 3 (2.36%) Platelet count 204.43 ± 69.12 207.92 ± 112.60 178.48 ± 85.86 0.255 Score of platelet count 0.085 0 ( < 125 × 109/L) 1 (0.79%) 8 (6.30%) 13 (10.24%) 1 (125-350 × 109/L) 28 (22.05%) 35 (27.56%) 35 (27.56%) 2 (≥ 350 × 109/L) 1 (0.79%) 4 (3.15%) 2 (1.57%) NLR 3.63 ± 2.34 3.08 ± 1.62 3.99 ± 3.66 0.265 Score of NLR 0.376 0 ( < 0.56) 0 (0.00%) 1 (0.79%) 3 (2.36%) 1 (0.56-5.73) 26 (20.47%) 43 (33.86%) 40 (31.50%) 2 (≥ 5.73) 4 (3.15%) 3 (2.36%) 7 (5.51%) MLR 0.23 ± 0.18 0.32 ± 0.26 0.38 ± 0.31 0.068 Score of MLR 0.062 0 ( < 0.03) 4 (3.15%) 0 (0.00%) 2 (1.57%) 1 (0.03-0.19) 10 (7.87%) 16 (12.60%) 12 (9.45%) 2 (≥ 0.19) 16 (12.60%) 31 (24.41%) 36 (28.35%) PLR 161.63 ± 82.79 151.08 ± 101.63 163.56 ± 113.30 0.82 Score of PLR 0.125 0 ( < 39.06) 0 (0.00%) 0 (0.00%) 4 (3.15%) 1 (39.06-318.18) 29 (22.83%) 44 (34.65%) 42 (33.07%) 2 (≥ 318.18/L) 1 (0.79%) 3 (2.36%) 4 (3.15%) Infiltrating CD4+ T cells 330.83 ± 281.13 234.83 ± 182.68 265.02 ± 220.63 0.187 Infiltrating Foxp3+ T cells 170.27 ± 116.37 116.21 ± 110.89 140.10 ± 145.21 0.192 Infiltrating CD8+ T cells 325.00 ± 231.48 202.34 ± 140.29 224.60 ± 119.37 0.004 Infiltrating CD68+ macrophages 152.33 ± 80.24 125.43 ± 65.40 120.40 ± 54.92 0.095 Infiltrating CD163+ macrophages 116.67 ± 70.68 104.57 ± 66.70 117.00 ± 76.24 0.646 Score of PD-1 0.787 0 (-) 14 (11.02%) 18 (14.17%) 25 (19.69%) 1 (+) 8 (6.30%) 15 (11.81%) 10 (7.87%) 2 (++) 4 (3.15%) 9 (7.09%) 7 (5.51%) 3 (+++) 4 (3.15%) 5 (3.94%) 8 (6.30%) Score of PD-L1 0.041 0 (-) 2 (1.57%) 11 (8.66%) 5 (3.94%) 1 (+) 8 (6.30%) 14 (11.02%) 20 (15.75%) 2 (++) 13 (10.24%) 19 (14.96%) 13 (10.24%) 3 (+++) 7 (5.51%) 3 (2.36%) 12 (9.45%) Serum LDH 199.58 ± 62.01 282.88 ± 206.24 433.30 ± 389.94 0.001 Score of serum LDH 0.001 0 ( < 250 U/L) 26 (20.47%) 33 (25.98%) 21 (16.54%) 1 (250-500 U/L) 4 (3.15%) 6 (4.72%) 16 (12.60%) 2 (≥ 500 U/L) 0 (0.00%) 8 (6.30%) 13 (10.24%) Serum iron 16.09 ± 9.08 12.94 ± 6.92 10.80 ± 5.85 0.007 Score of serum iron 0.036 0 ( < 7.8 μmol) 2 (1.57%) 9 (7.09%) 16 (12.60%) 1 (7.8-32.2 μmol) 27 (21.26%) 38 (29.92%) 34 (26.77%) 2 (≥ 32.2 μmol) 1 (0.79%) 0 (0.00%) 0 (0.00%) Serum albumin 43.43 ± 5.10 41.56 ± 5.10 38.80 ± 6.47 0.002 Score of serum iron 0.004 0 ( < 40 g/L) 7 (5.51%) 14 (11.02%) 28 (22.05%) 1 (40-55 g/L) 23 (18.11%) 33 (25.98%) 22 (17.32%) 2 (≥ 55 g/L) 0 (0.00%) 0 (0.00%) 0 (0.00%) Serum β2MG 1.98 ± 1.73 2.68 ± 1.59 3.98 ± 3.41 0.002 Score of serum β2MG 0.000 0 ( < 3 mg/L) 28 (22.05%) 29 (22.83%) 21 (16.54%) 1 (≥ 3 mg/L) 2 (1.57%) 18 (14.17%) 29 (22.83%) Table Supplementary Table 2. Baseline Characteristics of Patients with Stratification of Revised IPI
Factors Low IPI Low to Intermediate IPI High to Intermediate IPI High IPI P Value Sex 0.263 Male 18 (14.17%) 14 (11.02%) 30 (23.62%) 16 (12.60%) Female 7 (5.51%) 15 (11.81%) 20 (15.75%) 7 (5.51%) Age 43.16 ± 12.25 49.14 ± 12.46 62.14 ± 10.60 64.22 ± 11.49 0.000 Histological classification 0.199 DLBCL 11 (8.66%) 13 (10.24%) 14 (11.02%) 4 (3.15%) GCB DLBCL 13 (10.24%) 15 (11.81%) 31 (24.41%) 15 (11.81%) Non-GCB MCL 1 (0.79%) 1 (0.79%) 5 (3.94%) 4 (3.15%) Sites of involvement 0.298 Nodal 17 (13.39%) 15 (11.81%) 35 (27.56%) 17 (13.39%) extranodal 8 (6.30%) 14 (11.02%) 15 (11.81%) 6 (4.72%) Ann Arbor stage 0.003 Ⅰ 5 (3.94%) 4 (3.15%) 1 (0.79%) 0 (0.00%) Ⅱ 7 (5.51%) 9 (7.09%) 12 (9.45%) 3 (2.36%) Ⅲ 10 (7.87%) 19 (14.96%) 24 (18.90%) 6 (4.72%) Ⅳ 3 (2.36%) 7 (5.51%) 13 (10.24%) 14 (11.02%) B symptom 0.009 Yes 2 (1.57%) 9 (7.09%) 19 (14.96%) 12 (9.45%) No 23 (18.11 %) 20 (15.75%) 31 (24.41%) 11 (8.66%) ECOG performance status 0.002 0 18 (14.17%) 16 (12.60%) 18 (14.17%) 5 (3.94%) 1 5 (3.94%) 4 (3.15%) 4 (3.15%) 2 (1.57%) 2 2 (1.57%) 8 (6.30%) 26 (20.47%) 16 (12.60%) 3 0 (0.00%) 1 (0.79%) 2 (1.57%) 0 (0.00%) Absolute count of lymphocytes in blood 1.50 ± 0.70 1.46 ± 0.54 1.56 ± 0.74 1.36 ± 0.90 0.753 Score of absolute count of lymphocytes in blood 0.238 0 ( < 1.1 × 10⁹/L) 7 (5.51%) 8 (6.30%) 16 (12.60%) 12 (9.45%) 1 (1.1-3.2 × 10⁹/L) 17 (13.39%) 21 (16.54%) 32 (25.20%) 9 (7.09%) 2 (≥ 3.2 × 10⁹/L) 1 (0.79%) 0 (0.00%) 2 (1.57%) 2 (1.57%) Absolute count of monocytes in blood 0.34 ± 0.21 0.37 ± 0.27 0.45 ± 0.24 0.40 ± 0.33 0.315 Score of absolute count of monocytes in blood 0.621 0 ( < 0.1 × 10⁹/L) 5 (3.94%) 6 (4.72%) 6 (4.72%) 5 (3.94%) 1 (0.1-0.6 × 10⁹/L) 18 (14.17%) 16 (12.60%) 33 (25.98%) 13 (10.24%) 2 (≥ 0.6 × 10⁹/L) 2 (1.57%) 7 (5.51%) 11 (8.66%) 5 (3.94%) Absolute count of neutrophils in blood 4.84 ± 1.87 4.32 ± 1.94 3.85 ± 1.62 4.60 ± 3.31 0.235 Score of absolute count of neutrophils in blood 0.319 0 ( < 1.8 × 10⁹/L) 0 (0.00%) 1 (0.79%) 3 (2.36%) 1 (0.79%) 1 (1.8-6.3 × 10⁹/L) 19 (14.96%) 23 (18.11%) 44 (34.65%) 20 (15.75%) 2 (≥ 6.3 × 10⁹/L) 6 (4.72%) 5 (3.94%) 3 (2.36%) 2 (1.57%) Platelet count 209.16 ± 69.44 221.93 ± 131.66 182.16 ± 68.50 176.35 ± 103.09 0.187 Score of platelet count 0.038 0 ( < 125 × 109/L) 1 (0.79%) 4 (3.15%) 9 (7.09%) 8 (6.30%) 1 (125-350 × 109/L) 23 (18.11%) 21 (16.54%) 40 (31.50%) 14 (11.02%) 2 (≥ 350 × 109/L) 1 (0.79%) 4 (3.15%) 1 (0.79%) 1 (0.79%) NLR 3.81 ± 2.47 3.21 ± 1.49 2.93 ± 1.60 5.14 ± 4.94 0.011 Score of NLR 0.058 0 ( < 0.56) 0 (0.00%) 1 (0.79%) 3 (2.36%) 1 (0.79%) 1 (0.56-5.73) 21 (16.54%) 28 (22.05%) 44 (34.65%) 16 (12.60%) 2 (≥ 5.73) 4 (3.15%) 1 (0.79%) 3 (2.36%) 6 (4.72%) MLR 0.26 ± 0.18 0.30 ± 0.29 0.32 ± 0.21 0.42 ± 0.39 0.227 Score of MLR 0.553 0 ( < 0.03) 3 (2.36%) 0 (0.00%) 1 (0.79%) 1 (0.79%) 1 (0.03-0.19) 7 (5.51%) 10 (7.87%) 13 (10.24%) 8 (6.30%) 2 (≥ 0.19) 15 (11.81%) 18 (14.17%) 36 (28.35%) 14 (11.02%) PLR 158.15 ± 78.30 172.90 ± 119.55 135.30 ± 70.33 191.08 ± 144.61 0.136 Score of PLR 0.029 0 ( < 39.06) 0 (0.00%) 0 (0.00%) 1 (0.79%) 3 (2.36%) 1 (39.06-318.18) 24 (18.90%) 26 (20.47%) 48 (37.8%) 17 (13.39%) 2 (≥ 318.18/L) 1 (0.79%) 3 (2.36%) 1 (0.79%) 3 (2.36%) Infiltrating CD4+ T cells 311.72 ± 309.52 222.55 ± 159.50 285.28 ± 207.97 247.91 ± 225.64 0.462 Infiltrating Foxp3+ T cells 165.92 ± 113.51 121.10 ± 124.04 137.24 ± 131.47 132.74 ± 139.82 0.631 Infiltrating CD8+ T cells 351.60 ± 240.84 175.52 ± 142.07 216.40 ± 119.50 251.74 ± 123.24 0.000 Infiltrating CD68+ macrophages 155.60 ± 86.65 135.52 ± 54.02 117.30 ± 63.03 121.74 ± 55.73 0.104 Infiltrating CD163+ macrophages 120.00 ± 72.86 116.21 ± 79.53 103.36 ± 79.53 118.57 ± 70.69 0.723 Score of PD-1 0.878 0 (-) 12 (9.45%) 12 (9.45%) 21 (16.54%) 12 (9.45%) 1 (+) 8 (6.30%) 6 (4.72%) 12 (9.45%) 7 (5.51%) 2 (++) 3 (2.36%) 6 (4.72%) 9 (7.09%) 2 (1.57%) 3 (+++) 2 (1.57%) 5 (3.94%) 8 (6.30%) 2 (1.57%) Score of PD-L1 0.133 0 (-) 1 (0.79%) 4 (3.15%) 12 (9.45%) 1 (0.79%) 1 (+) 7 (5.51%) 12 (9.45%) 16 (12.60%) 7 (5.51%) 2 (++) 11 (8.66%) 11 (8.66%) 15 (11.81%) 8 (6.30%) 3 (+++) 6 (4.72%) 2 (1.57%) 7 (5.51%) 7 (5.51%) Serum LDH 202.28 ± 62.28 265.63 ± 133.64 294.84 ± 204.54 584.59 ± 519.76 0.000 Score of serum LDH 0.006 0 ( < 250 U/L) 22 (17.32%) 18 (14.17%) 32 (25.20%) 8 (6.30%) 1 (250-500 U/L) 3 (2.36%) 7 (5.51%) 10 (7.87%) 6 (4.72%) 2 (≥ 500 U/L) 0 (0.00 %) 4 (3.15%) 8 (%) 9 (7.09%) Serum iron 14.77 ± 5.40 14.78 ± 10.44 12.45 ± 6.31 9.15 ± 5.09 0.019 Score of serum iron 0.041 0 ( < 7.8 μmol) 2 (1.57%) 6 (4.72%) 7 (5.51%) 10 (7.87%) 1 (7.8-32.2 μmol) 23 (18.11%) 22 (17.32%) 24 (18.90%) 13 (10.24%) 2 (≥ 32.2 μmol) 0 (0.00%) 1 (0.79%) 0 (0.00%) 0 (0.00%) Serum albumin 44.14 ± 4.81 42.00 ± 5.65 40.44 ± 5.40 37.05 ± 6.43 0.000 Score of serum iron 4 (3.15%) 9 (7.09%) 21 (16.54%) 15 (11.81%) 0.004 0 ( < 40 g/L) 21 (16.54%) 20 (15.75%) 29 (22.83%) 8 (6.30%) 1 (40-55 g/L) 0 (0.00%) 0 (0.00%) 0 (0.00%) 0 (0.00%) 2 (≥ 55 g/L) Serum β2MG 1.68 ± 0.92 2.56 ± 1.77 3.19 ± 2.13 4.71 ± 4.31 0.000 Score of serum β2MG 0.000 0 ( < 3 mg/L) 23 (19.66%) 21 (16.54%) 26 (20.47%) 8 (6.30%) 1 (≥ 3 mg/L) 2 (1.57%) 8 (6.30%) 24 (18.90%) 15 (11.81%) Table Supplementary Table 3. Baseline Characteristics of Patients with Stratification of NCCN-IPI
Factors P Value IPI R-IPI NCCN-IPI Age 0.005 0.006 0.000 Sex 0.645 0.529 0.263 Histological classification 0.571 0.369 0.199 Sites of involvement 0.940 0.908 0.298 Ann Arbor stage 0.000 0.000 0.003 B symptom 0.000 0.000 0.009 ECOG performance status 0.000 0.000 0.002 Absolute count of lymphocytes in blood 0.717 0.565 0.753 Score of absolute count of lymphocytes in blood 0.270 0.074 0.238 Absolute count of monocytes in blood 0.003 0.033 0.315 Score of absolute count of monocytes in blood 0.018 0.191 0.621 Absolute count of neutrophils in blood 0.899 0.832 0.235 Score of absolute count of neutrophils in blood 0.294 0.137 0.319 Platelet count 0.420 0.255 0.187 Score of platelet count 0.102 0.085 0.038 NLR 0.098 0.265 0.011 Score of NLR 0.197 0.376 0.058 MLR 0.091 0.068 0.227 Score of MLR 0.048 0.062 0.553 PLR 0.645 0.820 0.136 Score of PLR 0.205 0.125 0.029 Infiltrating CD4+T cells 0.546 0.187 0.462 Infiltrating FOXP3+ T cells 0.860 0.192 0.631 Infiltrating CD8+T cells 0.017 0.004 0.000 Infiltrating CD68+ macrophages 0.106 0.095 0.104 Infiltrating CD163+ macrophages 0.481 0.646 0.723 Score of PD-1 expression 0.359 0.787 0.878 Score of PD-L1 expression 0.041 0.041 0.133 Serum LDH 0.000 0.001 0.000 Score of serum LDH 0.001 0.001 0.006 Serum iron 0.001 0.007 0.019 Score of serum iron 0.020 0.036 0.041 Serum albumin 0.001 0.002 0.000 Score of serum albumin 0.003 0.004 0.004 Serum β2MG 0.000 0.002 0.000 Score of serum β2MG 0.000 0.000 0.000 Note. NLR, neutrophil-to-lymphocyte ratio; MLR, monocyte-to-lymphocyte ratio, PLR, platelet-to-lymphocyte ratio. Table 1. Results of ANOVA and Chi-Square Tests in Different Risk Stratification Models
Factors Likelihood Ratio Tests IPI R-IPI NCCN-IPI Chi-square df P Value Chi-square df P Value Chi-square df P Value Age 28.197 3 0.000 58.676 3 0.000 14.049 2 0.001 Ann Arbor stage 54.930 9 0.000 26.311 9 0.002 30.882 6 0.000 B symptoms 2.782 3 0.427 2.825 3 0.419 5.890 2 0.053 ECOG performance status 14.246 9 0.114 15.068 9 0.089 3.284 6 0.772 Absolute count of monocytes in blood 17.854 3 0.000 6.974 3 0.073 1.619 2 0.445 Infiltrating CD8+ T cells 9.105 3 0.028 8.921 3 0.030 3.336 2 0.189 Score of PD-L1 expression in lymphoma tissue 24.488 9 0.004 15.810 9 0.071 12.041 6 0.061 Score of serum LDH 12.444 6 0.053 10.045 6 0.123 3.975 4 0.409 Score of serum iron 11.475 6 0.075 2.141 6 0.906 4.113 4 0.391 Score of serum albumin 10.868 3 0.012 0.932 3 0.818 1.049 2 0.592 Score of serum β2MG 12.385 3 0.006 3.035 3 0.386 2.367 2 0.306 Table 2. Likelihood Ratio Tests of Various Factors in Estimating the Risk Stratification by Multinomial Logistic Regression
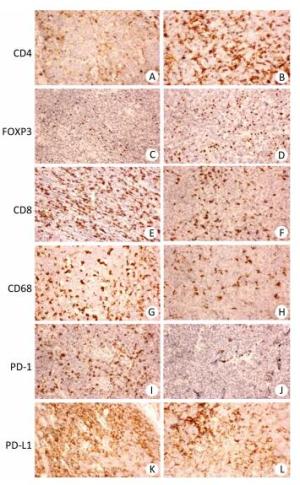
Figure 1. Immunohistochemistry of CD4, Foxp3, CD8, CD68, PD-1, and PD-L1 in aggressive B cell lymphoma. (A, C, E, G, I, K) Representative case of diffuse large B cell lymphoma (DLBCL) stained with CD4, FOXP3, CD8, CD68, PD-1, and PD-L1 antibodies. (B, D, F, H, J, L) Representative case of mantle cell lymphoma (MCL) stained with CD4, Foxp3, CD8, CD68, PD-1, and PD-L1 antibodies. Original magnification, × 200.
Multinomial logistic regression models were developed for the IPI, R-IPI, and NCCN-IPI subgroups to explore the probability of risk estimates for patients with aggressive B cell lymphomas using a combination of the factors selected from the ANOVA and chi-square test results (Tables 3, 4). As shown in Table 3, when the Ann Arbor stage data were considered, the concordance rates of the predicted risk stratification using multinomial logistic regression were 85.1%-100.0%. The concordance rates between the actual and predicted stratification were both 100.0% in the NCCN-IPI group. In comparison, when the Ann Arbor stage data were not considered (Table 4), the concordance rates of the predicted risk stratification decreased slightly to 81.4%-100.0%. To further investigate the difference in the estimated risk stratification using the above clinicopathological factors with or without the Ann Arbor stage data, a paired t-test was performed to compare the results of Tables 3 and 4. As shown in Table 5, no significant difference in the estimated risk stratification was detected using the above clinicopathological factors with or without the Ann Arbor stage data.
Score Models Stratification Predicted Stratification Concordance Rate Low risk Low-intermediate risk High intermediate risk High risk IPI Low risk 34 (26.77%) 0 (0.00%) 0 (0.00%) 0 (0.00%) 100.0% Low-intermediate risk 0 (0.00%) 41 (32.28%) 3 (2.36%) 0 (0.00%) 93.0% High-intermediate risk 0 (0.00%) 3 (2.36%) 28 (22.05%) 0 (0.00%) 90.3% High risk 0 (0.00%) 0 (0.00%) 0 (0.00%) 19 (14.96%) 100.0% NCCN-IPI Low risk 25 (19.69%) 0 (0.00%) 0 (0.00%) 0 (0.00%) 100.0% Low-intermediate risk 0 (0.00%) 29 (22.83%) 0 (0.00%) 0 (0.00%) 100.0% High-intermediate risk 4 (3.15%) 2 (1.57%) 41 (32.28%) 3 (2.36%) 100.0% High risk 0 (0.00%) 0 (0.00%) 0 (0.00%) 23 (18.11%) 100.0% R-IPI Observed Very good good Poor Concordance rate Very good 30 (23.62%) 0 (0.00%) 0 (0.00%) 100.0% Good 0 (0.00%) 40 (31.50%) 7 (5.51%) 85.1% Poor 0 (0.00%) 6 (4.72%) 44 (34.65%) 88.0% Table 3. Concordance Rate of Predicted Risk Stratification Using Multinomial Logistic Regression (Influence of Ann Arbor Stages Considered)
Score Models Stratification Predicted Stratification Concordance Rate Low risk Low-intermediate risk High intermediate risk High risk IPI Low risk 33 (25.98%) 0 (0.00%) 0 (0.00%) 1 (0.79%) 97.1% Low-intermediate risk 1 (0.79%) 35 (27.56%) 6 (4.72%) 1 (0.79%) 81.4% High-intermediate risk 0 (0.00%) 4 (3.15%) 27 (21.26%) 0 (0.00%) 87.1% High risk 0 (0.00%) 0 (0.00%) 0 (0.00%) 19 (14.96%) 100.0% NCCN-IPI Low risk 25 (19.69%) 0 (0.00%) 2 (1.57%) 0 (0.00%) 100.0% Low-intermediate risk 0 (0.00%) 29 (22.83%) 0 (0.00%) 0 (0.00%) 100.0% High-intermediate risk 0 (0.00%) 0 (0.00%) 50 (39.37%) 0 (0.00%) 100.0% High risk 1 (0.79%) 0 (0.00%) 0 (0.00%) 22 (17.32%) 95.7% R-IPI Observed Very good good Poor Concordance rate Very good 30 (23.62%) 0 (0.00%) 0 (0.00%) 100.0% Good 0 (0.00%) 41 (32.28%) 6 (4.72%) 87.2% Poor 0 (0.00%) 6 (4.72%) 44 (34.65%) 88.0% Table 4. Concordance Rate of Predicted Risk Stratification by Multinomial Logistic Regression (influence of Ann Arbor stages not considered)
Variables Paired Differences t df P Value Mean Std. Deviation Std. Error Mean Pair 1 Estimated IPI risk stratification 4.425 4.996 2.498 1.771 3 0.175 Pair 2 Estimated NCCN-IPI risk stratification 1.075 2.150 1.075 1.000 3 0.391 Pair 3 Estimated R-IPI risk stratification -0.700 1.212 0.700 -1.000 2 0.423 Table 5. Paired t Test on the Concordance Rates of Three Predicted Stratification Models with and without Ann Arbor Stage Data
-
The IPI is a powerful tool that has been widely used clinically for predicting outcomes of patients with aggressive NHL[16]. However, use of the IPI scoring system to identify high-risk patients has been challenged in the rituximab era because the combination of monoclonal anti-CD20 antibody, cyclophosphamide, adriamycin, vincristine, and prednisone (CHOP) has improved overall survival for all risk groups of DLBCLs[37-38]. Modifications to the standard IPI scoring model were proposed to resolve the discrepancies between the risk scores and clinical outcomes. Two modified IPI based scoring models, the R-IPI and NCCN-IPI, are reported to be better than the standard IPI for evaluating the clinical prognosis of aggressive B cell lymphomas[17-18]. In recent years, large-scale studies have demonstrated that the molecular and cellular nature of the tumor immune microenvironment, including immune cells and receptors/ligands expressed in immune cells is important for tumor growth and clinical prognosis[26-27, 39-42]. However, the association between the immune microenvironment and the IPI-based risk stratification for aggressive B cell lymphomas remains largely unknown. In our study, a significant difference in the distribution of CD8+ T lymphocytes and PD-L1 expression status was observed between the low-risk and high-risk groups stratified either by the IPI, R-IPI, or NCCN-IPI (Table 1). Such a difference in the distribution indicates that immune markers, such as tumor-infiltrating T lymphocytes and the PD-1/PD-L1 pathway, might play important roles in the prognosis of aggressive B cell lymphomas.
Since the link between inflammation and cancer was first reported by Rudolf Virchow in 1863, extensive evidence has demonstrated that immune cells, including T cells, macrophages (TAMs), evasion[23-24, 43-45]. Immune suppression induced by tumor cells results in decreased cytotoxicity of CD8+ T cells, increased immune-suppressive T cells, such as regulatory T cells (Tregs), higher expression of inhibitory modulatory molecules, such as CTLA-4, PD-1, and PD-L1, in the microenvironment, and a poor prognosis. For this reason, monitoring immunomodulatory factors and immune status in the tumor microenvironment, such as tumor-infiltrating T cells, could be used to predict the prognosis of solid malignancies including lymphomas[31-32, 46-50]. To test this hypothesis, we evaluated immune cell distribution and expression of PD-L1 and PD-1 on tissue sections from 127 patients with aggressive B cell lymphomas. Our research demonstrated that immune microenvi-ronmental factors, including tumor-infiltrating T cells, such as CD8+ T lymphocytes, and immune checkpoint molecules, such as PD-L1, can be used to predict prognosis of patients with aggressive B cell lymphomas.
The clinical behavior and prognosis of malignant tumors depend on the interactions between tumors and their microenvironment. For example, TAMs are required for tumor cell migration, invasion, and formation of metastases, and high levels of TAMs are associated with a poor prognosis in many cancers, including breast cancer, melanoma, hepatocarcinoma, prostate cancer, and lymphomas[45, 51-54]. However, activation of tumor-specific cytotoxic CD8+ T lymphocytes plays a vital role in the anti-tumor immune response, while suppressive immune cells, including CD4+Foxp3+ Tregs, and MDSCs, and other inhibitory factors, such as the newly recognized immune checkpoint molecules PD-1/PD-L1, can lower the function of CD8+ T lymphocytes. Discordant results on the correlation between immune cells and molecules involved in the tumor microenvironment and tumor prognosis have been identified in various malignant tumors[55-57].
Because of the association between chronic inflammation and cancer, inflammatory and nutritional biomarkers in the blood, such as WBC-DC, serum LDH, albumin, β2MG, and iron, have become important indicators of patients' immune and nutritional status when evaluating tumor prognosis and the treatment responses of patients with malignant tumors, such as solid cancers and lymphohematopoietic malignancies[16, 32, 40, 58-59]. As expected, large differences in serum LDH, albumin, β2MG, and iron expression levels were observed among the subgroups stratified by the IPI, R-IPI, or NCCN-IPI, whereas only circulatory monocytes were significantly different among the subgroups stratified by the IPI and R-IPI.
An accurate pathological diagnosis and risk stratification are crucial for effective treatment of lymphomas[2]. Ultrasound, X-ray, computed tomography, magnetic resonance imaging, and other sophisticated techniques, such as positron emission-computed tomography, are traditionally used to provide information on prognosis stage and risk stratification of lymphomas during routine clinical practice. Our results demonstrate that immune microenvironmental biomarkers and systematic inflammatory/nutritional biomarkers in the blood provide an inexpensive and more convenient way to stratify lymphoma risk. By analyzing the correlation between the tumor microenvironment (CD8+T lymphocytes and PD-L1 expression), WBC-DC, serum LDH, albumin, β2MG, iron, and ECOG performance status without the Ann Arbor stage data, we reached satisfactory concordance rates similar to the estimates with the above factors in addition to the Ann Arbor stage data. Our study might lead to the development of a new approach for risk stratification of aggressive B cell lymphomas. In addition, these biomarkers could be used to evaluate the efficacy and safety of anti-lymphoma drugs on the tumor-microenvironment-on-chip platform[60].
The limitations of this study include the small sample size and lack of sufficient data for a survival curve analysis because of the loss to follow-up for most lymphoma patients before 2015. In addition, the fixation state of the tissue samples and the areas analyzed in tissue sections may have diminished the quantification of immune cells and the expression of protein biomarkers in this study. However, this study did demonstrate for the first time that parameters in the tumor immune microenvironment, as well as systematic inflammatory and metabolic markers can be used for risk estimates of aggressive B cell lymphoma.
In conclusion, the association between the tumor immune microenvironment, systematic inflammatory and metabolic biomarkers, and clinical characteristics of aggressive B cell lymphoma paves the way to develop an economical and simple risk stratification method for routine clinical practice. Large cohorts of retrospective and prospective studies are required to further validate this practice.
the National Natural Science Foundation of China 81170467
the National Natural Science Foundation of China 81270569
Medical Science Research Foundation of Chongqing Health and Family Planning Committee 2015MSXM224
Major Project of PLA Medical S & T Foundation AWS11C004

 Quick Links
 DownLoad: