-
Arsenic, one of the most ubiquitous toxins, is widely distributed in soil and water and endangers the health of humans worldwide[1]. Inorganic arsenic has a wide range of adverse health effects, including skin lesions[2], cardiovascular diseases[3], diabetes[4], birth defects[5], abortion[6], cognitive impairment[7], and cancer[8]. Arsenic exists in trivalent arsenic (AsⅢ) and pentavalent arsenic (iAsⅤ) forms. Based on the molecular similarities between arsenate and phosphate, it has generally been assumed that iAsⅤ enters mammalian cells via inorganic phosphate (Pi) transporters[9]. Pi transporters are known to catalyze the uptake of Pi across the plasma membrane in mammalian cells[10-11]. They are grouped into three families, namely type Ⅰ-Ⅲ sodium/phosphate cotransporters[11-12]. Type Ⅰ (SLC17 family) cotransporters are involved in organic anion transport, including that of phosphate, while their role in Pi homeostasis is unclear[13]. Type Ⅱ sodium/phosphate cotransporters (SLC34 family) are expressed in a tissue-specific manner: NaPi-IIa and NaPi-IIc are mainly expressed in the kidney[14], and NaPi-IIb is expressed in the intestines, lung, testis, and kidney[15]. Type Ⅲ (SLC20 family, PIT-1, and PIT-2) cotransporters, which are expressed ubiquitously in all tissues, have been proposed to function in general transport of Pi into cells and have been identified as the predominant phosphate transporters in rats[16]. Several studies have shown that arsenate is a substrate for members of the SLC34 and SLC20 family of Na+-Pi cotransporters[17-20].
Diabetes mellitus, a chronic metabolic disease, has become one of the most prevalent non-communicable diseases worldwide. Diabetes mellitus is divided into two types, type Ⅰ and type Ⅱ. Type Ⅰ diabetes mellitus (TIDM) is a disorder that arises following the autoimmune destruction of insulin-producing pancreatic β cells[21-22], which usually presents as a classic trio of symptoms (polydypsia, polyphagia, and polyuria) alongside overt hyperglycemia[23]. TIDM has various adverse impacts on many tissues, such as the kidney, heart, retina, liver, lung, vasculature, and skeletal muscle[24]. Many gene expression levels are altered in the liver and lungs of TIDM rats[25-26], which might contribute to the increased susceptibility to toxins associated with diabetes. For example, STZ-induced TIDM rats are more susceptible to cadmium nephrotoxicity than are normal rats[27].
In this study, arsenic was found to be absorbed to a greater extent in many different tissues of TIDM mice than in the tissues of normal mice at 2 h after treatment with 15.0 mg/kg pentavalent arsenic (Na2HAsO4·12H2O). To explore the possible molecular mechanism underlying this increased uptake of arsenate in diabetic animals, sodium/phosphate cotransporters were studied. Type Ⅱ sodium/phosphate cotransporters have tissue-specific expression, while type Ⅲ sodium/phosphate cotransporters are widely expressed in most tissues. Therefore, the type Ⅲ sodium/phosphate cotransporters PIT1 and PIT2 were chosen for this study. To determine whether altered PIT1 and PIT2 expression was associated with genetic upregulation, their expression levels were evaluated in the heart, kidneys, and liver, the chief arsenic target organs, along with the effect of insulin treatment in TIDM mice induced by STZ.
HTML
-
Male ICR mice were obtained from the Experimental Animal Center of Nantong University, China. They were maintained in a specific-pathogen-free barrier facility under a reverse 12-h light/dark cycle (lights off at 10:00 am) and acclimatized for 3 days before the experiments. The use of animals for this study was approved by the institutional animal ethics committee of Nantong University.
Sixty mice, weighing 20-24 g, were divided into 10 groups, then 9 groups were treated with 15.0 mg/kg Na2HAsO4·12H2O (Chengdu boruite chemical technology Co., Ltd, Chengdu, China) by intragastric administration after 5 h of fasting (with free access to water). Six mice in each group were euthanized at 0, 0.5, 1, 2, 3, 6, 12, 24, and 48 h after treatment, and tissue samples were removed and stored in a deep freezer at -80 ℃ for the measurement of arsenic. The last six mice were treated with saline and used as the control group. Tissues of mice in the control and 2 h post-exposure groups were removed for detection of mRNA expression of Pit1 and Pit2.
To prepare the STZ-induced diabetic mouse model, 24 mice, weighing 17-19 g, were fasted for 12 h with free access to water, and then fasting blood glucose levels was determined in blood samples obtained from the tail vein. Mice were then randomly divided into two groups, namely the TIDM group (n = 13) and the normal group (n = 11). The TIDM group was intraperitoneally (i.p.) injected with STZ (Sigma-Aldrich, Co. St. Louis, MO, USA) dissolved in citric acid-sodium citrate buffer (pH 4.4) at a dose of 60.0 mg/(kg·bw), whereas the normal group was injected with the same amount of the vehicle solution. STZ and vehicle solution were injected once per day for 5 consecutive days. The mice were monitored for 12 days following the last injection. Body weights and food and water intake were recorded every day. Fasting blood glucose levels were measured on the last day.
The mice in the TIDM group with blood glucose concentrations greater than 11.1 mmol/L were considered to be STZ-induced stable diabetic mice[28]. According to this criterion, two mice in the TIDM group were eliminated because their fasting blood glucose levels were less than 11.1 mmol/L. Then, 11 mice from each of the normal and TIDM groups were treated with 15.0 mg/kg Na2HAsO4·12H2O by intragastric administration following fasting for 5 h (with free access to water). The mice were euthanized at 2 h after treatment, and tissues were removed and stored in a deep freezer at -80 ℃ for the measurement of arsenic levels.
To determine the mechanisms that modulate the expression of Na/Pi transporters, an insulin-treated group was also utilized. Eighteen mice, weighing 17-19 g, were split into three groups of six individuals: a normal group (Control), a diabetic group (TIDM), and a diabetic group treated with insulin (TIDMI). One day after confirmation of diabetes, the animals from the TIDMI group received daily subcutaneous injections of porcine pancreatic insulin [I113907-10 mg, 28.3 UPS units/mg (HPLC), Aladdin, China] diluted in 0.9% NaCl (5 IU twice a day, at 9 am and 9 pm). The animals in the normal and TIDM groups received saline injections by the same route during the study. The insulin doses were standardized under the same conditions used in the pilot study. The standardization was performed over a period of 14 days, and the protocol was chosen after careful evaluation of the glucose concentrations, which were measured throughout the day. The twice-daily 5-IU insulin dose outlined in the protocol had no impact on animal mortality, allowed better maintenance of glucose concentrations, and showed results similar to those of the control group. To avoid the influence of changes in blood glucose, all mice were injected with insulin at 9 am, and tissues were collected between 10 am and 12 pm to detect Pit1 and Pit2 mRNA. The PIT1 and PIT2 protein levels were detected in normal and diabetic mouse tissues. Before sacrifice, the fasting blood glucose levels of TIDMI mice were all measured to be less than 6.0 mmol/L.
-
The fasting blood glucose levels were measured using an Accu-Chek Advantage glucometer (Roche Diagnostics GmbH, Mannheim, Germany).
-
Briefly, an approximately 200.0 mg tissue sample was placed in a beaker, mixed with 5.0 mL of ultrapure concentrated HNO3 (Sinopharm chemical reagent Co., Ltd, Shanghai, China), and then incubated at room temperature overnight. Next, the beaker was placed on a hot plate at 90-100 ℃. Then, approximately 6.0 mL of a freshly prepared mixture of concentrated HNO3 and H2O2 (1:1, v/v) was added to each beaker and heated to 100 ℃ after hydrolysis of concentrated HNO3. After drying, 3.0 mL of 30% H2O2 was added and further heated until the solution became colorless. Following hydrolysis, all materials in the beaker were transferred to a 15.0 mL test tube. The residue in the beakers was then thoroughly washed with distilled water and combined with the hydrolysate described above. The final volume of the mixture was exactly 9.0 mL. Finally, 0.5 mL of 150 g/L thiourea solution and 0.5 mL of 36% concentrated hydrochloric acid were added to each tube. The concentration of arsenic was measured with an atomic fluorescence spectrometer AFS-9700 machine (Kchaiguang Instrument Co., Ltd. Beijing, China), using 5% hydrochloric acid as the carrier liquid, high-purity argon as the carrier gas, and potassium borohydride as the reducing agent.
-
Total RNA was extracted using an RNAisoTM Plus kit (TaKaRa Biotechnology Co., Ltd, Dalian, China) following the manufacturer's instructions. Single-stranded cDNA was synthesized from 3.5 μg of total RNA with an M-MLV reverse transcriptase kit (TaKaRa Biotechnology Co., Ltd, Dalian, China). For a visual evaluation of mRNA expression, routine RT-PCR was also performed. Hypoxanthine guanine phosphoribosyl transferase (Hprt) was used as the loading control for heart tissue, and β-actin was used as the control for liver and kidney tissues. The primer sequences are listed in Table 1. PCR was performed in a thermal cycler as follows: initial denaturation at 94 ℃ for 4 min; cycles of denaturation at 94 ℃ for 30 s, annealing at various temperatures (Table 1) for 30 s, and extension at 72 ℃ for 1 min; and a final 10 min extension at 72 ℃ (Bio-Rad Laboratories, Inc. Hercules, CA, USA).
Genes Primers (5'-3') Tm (˚C) Cycles* Size (bp) Mouse-Pit1 (XM-011239399) sense GAAGGAGGAGACCAGCATAG 55 23/27/24 245 anti-sense GAAGTGTAGCTGTTGTTGCG Mouse-Pit2 (NM-011394) sense GAATCTCTACAACGAGACCG 56 24/27/24 199 anti-sense CAATCTTGACGAGCTCCATC β-actin (NM-007393) sense CTCCGGAGTCCATCACAATG 57 24/24/24 199 anti-sense CTACAATGAGCTGCGTGTGG Hprt (NM-013556) sense GACTTGCTCGAGATGTCATG 55 24/24/24 379 anti-sense GTATCCAACACTTCGAGAGG Note. *Cycle numbers applied for semi-quantitative PCR amplification of total RNA from the heart, liver, and kidney, respectively. Table 1. Primers Used in Semi-quantitative PCR and Real-time Quantitative PCR
PCR products (10 µL) were electrophoresed on a 1.5% agarose gel containing 0.5 µg/mL ethidium bromide, and the gel was exposed to UV light and imaged with a Gel Doc™ XR Gel Documentation System (Bio-Rad Laboratories, Inc. Hercules, CA, USA).
The synthesized cDNA was also subjected to real-time PCR in a Light CyclerR 480 Ⅱ (Roche Diagnostics GmbH, Mannheim, Germany) using SYBR enzyme (TaKaRa Biotechnology Co., Ltd, Dalian, China). The reaction mixture (5.0 μL of 2x SYBR enzyme, 0.4 μmol/L aliquots of sense and anti-sense primers, approximately 100 ng of cDNA, and ddH2O up to a final reaction volume of 10 μL) was heated to 95 ℃ for 15 s, followed by 40 cycles of PCR consisting of annealing for 15 s and extension at 72 ℃ for 20 s. Melting curve analysis was used to confirm the purity of the PCR product. Data were analyzed using the 2-ΔΔCt method.
-
Mouse tissues were isolated using RIPA buffer (150 mmol/L NaCl, 1% TritonX-100, 50 mmol/L Tris pH 7.4, 1% sodium deoxycholate, 0.1% SDS, 1 mmol/L PMSF) supplemented with a protease inhibitor cocktail (Roche Diagnostics GmbH, Mannheim, Germany). Protein concentrations were determined by using a Bio-Rad protein assay kit (Bio-Rad Laboratories, Inc. Hercules, CA, USA) with bovine serum albumin as a standard. The proteins were mixed with 2× SDS sample buffer and denatured at 95 ℃ for 10 min. Equal amounts of protein samples were separated by SDS-PAGE. Separated proteins were electrophoretically transferred onto polyvinylidene fluoride membranes in a mini-protein II Electrophoresis Apparatus (Bio-Rad). The blotted membrane was blocked with 0.1% TBST containing 3% nonfat dry milk at room temperature for 2 h and then incubated with the corresponding primary antibody at 4 ℃ overnight. The dilutions of anti-SLC20A1 antibody (ab177147, Abcam, Cambridge, MA, USA) and anti-SLC20A2 antibody (ab191182, Abcam, Cambridge, MA, USA) were both diluted to 1:1, 000 in 0.1% TBST. As an internal standard, β-actin antibody (1:20, 000) (A5316, Sigma-Aldrich, Co. St. Louis, MO, USA) (for the liver and kidneys) and rabbit antiglyceraldehyde-3-phosphate dehydrogenase (GAPDH) antibody (1:20, 000) (G9545, Sigma-Aldrich, Co. St. Louis, MO, USA) (for the heart) were used. The membrane was washed with 0.1% TBST and incubated with goat anti-rabbit IgG-HRP (1:20, 000) (BS13278, Bioworld Technology, Co., Ltd, Minneapolis, USA) at room temperature for 1 h, followed by another wash with 0.1% TBST. The membrane was then incubated with ImmobilonTM Western Chemiluminescent HRP Substrate (Millipore Corporation, Billerica, MA, USA) and imaged with a Tanon-5200 system (Tanon Company, Shanghai, China). Densitometric analysis of each protein on the western blot was performed to quantify signal intensities using Image J software, with the loading control normalized to 1.
-
At least five biological replicates were used for each analysis. All results are presented as the means ± standard deviations (mean ± SD), and data were analyzed statistically using SPSS17.0 software (SPSS Inc., USA). Results were considered statistically significant at P < 0.05 in the Student's t-test.
Animals and Treatments
Measurement of Fasting Blood Glucose
Measurement of Arsenic in Mouse Tissues
Semi-quantitative PCR and Real-time Quantitative RT-PCR
Western Blotting
Statistical Analysis
-
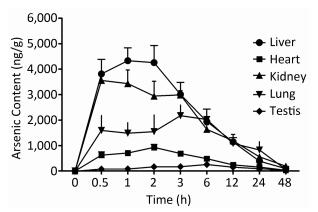
To examine the iAsⅤ uptake in mouse tissues, mice were given 15.0 mg/kg Na2HAsO4·12H2O by intragastric administration. The concentrations of arsenic in five tissue types are shown in Figure 1. The peak concentration of arsenic in the liver, kidneys, heart, lungs, and testis was reached at 1, 0.5, 2, 3, and 6 h, respectively. Therefore, we compared iAsⅤ uptake in the normal and the TIDM groups at 2.0 h after arsenate treatment in this study.
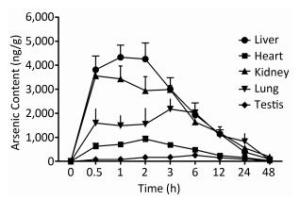
Figure 1. Arsenic concentrations in mouse tissues after intragastric administration of iAsⅤ. A total of 15.0 mg/kg Na2HAsO4·12H2O was given once to mice by intragastric administration. The mice were sacrificed at the indicated time points after treatment with iAsⅤ. The arsenic concentration in each tissue type was measured by atomic fluorescence spectrometer. The values are shown as the means ± SD, n = 6.
-
The body weight, food intake and water intake of mice were measured every day when the STZ was injected. After STZ administration blood glucose levels were significantly increased in TIDM mice, and their body weights were notably reduced compared with the normal group (Table 2).
Mice Baseline Body Weight (g) Baseline Blood Glucose before (mmol/L) Body Weight (g) Blood glucose After (mmol/L) Control 17.15 ± 0.82 5.88 ± 0.96 31.29 ± 3.83 5.93 ± 1.15 TIDM 17.45 ± 1.07 6.11 ± 0.78 23.26 ± 2.63** 21.34 ± 2.42** Note. Values are expressed as the means ± SD, (n = 16). Control, normal mice with the vehicle solution. TIDM, diabetic mice induced by STZ. **P < 0.01, significantly different from the respective control values. Table 2. Assessment of STZ-induced Diabetes Mellitus Mice
-
Both normal and TIDM mice underwent intragastric administration of 15.0 mg/kg Na2HAsO4·12H2O. Two hours after treatment, the mice were sacrificed, and the arsenic concentrations in various tissues were evaluated. The results showed that the arsenic levels were significantly increased in the liver, kidneys, heart, spleen, submandibular gland, testis, and brain tissues of TIDM mice compared with those of the normal group. These results indicated that arsenate was absorbed to a greater extent in various tissues of TIDM mice (Table 3).
Mice Liver Kidney Lung Heart Spleen Salivary Gland Testis Brain Control 4266.47 ± 1008.15 2945.00 ± 844.92 1547.55 ± 659.84 931.16 ± 222.86 1922.09 ± 520.20 581.95 ± 193.00 155.05 ± 49.37 129.32 ± 48.88 TIDM 7884.62 ± 1460.18** 3827.11 ± 627.27* 2397.43 ± 470.63** 1441.98 ± 300.41** 2908.45 ± 587.26** 973.79 ± 281.41* 219.80 ± 65.28* 200.91 ± 73.52** Note. Values are expressed as the means ± SD, (n = 11). Control, normal mice with the vehicle solution; TIDM, diabetic mice induced by STZ. *P < 0.05, **P < 0.01, significantly different from respective control values. Table 3. The Concentration of Arsenic in Various Tissues (ng/g)
-
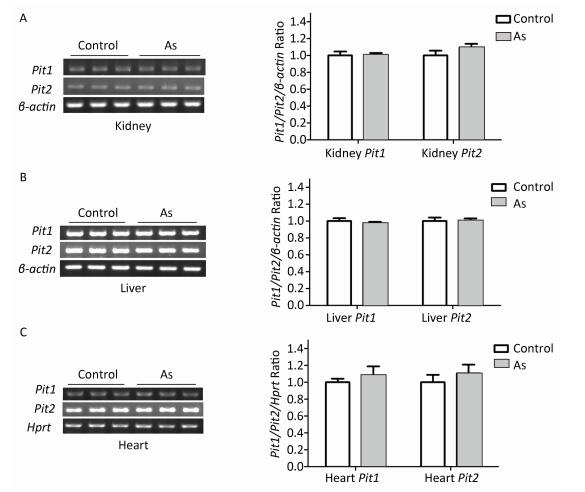
To explore the mechanism involved in increased arsenate uptake in TIDM mice, we first examined whether iAsⅤ itself altered the expression of genes associated with arsenate uptake. Normal mice were treated with or without 15.0 mg/kg Na2HAsO4·12H2O by intragastric administration, and the expression levels of Pit1 and Pit2 mRNA in the liver, kidney, and heart were examined 2 h after treatment. The results showed that neither Pit1 nor Pit2 gene expression levels were changed (Figure 2). These results suggested that the mRNA levels of Pit1 and Pit2 in those tissues were not affected by the treatment described above.
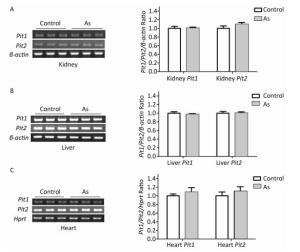
Figure 2. Pit1 and Pit2 mRNA expression levels in mouse tissues 2 h after exposure to arsenate. Representative semi-quantitative RT-PCR verifying mRNA expression levels of Pit1 and Pit2 in mouse kidney tissues (A), liver tissues (B), and cardiac tissues (C) before and after administration of iAsⅤ. Quantification shown to the right represents band intensity as measured with Quantity One image software. Control, mice that were treated with saline; As, mice that were treated with 15.0 mg/kg Na2HAsO4·12H2O. Data represent means ± SD, n = 6.
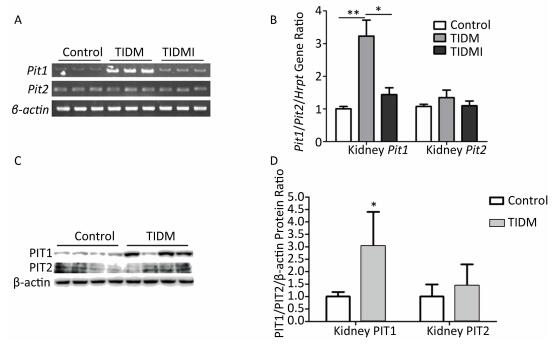
Next, we examined the Pit1 and Pit2 mRNA expression levels in the kidneys, hearts, and livers of normal, TIDM, and TIDMI mice. The Pit1 mRNA expression level in the kidney tissue of TIDM mice was higher than that in the normal group but was downregulated in the TIDMI group, as determined by semi-quantitative RT-PCR (Figure 3A) and real-time quantitative RT-PCR (Figure 3B). Unlike that of Pit1, the expression level of Pit2 mRNA was not changed in the TIDM and TIDMI groups (vs. Control, P > 0.05, Figure 3A-B). Similarly, PIT1 but not PIT2 protein levels in the kidney tissues of TIDM group mice were increased (vs. Control, P < 0.05, Figure 3C-D).
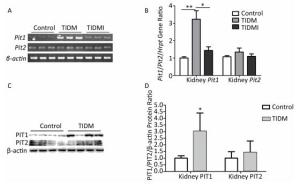
Figure 3. Pit1, Pit2, PIT1, and PIT2 expression levels in the kidneys of type Ⅰ diabetic mellitus (TIDM) mice. (A), Pit1 and Pit2 mRNA expression levels were analyzed by semi-quantitative RT-PCR. (B), Pit1 and Pit2 mRNA expression levels were analyzed by real-time quantitative RT-PCR. (C-D), PIT1 and PIT2 protein expression levels in the kidney were determined by Western blotting. The band intensity of the blot was normalized to β-actin and quantified with Image J software. Data represent means ± SD, n = 6. Control, normal mice; TIDM, diabetic mice induced by STZ; TIDMI, TIDM mice treated with insulin. *P < 0.05, **P < 0.01.
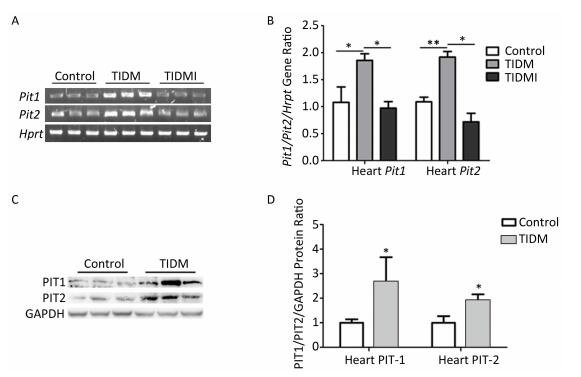
We next measured PIT1 and PIT2 expression in cardiac tissues. Compared with normal group mice, both Pit1 and Pit2 mRNA expression levels in the hearts of TIDM mice were increased, and this increase was reversed by insulin treatment in TIDMI mice, as shown by semi-quantitative RT-PCR and real-time quantitative RT-PCR (Figure 4A-B). Western blotting results further revealed that the PIT1 and PIT2 protein levels were increased in the hearts of TIDM mice (vs. Control, P < 0.01, Figure 4C-D). These results indicated that TIDM increased both PIT1 and PIT2 mRNA and protein expression levels in the hearts of mice.
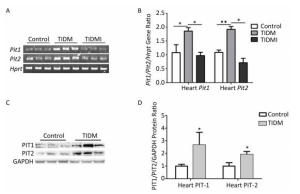
Figure 4. Pit1, Pit2, PIT1, and PIT2 expression levels in the hearts of type Ⅰ diabetic mellitus (TIDM) mice. (A) Pit1 and Pit2 mRNA expression levels were analyzed by semi-quantitative RT-PCR. (B) Pit1 and Pit2 mRNA expression levels were analyzed by real-time quantitative RT-PCR. (C-D) PIT1 and PIT2 protein expression levels in the hearts were determined by Western blotting. The band intensity of the blot was normalized to GAPDH and quantified with Image J software. Data represent means ± SD, n = 6. Control, normal mice; TIDM, diabetic mice induced by STZ; TIDMI, TIDM mice treated with insulin. *P < 0.05, **P < 0.01.
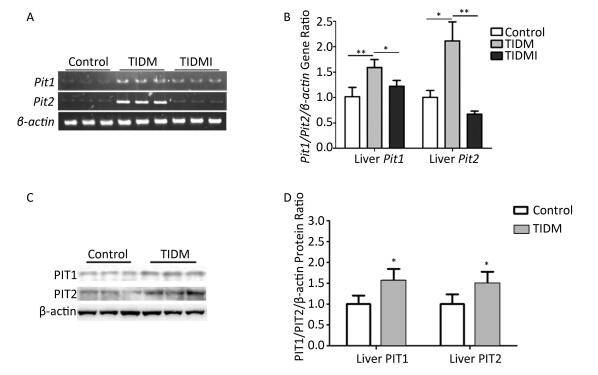
Finally, we evaluated both PIT1 and PIT2 expression in the liver. Consistent with the results from cardiac tissues, PIT1 and PIT2 expression levels were higher in TIDM livers than in normal ones, and Pit1 and Pit2 mRNA expression was down-regulated by insulin treatment in TIDMI mice (Figure 5). Collectively, PIT1 and PIT2 expression was up-regulated in TIDM mice, which might account for the increased arsenic uptake.
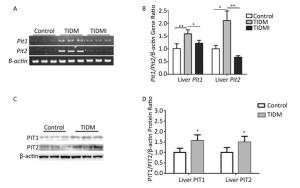
Figure 5. Pit1, Pit2, PIT1, and PIT2 expression levels in the livers of type Ⅰ diabetic mellitus (TIDM) mice. (A) Pit1 and Pit2 mRNA expression levels were analyzed by semi-quantitative RT-PCR. (B) Pit1 and Pit2 mRNA expression levels were analyzed by real-time quantitative RT-PCR. (C-D) PIT1 and PIT2 protein expression levels in the liver were determined by Western blotting. The band intensity of the blot was normalized to β-actin and quantified with Image J software. Data represent means ± SD, n = 6. Control, normal mice; TIDM, diabetic mice induced by STZ; TIDMI, TIDM mice treated with insulin. *P < 0.05, **P < 0.01.
Time-dependent of Changes in Arsenic Levels in Mouse Tissues after Arsenate Administration
Evaluation of STZ-Induced TIDM Mice
Increased Arsenic Concentration in TIDM Mouse Tissues
Increased Expression Levels of PIT1 and PIT2 in the Tissues of TIDM Mice, Reversed by Insulin Administration
-
In this study, it was found that STZ-induced TIDM mice were more susceptible to iAsⅤ uptake in various tissues than normal mice. The known efficient iAsⅤ transport systems include the type Ⅱ and Ⅲ sodium/phosphate cotransporters. Based on analysis of PIT1 and PIT2 expression and the effect of insulin on their modulations, the up-regulation of PIT1 and PIT2 in TIDM mice might contribute to the increased uptake of iAsⅤ in various tissues of these mice. To the best of our knowledge, this is an advanced report of increased iAsⅤ uptake in tissues of diabetes mellitus-afflicted animals. This indicates that higher expression of PIT1 and PIT2 may play an important role in increasing the transport of iAsⅤ into cells and tissues under diabetic conditions. Though the exact mechanism by which PIT1 and PIT1 expression is regulated in STZ-induced TIDM mice remains unclear, insulin deficiency has emerged as a potential mode of action. Insulin can regulate the expression of many genes that are involved in the control of metabolic processes associated with impaired glucose tolerance and diabetes[29]. In our results, insulin reversed the up-regulation of Pit1 and Pit2 in TIDM mouse tissues. Therefore, defects in insulin secretion could be at least partially associated with up-regulation of PIT1 and PIT2. Few studies of sodium/phosphate cotransporter expression induced by insulin in vitro have been published. Li et al. reported that the NaPi-II and Pit2 genes were not regulated by insulin in primary rat hepatocyte cultures[30]. However, insulin has been shown to stimulate Pit1 mRNA and protein expression modestly in medial artery vascular smooth muscle cells[31]. Our findings were contrary to these results and may be due to differences between in vivo and in vitro experiments, as well as experimental conditions. Our results suggest a possible mechanism by which increased arsenate uptake in STZ-induced diabetic mice was associated with PIT1 and PIT2 expression levels.
Arsenic is ubiquitous in the environment and highly toxic to all forms of the life. The arsenic metabolic cycle in mice and humans is short[32], and its chronic toxicity is not primarily based on an accumulating concentration but rather on the functional damage of target organs over time[33]. Diabetes is a common metabolic disease and might influence the susceptibility of many tissues to arsenic toxicity. One interesting study compared the levels of arsenic in mothers with insulin-dependent diabetes and their infants to those in mothers without diabetes and their infants. The researchers found that levels of arsenic in blood and scalp hair were significantly higher in the women with diabetes and their infants than in the women without diabetes and their infants[34]. Recently, different effects of iAs exposure in normal and diabetic individuals were found when mice were exposed to iAs for 16 weeks. It was shown that iAs exposure had a greater influence on the metabolic profiles of diabetic mice than on that of normal mice, including amino acid metabolism, lipid metabolism, carbohydrate metabolism, and energy metabolism, especially for oxidative stress-related metabolites and metabolism[35]. Our findings are consistent with these results, which all indicate that diabetes increases susceptibility to iAs.
In this study, we only investigated the expression of Pit1 and Pit2 in STZ-induced diabetic mice; other known and unknown genes associated with the uptake of arsenate have not yet been studied. Increased uptake of iAsV in the tissues of diabetic mice indicated that iAs exposure was associated with more severe damage in diabetic mice than in normal mice. Our results suggest that uptake of arsenate may be increased in diabetic patients and that arsenate may be more toxic to diabetic patients. This will be evaluated in future studies comparing differences in the uptake of arsenate between diabetic patients and normal individuals.
-
TIDM: type Ⅰ diabetes mellitus; STZ: streptozotocin; PIT1: Phosphate transporter 1, SLC20A1; PIT2: Phosphate transporter 2, SLC20A2.
-
None conflict of interest to declare.




 Quick Links
 DownLoad:
