


HTML
-
The complex environment in space, including microgravity, radiation, circadian rhythm, and extreme temperature, may injure human health during long-term space travel. Bone loss mainly induced by microgravity has been determined as one of the most harmful outcomes observed in astronauts[1]. Continuous bone loss may elevate the risk of developing fractures in the skeletal framework of astronauts during or after space missions[2-5]. Besides microgravity, space ionizing radiation such as the solar particle events (SPE), galactic cosmic radiation (GCR), and Earth's radiation belts (ERBs) which mainly consist of electrons, protons and heavy ions[6] expose the astronauts to high doses of radiation unavoidable not only in a space station but also in deep space exploration. Importantly, negative effects on trabecular bone induced by space radiation have been indicated in several studies[7-10]. Moreover, the light-dark cycles are highly variable on the flight deck and the sleep-wake cycle oscillating with periods less than 24 h is termed as ultradian[11-13]. The light-dark transition in the International Space Station occurs every 45 min which is a source of disturbance of circadian rhythms, leading to a degradation of the quality of astronauts' sleep and affect their metabolic activity[14, 15]. However, the effects of the ultradian rhythms on human skeletal tissues remain elusive.
Although bone loss associated with microgravity has been well characterized, the combined effects of microgravity, ionizing radiation exposure and ultradian rhythms on bone loss have not been reported. The hindlimb suspension (HLS) model, in which the hindlimbs of rodents are elevated to produce a 30° head-down tilt resulting in a cephalad fluid shift and avoiding weight-bearing by the hindquarters, has been widely used to simulate the mechanical unloading experienced in microgravity[16, 17]. Here, we used the HLS model followed by ionizing radiation exposure and ultradian rhythms to simulate the space environment to investigate the effects of a single factor or the combined factors on the skeletal system.
-
Eight-week-old Sprague Dawley (SD) rats were purchased from Gansu University of Chinese Medicine (Lanzhou, China) and acclimatized for one week under standard vivarium conditions. Fifty rats were randomly divided into 6 groups: (1) the baseline (BL) group (n = 6), rats were used to get the basal data on day 0 of the experiment; (2) the control (C) group (n = 8), rats were housed in a normal 12 h light/12 h dark cycle, which involved noise and light on at 7:00 am, and off at 7:00 pm; (3) the hindlimb suspension (H) group (n = 8), rats received hindlimb suspension with 30° head downward tilt and were housed in a normal 12 h light/12 h dark cycle; (4) the ionizing radiation (Ⅰ) group (n = 8), rats were subjected to 4 Gy of whole body X-ray exposure and housed in a normal 12 h light/12 h dark cycle; (5) the ultradian rhythms (U) group (n = 8), rats were housed in a 45 min light/45 min dark cycle; (6) the combined-three-factor (H+U+I) group (n = 12), the hindlimb suspension rats were kept in a 45 min light/45 min dark cycle and subjected to 4 Gy of whole body X-ray exposure. The rats were anesthetized with 10% chloral hydrate after four weeks. Whole blood was collected by abdominal aorta puncture and the hindlimb bones were isolated by surgery. All experimental procedures were approved by the Institutional Animal Care and Use Committee of Gansu University of Chinese Medicine.
-
Rats were subjected to hindlimb suspension described as the Morey-Holton method with a minor modification[16]. Briefly, the hindlimbs were suspended at 30° angle using a paper clip, adhesive tape and a metal tail harness. The tail harness was attached to a swivel buckle mounted on a guide wire running the length of the cage via a metal chain. Using this setup, rats were able to access all areas of the cage. The whole process was maintained for four weeks.
-
Rats were exposed to 4 Gy of X-rays generated by Faxitron RX-650 (Faxitron Bioptics, Lincolnshire, Lincolnshire, IL, USA) at 1 Gy every other day with 4 fractions. Other experimental groups were subjected to a sham radiation procedure.
-
Rats were housed in ultradian rhythms of 45 min light/45 min dark cycle for four weeks. During the period of light on, the rats were exposed to elevated ambient noise.
-
The femurs and tibias of hindlimbs were collected by surgery and the attached muscle was removed. The femurs were collected for the analysis of biomechanical testing and bone mineral density and were stored in 0.9% physiological saline at -20 ℃. The femurs and tibias for histological and micro-CT analysis were fixed in 70% ethanol and stored at 4℃.
-
The three-point bending tests were performed using the AG-IS10KN tensile testing machine (Shimadzu, Japan). The span between two load-supporting points was set to 15 mm. A load was added at 10 mm/min until the femur fractured. The load-deformation curves were simultaneously obtained during loading including the ultimate force and the elastic modulus.
-
A dual-energy X-ray absorptiometer (DEXA) (Prodigy, GE Healthcare, Madison, WI) equipped with enCORE software (GE Healthcare) for bone assessment in small-animal mode was used to measure the BMD of the femurs in vitro. The scan resolution was 1.0 mm × 1.0 mm and scan speed was 10 mm/s.
-
Undecalcified sections of tibias were cut at 10 μm thickness using a microtome (Leica SP 1600, Germany) and were stained with Van Gieson's staining (VG staining) for histological examination. Images were acquired from microscopes (Olympus, Japan) and analyzed by Image Pro-Plus (version 7.0, Media Cybernetics, Rockville, MD). The measured parameters included total tissue area, trabecular bone area and perimeter. The trabecular area, number, thickness, and separation were calculated by Ian Katz' method[18].
-
Skyscan 1, 176 high-resolution micro-CT (Bruker, Kontich, Institute of Orthopaedic at Soochow University, Suzhou, China) was used to analyze the metaphysis of femurs on 60 slices (1.08 mm total) including bone mineral density (BMD), trabecular volume fraction (BV/TV), trabecular thickness (Tb.Th), trabecular separation (Tb.Sp) and trabecular number (Tb.No). The three dimensional (3D) reconstructions were obtained by CT-analyser software (Bruker).
-
Blood from the abdominal aorta of rats was collected and allowed to clot for 30 min. Serum was separated via centrifugation at 1, 500 ×g for 10 min. Markers of bone turnover in the serum were measured using enzyme-linked immunosorbent assay (ELISA) kits including the bone alkaline phosphatase (bALP) (Neoscientific, USA), osteocalcin (OCN) (IDS, UK) and tartrate-resistant acid phosphatase-5b (TRAP-5b) (IDS, UK). All procedures were performed according to the manufacturers' protocols.
-
The significant differences (P value) between the means were tested using One-Way ANOVA in the SPSS statistical package (version 18.0, SPSS Inc., Chicago, IL, USA). P < 0.05 was considered statistically significant. All the values shown on the table and figures represent the means ± SEM.
Animals and Experimental Design
Hindlimb Suspension
Radiation Exposure
Ultradian Rhythms
Preparation of Bone Samples
Biomechanical Testing
Bone Mineral Density (BMD) Measurement
Histological Analysis
Micro-CT Analysis
Serum Analysis
Statistical Analysis
-
The average body weight of rats in all groups was comparable before the experiments and increased in all groups at sacrifice (Table 1). No significant difference was observed between the I, U, and C groups but the body weight of H and H+U+I group was significantly less than the C group (P < 0.01). However, no marked difference was observed between the two groups. In general, rats treated with simulated microgravity or combined-three factors exhibit significant impact on the body weight.
Group Weight before Experiments (g) Weight before Sacrifice (g) BL 194.40 ± 3.01 ₋ C 193.29 ± 4.07 230.57 ± 4.74 H 188.00 ± 3.97 206.29 ± 5.32** U 199.29 ± 4.18 234.80 ± 8.34 I 193.94 ± 3.90 228.29 ± 7.11 H+U+I 190.60 ± 2.90 200.89 ± 2.94** Note. Rats in all groups were weighed on day 0 of the experiment and day 28 before sacrifice. BL: baseline group; C: control group; H: hindlimb suspension group; U: ultradian rhythms group; I: ionizing radiation group; H+U+I: hindlimb suspension + ultradian rhythms + ionizing radiation group. Values represent the means ± SEM. **P < 0.01, compared to the control group. Table 1. Changes in Body Weight of Different Groups
-
The biomechanical properties of the femurs from hindlimbs were tested by a tensile testing machine in a 3-point bending way. The elastic modulus (Figure 1A) of the H, U, and H+U+I group was significantly lower than that of the C group (P < 0.01). The elastic modulus of the U group was also significantly lower than that of the C group (P < 0.05). No significant difference was observed between the I and C group. The ultimate force (Figure 1B) of the H group and the H+U+I group was significantly lower than that of the C group (P < 0.01). We observed no significant differences between the I or U group when compared to the C group. These results indicate that the biomechanical properties of the femurs from rats treated with simulated microgravity or the combined factors are effectively decreased.
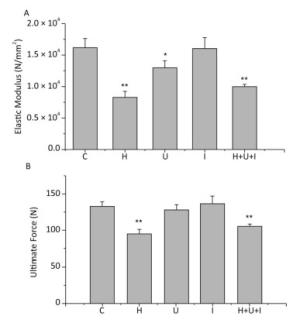
Figure 1. Comparison of biomechanical testing in femurs between the control group (C) and hindlimb suspension group (H), ultradian rhythms group (U), ionizing radiation group (Ⅰ), hindlimb suspension + ultradian rhythms + ionizing radiation group (H+U+I). A. The elastic modulus; B. The ultimate force. Values represent the means ± SEM. *P < 0.05, **P < 0.01, compared to the control group.
-
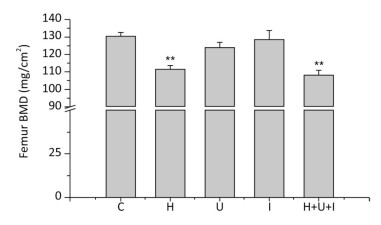
The BMD of the femurs were analyzed by the DEXA (Figure 2). We found that BMD of H group and H+U+I group was much lower than that of the C group (P < 0.01) while the I group or the U group showed no significant differences when compared to the C group. These results suggest that the bone mineral density is effectively decreased in animals treated with simulated microgravity or combined-three factors.

Figure 2. Changes of femur BMD measured by dual-energy X-ray absorptiometer (DEXA). C: control group. H: hindlimb suspension group. U: ultradian rhythms group. I: ionizing radiation group. H+U+I: hindlimb suspension + ultradian rhythms + ionizing radiation group. Values represent the means ± SEM. **P < 0.01, compared to the control group.
-
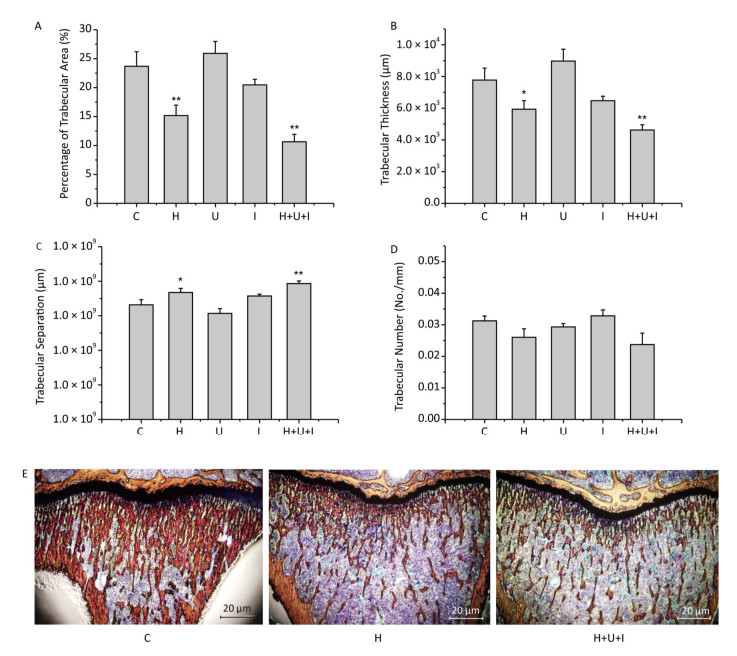
Histological analysis of the cancellous bone proximal of the tibial metaphysis revealed that the percentage of trabecular area (Figure 3A) of the H group and H+U+I group was significantly decreased when compared to the C group (P < 0.01), and no significant difference was observed when compared to each others. Similarly, the trabecular thickness (Figure 3B) of the H group or the H+U+I group was significantly decreased in comparison to the C group (P < 0.01), and the H group and the H+U+I group did not show significant differences. However, the trabecular separation (Figure 3C) was significantly higher in the H (P < 0.05) and the H+U+I group (P < 0.01) when compared to the C group. No significant difference was observed between the H group and the H+U+I group. The trabecular number (Figure 3D) in all experimental groups showed no significant differences in comparison to the C group. The histological results (Figure 3E) revealed that simulated microgravity or combined factors significantly deteriorated the tibial trabecular parameters.
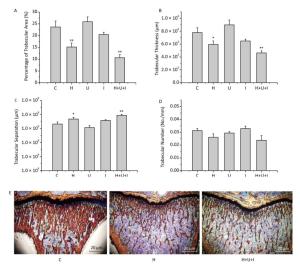
Figure 3. Histological analysis of cancellous bone proximal of the tibial metaphysis. (A) Percentage of trabecular area; (B) Trabecular thickness; (C) Trabecular separation; (D) Trabecular number; (E) The representative pictures of the histological sections stained by Van Gieson's staining. Values represent the means ± SEM. *P < 0.05, **P < 0.01, compared to the control group.
-
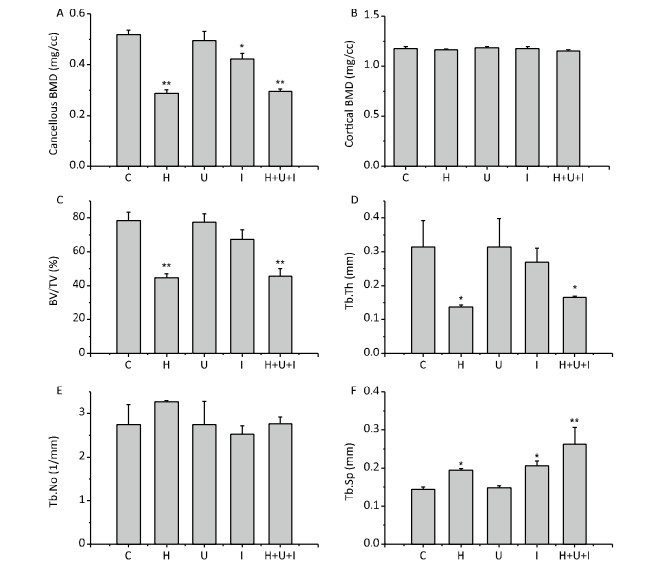
Micro-CT analysis of the femurs from hindlimbs indicated that the cancellous BMD (Figure 4A) was significantly decreased in the H group, I group, and H+U+I group compared to the control (P < 0.01, P < 0.05 and P < 0.01, respectively), while no difference was found in the cortical BMD (Figure 4B) between the control group and the treatment groups. Similarly to cancellous BMD results, trabecular volume fraction (BV/TV, Figure 4C) and trabecular thickness (Tb.Th, Figure 4D) in the H group and the H+U+I group (P < 0.01) were significantly lower than that in C group. However, no significant difference was found in the trabecular number (Tb.No, Figure 4E) among all experimental groups. In addition, we found that the ionizing radiation, hindlimb suspension, and combined-three factors increased the trabecular separation (Tb.Sp, Figure 4F) when compared to the control. The three-dimensional (3D) reconstruction of the trabecular bone (Figure 5) showed a similar tendency as the trabecular parameters, confirmingthat simulated microgravity and combined factors have deteriorating effects on the trabecula of the femurs. Taken together, the effects of simulated microgravity and combined factors on bone loss are significantly observed in the trabecular parameters.
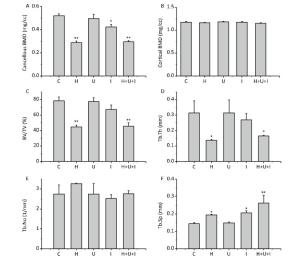
Figure 4. Trabecular parameters of the distal femurs measured by micro-CT. (A) Cancellous bone mineral density (mg/cc); (B) Cortical bone mineral density (mg/cc); (C) Trabecular volume fraction (BV/TV); (D)Trabecular thickness (Tb.Th); (E) Trabecular number (Tb.No); (F) Trabecular separation (Tb.Sp). Values represent the means ± SEM. *P < 0.05, **P < 0.01, compared to the control group.
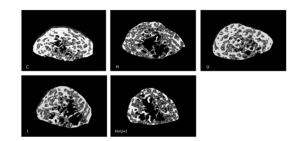
Figure 5. The three-dimensional trabecular architecture of the interest region (located under the epiphysis plate 2.88 mm of the femur). C: control group. H: hindlimb suspension group. U: ultradian rhythms group. I: ionizing radiation group. H+U+I: hindlimb suspension + ultradian rhythms + ionizing radiation group.
-
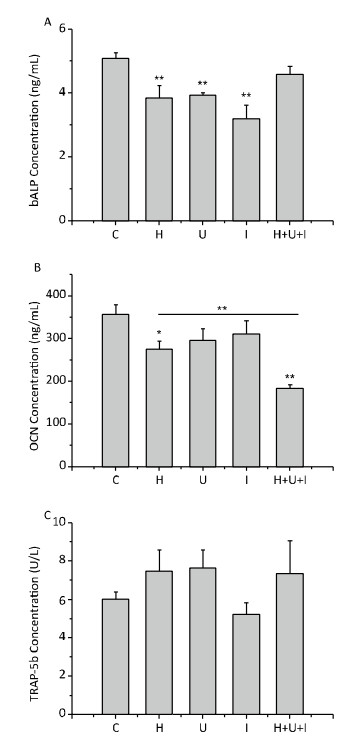
Next, we measured the levels of bone turnover markers in the serum by ELISA. As shown in Figure 6, the concentration of bALP (Figure 6A), an early bone formation marker, was significantly decreased in the H group, U group and I group compared to the C group (P < 0.01). There was no significant difference between the H+U+I and the C group. The concentration of OCN (Figure 6B), a late marker of bone formation, was significantly reduced in the H group (P < 0.05) and the H+U+I group (P < 0.01) when compared to the C group, and the concentration of OCN in the H+U+I group was the lowest among all experimental groups. On the other hand, the concentration of TRAP-5b (Figure 6C), a bone resorption marker, was slightly increased in the H group, U group, and H+U+I group, but no significant difference was observed among the experimental groups. Taken together, simulated microgravity and combined factors induce bone loss mainly through the suppression of bone formation.
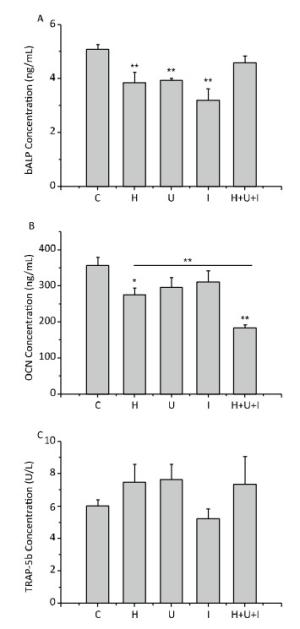
Figure 6. Changes in bone turnover markers in serum. (A) Concentration of bone alkaline phosphatase (bALP, ng/mL); (B) osteocalcin (OCN, ng/mL); (C) tartrate-resistant acid phosphatase-5b (TRAP-5b, U/L). Values represent the means ± SEM. *P < 0.05, **P < 0.01, compared to the control group.
Simulated Microgravity and Combined Factors Reduce the Body Weight of Rats
Simulated Microgravity and Combined Factors Decrease the Biomechanical Properties of Femurs
Simulated Microgravity and Combined Factors Impair the Bone Mineral Density of Femurs
Simulated Microgravity and Combined Factors Deteriorate the Trabecular Parameters of Tibias
Simulated Microgravity and Combined Factors Deteriorate the Trabecular Parameters of Femurs
Simulated Microgravity and Combine Factors Change bALP, OCN, and TRAP-5b Concentrations in Serum
-
Skeletal deterioration has been documented in astronauts who may be at a higher risk of fracture during or after extended space missions[19-22]. To better understand the mechanisms of bone loss in space environment, we simulated microgravity by hindlimb suspension model, ionizing radiation by X-ray exposure and circadian rhythm dysregulation by ultradian rhythms to investigate the effects of a single or combined factors on the skeletal system in a rodent model.
The biomechanical properties of the femurs from hindlimbs revealed that the elastic modulus and the ultimate force were significantly decreased in the H group and H+U+I group compared to the control animals, but no significant difference was observed between the two interventions, suggesting that there was no additive effect of the three interventions when combined together. Bone density and quality have been cited as primary contributors to bone strength[23]. Accordingly, we measured the BMD by DEXA. It was found that the BMD of the H group and the H+U+I group was significantly lower than that of the C group while no significant difference was observed between the two interventions. The mechanical competence of bone depends on two factors: quality and quantity[24]. Our findings also indicate that the hindlimb suspension and the combined-three-factors treatment led to a decrease in trabecular quality (Figures 3-5). All these results suggest that simulated microgravity is the main factor to reduce bone loss and combined factors can not significantly exacerbate bone loss.
The risk of bone loss would be underestimated if a diagnosis of osteoporosis were made by only considering BMD. Therefore, more indices are necessary for further evaluation. We performed histological analysis to show that the significant changes in trabecular parameters were induced by hindlimb suspension, and combined factors did not aggravate these changes. Micro-CT was used to further analyze the subtle structural changes in trabecular parameters. In terms of bone loss, cortical bone loss always occurs after cancellous bone. In our study, the BMD of cortical bone was found unchanged in all groups (Figure 4B).
Bandstra et al. demonstrated that mice exposed to 2 Gy of proton radiation had significant deleterious effect on trabecular bone[8]. Other reports disclosed that γ-ray or a low-dose rate of high LET proton radiation also accelerated bone loss[25-27], indicating that bone loss induced by ionizing radiation may depend on the dose and type of radiation. Our results revealed that 4 Gy of X-rays exposure resulted in a decrease of BMD in I group (18%) while the reduction of BMD in the H group (44%) was very remarkable and that in the H+U+I group (43%) did not show a promotion compared to the H group. The results of trabecular parameters trabecular bone volume fraction (BV/TV), trebecular thickness (Tb.Th), trabecular separation (Tb.Sp) and 3D reconstruction showed similar obvious changes in the H or H+U+I group when compared with the C group. Lack of an additive effect of X-ray exposure and hindlimb suspension on bone loss may be due to the saturation of some key biochemical pathways.
Disruption of circadian rhythm has been demonstrated to have multiple adverse effects on the brain and body, particularly in the development of hormone secretion disorder and cardiovascular diseases[28]. In the present study, we assessed the effect of ultradian rhythms on bone metabolism in rats treated with normal gravity or simulated microgravity. The biomechanical properties and BMD of the femur showed a decreasing trend in the U group compared to the C group. However, the differences were not statistically significant. One of the reasons may be the small sample size in the study compared to other animal models[29, 30]. Furthermore, the rats were treated for four weeks in our experiments, which might be not long enough to induce disorders of bone metabolism in rats. Hence, an expanded sample size and an extended exposure time are needed in further research.
Bone maintains its structural and functional integrity via continuous remodeling activity, characterized by a dynamic balance between bone formation and bone resorption[31]. In the present study, bone turnover markers in serum were measured. bALP is present on the surface of osteoblasts and promotes extracellular mineralization via release of inorganic phosphate from mineralization inhibitor inorganic pyrophosphate[32-34]. Thus bALP concentration is an index used to reveal bone formation and reflects osteoblast activity. We found that bALP concentration was significantly decreased in the H, U and I groups but not in the H+U+I group. This may be related to a feedback regulation caused by the combined factors which was congruent with previous studies in which early serum bALP activity showed a decreasing trend but returned to normal after the third week of tail suspension[35, 36]. The OCN is often used as a late marker for bone formation involved in bone mineralization and bone turnover[37, 38]. Knockdown of OCN downregulated RUNX2 and osteoblast-related genes[38]. Hindlimb suspension induced resistance to insulin-like growth factor-I (IGF-I), which decreased osteoblast proliferation[39]. We found that the OCN concentration was significantly reduced in the H or H+U+I group. Nevertheless, the underlying molecular mechanism of bone metabolism and its effect on bone loss requires further investigation. TRAP-5b is commonly used as a reference of osteoclast activity[40, 41]. The concentration of TRAP-5b was slightly increased in the H, U, and H+U+I groups (but not significant compared to the C group), suggesting that bone absorption was a relative minor pathological cause to induce bone loss in our experiments.
In conclusion, our data demonstrate that microgravity in space is the key factor in causing bone loss and radiation also results in deleterious effects on bone. However, ultradian rhythms have no significant effect on bone. Although the combined factors result in significant decrease on bone parameters, it shows no difference when compared to simulated microgravity treatment alone. Thus, microgravity is a major factor promoting bone loss and combined factors cannot significantly exacerbate bone loss. This study is the first report on bone loss induced by combined three factors, which may be helpful in understanding bone loss mechanisms in the real space environment and aids in the development of effective countermeasures against bone loss of astronauts and space travelers during long-term space travel.
-
LEI SW and HE JP designed this study. ZHANG YN, SHI WG, LI H, FENG X, WEI WJ, and HUA JR performed the experiments and analyzed the data. ZHANG YN and WANG JF wrote the manuscript.
-
No conflict of interest to declare.
the Science and Technology Research Project of Gansu Province 145RTSA012
the Science and Technology Research Project of Gansu Province 17JR5RA307
the International Science & Technology Cooperation Program of China 2015DFR30940

 Quick Links
 DownLoad: