


HTML
-
Mammography has been recognized internationally as a primary choice for screening of breast cancer. However, since the female breast is one of the most radiosensitive organs, mammography exposure would increase the risk of radiation-induced cancers. Average glandular dose (AGD) is the relevant quantity used to estimate patient dose in mammography and is believed to be the most reasonable dose descriptor related to the risk of breast cancer induced by ionizing radiation. Survey on AGD level with regards to the population can offer a fundamental data support when the cost-interest analysis on mammography is performed. Thus, in the present study, more attention was given to the estimation method of AGD[1] and distribution of the AGD level[2]. Although the AGD cannot be measured directly, it can be obtained by multiplying the incident air kerma at the upper surface of the breast by a series of conversion coefficient factors which were calculated by Monte Carlo methods[1, 3-5].
The most commonly used method to calculate the AGD uses the series conversion factors reported by Dance et al.[3-5], using a Monte Carlo program with a simplified model based on European female breast parameters. However, the use of Dance's conversion factors to estimate the AGD in Chinese women could have a bias due to anatomy difference in the breasts of Western and Asian women. Thus, to better characterize the Chinese female breast, a series of conversion coefficient factors have been introduced by Wang[6], based on a three-dimensional detailed breast model with Chinese female breast parameters. The Wang's model for present study has the following advantages: (1) The model is based on Chinese women's breast anatomy parameters; (2) It has a 3D detailed structure which is close to a real woman breast; (3) The model of compressed breast is combined with the CRAF (Chinese reference adult female voxel model) to provide backscatter from the female body, which simulates the real mammography scenario.
The present research investigated 1, 828 mammography exposure procedures using 8 mammography machines from 3 different manufacturersin China, and the AGD values were calculated using Wang's conversion factors. The study results could be used to evaluate and potentially improvepatient dosage, reducing the risks originating from mammography procedures in China.
-
Thirteen prefecture-level cities in Jiangsu province were divided into 3 groups according to the economic status, with each prefecture-level city being sampled in each group by a random sampling method. Two (Suzhou city) to three hospitals (Nanjing and Xuzhou city) were sampled in the sample city by a random table sampling method. Mammography equipment in the sample hospitals were selected as the sample equipment. The details of the equipment are displayed in Table 1. Each hospital randomly gathered exposure information of at least 50 patients who had a mammography examination between July 2016 and December 2016. The mean age of sampled patients was 46.31 ± 9.5 years.
Model Manufacturer Detector Type Sample Size Senographe DS GE DR 328 Senographe GE DR 160 Senographe 2000D GE DR 391 Selenia Dimension Hologic DR 206 Selenia Hologic DR 256 Selenia Hologic DR 191 Selenia Hologic DR 198 IMS Giotto DR 139 Total 1, 828 Note. DR, digital radiography. Table 1. Model, Manufacturer, Types, and Sample Size of the Mammography Equipment
Table 1 presents details of the mammography equipment used in the study with corresponding sample sizes.
-
A total of 1, 828 mammography exposure parameters were investigated in the present study. Forms containing patient information [compressed breast thickness (CBT)] and mammography parameters (including tube voltage, tube load, and target/filter) were filled in by the technologists, who performed the mammography exposures. The CBT was provided by the scale of the mammography equipment and was confirmed with a ruler.
Forty-six exposures were excluded because of the target/filter combination (W/Ag) and were not tabulated in Wang's paper.
-
K at 40 mAs and half value layer (HVL) data were obtained with a Quality-Assurance (QA) radio-dosimeter (model: Raysafe X2; Fluke Corporation, US) after the investigation forms were returned from the sample hospitals. The QA radio-dosimeter was calibrated at the Jiangsu Institute of Metrology. The measurements were carried out between January 2016 and March 2016. Equipment was adjusted to make exposures with tube load of 40 mAs and tube voltage from 25 kV to 35 kV for every target/filter combination, and the K of each exposure was recorded. The detector of the radio-dosimeter was located on the surface of the breast table, and measurements were corrected according to the inverse-square law for each individual breast thickness.
-
K (incident air kerma, K) of each exposure were calculated by using,
$$ K = {K_{40}} \cdot \frac{{{T_{{\rm{mAs}}}}}}{{40}} $$ (1) where K40 is the incident air kerma with a tube load of 40 mAs as measured by the QA dosimeters, and TmAs is the tube load of each exposure (unit: mAs).
Further, AGD was calculated by using,
$$ AGD = K \times Dg{N^{[6]}} $$ (2) where K is the incident air kerma at the upper surface of the breast of each exposure, and the DgN is the K to AGD conversion coefficients (glandularity: 50%) calculated using the Monte Carlo simulation in Wang's manuscripts[6].
The conversion coefficients are displayed in Table 2.
Target/Filter HVL (mm Al) CBT (cm) 3 4 5 6 Mo/Mo 0.349 0.271 0.194 0.143 0.108 0.383 0.282 0.210 0.153 0.118 0.407 0.303 0.218 0.172 0.130 0.431 0.304 0.231 0.176 0.137 0.448 0.330 0.246 0.183 0.145 Mo/Rh 0.409 0.301 0.224 0.164 0.128 0.453 0.318 0.239 0.190 0.149 0.462 0.330 0.247 0.193 0.146 0.483 0.346 0.258 0.204 0.157 0.498 0.351 0.265 0.209 0.162 Rh/Rh 0.398 0.295 0.214 0.163 0.129 0.459 0.334 0.249 0.196 0.160 0.490 0.346 0.265 0.214 0.171 0.517 0.367 0.280 0.219 0.182 0.567 0.376 0.297 0.249 0.198 W/Rh 0.527 0.344 0.266 0.214 0.167 0.556 0.359 0.289 0.241 0.188 0.566 0.378 0.301 0.249 0.197 0.584 0.394 0.313 0.259 0.199 0.619 0.440 0.335 0.271 0.217 Note. HVC, half value layer; CBT, compressed breast thickness; Mo, Molybdenum; Rh, Rhodium; W, wolfram. Table 2. Dose Conversion Coefficients (50% glandularity) for Four Different Spectra (mGy/mGy)
If the CBT is out of range in Wang's table, the closest CBT conversion factor was selected to calculate the AGD. This had to be done in 214 instances.
-
A student's t-test was applied to compare the difference between the groups comprising the two view types. A paired t-test was applied to compare the AGD level of Dance's method and the present study. ANOVA was applied to compare the difference between the three manufacturer groups and four target/filter groups.
Sampling Design
Exposure Data
Measurement of the K (incident air kerma)
Calculation of the AGD
Statistical Analysis
-
The CBT of the patient population varied from 1.5 cm to 8.6 cm. The mean thickness was 4.6 cm with a standard deviation of 1.2 cm. The distribution of the CBT fitted the normal distribution with kurtosis of -0.501 and skewness of 0.064. The mean value of AGD was 1.3 mGy with a standard deviation of 0.6 mGy. The median of the AGD was 1.1 mGy. The descriptive statistics of the patient information and technical parameters were displayed in Table 3.
Information and Parameters Median 25% Values 75% Values Mean ± SD Range CBT (cm) 4.6 3.8 5.5 4.6 ± 1.2 1.5-8.6 Tube (kV) 29.0 28.0 30.0 28.9 ± 1.8 25.0-33.0 Load (mAs) 63.7 47.9 108.0 80.8 ± 44.7 17.0-290.0 K (mGy) 5.5 4.2 7.7 6.4 ± 3.4 1.4-24.3 AGD (mGy) 1.1 0.9 1.5 1.3 ± 0.6 0.4-4.7 Table 3. Descriptive Statistics of the Patient Information and Technical Parameters of the Sample Mammographic Procedure
-
The AGD level and the CBT level of the CC (craniocaudal) view group and the MLO (medio-lateral oblique) view group were analyzed. The CBT level of the MLO group was 5.6% higher than that of the CC group, with a significant difference at 0.05 level (two-tailed). Furthermore, the AGD shared a similar trend, i.e., MLO group was approximately 5.0% higher than the mean value of the CC group, with a significant statistical difference. The results of the statistical analysis of these two groups are tabulated in Table 4.
View Types CBT (cm) AGD (mGy) Mean Median ± SD N Mean Median ± SD N CC 4.52* 4.5 ± 1.17 937 1.27* 1.10 ± 0.54 937 MLO 4.78 4.8 ± 1.22 891 1.33 1.19 ± 0.31 891 Note. *t test two tailed P < 0.05. CBT, compressed breast thickness; AGD, average glandular dose; CC, craniocaudal; MLO, medio-lateral oblique. Table 4. The Statistics of AGD and CBT Level of Two View Types
-
To observe the relationship of CBT with the AGD level, the sample was divided into 14 groups according to the CBT level. Figure 1 shows the trend of AGD changes with the increase in CBT.
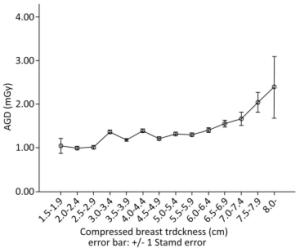
Figure 1. AGD against CBT for 1, 828 mammographic procedure. The error bars correspond to ± 1 standard error on the mean. AGD, average glandular dose.
-
The AGD value distribution of the three manufacturer groups and the analysis results grouped by target/filter combination are listed in Table 5.
Manufacturer Target/Filter Combination AGD (mGy) Mean SD N GE Mo/Mo 1.36* 0.51 41 Mo/Rh 1.05 0.30 155 Rh/Rh 1.05 0.31 683 Total 1.07* 0.33 879 Giotto Mo/Mo 1.25 0.49 139 Total 1.25* 0.49 139 Hologic Mo/Mo 1.94* 0.44 187 Mo/Rh 1.06* 0.31 260 W/Rh 1.72* 0.67 363 Total 1.56* 0.63 810 - Total 1.30 0.55 1, 828 Note. *Significant difference with other two categories P < 0.05. AGD, average glandular dose. Table 5. The Statistical Results of the AGD in Target/Filter Combination Groups Sorted by Manufacturer
Analysis of Variance (ANOVA) was used to analyze the differences between the three manufacturer groups, and the results indicated that there were significant statistical differences between the three model groups (P < 0.05). The result of the multiple comparison of the least significant difference (LSD) test indicated that the mean value of AGD was significantly different among all the groups.
ANOVA and the Scheffe multiple comparison test were used to analyze the differences between the three manufacturers in the Mo/Mo group, and the results indicated that there were significant statistical differences between Hologic and other two categories (P < 0.05). A two-sample t-test was used to analyze the difference between the two manufacturer categories in Mo/Rh group, and the results indicated that there was no significant statistical difference between the GE and Hologic category (P < 0.05).
-
The statistical distribution of AGD values by four target/filter combinations in the sample is listed in Table 6.
Target/Filter Combination Manufacturer AGD (mGy) Mean SD N Mo/Mo GE 1.36 0.51 41 Giotto 1.25 0.49 139 Hologic 1.94* 0.44 187 Total 1.61* 0.57 367 Mo/Rh GE 1.05 0.30 155 Hologic 1.06 0.31 260 Total 1.05 0.31 415 Rh/Rh GE 1.05 0.31 683 Total 1.05 0.31 683 W/Rh Hologic 1.72 0.67 363 Total 1.72* 0.67 363 - Total 1.30 0.55 1, 828 Note. *Significant difference with other categories P < 0.05. AGD, average glandular dose; Mo, molybdenum; Rh, rhodium; W, wolfram. Table 6. The Statistical Results of the AGD in Manufacturer Groups Sorted by Target/Filter Combination
ANOVA was used to analyze the difference between four target/filter combination groups, and the results indicated that a significant statistical difference among the four groups (P < 0.05). The result of the multiple comparison of the LSD test indicated that the mean value of AGD had a significant difference among all the groups, except for the Mo/Rh and Rh/Rh group.
ANOVA and the multiple comparison of Scheffe test were used to analyze the difference between three target/filter combination categories in the GE group, and the results indicated that there was a significant statistical difference between Mo/Mo categories and the other two categories (P < 0.05). ANOVA and multiple comparison of Scheffe test were used to analyze the difference between the three target/filter combination categories in the Hologic group, and the results indicated that there was a significant statistical difference between the three categories (P < 0.05).
-
To compare the difference between the two Monte Carlo methods, a paired t-test was performed, and the results showed that the mean value of AGD calculated by the Wang's conversion factors was lower than that of the Dance's method, with significant statistical difference. The results were displayed in Table 7.
Methods Mean ± SD Median N Wang 1.30* ± 0.55 1.13 1, 828 Dance 1.65 ± 0.68 1.46 1, 828 Note. *Paired t test two tailed P < 0.05. Table 7. The Calculation Results by Using Wang's and Dance's Conversion Coefficients (mGy)
The Statistical Distribution of the CBT and the AGD
The Relationships of AGD Level with the Types of View
The Relationships of AGD Level with CBT
AGD Values for the Three Manufacturer Groups
AGD in Different Target/Filter Combination Groups
Comparisons with Dance's Method
-
The estimation of the absorbed dose to the glandular tissue of the breast during mammography procedures is a long-established part of the quality control procedure and is also necessary for risk evaluation. The relatively high sensitivity of glandular tissue in women's breasts has made many studies to focus on breast dosimetry during the mammography procedures[2, 7, 8].
A small scale investigation in China[9] reported that the mean value of CBT and AGD is 4.2 ± 1.12 cm and 1.66 ± 0.8 mGy, respectively, based on the Dance's model in 2014, and the results were close enough to the present study.
There is a volume of literature on breast dose values assessed from patient surveys[7, 10-14]. A survey in Japan by Matsunaga Y[11] et al. showed a CBT of 4.2 cm and an AGD of 1.66 mGy. An investigation on 13 mammography sets in Portugal by Sa, Dos Reis C et al.[12] showed the mean value of AGD as 1.54 mGy and 1.68 mGy in CC and MLO views, respectively. The results showed similar AGD and CBT values as those in the present study to corresponding values using the Dance's conversion factors. Table 8 shows the results of these studies.
Author of the Study AGD (mGy) CBT (cm) Oduko JM[7] 1.46 ± 0.02 5.59 ± 0.05 Tsapaki V[10] 1.4 ± 0.6 4.2 ± 1.4 Matsunaga Y[11] 1.66 / Sa DRC[12] 1.54 (CC) 1.68 (MLO) / Asada Y[13] 1.58 / Present study 1.65 ± 0.68 4.6 ± 1.2 Note. AGD were called MGD in some research. AGD, average glandular dose; CBT, compressed breast thickness; CC, craniocaudal; MLO, medio-lateral oblique. Table 8. AGD Results in Several Studies
The frequency distributions of the CBT in the present study show the typical character of the CBT distribution for the CC and MLO views. The distribution of CBT in both the views shows a normal distribution, with the peak of the MLO to the right of the CC view, indicating that the breast compressed for the MLO view tends to be thicker than when compressed for the CC view[2]. The mean value of the CBT in the two groups showed a 5% difference, which is a little lower than that of the last investigation[9]; while, the results of the two-tailed t-test indicated a significant statistical difference.
Like most other studies on patient dose in mammography, the results of the present study show a trend of increase in AGD with increase in CBT. This can be justified by the fact that a thicker breast may need increasing the tube load of the exposure, leading to a higher incident air kerma in a mammography exposure in AEC mode, which is widely used in clinical situations.
Significant statistical differences were found between different manufacturer groups. However, it could be a confusion bias caused by CBT and target/filter combination differences. Statistical results of the AGD listed in Table 4 appear to better illustrate the differences between the manufacturers. The mean AGD values of the three manufacturers were below the Guidance Level (3 mGy). Nonetheless, the results did not aid in evaluating the quality of the equipment.
Little research is found on the AGD values between different target/filter combinations. Biegala et al. in their study[15] on AGDs, with 3 different target/filter combinations and a Siemens Mammomat Novation mammography set in 2015, demonstrated results of AGD in Mo/Mo and Mo/Rh groups to be higher than those of the W/Rh group, which is dissimilar to the results of the present study, where AGD of Mo/Mo and W/Rh was greater than the Mo/Rh and Rh/Rh group. Detailed information of AGD is listed in Table 6. The Mo/Mo category had the highest AGD in all the manufacturer groups, while Mo/Rh combinations had a relatively low AGD level. The difference in the present study compared to the Biegala's study is the AGD level of the W/Rh group. The results showed that the average output (mAs) was much larger than that of the Mo/Rh group, which caused a higher K, and this in turn caused an increase in the AGD level. Mammography units in the sample were Hologic, which was different from the Siemens equipment in Biegala's research, and this could be a justification for the difference. Furthermore, both Hologic mammography units in the present study did not have multiple target/filter combination of W/Rh, Mo/Mo, and Mo/Rh, as did the Siemens mammography equipment in Biegala's research. Additionally, although some factors which would affect the AGD level were discussed in the present study, the results of the present study should be considerable on a population perspective.
As an essential tool, conversion factors based on Monte-Carlo breast models are widely used for the patient dose evaluation in mammography exposure procedures. In recent years, different and detailed breast models have been made for these purposes. However, there is no such research for Chinese females, and due to the differences between the Western and Chinese females, there could have been a bias in the dose estimation. The parameters of the model used in the present study were determined from the Chinese female data, such as glandularity and the thickness of the skin and subcutaneous fat, and this detailed breast model could better represent the characteristics of a Chinese woman's breast than did the models based on western women's breast anatomic character.
The results of the present study could establish important reference values for diagnostic reference levels (DRL) for Chinese mammography. However, there are some limitations of the present research caused by the limitations of the Wang's model and conversion factors: (1) The coverage of the CBT range is from 3 cm to 6 cm, which is not wide enough for the largest breast sizes, and this caused the use of the closest factors to calculate the AGD in some instances. (2) The conversion factors are only for four target/filter combinations, which are Mo/Mo, Mo/Rh, Rh/Rh, and W/Rh. Some unusual target/filter combinations may not utilize these factors to estimate the patient dose in mammography, and that caused 46 exposures being excluded for this reason. (3) Wang's model does not consider the effect of age and CBT to glandularity and then to the AGD level, while Dance used a c-factor to minimize this kind of effect.
Future considerations for the present work should be: (1) Expand the range of the sample to give a reliable support to the establishment of the DRL; (2) A survey on the mammography frequency and an evaluation of the dose burden to the population, with the risk of radiation induced cancer by mammography.
Furthermore, to estimate the possible impact of the 214 instances, which used the closest conversion coefficients for some breasts out of the CBT coverage of the Wang's factors, 4 curves were fitted to estimate the conversion factors in 7 cm. And the estimated 7 cm conversion factors were 84%, 87%, 85%, and 92% below the 6 cm factors in Mo/Mo. Mo/Rh, Rh/Rh, and W/Rh combinations, respectively. This indicated about 15% under-estimation of the AGD in these 214 instances, and it would lead to about 1.8% under-estimation of the AGD in the present study.
-
Mean AGD and CBT levels in our study for mammography practice in China are 1.3 mGy (by using Wang's model) and 4.2 cm, respectively. The AGD and CBT in MLO group are higher than that in the CC group, with a significant statistical difference. There is a significant difference in AGD between manufacturer groups and target filter groups. And lastly, using Wang's conversion factors in estimating the breast dose would lead to a 20% difference as that with a Dance model.
Jiangsu Province's Key Medical Discipline of Epidemiology ZDXK A 2016008
the Jiangsu Province's Outstanding Medical Academic Leader Program CXTDA2017029
Science and education strong industry engineering youth talent project JKRC2016014
Jiangsu Provincial preventive medicine research project Y2018082

 Quick Links
 DownLoad: