


HTML
-
Various circulating markers of liver function have been shown to be associated with cardiovascular risk[1]. For instance, epidemiological studies have indicated that circulating alkaline phosphatase (ALP), an important enzyme primarily present in the liver and bone[2], is positively correlated with increased risk of cardiovascular events and mortality in patients with chronic kidney disease, as well as in the general population[3-5]. Elevated ALP is an independent prognostic factor for long-term functional outcomes after acute cerebral infarction[6]. Serum ALP is also a predictor of mortality, myocardial infarction, and stent thrombosis in patients with drug-eluting stents[7].
Carotid intima media thickness (IMT) is a valid and reproducible modality to assess subclinical carotid atherosclerosis in clinical practice. Extensive evidence has indicated that IMT is a marker of atherosclerosis and could be used to predict future adverse cardiovascular events[8-11]. However, a meta-analysis of 11 population-based studies found that carotid plaque had a significantly higher diagnostic accuracy than IMT for predicting future myocardial infarction[12]. Thus, a combination of carotid plaque detection and IMT measurement could be a more accurate diagnostic tool than either of the measurements alone to screen for coronary artery disease[13]. According to the European guidelines for preventing cardiovascular diseases, both increased IMT and carotid plaque can cause vascular organ damage[14, 15]. While the relationship between ALP and IMT has been investigated, the findings remain inconclusive[16-18]. As these previous studies included specific populations, such as children with end-stage renal disease or African men with hypertension, their findings cannot be generalized.
This cross-sectional study aimed to determine the relationship between serum ALP levels and carotid atherosclerosis, including carotid IMT, carotid plaque, and extracranial carotid artery stenosis (ECAS), in a community-based general population.
-
This prospective cohort study was conducted in Jidong community, located in Tangshan, Hebei Province, China. This community primarily comprises employees who work at Jidong Oilfield Industry, and their families[19]. All residents aged over 18 years from this community were invited to participate in this cohort study. The response rate was 90.4% (9, 078/10, 043).
This cross-sectional study used baseline data obtained from the cohort study in 2013-2014. Carotid ultrasound was performed only in participants who were aged at least 40 years in the Jidong study. Participants with any of the following conditions or who underwent any of the following procedures were excluded from this cross-sectional study: (1) carotid angioplasty/stenting; (2) carotid endarterectomy; (3) active liver diseases; (4) cirrhosis; (5) bone fracture or bone diseases (e.g. Paget's disease); (6) malignant tumor; (7) hyperparathyroidism; (8) end-stage renal disease requiring dialysis; and (9) pregnancy. The study protocol was approved by the Medical Ethics Committee of Jidong Oilfield. This study was conducted in accordance with the Declaration of Helsinki, and all participants signed informed consent for participation.
-
All participants were interviewed by well- trained physicians at Jidong Hospital. The demographic data, lifestyle-related information, and medical histories of the participants were collected using standardized questionnaires. Body mass index (BMI) was calculated as weight (kg) divided by height squared (m2). Blood pressure was measured by well-trained physicians using a standard mercury sphygmomanometer while the participants were in a seated position and after at least 5 minutes of rest. Hypertension was defined as systolic blood pressure (SBP) > 140 mmHg or diastolic blood pressure (DBP) > 90 mmHg, being prescribed anti-hypertensive medication, or any prior diagnosis of hypertension. Diabetes was defined as fasting plasma glucose ≥ 7.0 mmol/L, being prescribed diabetes medication, or any prior diagnosis of diabetes. Heavy alcoholism was defined as consumption of more than 5 standard units (1 standard unit contains approximately 14 grams) of alcohol per day.
A fasting venous blood sample (more than 8 h of fasting) was drawn from each participant. Fasting blood glucose (FBG), total cholesterol (TC), triglyceride (TG), low-density lipoprotein cholesterol (LDL-C), high-density lipoprotein cholesterol (HDL-C), and creatinine levels were determined by standard methods using UniCel DxC 600 Synchron (Beckman Coulter, Inc., Brea, CA, USA). Estimated glomerular filtration rate (eGFR) was calculated using the EPI-CKD creatinine equation[20].
Serum ALP activity was measured using the 2-amino-2-methyl-Ⅰ-propanol (AMP)-buffed method (Kehua Bio-Engineering, Shanghai, China). The coefficient of variation for ALP measurement was 4.6%. Participants were divided into five quintile groups according to their serum ALP levels (U/L): quintile 1, 26-54; quintile 2, 55-63; quintile 3, 64-73; quintile 4, 74-86; and quintile 5, 87-209.
-
Each participant underwent carotid artery ultrasonography using a high-resolution B-mode tomographic ultrasound system (ACUSON X300, Siemens, Cologne, Germany) with a 10-MHz linear-array transducer. IMT was measured at the far wall of the common carotid artery proximal to the bifurcation in the longitudinal view, following a plaque-free segment of ≥ 10 mm in length with a clearly identified double-line pattern. Mean IMT values obtained using the edge detection system were analyzed across the entire segment. Plaques were defined as either focal structures encroaching the arterial lumen of at least 0.5 mm or 50% of the surrounding IMT value, or > 1.5 mm in thickness, as measured from the intima-lumen interface to the media–adventitia interface[21]. Abnormal IMT was defined as IMT > 0.9 mm[21]. Extracranial carotid arteries included the common carotid arteries, carotid bifurcation, the internal carotid artery, and the external carotid artery. ECAS was defined as ≥ 50% stenosis in at least one extracranial carotid artery[22]. All measurements were performed by two independent sonographers who were blinded to the clinical information of the participants. The inter-observer and intra-observer variability of IMT assessment among 30 volunteers showed a coefficient of variation of 12.5% and 8.1%, respectively.
-
Categorical variables are presented as a percentage, and continuous variables are shown as means ± standardized deviation (SD). Participant characteristics, IMT, and carotid plaque were compared across ALP quintile groups using either the Chi square test for categorical variables or ANOVA for continuous variables. Logistic regression analysis was used to estimate the risk of abnormal IMT, carotid plaque, and ECAS across the ALP quintiles (with the lowest quintile serving as the reference) by calculating the odds ratios (ORs) and 95% confidence intervals (CIs). Adjustments were made for the following variables: age, sex, BMI, hypertension, diabetes mellitus, eGFR, myocardial infarction, stroke, smoking, alcohol drinking, lipid profile (TC, TG, LDL-C, and HDL-C), education level, family income, and statin therapy. In addition, subgroup analyses were conducted to determine the effects of age, sex, renal function, nonalcoholic fatty liver disease (NAFLD), and metabolic syndrome on the risk of abnormal IMT, after adjusting for all of the above-mentioned variables. Metabolic syndrome was defined as the presence of three or more of the following factors: (1) waist circumference ≥ 80 cm in women and ≥ 90 cm in men; (2) fasting serum HDL-C < 1.29 mmol/L in women and < 1.04 mmol/L in men; (3) fasting serum TG ≥ 1.69 mmol/L; (4) BP ≥ 130/85 mmHg or consumption of regular antihypertensive medications; and (5) FBG ≥ 5.6 mmol/L or already being treatment for diabetes[23, 24]. All statistical tests were two-sided, and P < 0.05 was considered statistically significant. All statistical analyses were performed using SAS software, version 9.4 (SAS Institute, Cary, NC, USA).
Study Population
Covariate Analysis
Assessment of Carotid Artery Atherosclerosis
Statistical Analyses
-
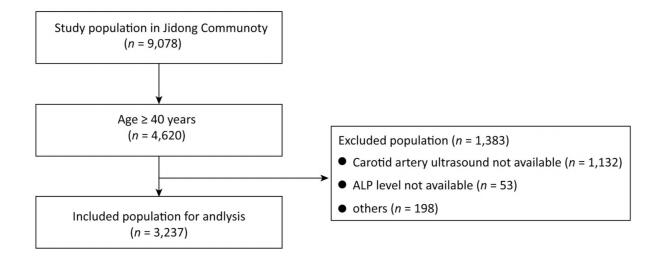
A total of 3, 237 participants fulfilled the eligibility criteria and were included in the analyses (Figure 1). The mean age of the eligible participants (48.7% male) was 53.5 ± 8.6 years, and the mean ALP level was 71.39 ± 20.35 U/L. The characteristics of the eligible participants and the excluded population are presented in Supplementary Table S1 (available in www.besjournal.com). All participants were divided into quintile groups according to their serum ALP levels, and the demographic data and cardiovascular risk factors were compared across the five quintile groups, as presented in Table 1. Participants in the higher ALP quintiles were older, had a higher BMI, and were more likely to have hypertension, diabetes mellitus, and stroke (all P < 0.05). From the lowest to the highest quintile, TC, LDL-C, and TG levels increased, while eGFR and HDL-C levels decreased (all P < 0.05).

Figure 1. Flow chart of study enrollment. ALP: alkaline phosphatase.
Characteristics Included Population Excluded Population P Value Number 3, 237 1, 383 < 0.0001 Age, year 53.55 ± 8.58 51.89 ± 8.70 < 0.0001 Male, % 1, 576 (48.69) 736 (53.22) 0.0048 BMI, kg/m2 24.97 ± 3.24 25.07 ± 3.53 0.5446 Hypertension, % 760 (23.48) 289 (20.90) 0.0550 Diabetes, % 269 (8.31) 107 (7.74) 0.5139 eGFR, mL·min-1 1.73 m-2 88.18 ± 12.99 90.02 ± 13.28 < 0.0001 Myocardial infarction, % 23 (0.71) 17 (1.23) 0.0814 Stroke, % 87 (2.69) 29 (2.10) 0.2398 Current smoker, % 773 (23.88) 391 (28.27) 0.0016 Heavy alcoholism, % 26 (0.80) 15 (1.08) 0.3503 Total cholesterol, mmol/L 4.71 ± 0.90 4.67 ± 0.91 0.1162 LDL-C, mmol/L 2.65 ± 0.60 2.62 ± 0.63 0.0988 TG, mmol/L 1.73 ± 1.43 1.72 ± 1.48 0.8393 HDL-C, mmol/L 1.21 ± 0.27 1.20 ± 0.28 0.4096 Statins therapy, % 56 (1.73) 16 (1.16) 0.1498 Education level 0.0004 Illiteracy/primary/middle school 1, 035 (31.97) 377 (27.26) High school 1, 049 (32.41) 436 (31.53) College/University 1, 153 (35.62) 570 (41.21) Income, 0.0083 ≤3, 000 1, 605 (49.58) 659 (47.65) 3, 001-5, 000 1, 442 (44.55) 609 (44.03) > 5, 000 190 (5.87) 115 (8.32) ALP level, U/L 71.39 ± 20.35 70.30 ± 24.06 0.0493 Note.ALP: alkaline phosphatase; BMI: body mass index; eGFR: estimated glomerular filtration rate; LDL-C: low density lipoprotein cholesterol; TG: triglyceride; HDL-C: high density lipoprotein cholesterol. Table Supplementary Table S1. Comparison of Characteristics between Included and Excluded Participants
ALP Quintiles Quintile 1 Quintile 2 Quintile 3 Quintile 4 Quintile 5 P Value Number of subjects, n 646 628 690 643 630 / ALP level, U/L 47.28 ± 5.59 59.17 ± 2.50 68.62 ± 2.95 79.76 ± 3.79 102.78 ± 15.94 / Age, year 49.49 ± 7.84 52.84 ± 8.27 53.81 ± 8.19 55.15 ± 8.70 56.50 ± 8.22 < 0.0001 Male, % 230 (35.60) 329 (52.39) 377 (54.64) 333 (51.79) 307 (48.73) < 0.0001 BMI, kg/m2 23.94 ± 3.19 24.87 ± 3.24 25.17 ± 3.05 25.27 ± 3.10 25.61 ± 3.36 < 0.0001 Hypertension, % 96 (14.86) 119 (18.95) 161 (23.33) 171 (26.59) 213 (33.81) < 0.0001 Diabetes, % 31 (4.80) 47 (7.48) 47 (6.81) 64 (9.95) 80 (12.70) < 0.0001 eGFR, mL·min-1 1.73 m-2 90.91 ± 12.75 89.13 ± 11.99 87.86 ± 12.73 87.00 ± 13.34 85.92 ± 13.54 < 0.0001 Myocardial infarction, % 1 (0.15) 7 (1.11) 9 (1.30) 0 (0.00) 6 (0.95) 0.0014 Stroke, % 6 (0.93) 17 (2.71) 24 (3.48) 18 (2.80) 22 (3.49) 0.0279 Current smoker, % 97 (15.02) 146 (23.25) 185 (26.81) 163 (25.35) 182 (28.89) < 0.0001 Heavy alcoholism, % 3 (0.46) 6 (0.96) 9 (1.30) 4 (0.62) 4 (0.63) 0.4370 Total cholesterol, mmol/L 4.52 ± 0.80 4.62 ± 0.85 4.71 ± 0.90 4.85 ± 0.85 4.84 ± 1.03 < 0.0001 LDL-C, mmol/L 2.49 ± 0.56 2.58 ± 0.60 2.67 ± 0.62 2.75 ± 0.58 2.74 ± 0.61 < 0.0001 TG, mmol/L 1.35 ± 0.98 1.65 ± 1.42 1.70 ± 1.16 1.89 ± 1.60 2.06 ± 1.77 < 0.0001 HDL-C, mmol/L 1.28 ± 0.29 1.21 ± 0.26 1.20 ± 0.28 1.19 ± 0.27 1.16 ± 0.25 < 0.0001 Statin therapy, % 10 (1.55) 7 (1.11) 12 (1.74) 9 (1.40) 18 (2.86) 0.1558 Education level < 0.0001 Illiteracy/primary/middle school 122 (18.89) 183 (29.14) 214 (31.01) 255 (39.66) 261 (41.43) High school 221 (34.21) 191 (30.41) 222 (32.17) 206 (32.04) 209 (33.17) College/University 303 (46.90) 254 (40.45) 254 (36.81) 182 (28.30) 160 (25.40) Income, CNY < 0.0001 ≤ 3, 000 267 (41.33) 297 (47.29) 350 (50.72) 356 (55.37) 335 (53.17) 3, 001-5, 000 336 (52.01) 286 (45.54) 301 (43.62) 265 (41.21) 254 (40.32) > 5, 000 43 (6.66) 45 (7.17) 39 (5.65) 22 (3.42) 41 (6.51) Note. ALP: alkaline phosphatase; BMI: body mass index; eGFR: estimated glomerular filtration rate; LDL-C: low-density lipoprotein cholesterol; TG: triglyceride; HDL-C: high-density lipoprotein cholesterol. Table 1. Demographic and Baseline Clinical Characteristics of the Study Population According to ALP Quintiles
-
The mean common carotid IMT values across the ALP quintiles are presented in Table 2. Both sides of the common carotid IMT increased gradually from the lowest to the highest quintiles. Compared with the first quartile (the reference category), the ORs (95% CIs) for abnormal common carotid IMT were 2.14 (1.38-3.32), 2.34 (1.52-3.59), 3.24 (2.14-4.93), and 3.45 (2.27-5.23) for the second, third, fourth, and fifth quintile, respectively (all P < 0.0001). After adjusting for confounders, the ORs for abnormal common carotid IMT in the fourth and fifth quintile were 1.78 (95% CI 1.13-2.82, P = 0.0135) and 1.82 (95% CI: 1.15-2.87, P = 0.0110), respectively (Table 3). In the subgroup analysis, the risk of abnormal IMT per ALP quintile did not differ with respect to sex, age, eGFR, NAFLD, and metabolic syndrome (Supplementary Table S2 available in www.besjournal.com).
ALP Quintiles Quintile 1 Quintile 2 Quintile 3 Quintile 4 Quintile 5 P Value Left Mean common carotid IMT, mm 0.69 ± 0.13 0.73 ± 0.16 0.74 ± 0.20 0.76 ± 0.16 0.78 ± 0.18 < 0.0001 Carotid plaque, % 40 (6.19) 67 (10.67) 70 (10.14) 83 (12.91) 102 (16.19) < 0.0001 Right Mean common carotid IMT, mm 0.68 ± 0.13 0.72 ± 0.16 0.73 ± 0.18 0.76 ± 0.20 0.76 ± 0.16 < 0.0001 Carotid plaque, % 29 (4.49) 60 (9.55) 69 (10.00) 78 (12.13) 86 (13.65) < 0.0001 Note.IMT: Intima media thickness; ALP: alkaline phosphatase. Table 2. Comparison of Common Carotid IMT and Carotid Plaque Across different ALP Levels
Adjusted Odd Ratios 95% Confidence Interval P for Interaction Sex 0.1644 Male 1.09 0.97-1.21 Female 1.26 1.05-1.51 Age 0.3846 < 65 years 1.14 1.03-1.26 ≥ 65 years 1.23 1.00-1.51 Estimated glomerular filtration rate (eGFR) 0.8495 < 50th 1.08 0.96-1.22 ≥ 50th 1.19 1.03-1.38 Nonalcoholic fatty liver disease (NAFLD) 0.8362 Yes 1.13 1.00-1.27 No 1.14 0.98-1.33 Metabolic syndrome 0.2544 Yes 1.10 0.97-1.25 No 1.14 0.99-1.32 Table Supplementary Table 2. Adjusted risks of abnormal common carotid IMT per ALP quintile across different subgroup
-
We examined the correlation of serum ALP levels with carotid plaque and ECAS. As shown in Table 2, the prevalence of carotid plaques increased gradually from the lowest to the highest quintile (from 6.19% to 16.19% on the left side and from 4.49% to 13.65% on the right side, all P < 0.0001). The unadjusted risks of carotid plaques were significantly elevated in the higher quintiles, compared to the reference (the lowest quintile). However, after adjusting for confounding covariates, the association between carotid plaques and ALP quintiles was no longer significant (Table 3). Therefore, our data indicate that there is no significant link between ALP levels and carotid plaques.
ALP Unadjusted Adjusted OR 95% CI P value OR 95% CI P value Mean common carotid IMT > 0.9 mm Quintile 1 reference - - - - - Quintile 2 2.14 1.38-3.32 0.0007 1.53 0.95-2.47 0.0812 Quintile 3 2.34 1.52-3.59 0.0001 1.47 0.92-2.34 0.1085 Quintile 4 3.24 2.14-4.93 < 0.0001 1.78 1.13-2.82 0.0135 Quintile 5 3.45 2.27-5.23 < 0.0001 1.82 1.15-2.87 0.0110 Carotid plaques Quintile 1 reference - - - - - Quintile 2 1.90 1.34-2.68 0.0003 1.28 0.87-1.88 0.2072 Quintile 3 1.92 1.37-2.70 0.0002 1.12 0.77-1.64 0.5438 Quintile 4 2.45 1.75-3.41 < 0.0001 1.23 0.84-1.78 0.2895 Quintile 5 2.77 1.99-3.85 < 0.0001 1.27 0.88-1.85 0.2071 Note.The lowest quintile (quintile 5) was used as the reference. IMT: Intima media thickness; ALP: alkaline phosphatase; OR: odds ratio; CI: confidence interval. Table 3. Risk of Abnormal Common Carotid IMT or Carotid Plaque Across ALP Quintiles
Using the first ALP quintile as the reference, we found that the ORs for ECAS in the second, third, fourth, and fifth quintile were 1.77 (95% CI: 1.34-2.33), 1.65 (95% CI: 1.25-2.18), 1.880 (95% CI: 1.43-2.48), and 2.47 (95% CI: 1.88-3.23), respectively. In addition, the OR for ECAS in the fifth quintile was 1.47 (95% CI: 1.09-1.97, P = 0.0106) after adjusting for age, sex, BMI, hypertension, diabetes mellitus, eGFR, myocardial infarction, stroke, smoking, alcohol drinking, lipid profile, education level, family income, and statin therapy (Table 4).
ALP Unadjusted Adjusted OR 95% CI P value OR 95% CI P value Quintile 1 reference - - reference - - Quintile 2 1.77 1.34-2.33 < 0.0001 1.30 0.96-1.74 0.0864 Quintile 3 1.65 1.25-2.18 0.0004 1.11 0.83-1.49 0.4896 Quintile 4 1.88 1.43-2.48 < 0.0001 1.20 0.90-1.62 0.2180 Quintile 5 2.47 1.88-3.23 < 0.0001 1.47 1.09-1.97 0.0106 Note. ALP: alkaline phosphatase; OR: odds ratio; CI: confidence interval; ECAS: extracranial carotid artery stenosis. Table 4. Risk of ECAS Across different ALP Quintiles
Demographic and Clinical Characteristics of the Study Population According to APL Quintiles
Association between Serum ALP Levels and Common Carotid IMT
Association between Serum ALP Levels, and Carotid Plaque and ECAS
-
In this largest cross-sectional study regarding the relationship between serum ALP levels and carotid atherosclerosis, we found that compared to the lowest ALP quintile, elevated ALP levels are associated with higher common carotid IMT values and higher risk of ECAS.
Previously, a meta-analysis of 24 trials including 147, 634 participants identified a linear correlation of serum ALP levels with the risk of cardiovascular events and mortality[25]. However, the relationship between ALP and subclinical atherosclerosis, particularly carotid atherosclerosis, remains ambiguous. A case-control study comparing 56 obese adolescents and 58 controls found a positive correlation between ALP and carotid IMT using univariate analysis[16]. However, after adjusting for confounding factors, ALP, as well as other liver enzymes, were no longer associated with carotid IMT[16]. In contrast, another cross-sectional study comprising 79 African men with hypertension demonstrated that carotid IMT positively correlated with ALP after adjusting for covariates[17]. Although the exact reasons underpinning these discrepant findings are unclear, it is highly likely that the small sample size and the difference in study populations affected the outcomes. Our study was a community-based study with a large sample size, which allowed us to draw solid conclusions regarding the correlation between serum ALP and subclinical atherosclerosis.
Vascular calcification and inflammation are the two major probable mechanisms linking circulating ALP levels to cardiovascular mortality[26]. Several epidemiological studies have shown that C-reactive protein modulates the relationship between serum ALP and cardiovascular events[27, 28]. In vitro studies have also demonstrated associations between ALP and mediators of inflammation (especially tumor necrosis factor) in different cell lines[29-31]. Moreover, serum ALP levels were shown to be correlated with endothelial dysfunction in patients with hypertension[32]. Another study found that overexpression of tissue non-specific ALP in endothelial cells could promote pathophysiological vascular calcification[33]. Collectively, these findings indicate that serum ALP levels are correlated with systemic inflammation, endothelial dysfunction, and vascular calcification.
It is well established that compared to healthy individuals, individuals with NAFLD have a higher risk of cardiovascular events. Thus, NAFLD has been considered an independent risk factor for cardiovascular disease[34, 35]. Similar to the case for multiple liver markers, elevated ALP levels could be caused by NAFLD. However, our subgroup analyses indicated that the associations between ALP and IMT were similar in participants with and without NAFLD. In contrast, the association between ALP and cardiovascular disease was robust in patients with chronic kidney disease[26], which may be attributed to the role of ALP in skeletal mineralization. In our study, the ALP-linked risks of carotid atherosclerosis were independent of renal function and consistent across different eGFR subgroups[26].
Vitamin D deficiency is a common reason for elevated ALP. Epidemiological studies demonstrate an unequivocal association between vitamin D deficiency, and cardiovascular morbidity and mortality[36]. Further research has indicated that vitamin D is associated with the development and progression of atherosclerotic cardiovascular disease, including response to oxidative stress[37] vascular smooth muscle function[38], endothelial function[39], renin-angiotensin-aldosterone system activation[40], and insulin metabolism[41]. Thus, vitamin D could be a potential confounder for the effect of ALP on carotid atherosclerosis. However, recent vitamin D supplement trials failed to show clear improvements in blood pressure, insulin sensitivity, and lipid parameters[42], as well as cardiovascular disease[43].
Our study has several limitations. First, this was a cross-sectional study that failed to determine the cause-effect association between ALP and carotid atherosclerosis. Second, although we adjusted for several traditional risk factors, it is highly likely that residual confounders such as vitamin D and systemic inflammation still exist. Third, this was a community-based study, and thus, it is unclear whether our findings can be extrapolated to the general population.
-
In conclusion, we found a positive correlation between serum ALP levels and common carotid IMT in a Chinese population, which was independent of traditional cardiovascular risk factors. Higher ALP levels were also associated with increased risk of ECAS. However, these conclusions need to be further corroborated in future prospective cohort studies.
-
YE Yi Cong designed the research/study and wrote the manuscript, LIU Hua Min performed the research/study, and ZHOU Yong and ZENG Yong collected and analyzed the data.

 Quick Links
 DownLoad: