


-
Temperature is a crucial factor that affects influenza transmission. Therefore, several studies have correlated various aspects of influenza with temperature from the global warming period during which temperature exhibits a clear trend. The global warming hiatus has been existing since the year 1998[1]. This provides an opportunity to investigate the effect of temperature on the transmission of influenza from the viewpoint that temperature is trendless. In fact, the relationship between temperature and influenza has not yet been clearly elucidated. In addition, there are no clear data regarding the relationship between temperature and other meteorological data; for example, humidity[2] has no clear trends as temperature and CO2 over either global warming or global warming hiatus. Therefore, it is possible to investigate the effect of temperature on the transmission of influenza during the global warming hiatus without including the factors that do not demonstrate any noticeable difference between global warming and global warming hiatus.
Temperature data were obtained from the CRU TS dataset[3]. A total of 815, 288 surveillance samples were obtained from the Influenza Research Database at http://www.fludb.org; and grouped according to avian, human, animal and environmental[4] data (Supplementary Table S1, available in www.besjournal.com). Each sample was mapped from its location to its geographic longitude and latitude to determine its monthly temperature in the CRU TS dataset. The percentage [positive samples/(positive samples + negative samples)%] was used to present the data. When both positive and negative samples were recorded at the same location, the temperature difference (℃) was calculated between the positive and negative samples.
Host Continent Samples Countries Species Years Avian Africa 72, 822 13 251 2008 to 2016 Asia 236, 740 14 382 2008 to 2016 Europe 95, 573 10 320 2007 to 2016 North America 150, 094 3 323 2007 to 2016 Oceania 2, 947 2 48 2008 to 2013 Central and South America 47, 168 4 226 2008 to 2016 Nonhuman Africa 6, 743 8 9 2009 to 2014 mammalian Asia 114, 162 6 51 2008 to 2016 Europe 453 2 2 2009 to 2017 North America 71, 682 3 39 2002 to 2016 Central and South America 5, 694 6 6 2003 to 2015 Human 11, 210 12 2008 to 2014 Table Supplementary Table S1. Surveillance Data Characteristics
Statistical comparisons of local temperature between the positive and negative samples were conducted using parametric (Student's t-test) and nonparametric statistics (Mann-Whitney U-test) after determining the sample distribution by the Kolmogorov-Smirnov test. One-way ANOVA and the Kruska-Wallis one-way ANOVA were used accordingly. P < 0.05 was considered for statistical significance. For positive samples, between-year and within-year variations were calculated for the temperature and influenza percentage using the single classification model Ⅱ ANOVA with unequal sample sizes.
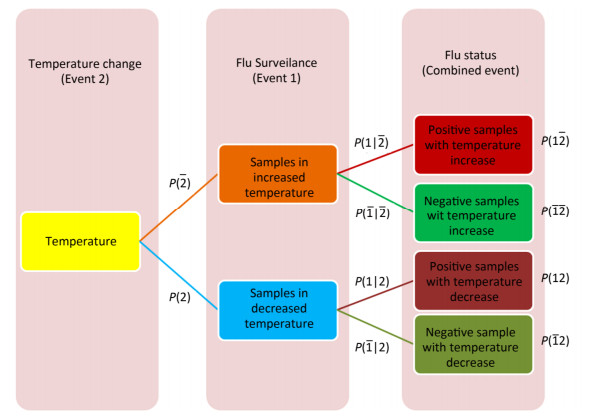
Cross-impact analysis was used to determine the probability of how fluctuating temperature affects on influenza A status[5]. Because of uncertainty in the rise or fall of temperature and uncertainty of influenza A infection in an individual species, two probabilistic events were defined, and their probabilities and consequently conditional probabilities were calculated (Supplementary Figure S1, available in www.besjournal.com).
Figure Supplementary Figure S1. Cross-impact relationship between temperature change and influenza A status.
Some studies have been conducted to establish the relationship between influenza outbreaks and meteorological factors[6], topographical factors, human population density, and poultry density[7]. However, no studies have yet evaluated the point-to-point relationship of geographic location between temperature and flu surveillance at a global scale, and the impact of temperature on influenza A infection in terms of probability.
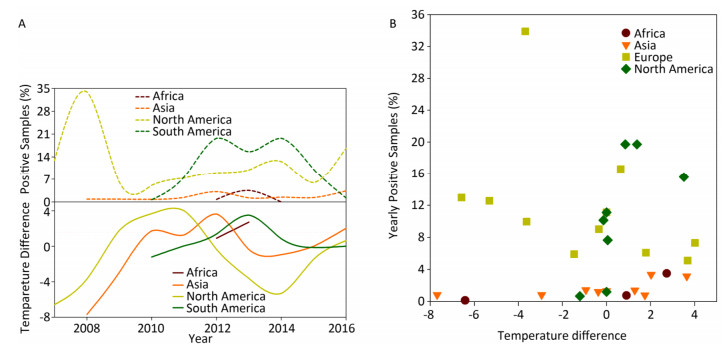
Wild birds are considered as the primary transmission hosts for influenza virus[8], and thus avian data contribute the largest proportion (605, 473/815, 288 = 74.26%) of surveillance data. Figure 1 depicts the yearly percentage of positive samples (upper panel) and the temperature difference between the positive and negative samples in each continent over time (lower panel). In the upper panel of Figure 1, the curves do not synchronize their peaks and troughs over time, i.e. each continent has its own pattern for the percentage of positive samples from 2007 to 2016. For example, Europe has two peaks in 2012 and 2014, whereas South America has just one peak in 2014. This difference can be due to different seasonalities between the Northern and Southern Hemispheres and different species (Supplementary Table S2, available in www.besjournal.com).
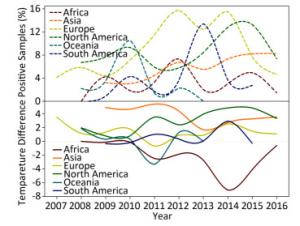
Figure 1. Yearly percentage of positive avian samples in each continent over time (upper panel) and the temperature difference between the temperature (℃), at which the samples were positive, and the temperature (℃), at which the samples were negative, in each continent over time (lower panel). To avoid overlaps in the graph, only mean value is presented.
Host Africa (%) Asia (%) Europe (%) North America (%) South America (%) Oceania (%) Domestic chicken 81.19 28.5 31.03 13.67 Duck 5.01 24.39 4.13 Chicken 3.39 Environment 23.32 4.86 44.99 Mallard 42.69 22.17 Black-headed gull 10.22 Greater white-fronted Goose 8.76 Eurasian wigeon 7.1 Barnacle goose 3.95 Swan goose 3.93 Blue-winged teal 10.67 Ruddy turnstone 5.97 12.11 Pintail 5.87 Glaucous-winged gull 5.21 Grey teal 10.69 Pink-eared duck 6.65 Red-necked stint 5.23 Cattle egret 4.68 Total 85.2 79.60 76.65 54.75 84.83 48.35 Table Supplementary Table S2. Different Species Contributing to Figure 1
As shown in the lower panel of Figure 1, when the relationship of temperature with positive samples is higher than that with negative samples, then the curve is above the horizontal-dotted line; otherwise, the curve is below the horizontal-dotted line. For example, the temperature difference in 2014 is 2.72 ℃ in Asia but -7.05 ℃ in Africa. Except for Africa and Oceania, the general pattern is that the positive samples are more likely to be obtained at a higher temperature rather than at a lower temperature. For Africa, its percentage of positive samples in the upper panel has three peaks, whereas the remaining continents generally have two peaks. Temperature difference in the lower panel indicated positive samples at lower temperatures but negative samples at higher temperatures because its curve is below the horizontal-dotted line with a deep trough in 2014. For Asia, its percentage of positive samples in the upper panel increased over time, but its temperature difference showed a decreasing trend over time. For Europe, its percentage of positive samples in the upper panel has two peaks, whereas its temperature difference in the lower panel does no show a clear trend. For North America, both the percentage of positive samples in the upper panel and the temperature in the lower panel show a similar increasing trend over time. Indeed, this trend holds for both temperatures relating to positive and negative samples. For Oceania, there is a single peak in the upper panel and a single trough in the lower panel. Its temperature for negative samples was almost constant, but its temperature for positive samples decreased sharply in 2010 and 2011, leading to a peak in the upper panel but a trough in the lower panel. For South America, there are two peaks in both the upper and lower panels. Similar to the phenomenon that occurred in the Southern Hemisphere, there was a yearlong difference between the upper and lower panels. Both temperatures relating to positive and negative samples were decreasing over time.
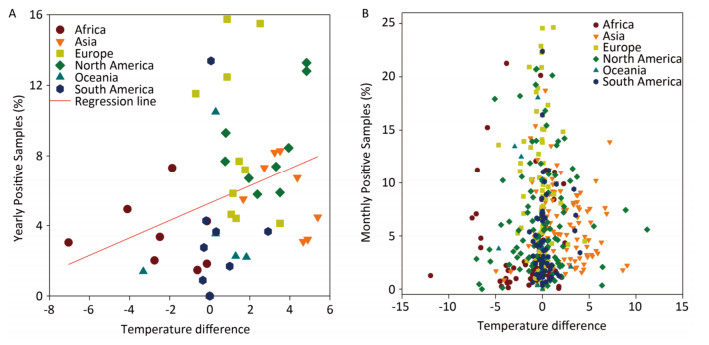
In general, the temperature showed 1.5%-4.5% between-year variations and 95.5%-98.5% within-year variations (Supplementary Table S3, available in www.besjournal.com). However, the positive avian samples showed 7.7%-31.4% between-year and 68.6%-92.3% within-year variations (Supplementary Table S4, available in www.besjournal.com). Because of global warming hiatus, we could directly extrapolate from the relationship between the upper and lower panels in Figure 1 into Supplementary Figure S2 (available in www.besjournal.com) with yearly and monthly percentages of positive samples to explore the relationship between the temperatures relating to positive and negative samples. Supplementary Figure S3 (available in www.besjournal.com) depicts the percentage of positive avian samples in each continent in each month (upper panel) and the temperature difference between the positive and negative samples in each continent in each month (lower panel).
Temperature Africa Asia Europe North America South America Between-year variation (%) 4.51 1.99 3.45 1.80 1.48 Within-year variation (%) 95.49 98.01 96.55 98.2 98.52 Table Supplementary Table S3. Between-year and Within-year Variations for Temperature, Where the Samples Were Obtained, Using the Single Classification Model Ⅱ ANOVA with Unequal Sample Sizes
Positive Samples Africa Asia Europe North America South America Between-year variation (%) 8.74 31.44 15.59 7.71 14.89 Within-year variation (%) 91.26 68.56 84.41 92.29 85.11 Table Supplementary Table S4. Between-year and Within-year Variations for Percentage of Positive Avian Samples Using the Single Classification Model Ⅱ ANOVA with Unequal Sample Sizes
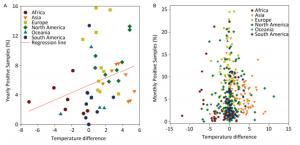
Figure Supplementary Figure S2. Yearly (A) and Monthly (B) percentage of positive avian samples versus temperature difference (℃) between positive and negative samples. To avoid overlaps in graph, only means are presented.
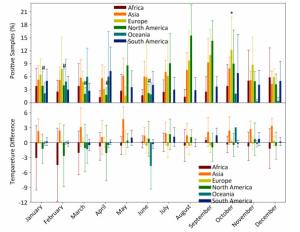
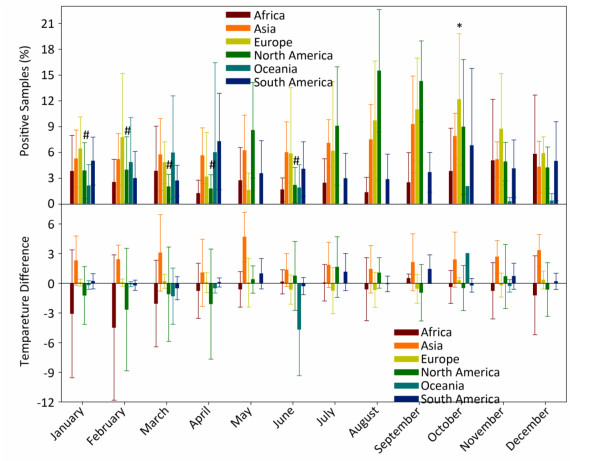
Figure Supplementary Figure S3. Percentage of positive avian samples in each continent in each month (mean ± SD, upper panel) and temperature difference (℃) between positive and negative samples, in each continent in each month (mean ± SD, lower panel). *, and #, statistical difference between May and October in Europe and between August and January, February, March, April, June in North America at P < 0.05 level.
The disease reservoir of nonhuman mammalians contributes 24.38% (198, 734/815, 288) of surveillance data, and whereas that of swine accounts for 91.39% (181, 614/198, 734), therefore, the data from swine would weigh heavily on the nonhuman mammalian data. We present the analyses similar to avian surveillance data in Supplementary Figure S4 (available in www.besjournal.com). We also applied the cross-impact analysis to the surveillance data on swine from China and USA to further explore how temperature affects influenza A status in swine (Supplementary Figure S5A, available in www.besjournal.com) with the aim of determining the probability that an individual species gets infected with influenza A with temperature change P(1) and other conditional probabilities (Supplementary Table S5, available in www.besjournal.com).
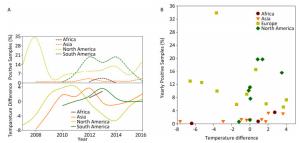
Figure Supplementary Figure S4. Yearly percentage of positive samples from non-human mammalians. (A) in each continent over time (upper panel) and temperature difference between the temperature (℃), at which samples were positive, and the temperature (℃), at which samples were negative, in each continent over time (lower panel). (B) versus temperature difference (℃) between positive and negative samples. To avoid overlaps in graph, only mean is presented.
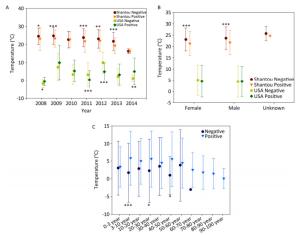
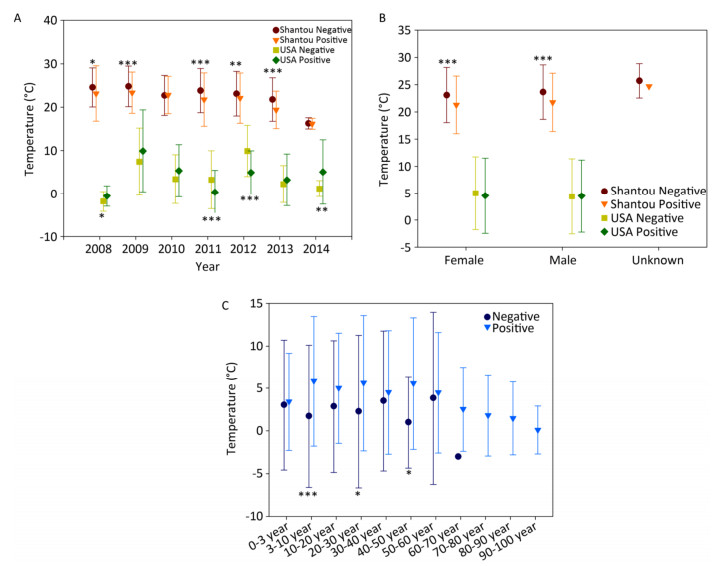
Figure Supplementary Figure S5. Temperature of positive and negative human samples from Shantou, Guangdong, China and USA over time (A), with respect to gender (B), with respect to patients' age (C).
Probability Computation Value P(2) 1260/2646 0.476 P(2) 1 – P(2) = 1 – 0.476 or 1386/2646 0.524 P(1|2) 5/1386 0.004 P(1|2) 1 – P(1|2) = 1 – 0.004 or 1381/1386 0.996 P(1|2) 13/1260 0.010 P(1|2) 1 – P(1|2) = 1 – 0.010 or 1247/1260 0.090 P(12) P(1|2) × P(2) = 5/1386 × 1386/2646 = 5/2646 0.002 P(12) P(1|2) ×P(2) = 1381/1386 × 1386/2646 = 1381/2646 0.522 P(12) P(1|2) × P(2) = 13/1260 × 1260/2646 = 13/2646 0.005 P(12) P(1|2) × P(2) = 1247/1260 × 1260/2646 = 1247/2646 0.471 P(2|1) 13/(5 + 13) 0.722 Table Supplementary Table S5. Computation of Probabilities for Swine Samples Obtained in 2008 in China According to the Cross-Impact Relationship in Figure S1
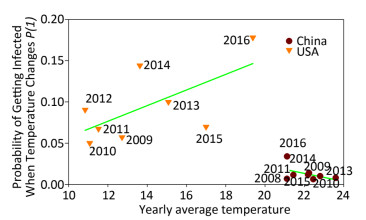
Figure 2 displays the probability of being infected with influenza A in swine from USA and China when the temperature changes using the cross-impact analysis. The symbols representing swine from China are concentrated in a small area, because 89, 891 swine samples were obtained exclusively from Hong Kong, Guangdong and Guangxi (98.82%). The temperature in these areas does not change in a very large range, so most of the symbols, except symbol 2016, do not have several changes along the y-axis direction, i.e. the probability of being infected with influenza A does not change much when the temperature changes so little. The inclusion of symbol 2016 leads to the conclusion that the decrease in temperature would slightly increase the probability of being infected. In contrast, the symbols from USA include 63, 559 swine samples from 18 states (Supplementary Table S5). Therefore, these surveillance data are more meaningful. The regression line clearly indicates the tendency that the higher the average yearly temperature, the larger the probability of being infected with influenza A. In Figure 2, the cross-impact analysis illustrates that the localized swine samples from China have a different trend from the trend produced by the unlocalized swine samples from USA. Precisely, the monthly percentage of positive influenza A samples in the tropical, and subtropical countries and temperate regions[9] follows the trend observed in Shantou, China, as shown in Figure 2 in this study.
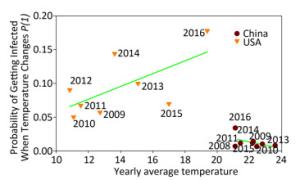
Figure 2. Probability of being infected with influenza when the temperature (℃) changes in swine from USA and China. Each symbol presents the average yearly temperature (℃) along the x-axis, and the probability of being infected with influenza when the temperature (℃) changes along the y-axis. Samples from China in 2012 are not included because data were available only for 3 months.
The final natural reservoir is humans in the surveillance data. At the global level, by combining all the human surveillance data from all the continents over these years, the temperature for the positive samples is 11.07 ± 10.35 ℃ (mean ± SD, n = 3, 567), and that for the negative samples is 22.37 ± 6.7 ℃ (mean ± SD, n = 7, 644), and their statistical comparison was highly significant (P < 0.001). This comparison result is consistent with our common knowledge that influenza is more likely to occur in winter. The data in Shantou, Guangdong, China, and in USA are highly comprehensive. Supplementary Figures S6 (available in www.besjournal.com) depict the positive and negative human samples from Shantou, Guangdong, China, and USA with respect to temperature changes over time, gender, and patient age, respectively. Collectively, these three figures demonstrate the presence of temperature difference between positive and negative samples.
State Swine Samples (%) Colorado 0.296 Georgia 6.743 Illinois 16.226 Indiana 16.772 Iowa 15.759 Kentucky 1.407 Michigan 0.407 Minnesota 8.205 Missouri 0.318 Nebraska 9.050 NorthCarolina 6.388 Ohio 7.742 Oklahoma 8.745 Pennsylvania 0.009 SouthCarolina 0.208 SouthDakota 1.317 Texas 0.315 WestVirginia 0.094 Table Supplementary Table S6. Distribution of 63559 Swine Samples from USA
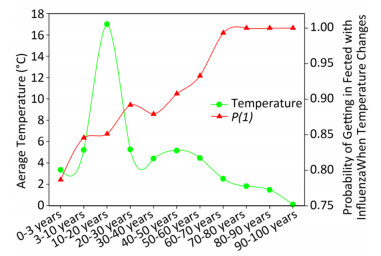
Figure 3 elaborates the yearly average temperature versus the probability of being infected with influenza A when the temperature changes for the USA populations at different ages according to the cross-impact analysis. In this dataset, there were 1, 839 patients whose age ranged from 0.6 to 97.0 years from 2008 to 2014, so that there were not many samples in each year for each age group. When an individual visited a physician, the temperature was recorded, and the recorded temperatures were averaged in each age group over years. Each green circle represents the average temperature, e.g., the average temperature was 3.35 ℃ for the 0 to 3 year age group, 5.21 ℃ for the 3 to 10 year age group, and so on. The red triangle represents the probability of being infected with influenza A when the temperature changes for each age group. Combined with green circles, we can obtain the probability of being infected with influenza A when the temperature changes. These probabilities are quite large, but reasonable because the surveillance data were obtained from clinical metadata, the samples were from patients who visited physicians with influenza A symptoms, and their flu-positive samples were examined for the virus. However, the curves shown in Figure 3 are highly meaningful because the red line suggests that the higher the age, the larger the probability to be infected with influenza A when the temperature changes.
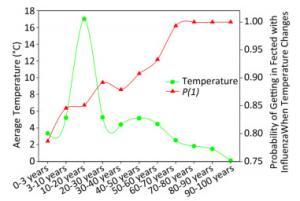
Figure 3. Yearly average temperature versus probability of being infected with influenza when the temperature changes for the USA populations with different ages.
Infectious pathogens under climate changes present challenges to human health[10]. In this study, 815, 288 surveillance samples deposited in a global database were analyzed to determine the effect of temperature change on influenza A infection. The results indicate clear evidence that the percentage of positive influenza A samples is temperature-dependent based on avian, nonhuman mammalian and human yearly and monthly surveillance data. The probability that a swine gets influenza A infection when the temperature changes increases with increase in the yearly average temperature in USA. The probability that an individual gets influenza A infection when the temperature changes increases with increase in the population age based on USA surveillance data. This study fills the knowledge gap of how the temperature from the global warming hiatus affects influenza A infection.
HTML
the National Natural Science Foundation of China 31460296
the Key Project of Guangxi Scientific Research and Technology Development Plan AB17190534
the National Natural Science Foundation of China 31560315
the central government directed special funds for local science and technology development project AZ1949015

 Quick Links
 DownLoad: