


-
Radiotherapy (RT) is a standard treatment for malignant tumors[1], and the mechanism of tumor cell death is mediated by direct and indirect damage to DNA[2]. As early as 1953, Mole et al. noted that distant unirradiated tumors at sites located away from RT can occasionally undergo tumor regression[3]. This phenomenon is known as the “abscopal effect”, its mechanism was thought to be a systemic anti-tumor immune response[4, 5], but the effect was rare due to the development of radiation tolerance and immunosuppression in the tumor microenvironment[6, 7].
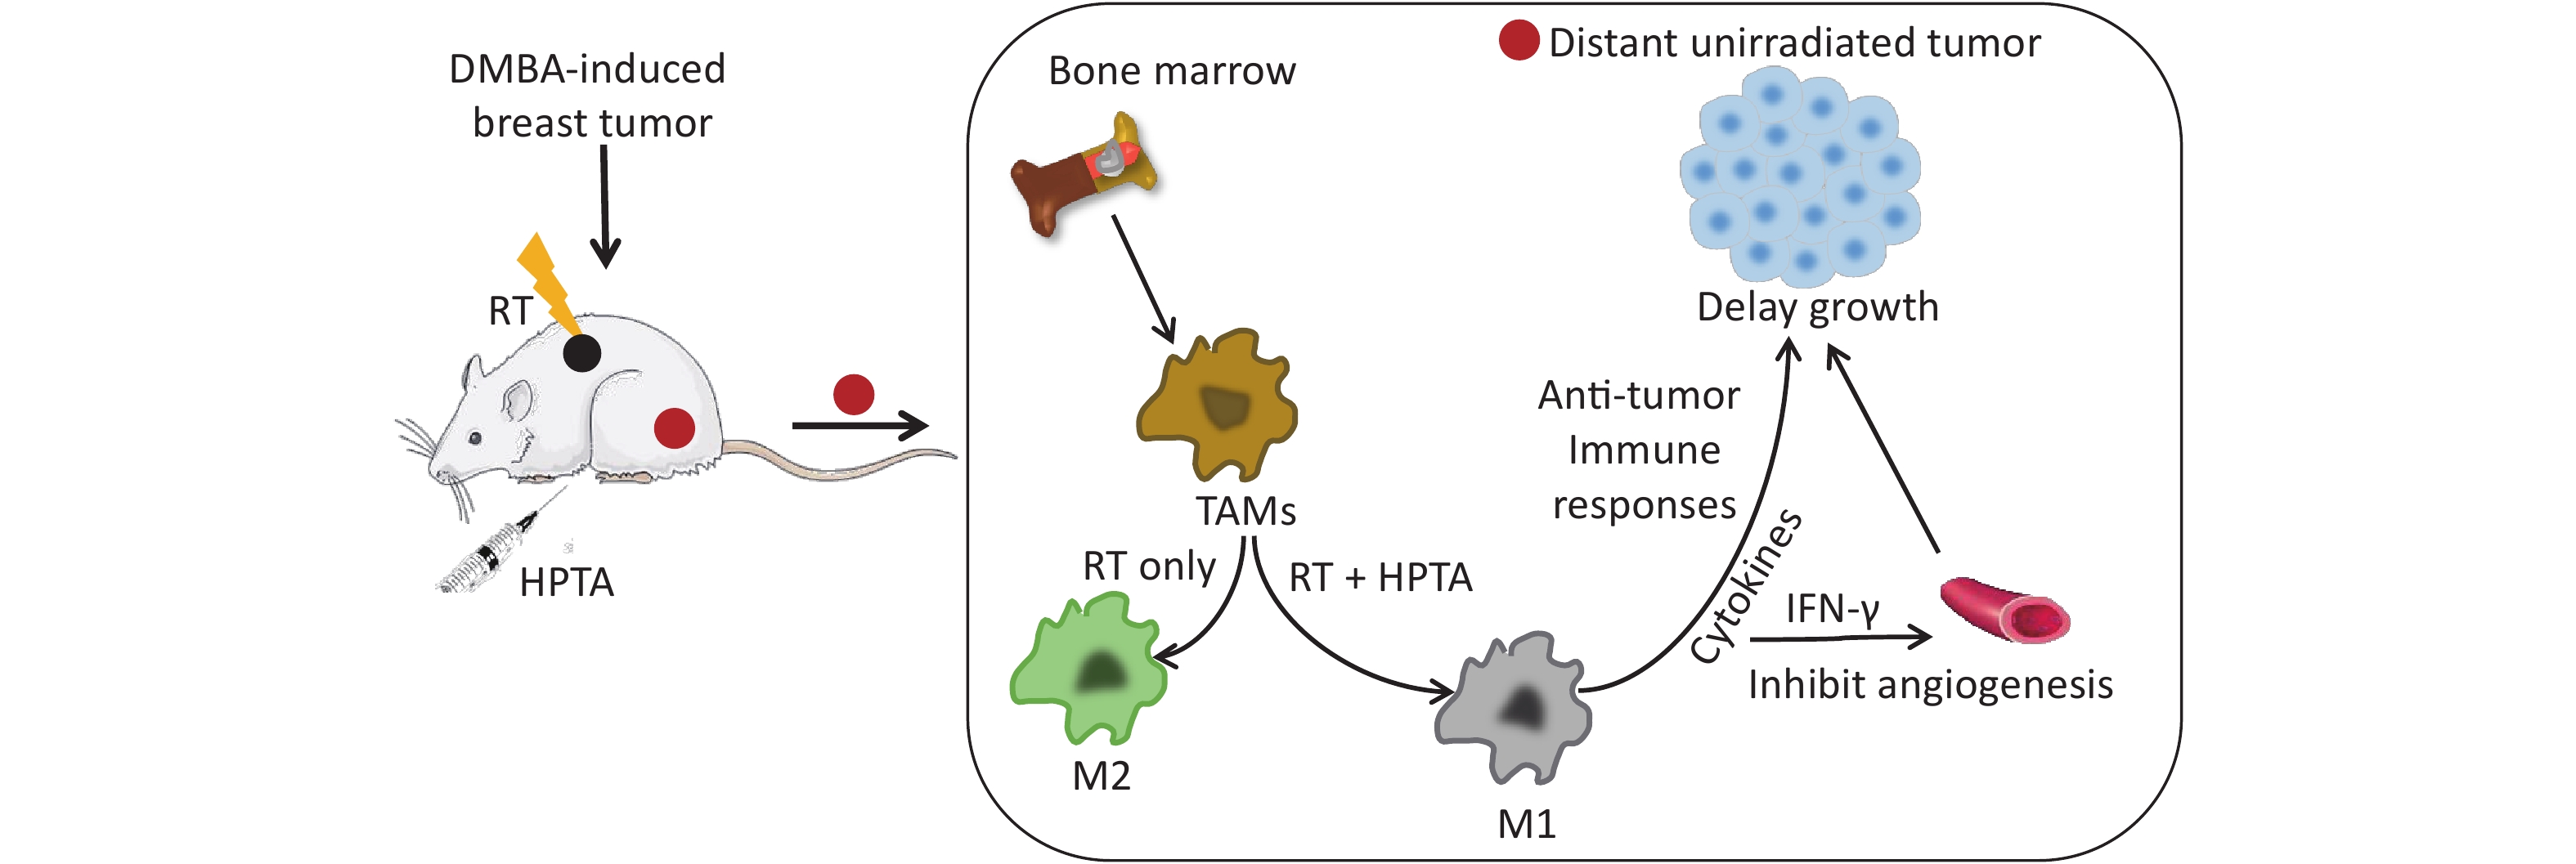
Recently, it has been found that RT can trigger an influx of myeloid cells[8]; specifically, myeloid-derived tumor-associated macrophages (TAMs), which are resistant to RT[9]. TAMs are the main component of the tumor microenvironment, accounting for 50% of the tumor mass[10]. TAMs are mainly the M2 phenotype, characterized by stimulating angiogenesis and releasing growth factors[11, 12], which in turn promote tumor recurrence after RT[9]. Studies have also reported that M1 phenotype TAMs could inhibit tumor neovascularization to reduce RT resistance by secreting IFN-γ[13]. It is hypothesized that the polarization of TAMs to the M1 phenotype may augment the RT-induced abscopal effect[14, 15]. Although preclinical and clinical studies have shown that combining immunotherapy with RT has improved the systemic effect of RT[16-22], the challenge still remains[23-25]. Thus, finding a specific agent for promoting TAM differentiation into the anti-tumor M1 phenotype and initiating an abscopal effect on irradiated tumors is considered urgently required in this field.
Our previous study showed that 2-hexyl-4-pentylenic acid (HPTA), a valproic acid derivative, possesses histone deacetylase inhibitor (HDACi) functions, and is a novel pharmacotherapeutic for breast cancer cells by decreasing the activity of DNA repair proteins and increasing apoptotic cell death[26]. A recent study found that TMP195, a class IIa HDACi, reduced metastases by modulating TAMs towards the anti-tumor M1 phenotype and induced vasculature normalization in breast tumors[27], thus suggesting that HDACis may be able to regulate the polarization of TAMs.
In this study, we employed the established rat models of breast cancer to study the effects of HPTA and RT on TAM polarization. We observed that the growth of unirradiated breast tumors distant from the irradiated tumor field was significantly inhibited, suggesting that HPTA can stimulate RT-induced abscopal effects. Furthermore, we found that HPTA reprogrammed TAM polarization from the pro-tumor M2 phenotype to the anti-tumor M1 phenotype. Our research supports the proposition of HPTA as a neoadjuvant to RT in breast cancer, and provides an experimental basis and new ideas for the future exploration of TAMs as a therapeutic target for increasing radiotherapeutic efficiency, driving RT from local tumor treatment mode to systemic treatment, and ultimately inhibiting the growth of distant tumors.
-
Animal tissue research was carried out in accordance with the requirements of the Shandong University Human and Animal Ethics Research Committee approval 20140315. The breast cancer model in rats has been described previously[28]. In brief, after the model was successfully established on or about the 90th day after a single intragastric administration of DMBA, the tumors accounted for approximately 10% of the total animal weight. Two or more tumors were randomly assigned to four different groups: the control group, HPTA group alone, RT group alone, and RT + HPTA group. HPTA was administered intraperitoneally (20 mg/kg). RT (PRECISION X-Rad 225, USA; dose fractionation 2 Gy/time/day) of the tumor was in situ. The HPTA concentration was selected after a series of pre-clinical toxicology experiments were conducted, and the radiation dose and dose fractionation strategy used in this study was also based on previous research[21, 29-32]. The specific details of HPTA and RT treatments are shown in Table 1. The tumor size was monitored weekly and measured with vernier calipers to determine the tumor response until day 35. Tumor volume was calculated according to the clinical standard formula as follows:
Time 1st Day 2nd Day 3rd Day 4th Day 5th Day 6th Day 8:00 am HPTA HPTA HPTA HPTA HPTA HPTA 14:00 pm − 2 Gy 2 Gy 2 Gy 2 Gy − 20:00 pm HPTA HPTA HPTA HPTA HPTA HPTA Note. RT: Radiotherapy. HPTA: 2-hexyl-4-pentylenic acid. Table 1. Schedule of HPTA and RT treatment for rats in the RT + HPTA treatment group
tumor volume (mm3) = Length (L) × Width (W)2/2.
The tissue was collected on day 15, and the mammary tumors were isolated and mechanically separated into small tissue pieces, as previously described[26, 28]. The morphological structure of the tumor tissue was observed by performing HE staining (Figure 1B and Figure 2A).
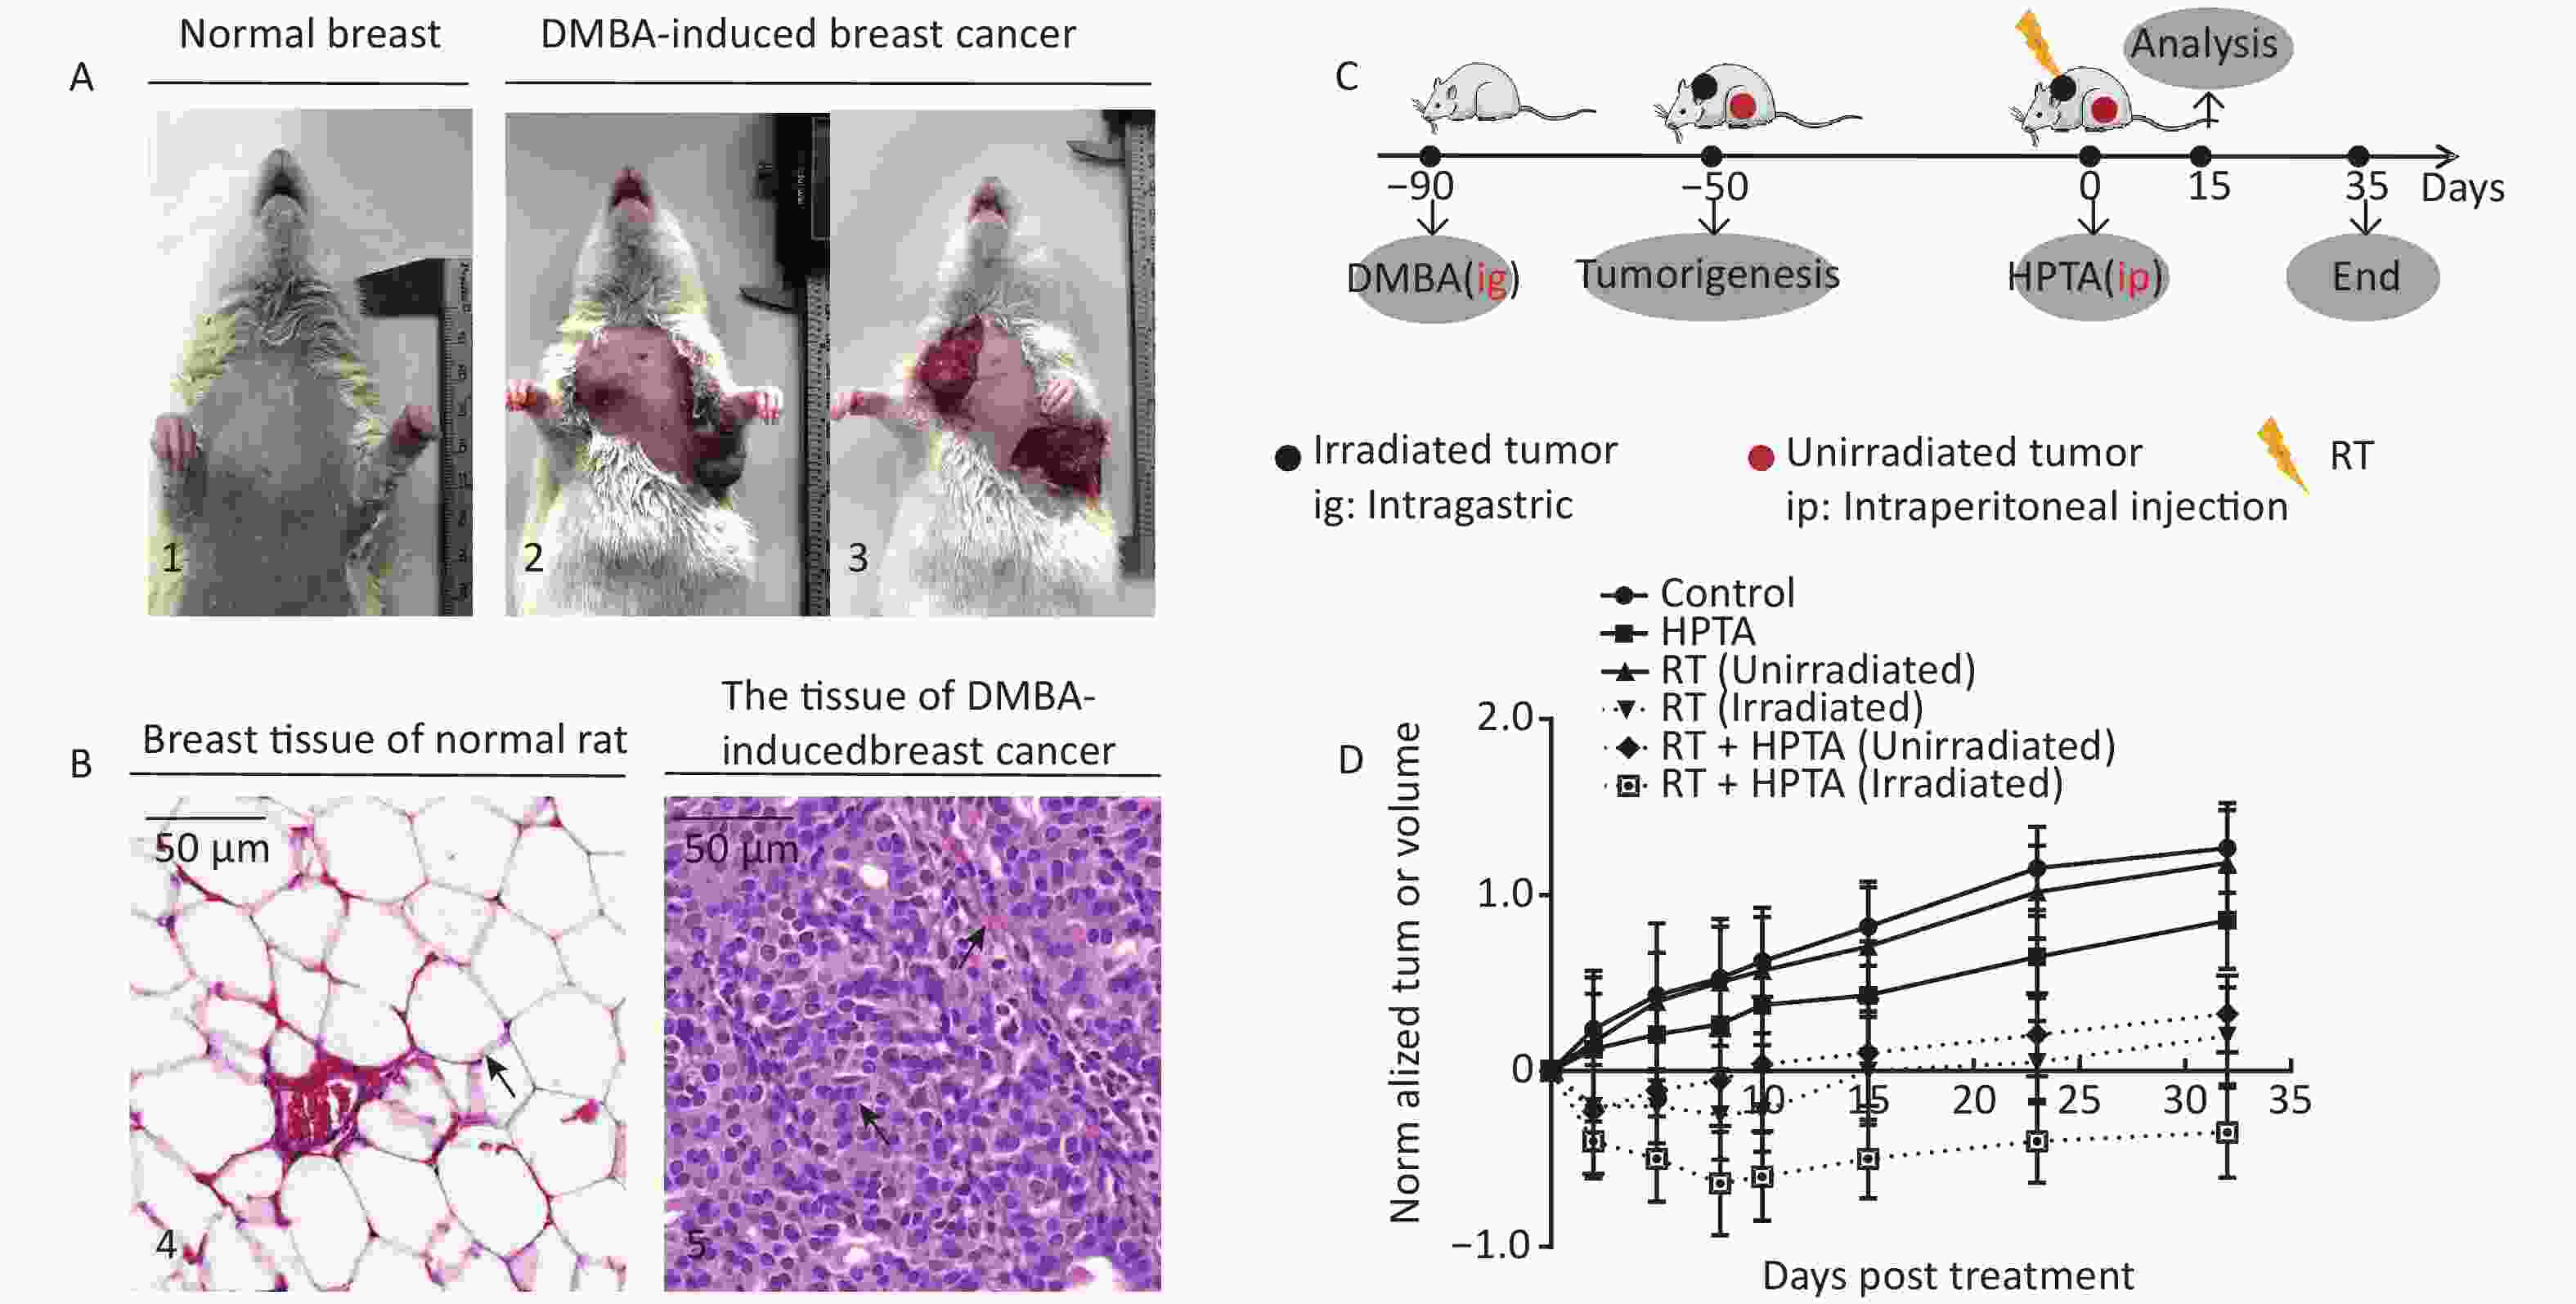
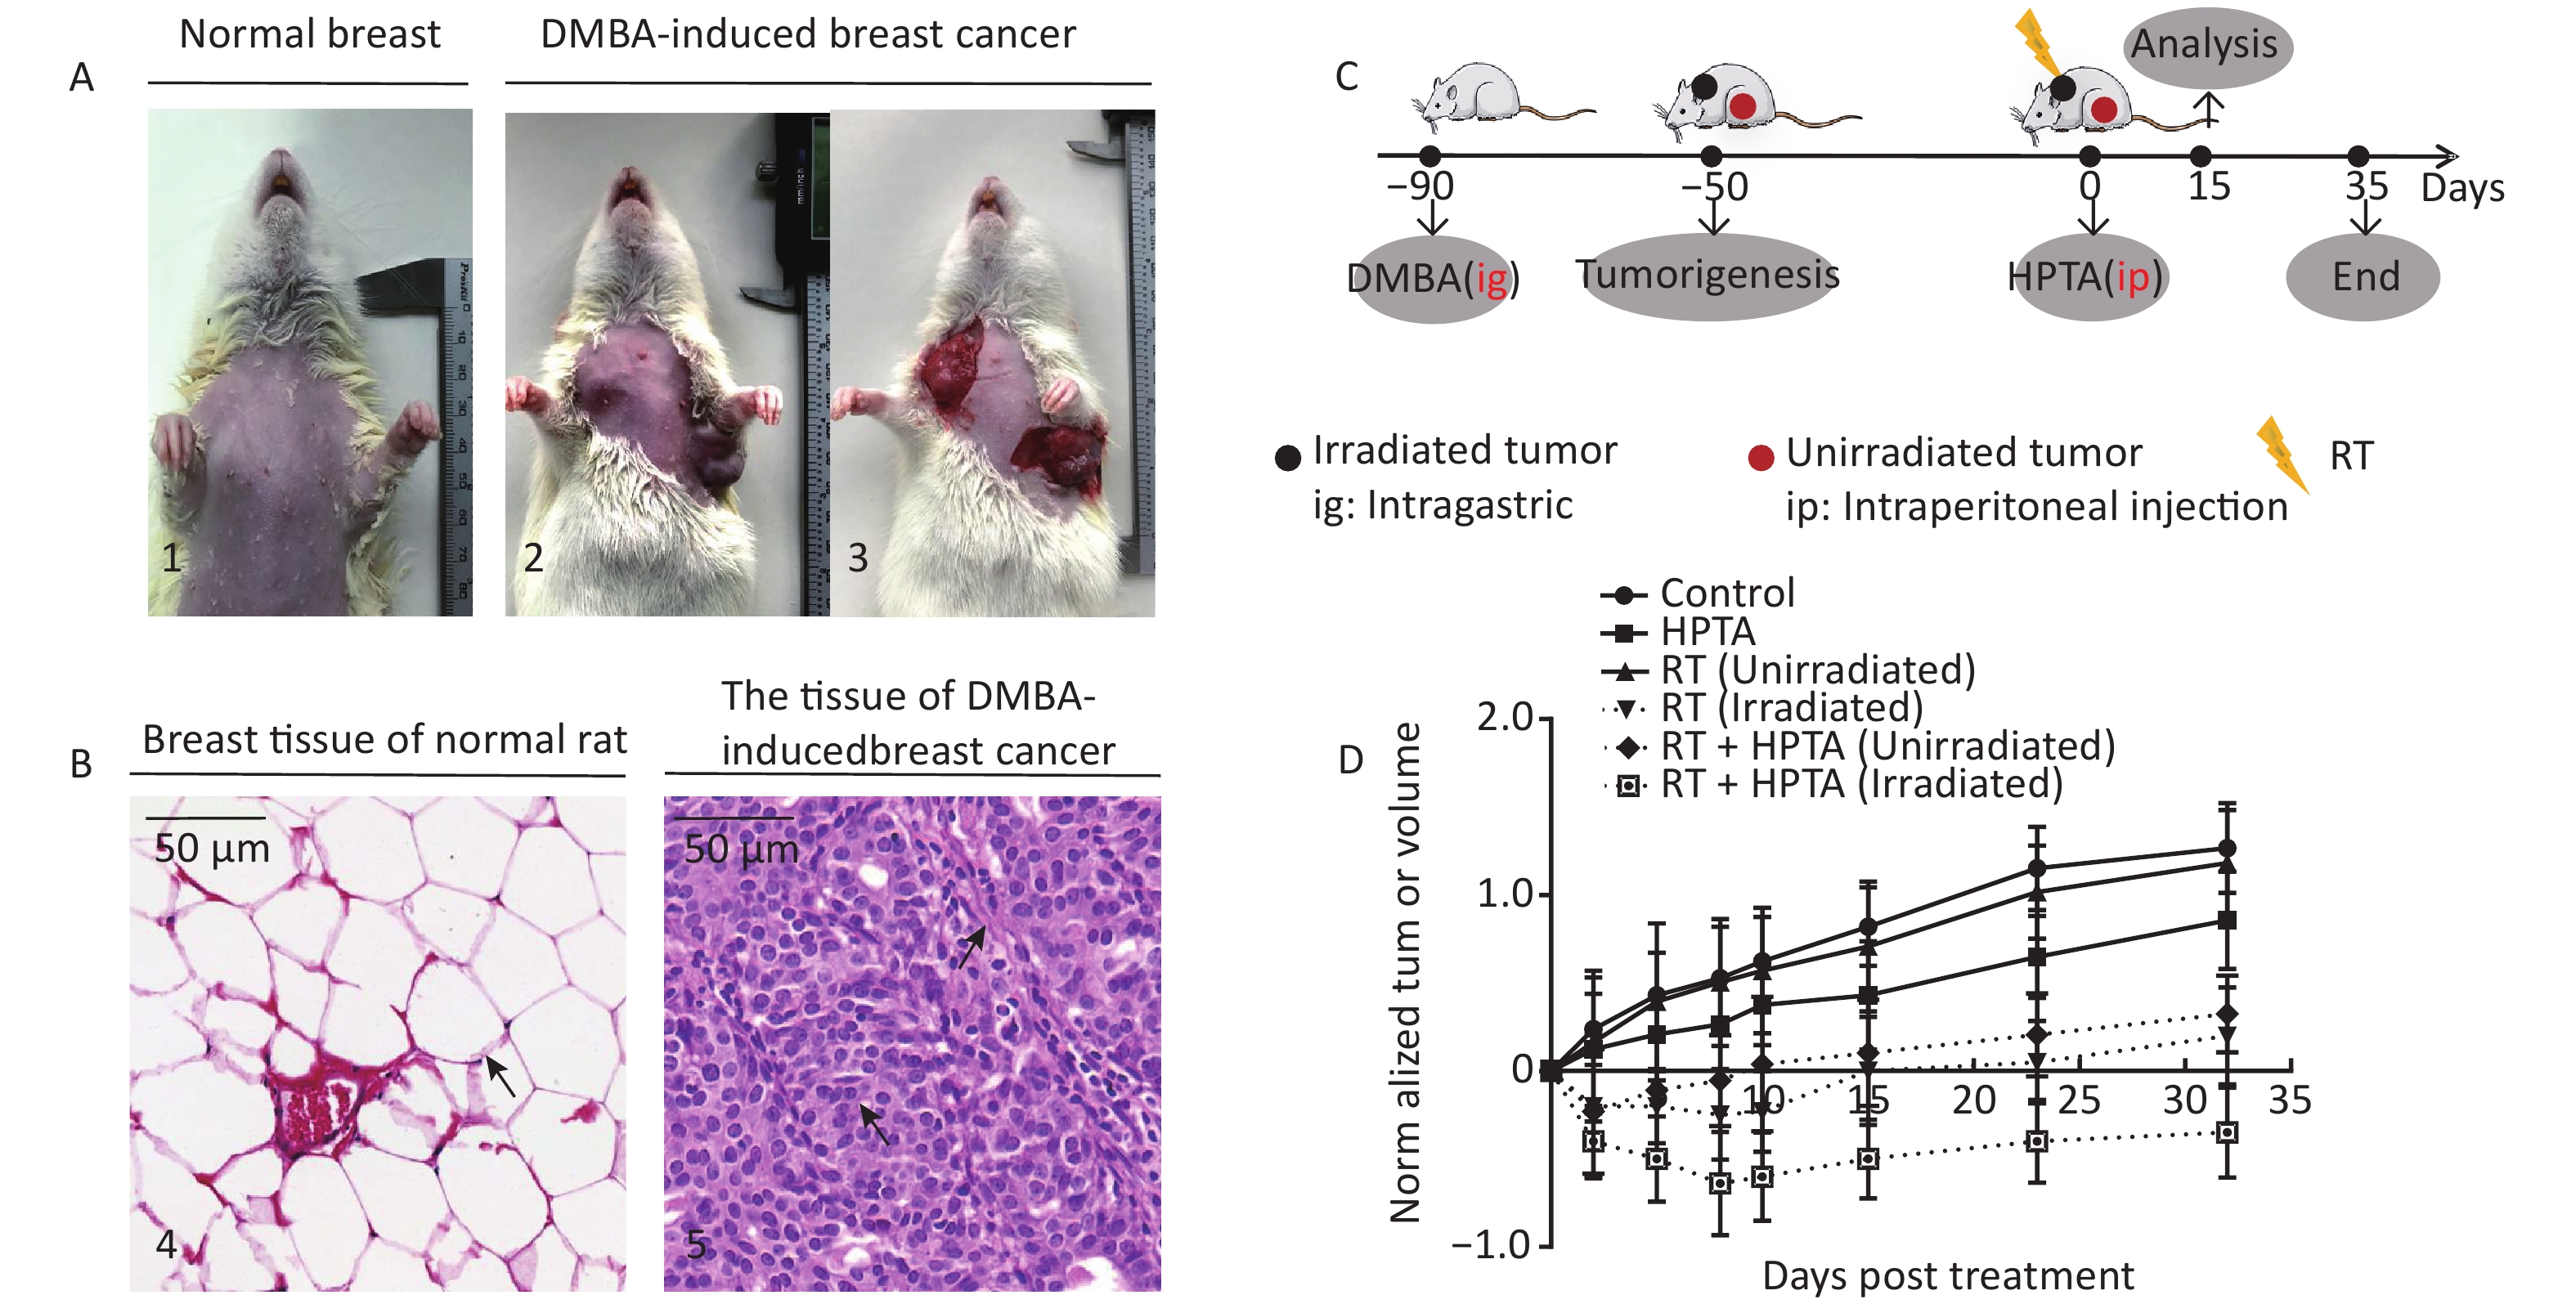
Figure 1. RT induces an abscopal effect in vivo when combined with HPTA. (A) Representative pictures of the normal breast tissue (1) and DMBA-induced breast cancer tissue established in rats (2 and 3). (B) The morphological structure of breast normal tissue (4) and DMBA-induced breast cancer tissue (5) by HE staining. The pathological changes are indicated by black arrows. (C) The schedule of the studies, including DMBA treatment, HPTA administration, RT treatment, and analysis. (D) The changes of the standardized tumor volume within 35 days after RT and HPTA treatment. Each data point in the graph was from three independent experiments (mean ± SD).
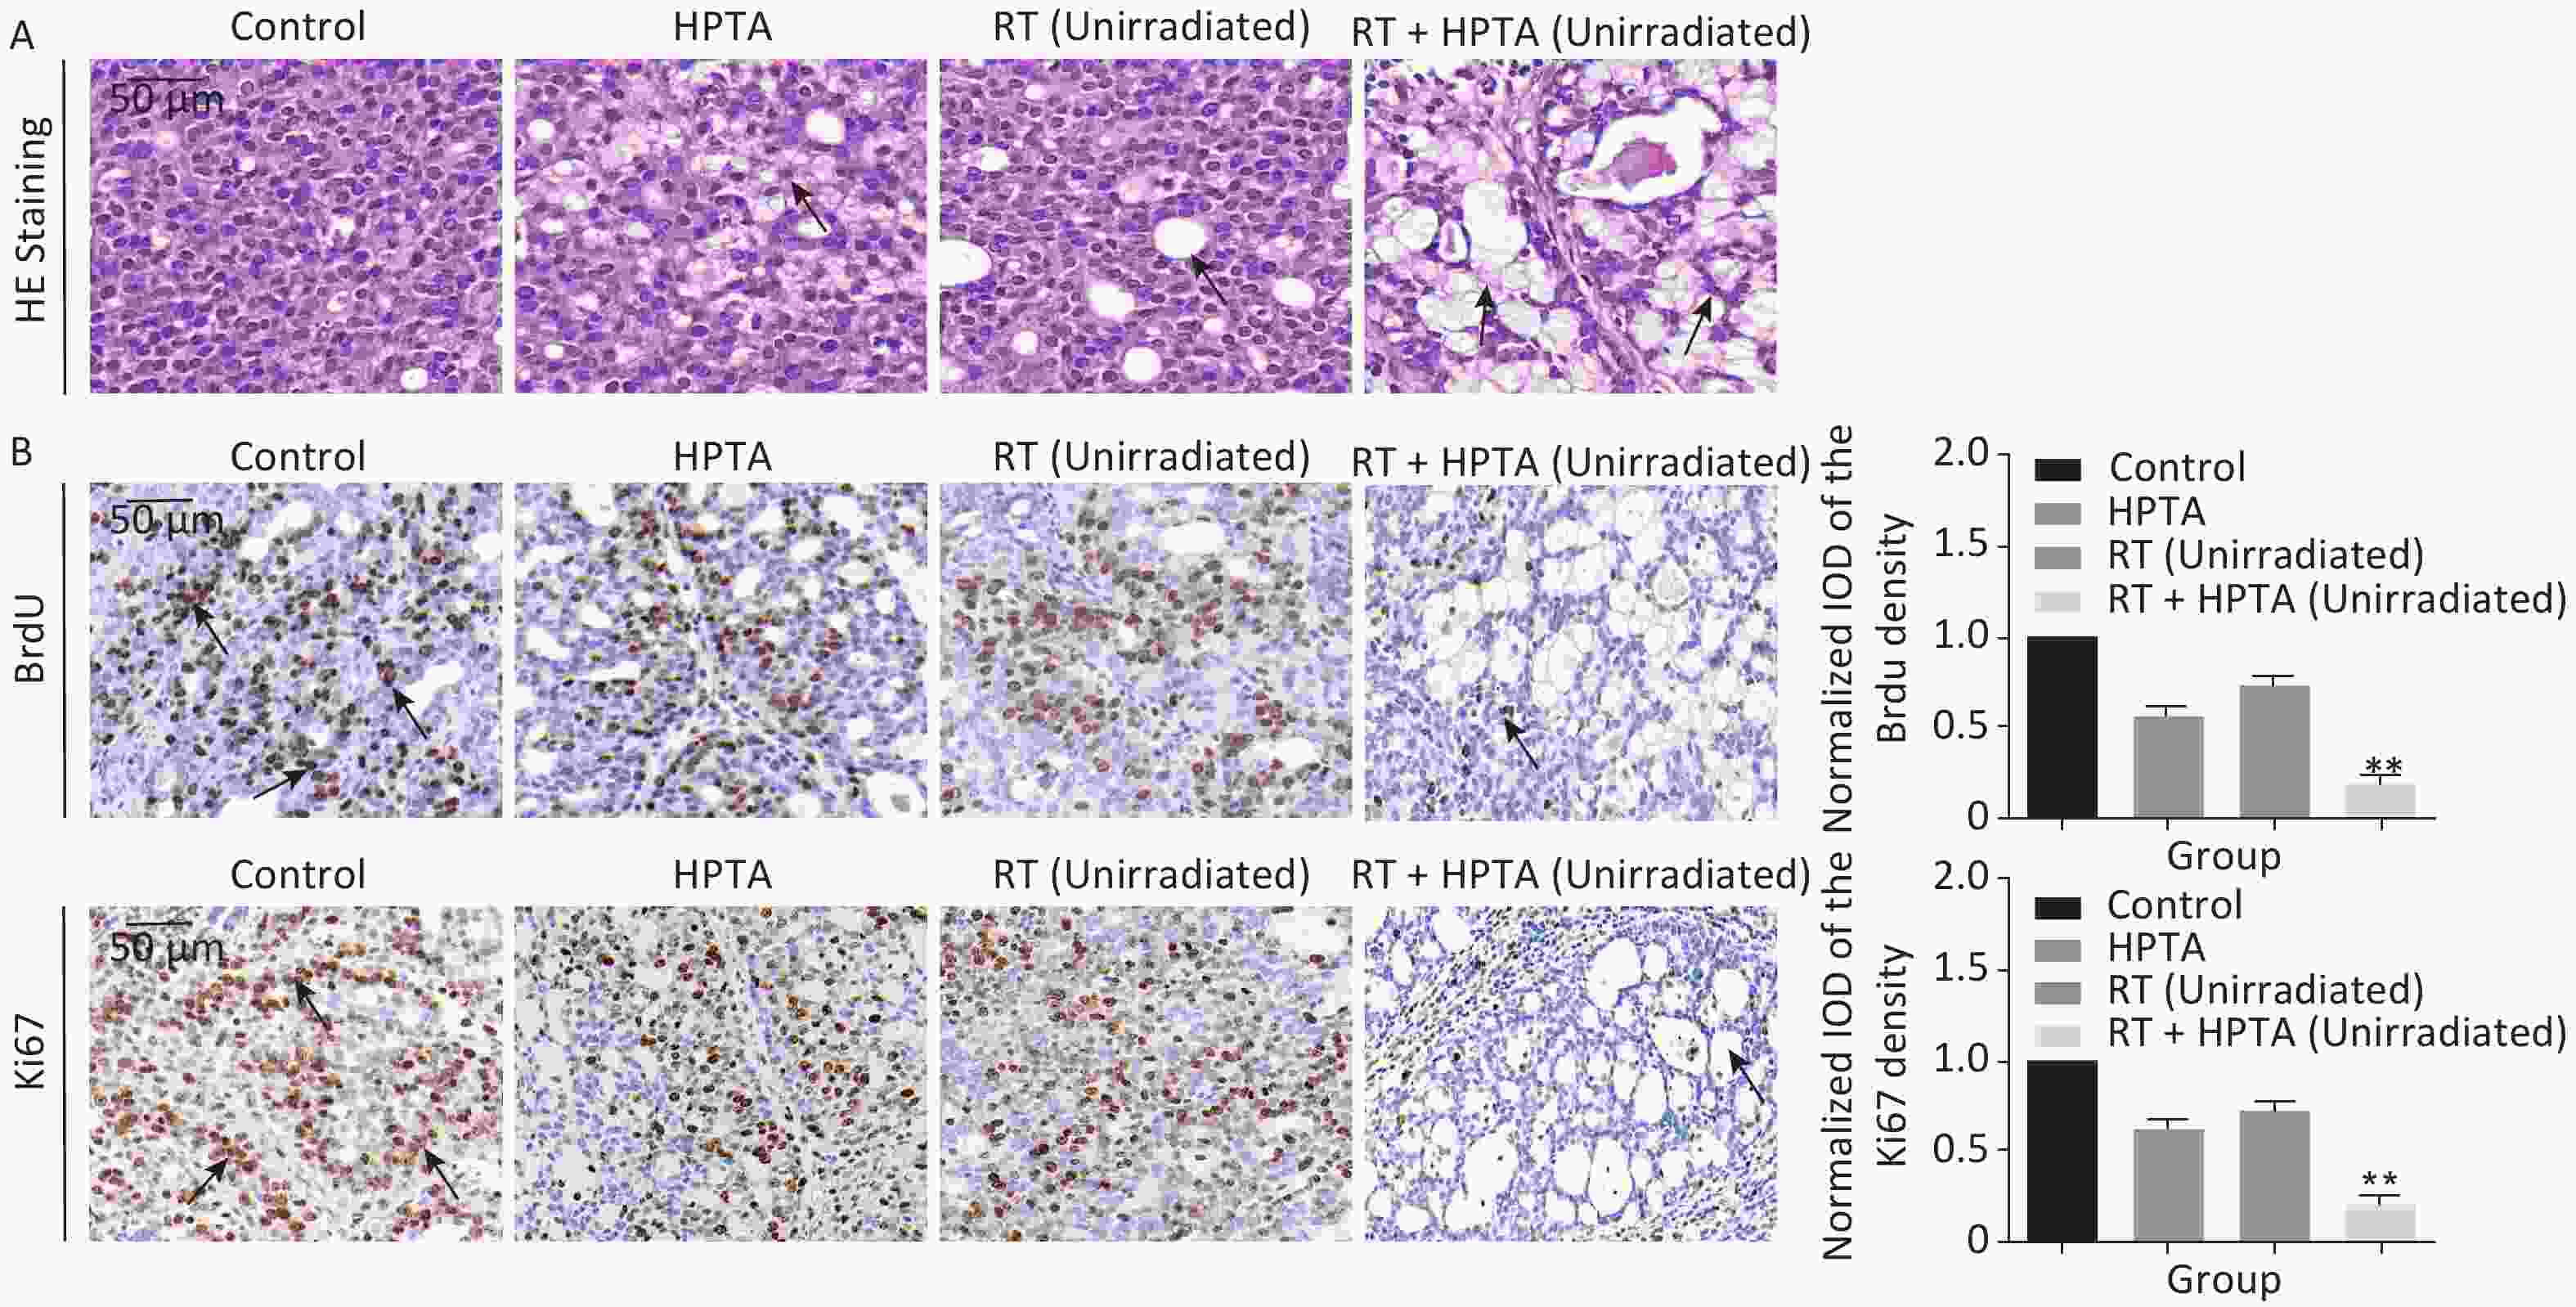
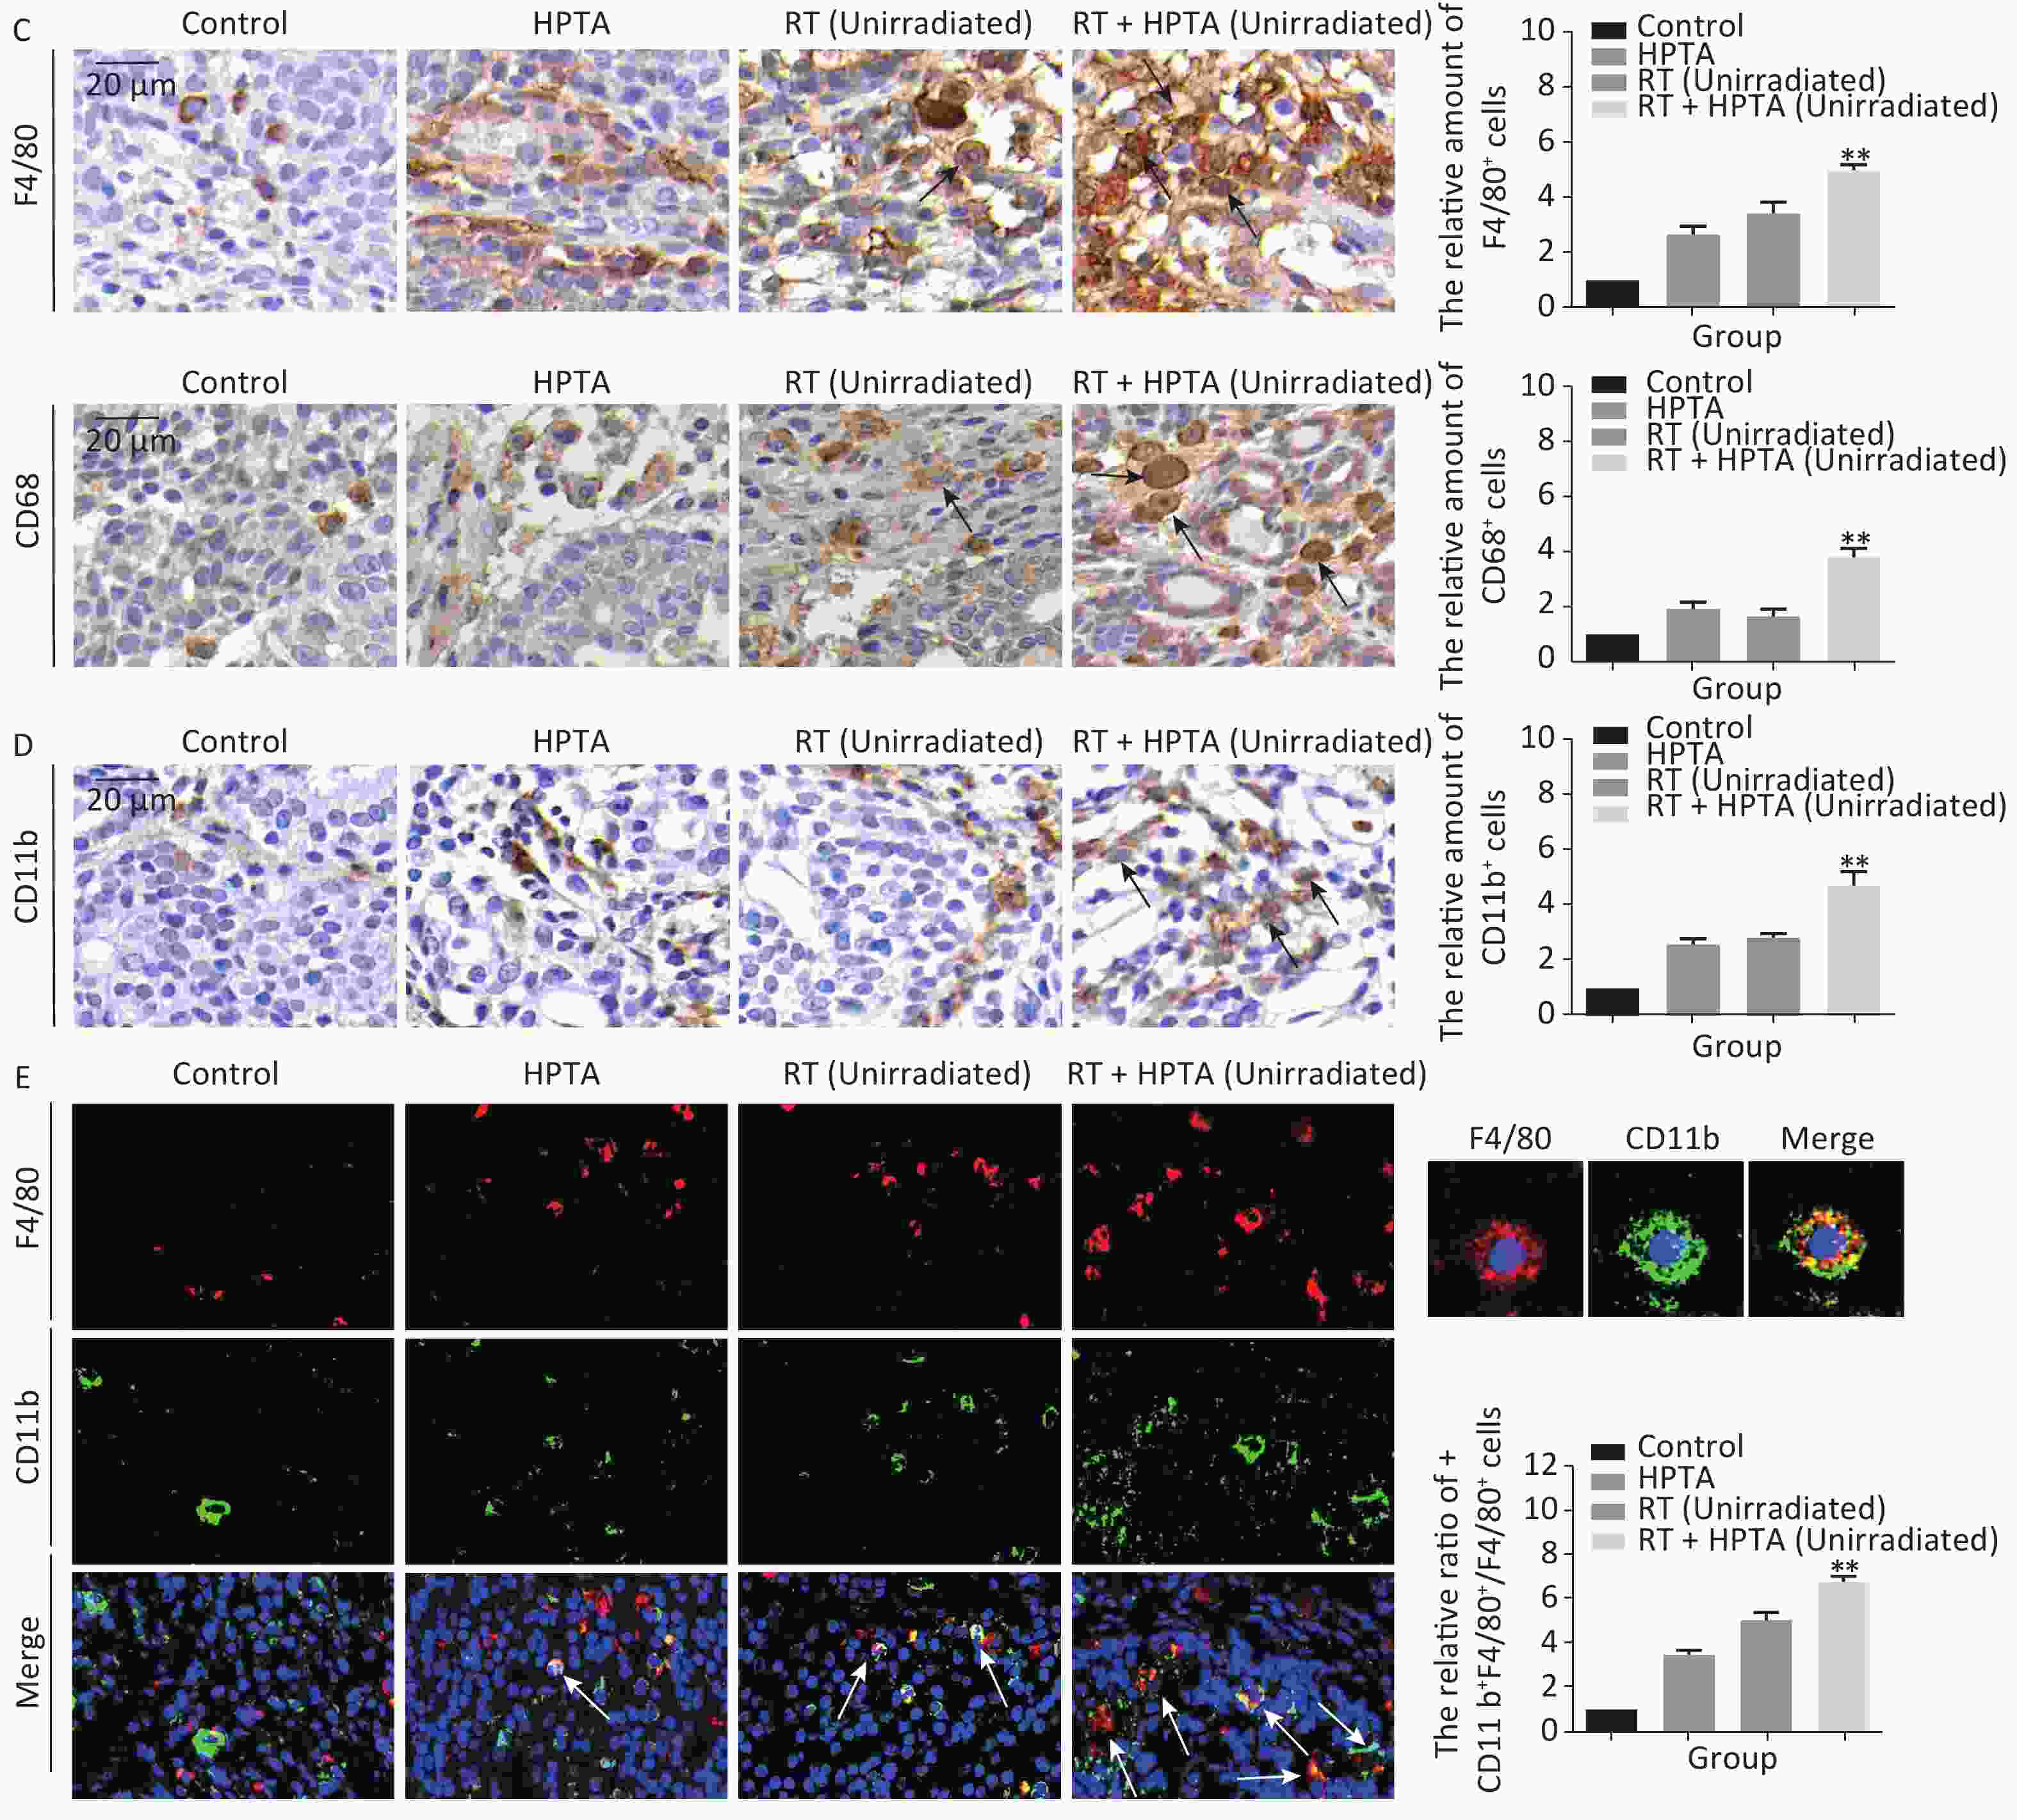
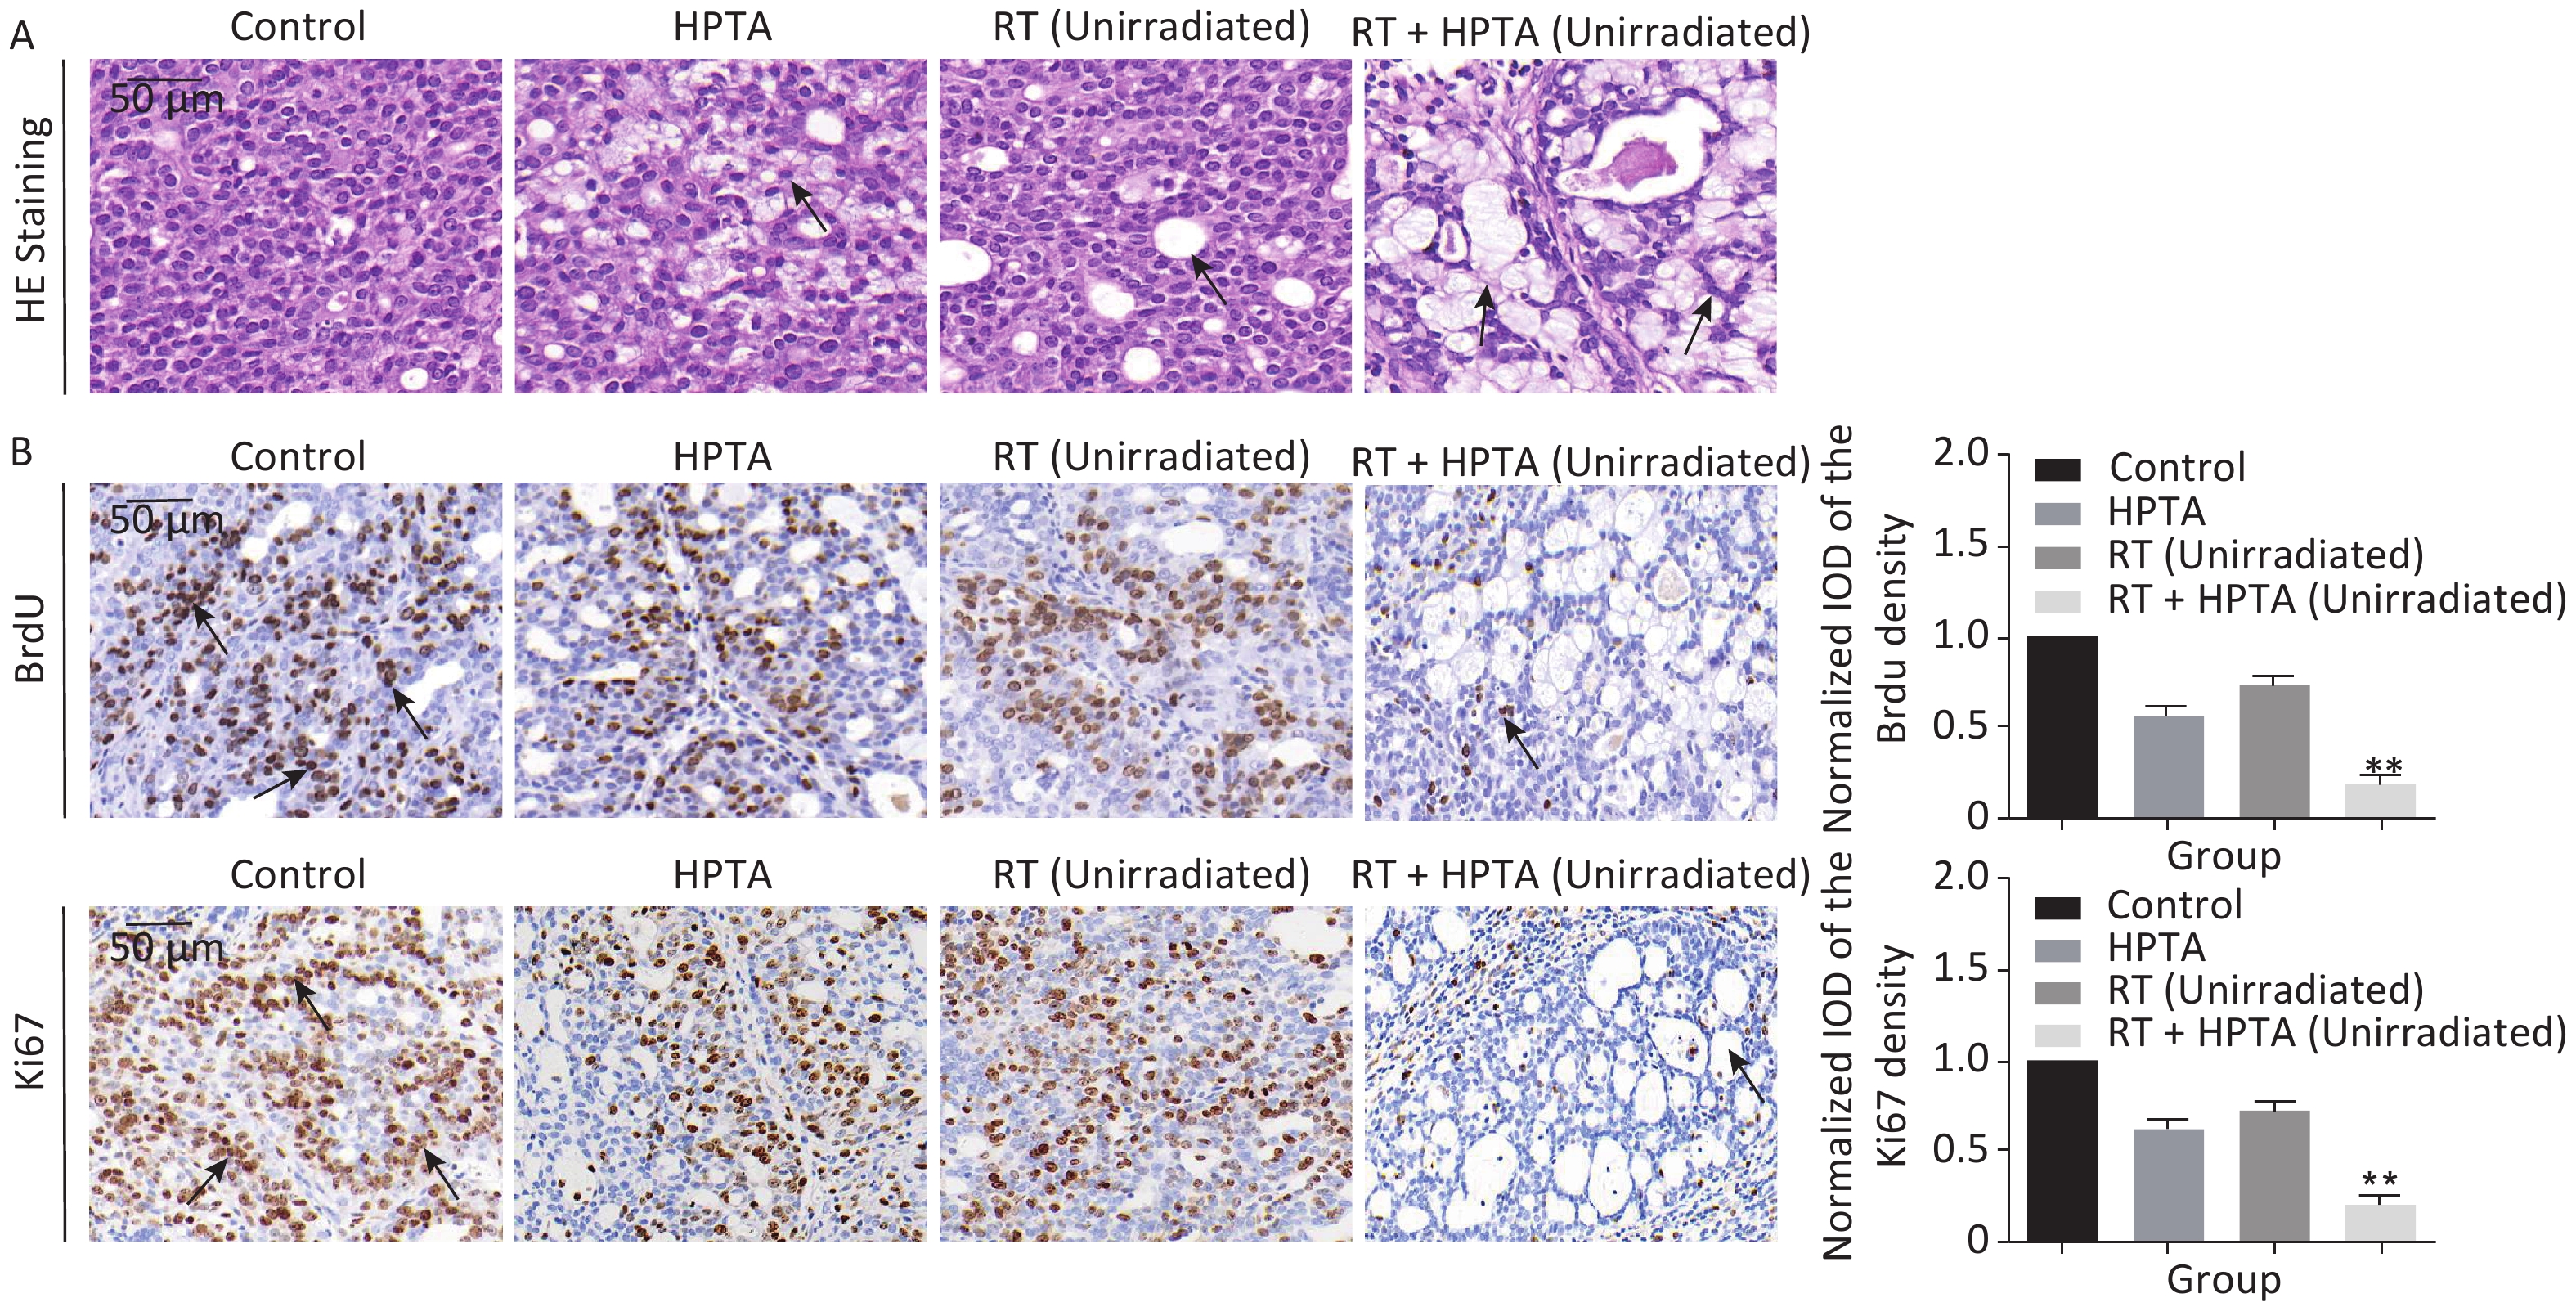
Figure 2. The combination of HPTA and RT can inhibit the proliferation of tumor cells and promote the infiltration of myeloid-derived macrophages. (A) The morphology of tumor tissues in the control, HPTA-only, RT-only, and RT + HPTA groups by HE staining. The pathological changes are marked with black arrows. (B) IHC analysis was performed using the markers BrdU and Ki67 to evaluate tumor proliferation and are presented in the photographs (left). The relative amount of BrdU and Ki67 positive cells was further quantified using Image-Pro Plus software by IOD, as shown in the graphs (right). The areas of immunostaining are indicated by black arrows. (C) IHC staining was performed using the specific cell markers F4/80 and CD68 and presented in the photographs (left). The macrophages are indicated by black arrows. The relative amount of F4/80 and CD68 positive cells was further quantified (right). (D) IHC staining was performed using the myeloid cell marker CD11b and the relative amount of CD11b positive cells was presented in the graph (right). (E) Co-staining of immunofluorescence with the markers CD11b and F4/80 was performed to identify infiltrated myeloid-derived F4/80+ macrophages (left). Co-localization was observed in the merged pictures (marked with white arrows). The ratio of myeloid-derived F4/80+ in total F4/80+ macrophages is shown in the graph (right). The data in the graph were obtained from three independent experiments (mean ± SD, *P < 0.05, **P < 0.01).
-
The resected tumors were fixed in 10% formalin overnight, embedded in paraffin, and sectioned. The sections were dewaxed with xylene and hydrated using a graded series of ethanol solutions from 100% to 75% ethanol. Antigen exposure was conducted by heating the sections in 10 mmol/L sodium citrate buffer for 20 min at a water bath temperature of 92 °C. The sections were cooled and incubated in 3% hydrogen peroxide for 15 min at room temperature. Antigen blocking was carried out by incubating with 10% goat serum for 1 h and then staining in block buffer containing primary antibody diluted in TBS with 1% BSA overnight at 4 °C in the dark. The primary antibodies used were: anti-BrdU (BD, 0029341, 1:50), anti-Ki67 (Cell Signaling, 12202S, 1:400), anti-F4/80 [BioLegend, 123102, 1:100 (IHC), 1:300 (IF)], anti-CD68 (Servicebio, GB11067, 1:1000), anti-CD11b antibody [Abcam, ab133357, 1:4000(IHC), 1:1000(IF)], anti-CD86 [Invitrogen, 3100F4A7, 1:100(IHC, IF)], anti-CD31 [Servicebio, GB12063, 1:200(IF)], and anti-CD34 [Santa Cruz Biotechnology, Sc-74499, 1:100(IF)]. The secondary antibodies used were: goat anti-rabbit IgG (1:300, BA-1000, Vector), goat anti-mouse IgG (1:300, BA-9200, Vector), and goat anti-rat IgG (1:300, BA-9400, Vector). IHC quantitation was performed using Image-Pro Plus 4.5 software (Media Cybrenetics, Silver Spring, USA) and expressed by integral optical density (IOD).
Immunofluorescence method is detailed elsewhere[26]. The secondary antibodies used were: Alexa Fluor 488 goat anti-rabbit IgG (Molecular Probes, 34732A, 1:300), Alexa Fluor 594 chicken anti-rat lgG (Invitrogen, 479145, 1:300), Alexa Fluor 488 goat anti-mouse IgG (Invitrogen, 2066710, 1:300), and Alexa Fluor 594 goat anti-mouse IgG (Invitrogen, 419361, 1:300).
-
The Quantitative real-time PCR is described in detail elsewhere[33]. The primer pairs listed in Table 2 were used for the amplification of target genes.
Name Primer pairs (5′-3′) GAPDH F: AGTGCCAGCCTCGTCTCATA R: GATGGTGATGGGTTTCCCGT CD86 F: AAGCCCGTGTCCTTGATCTG R: AGACATGTGTAACCTGCACCAT CD163 F: AGCATGGCACAGGTCATTCA R: GGTCACAAAACTTCAACCGGA iNOS F: GAGACGCACAGGCAGAGGTTG R: AGCAGGCACACGCAATGATGG Arg-1 F: TGGACCCTGGGGAACACTAT R: GTAGCCGGGGTGAATACTGG IL-6 F: ACTTCCAGCCAGTTGCCTTCTTG R: TGGTCTGTTGTGGGTGGTATCCTC IL-10 F: CTGCTCTTACTGGCTGGAGTGAAG R: TGGGTCTGGCTGACTGGGAAG IL-12 F: CCTCAAGTTCTTCGTCCGCATCC R: CATTGGACTTCGGCAGAGGTCTTC IFN-γ F: CCTCAAGTTCTTCGTCCGCATCC R: CACCGACTCCTTTTCCGCTTCC TNF-α Forward: ATGGGCTCCCTCTCATCAGTTCC R: GCTCCTCCGCTTGGTGGTTTG TGF-β F: GACCGCAACAACGCAATCTATGAC R: CTGGCACTGCTTCCCGAATGTC Table 2. Primer pairs used for amplification
-
The detailed method for western blot analysis is described elsewhere[34]. The expression of iNOS, Arg-1 and IFN-γ protein was detected by western blotting. The primary antibodies used were: anti-iNOS (Servicebio, GB11119, 1:1,000), anti-Arginase-1 (Cell Signaling, #93668, 1:1,000), anti-GAPDH (ZSGB-Bio, TA-08, 1:2,000), and anti-IFN-γ (Bioss, bs-0480R, 1:500). The secondary antibodies were: goat anti-rabbit IgG (H+L) (Thermo Fisher, 31460, 1:5,000) and goat anti-mouse IgG (H+L) (Thermo Fisher, 31430, 1:5,000). The density of the protein bands was quantified using ImageJ software.
-
Experimental analysis was performed using SPSS software (version 20.0; Chicago, IL, USA). Data were expressed as mean ± standard deviation (SD) and were analyzed using GraphPad Prism version 6. The differences between groups were determined by one-way analysis of variance (ANOVA). P < 0.05, or P < 0.01, indicated a statistically significant difference.
-
The DMBA-induced breast cancer model was established as shown in Figure 1A. Mammary tumors began to develop approximately 40 days after DMBA administration. The morphological structure of the DMBA-induced breast tumor tissue was observed by HE staining, We observed a small number of mammary ducts and the intact acinus in normal breast tissues, while a high volume of dysregulated epithelial hyperplasia and interstitial fibrosis was observed in the tumor tissue (Figure 1B, marked with black arrows), indicating that mammary carcinoma in rats was successfully induced by DMBA. Next, the rats bearing two or more tumors distantly located from the primary irradiated tumor site were selected and randomly assigned to four different groups (ten rats in each group; Figure 1C): control (without any treatment), HPTA (HPTA alone, 20 mg/kg per day), RT (RT alone, 8 Gy with a dose fractionation of 2 Gy per time in a day), and RT + HPTA groups (with HPTA and RT treatment). As shown in Figure 1D, HPTA administration alone delayed the growth of the tumor as compared to the control group (P < 0.05), and RT caused a significant growth delay in the irradiated tumor (P < 0.01) but had no effect on the unirradiated tumors. RT combined with HPTA showed a significant effect on the irradiated tumor growth, resulting in tumor inhibition compared to RT alone (P < 0.0001). Importantly, the growth of unirradiated tumors in the RT + HPTA combination group was also significantly inhibited as compared to the corresponding RT-only group (P < 0.01). The results indicated that HPTA can stimulate RT-induced abscopal effects by inhibiting unirradiated tumor growth.
-
Since it was found that unirradiated tumor growth in the combination group was inhibited, we further investigated the growth ability of the tumor cells. First, by HE staining (Figure 2A), in the control group, we observed abnormal hyperplasia with a large number of malignant cells and interstitial fibrosis. There were only a few cavities in the tumor tissue in the RT group, which was not significantly different from that in the control group. HPTA administration alone caused a small amount of cavity necrosis, whereas significant vacuole necrosis was observed in the RT + HPTA group, indicating that combined treatment with HPTA and RT can result in significant necrosis of tumor tissue. Next, we investigated whether HPTA in combination with RT can affect the proliferation ability of tumor cells using two markers of proliferation, BrdU and Ki67. As shown in Figure 2B, a large number of proliferative cells in the tumor tissue appeared in the control group, along with a decrease in the HPTA-only and RT-only groups (P < 0.05). HPTA combined with RT resulted in a more significant decrease in the number of proliferative cells in unirradiated tumors (P < 0.01).
Recently, a study demonstrated that a class IIa HDACi, TMP195, could suppress tumor proliferation by stimulating and recruiting macrophages to infiltrate the tumor tissue[27]; therefore, we further investigated whether this distant tumor cell reduction was associated with the change of the macrophages in the local tumor microenvironment. Macrophage-specific markers F4/80 and CD68 were used to observe the change in the TAMs in distant unirradiated tumors (Figure 2C). In the control group, there were a few macrophages in the tumor tissue, and more macrophages were found in the vacuole areas in the HPTA-only and RT-only groups (P < 0.05). However, there was an increase in the number of macrophages in the RT + HPTA group (P < 0.01), indicating that the combined treatment may effectively promote the recruitment and infiltration of macrophages to the tumor stroma to eliminate tumor cells.
TAMs primarily originate from myeloid monocytes released from bone marrow, then circulate in the bloodstream, and migrate to the tumor[35, 36]. Therefore, we examined the relationship between macrophages and myeloid monocytes to identify whether infiltrated macrophages were derived from the bone marrow. Using the myeloid cell marker CD11b, the results showed that RT combined with HPTA caused a significant increase in the number of CD11b+ monocytes (P < 0.01) compared to the other groups (Figure 2D). We next confirmed the result by co-staining with immunofluorescence with the markers CD11b and F4/80. The co-localization of both markers in the cells was observed (marked with white arrows; Figure 2E). The number of cells with both CD11b and F4/80 staining in the RT + HPTA group was significantly higher than that in the HPTA-only, RT-only, and control groups (P < 0.01). We observed a few F4/80+ macrophages without CD11b marker expression in each of the groups, indicating that not all macrophages were from the myeloid system; some may be tissue-resident macrophages involved in the immune microenvironment of the tumor[37]. In summary, our results showed that RT + HPTA can induce an increase in the population of infiltrated myeloid-derived TAMs into the tumor microenvironment, suggesting that infiltrated TAMs in unirradiated tumors may be responsible for the abscopal effect.
-
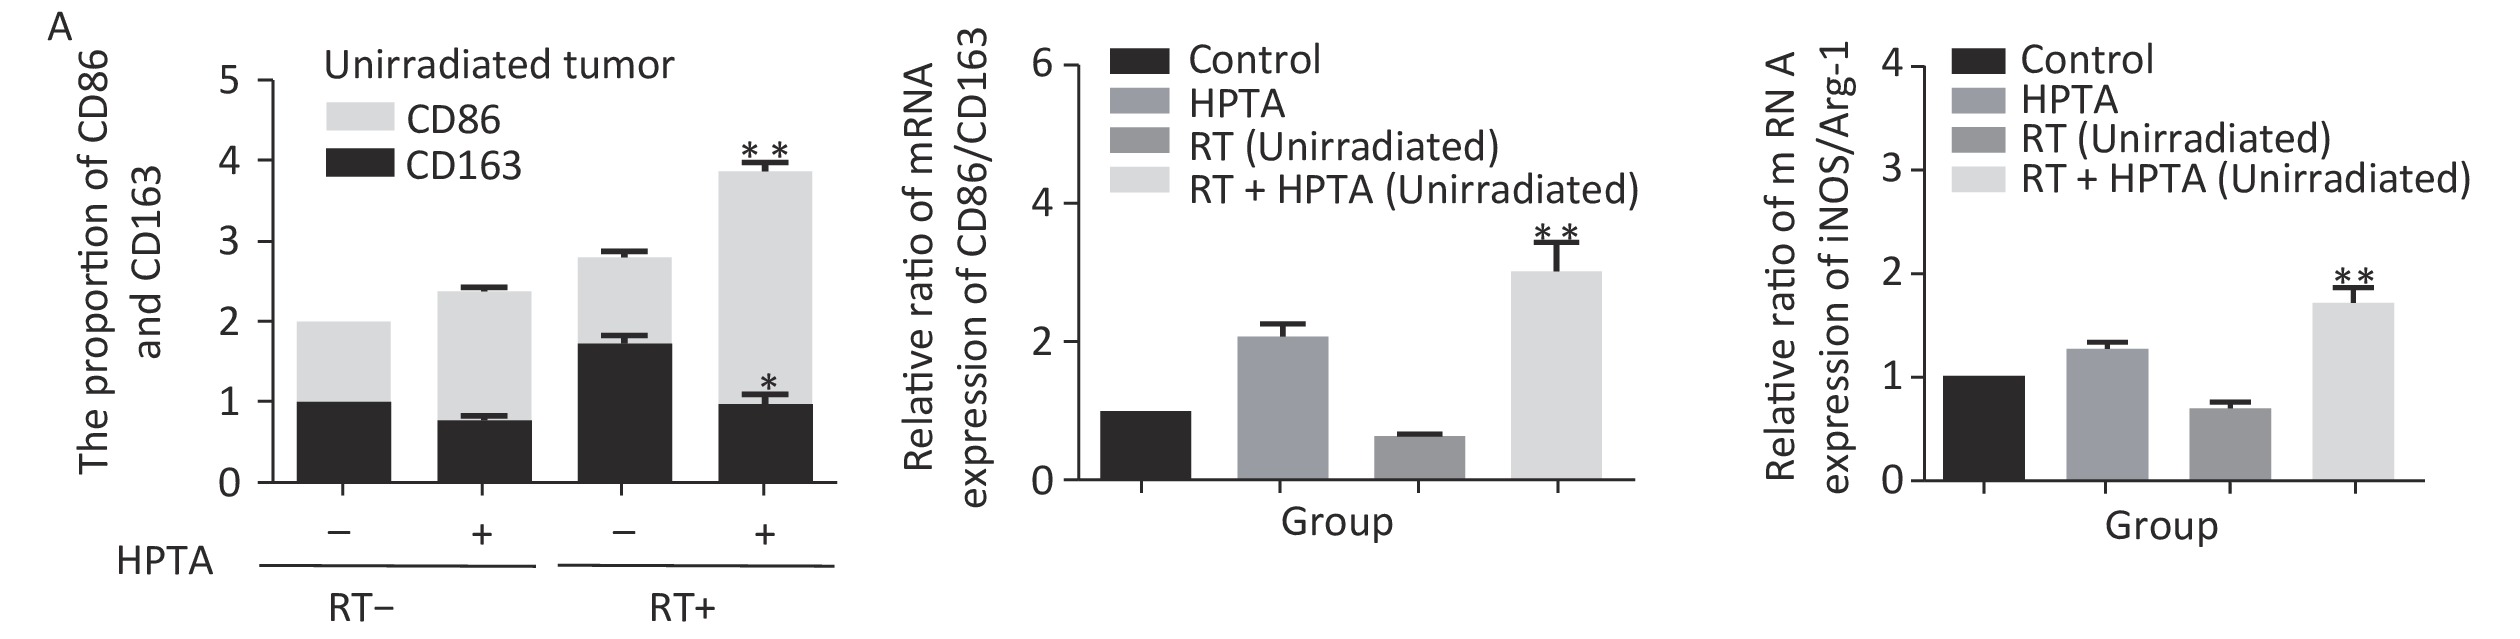
Our results showed that HPTA can promote the infiltration of myeloid-derived TAMs into distal unirradiated tumors. We next studied whether HPTA can regulate the polarization of TAMs, following RT, towards the anti-tumor M1 phenotype. We tested the relative mRNA expression of specific phenotypic and functional markers (CD86, CD163, iNOS, and Arg-1) of the M1 and M2 phenotype by qRT-PCR analysis. As shown in Figure 3A, we observed a decrease in CD86 expression in M1 TAMs in the RT-only group, and an increase in CD86 expression in response to HPTA treatment as compared to the control group. CD86 expression significantly increased in response to combined HPTA and RT treatments (P < 0.01). CD163 expression in M2 TAMs in the RT-only group was higher than that in the HPTA-only group. The combination of HPTA and RT significantly decreased CD163 expression (P < 0.05). The results demonstrated that combined treatment with HPTA and RT significantly increased M1 TAMs (CD86) and decreased M2 TAMs (CD163). The relative ratio of CD86/CD163 was significantly higher in the RT + HPTA group than in the HPTA-only, RT-only, and control groups. The results indicated that the combination of HPTA and RT increased the ratio of M1 to M2 TAMs.
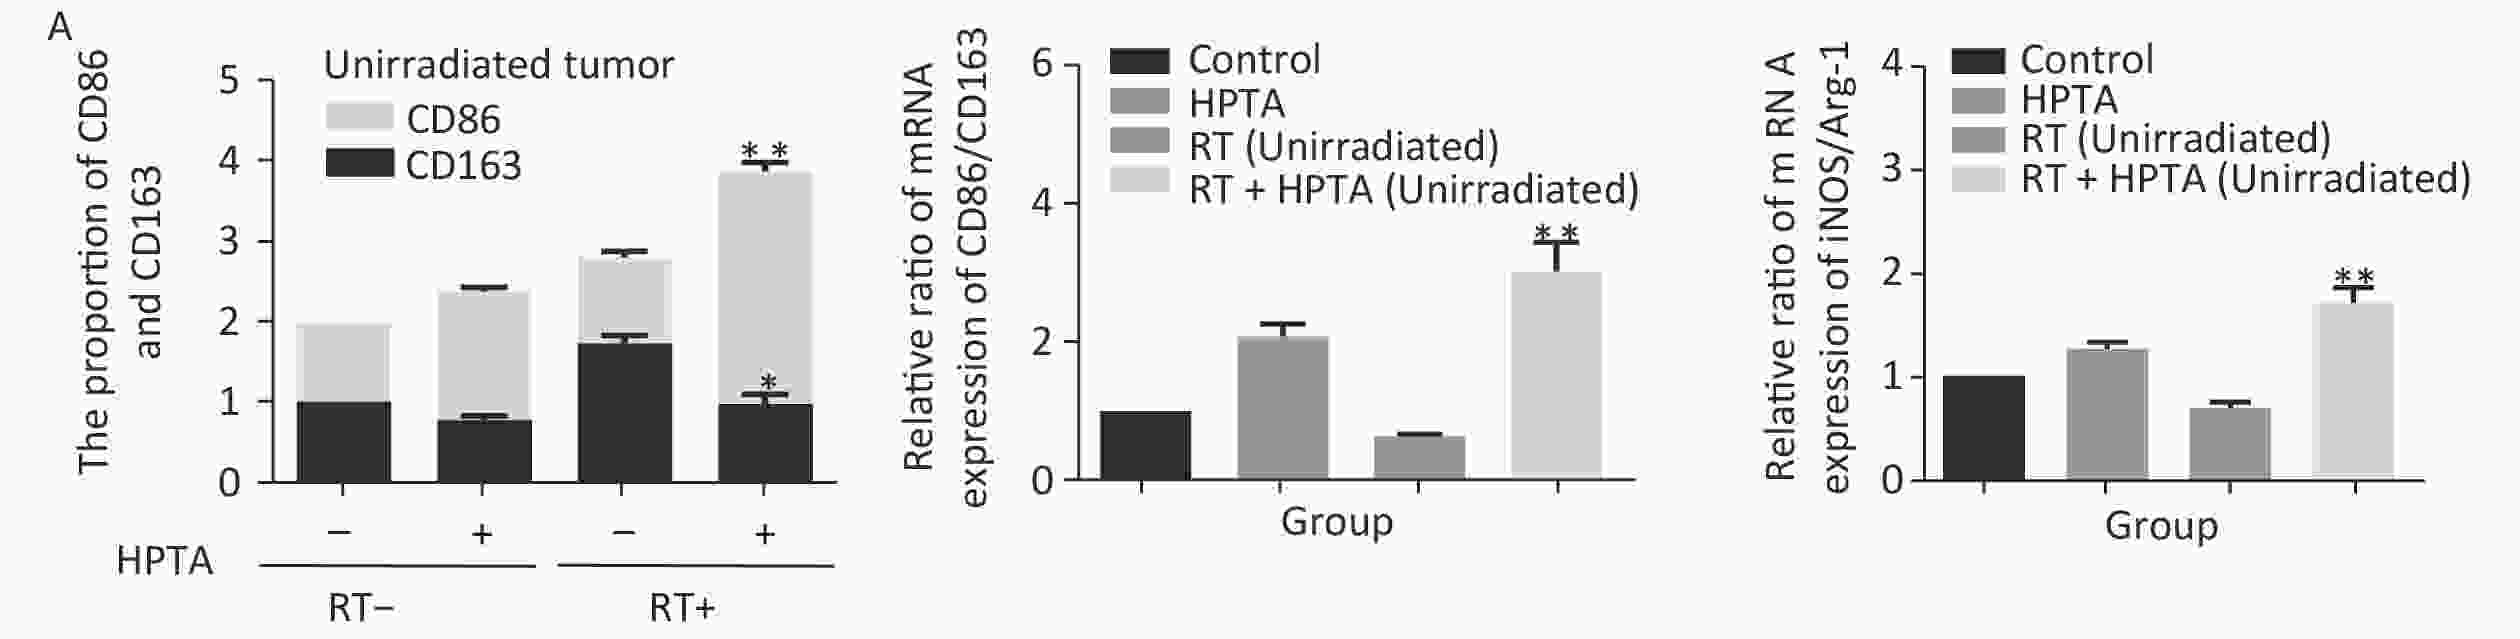
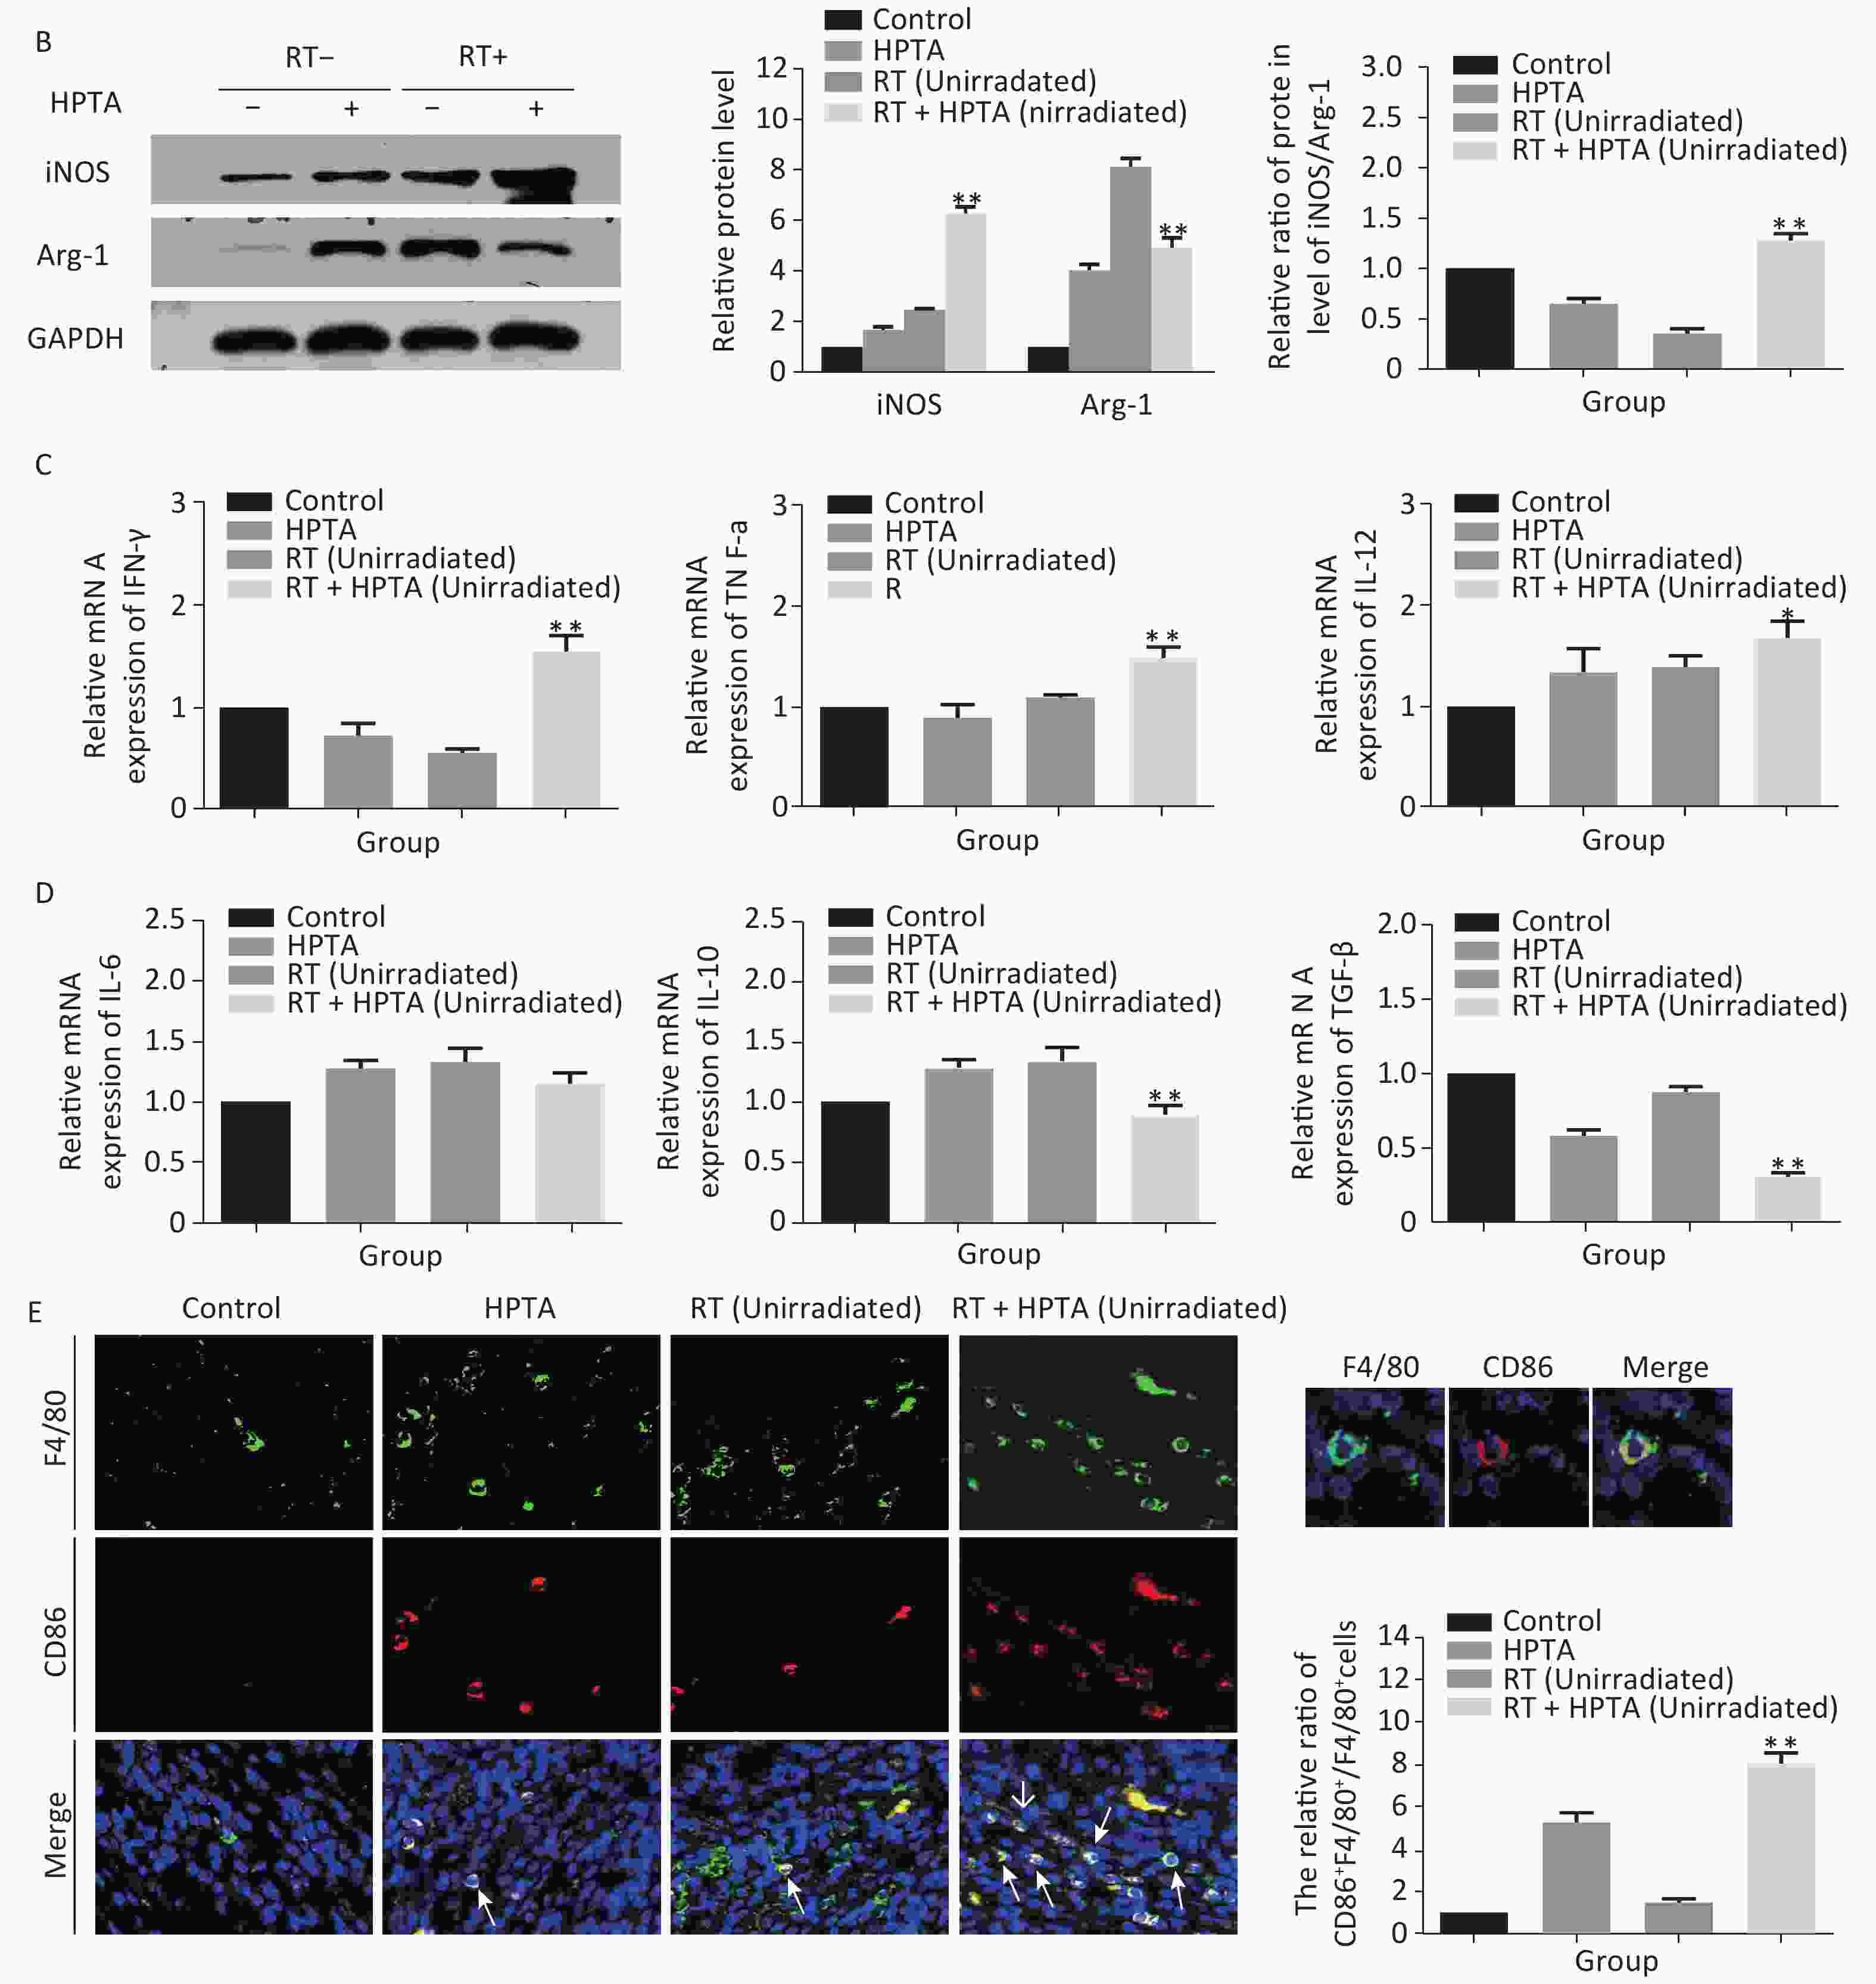
Figure 3. HPTA can modulate TAMs polarization from pro-tumor M2 to anti-tumor M1 macrophages. (A) The relative mRNA expression of M1 and M2 using the specific phenotypic and functional markers CD86, CD163, iNOS, and Arg-1 by RT-PCR analysis. (B) The protein expression level of iNOS and Arg-1 in tumor tissues was detected by western blot (left). The relative protein level was further analyzed using Image-J, as shown in the graphs (right). (C) The expression of inflammatory cytokines related to the M1-type macrophages activity TNF-α, IFN-γ, and IL-12 was tested by qRT-PCR and presented in the graphs. (D) The graphs on the relative mRNA expression of IL-6, IL-10, and TGF-β related to M2 macrophage activity tested by qRT-PCR. (E) Co-staining of immunofluorescence with the F4/80 and CD86 markers was performed (left). The co-localization was observed in the photographs (marked with white arrows). The relative ratio of CD86+ /F4/80+ macrophages was presented in the graphs (right). Each data point was obtained from three independent experiments (mean ± SD, *P < 0.05, **P < 0.01).
The ratio of iNOS/Arg-1 mRNA expression showed the same trend as that of CD86/CD163 (Fi 3A; P < 0.01). We next analyzed the protein levels of iNOS and Arg-1 by western blotting (Figure 3B). The results showed that the protein levels of iNOS (M1) were higher and Arg-1 (M2) protein levels were lower in the RT + HPTA group than in the RT-only group (P < 0.01). The relative ratio of iNOS/Arg-1 increased in the treatment group (P < 0.01). The data confirmed that the combination of HPTA and RT increased the ratio of M1 to M2 TAMs, and suggested that HPTA could promote the reprogramming of TAMs from the M2 to M1 phenotype and mitigate the M2 TAM polarization induced by RT.
To further understand whether HPTA affected TAM-dependent immunomodulatory processes induced by RT in the tumor microenvironment, we quantified the cytokines associated with tumor-promoting TAM activity and protective anti-tumor immunity in the unirradiated tumor tissue using qRT-PCR analysis. In Figure 3D, we noted that compared with the RT-only group, we found that the cytokines related to M2 macrophage immune activity, TGF-β (P < 0.01) and IL-10 (P < 0.01), were significantly suppressed when HPTA was combined with RT. The decrease in IL-6 in the RT + HPTA group was not statistically significant. As shown in Figure 3C, the mRNA levels of cytokines associated with M1 macrophages, IFN-γ (P < 0.01), TNF-α (P < 0.01), and IL-12 (P < 0.05), were significantly increased in the RT + HPTA group as compared to the RT-only group.
Lastly, by co-staining with immunofluorescence with the F4/80 and CD86 markers, the proportion of M1 phenotype was further analyzed. As shown in Figure 3E, the co-localization was then observed (marked with white arrows). We observed very few infiltrated M1 phenotype macrophages in the RT-only group, whereas there was a significant increase in the proportion of the M1 phenotype in the RT + HPTA group (P < 0.01). The data further confirmed that HPTA reprogrammed TAM differentiation into the anti-tumor M1 phenotype and reversed the decrease in the M1/M2 macrophage ratio induced by RT, thereby enhancing the anti-tumor immune effect.
-
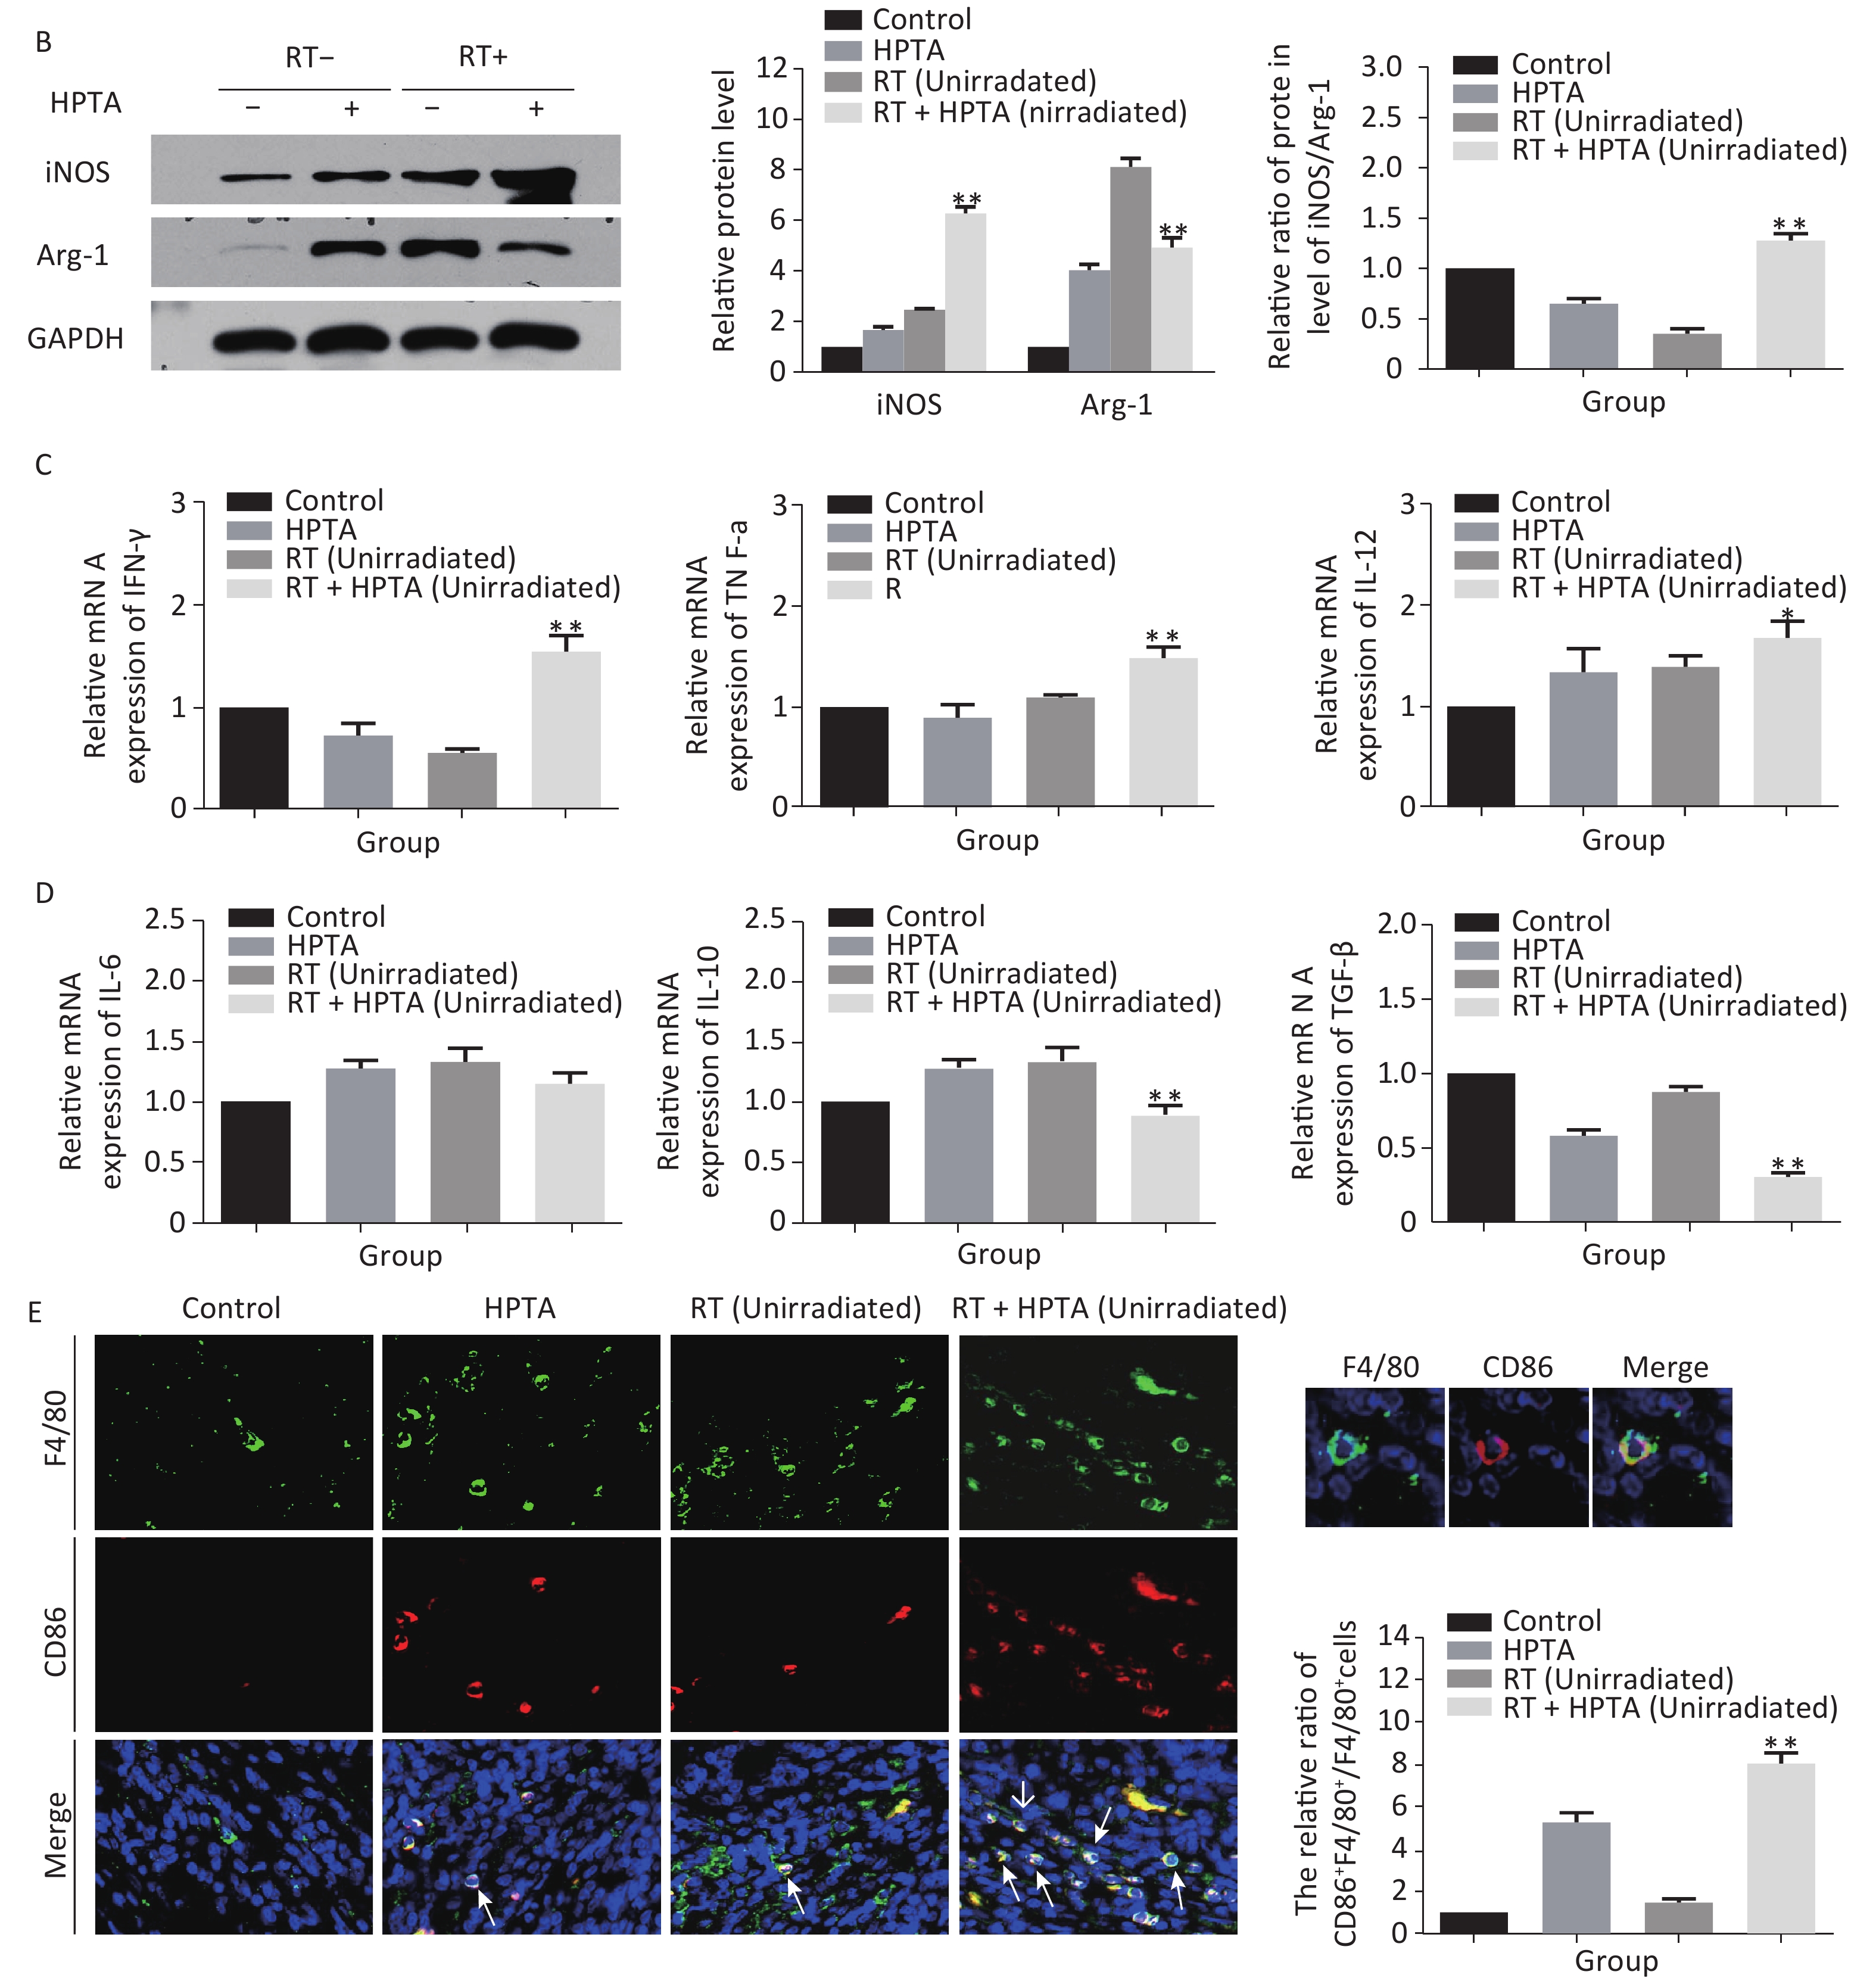
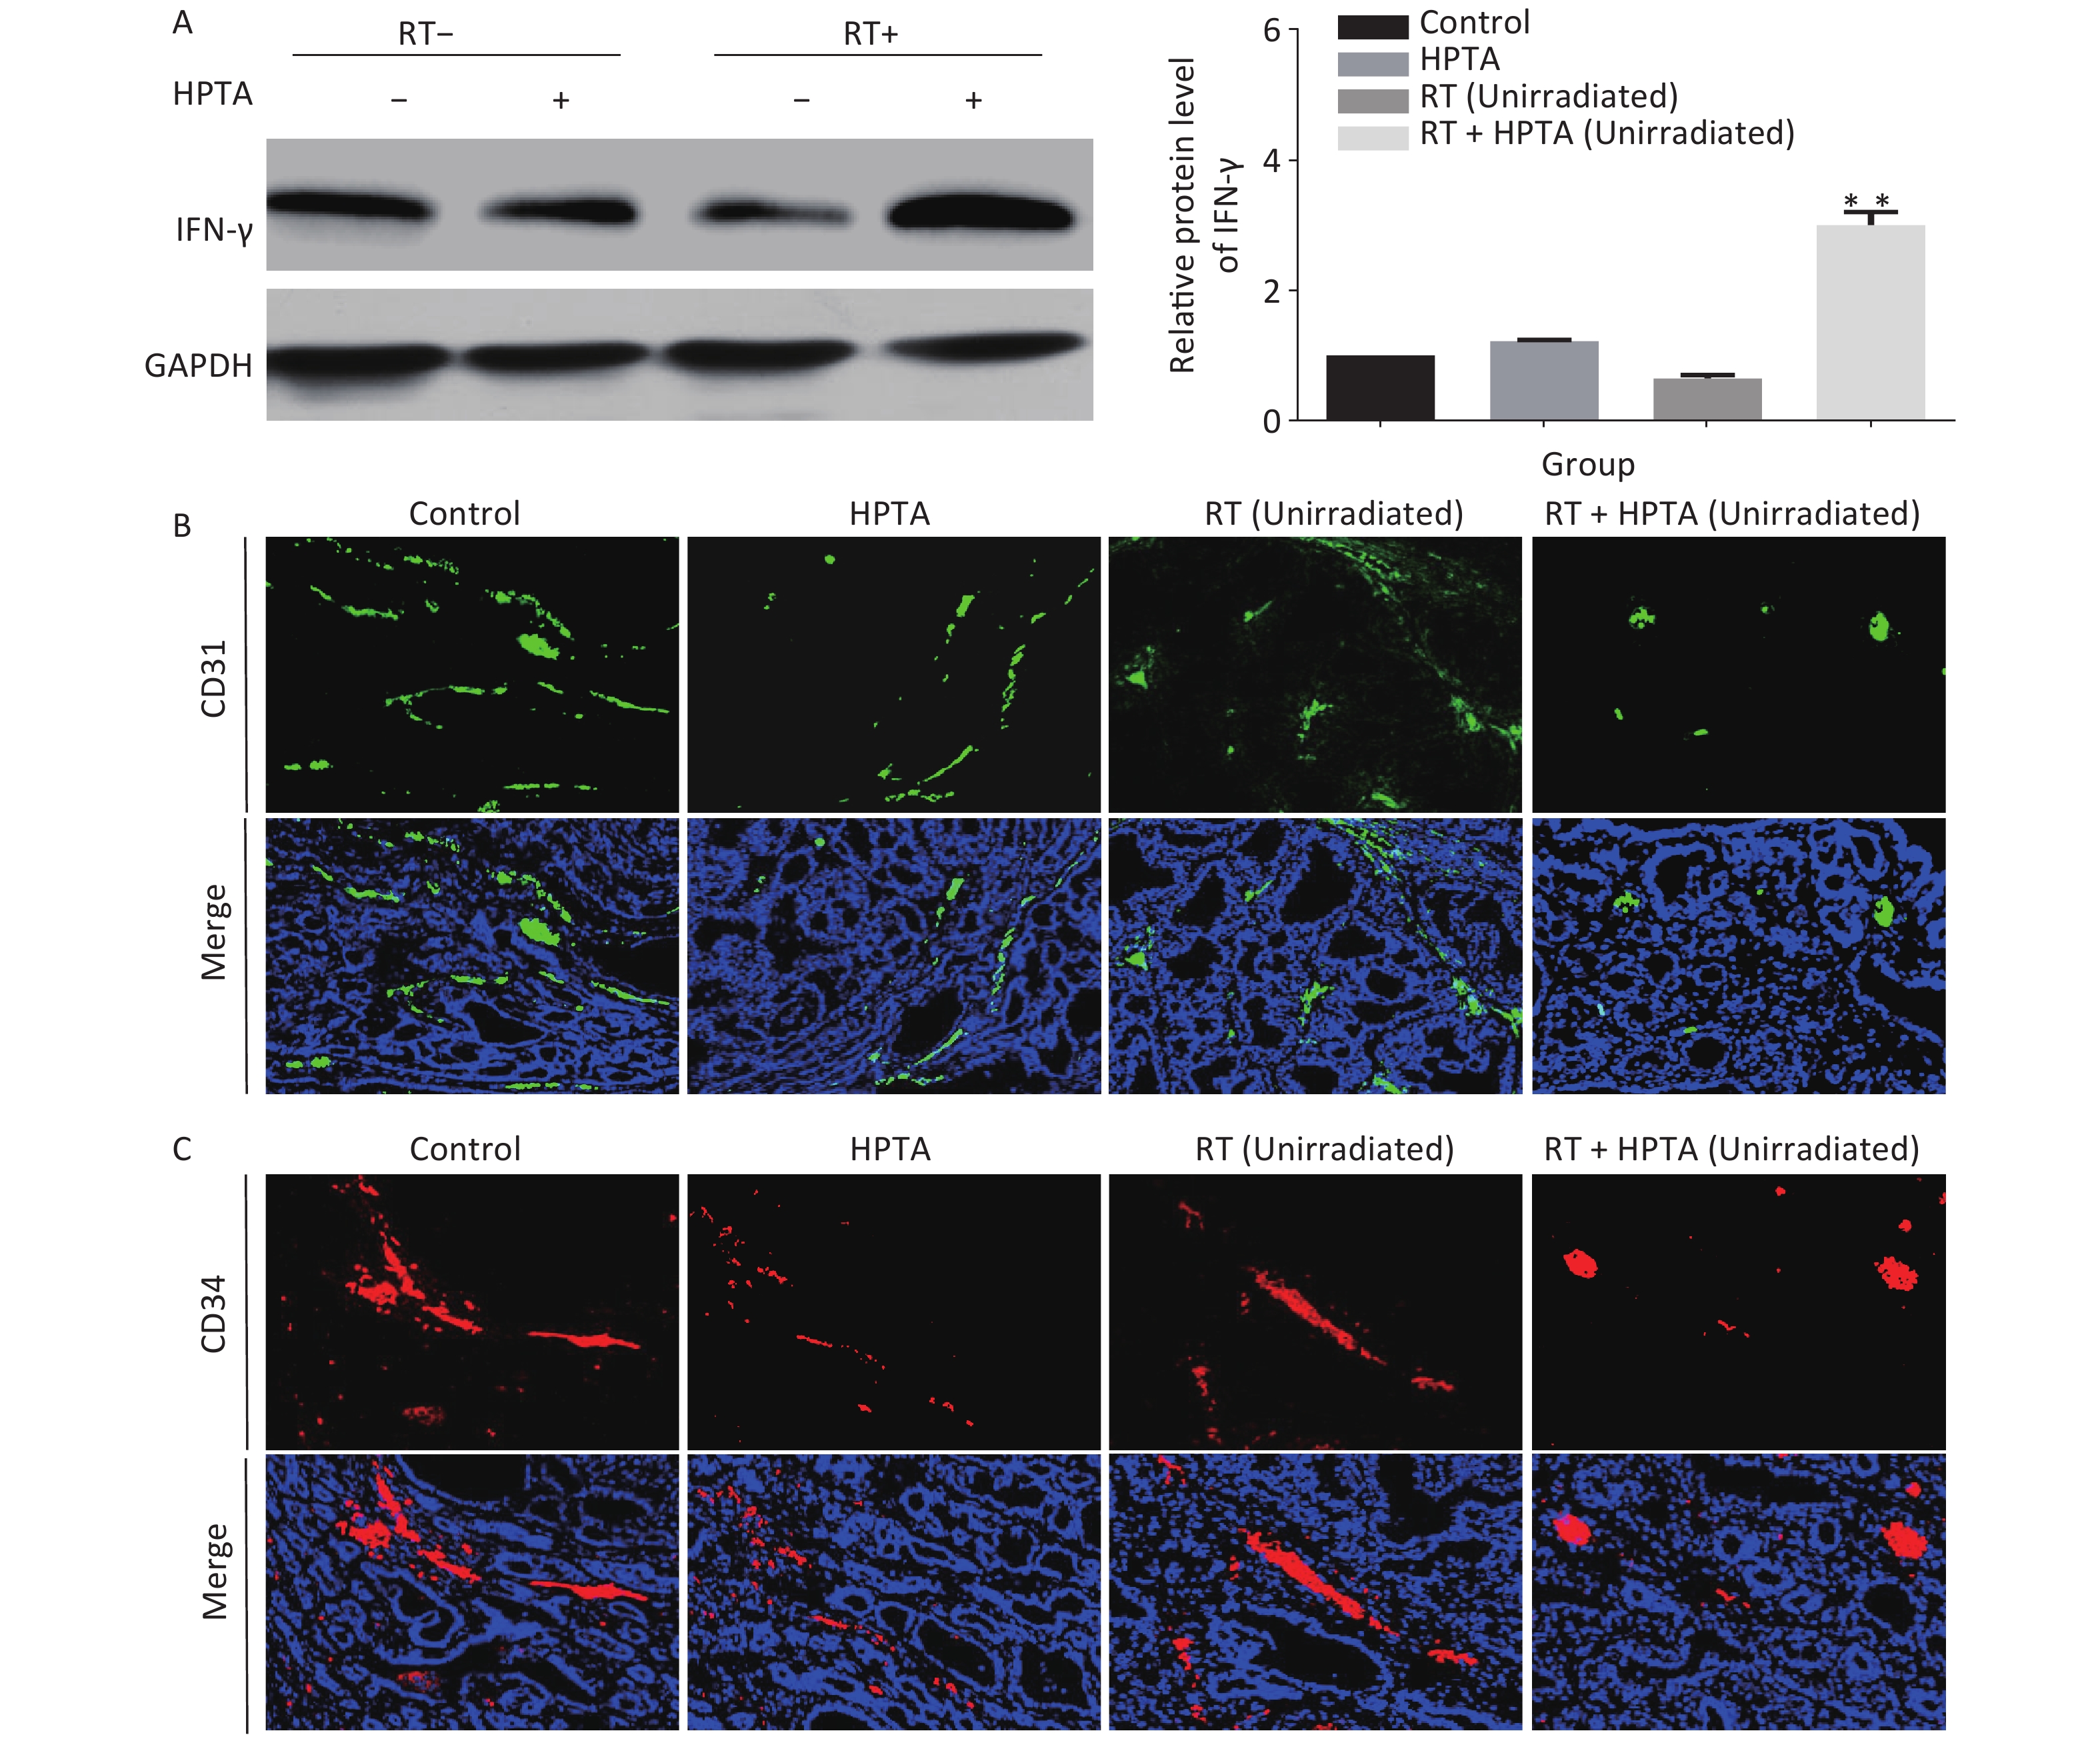
In addition to being immunosuppressive, TAMs contribute to neovascularization with abnormal leakiness and branches in tumor tissues, whereas M1 macrophages can promote vascular normalization through the secretion of the cytokine IFN-γ[13]. Our results indicated that the secretion of IFN-γ was significantly increased at the transcriptional level; therefore, we next determined whether HPTA in combination with RT could affect the vascular organization by M1 macrophages. First, the protein levels of IFN-γ in unirradiated tumor tissues were detected by western blot analysis. As shown in Figure 4A, we found that the protein level of IFN-γ was significantly increased in the RT + HPTA group compared to the other groups (P < 0.01). We used CD31 and CD34, the surface markers of neovascular endothelial cells, to analyze the tumor vascular tissue in unirradiated tumors by immunofluorescence staining, and found that the size and density of CD31+ (Figure 4B) and CD34+ (Figure 4C) vessels and aberrantly branched vasculature were reduced in the tumors in the RT + HPTA group as compared to the other groups, indicating that tumor angiogenesis was inhibited and the integrity of the vasculature was improved. These findings suggest that combining HPTA with RT can inhibit tumor neovascularization and promote vascular normalization, which may be associated with the secretion of IFN-γ and include anti-angiogenic properties from anti-tumor M1 macrophages.
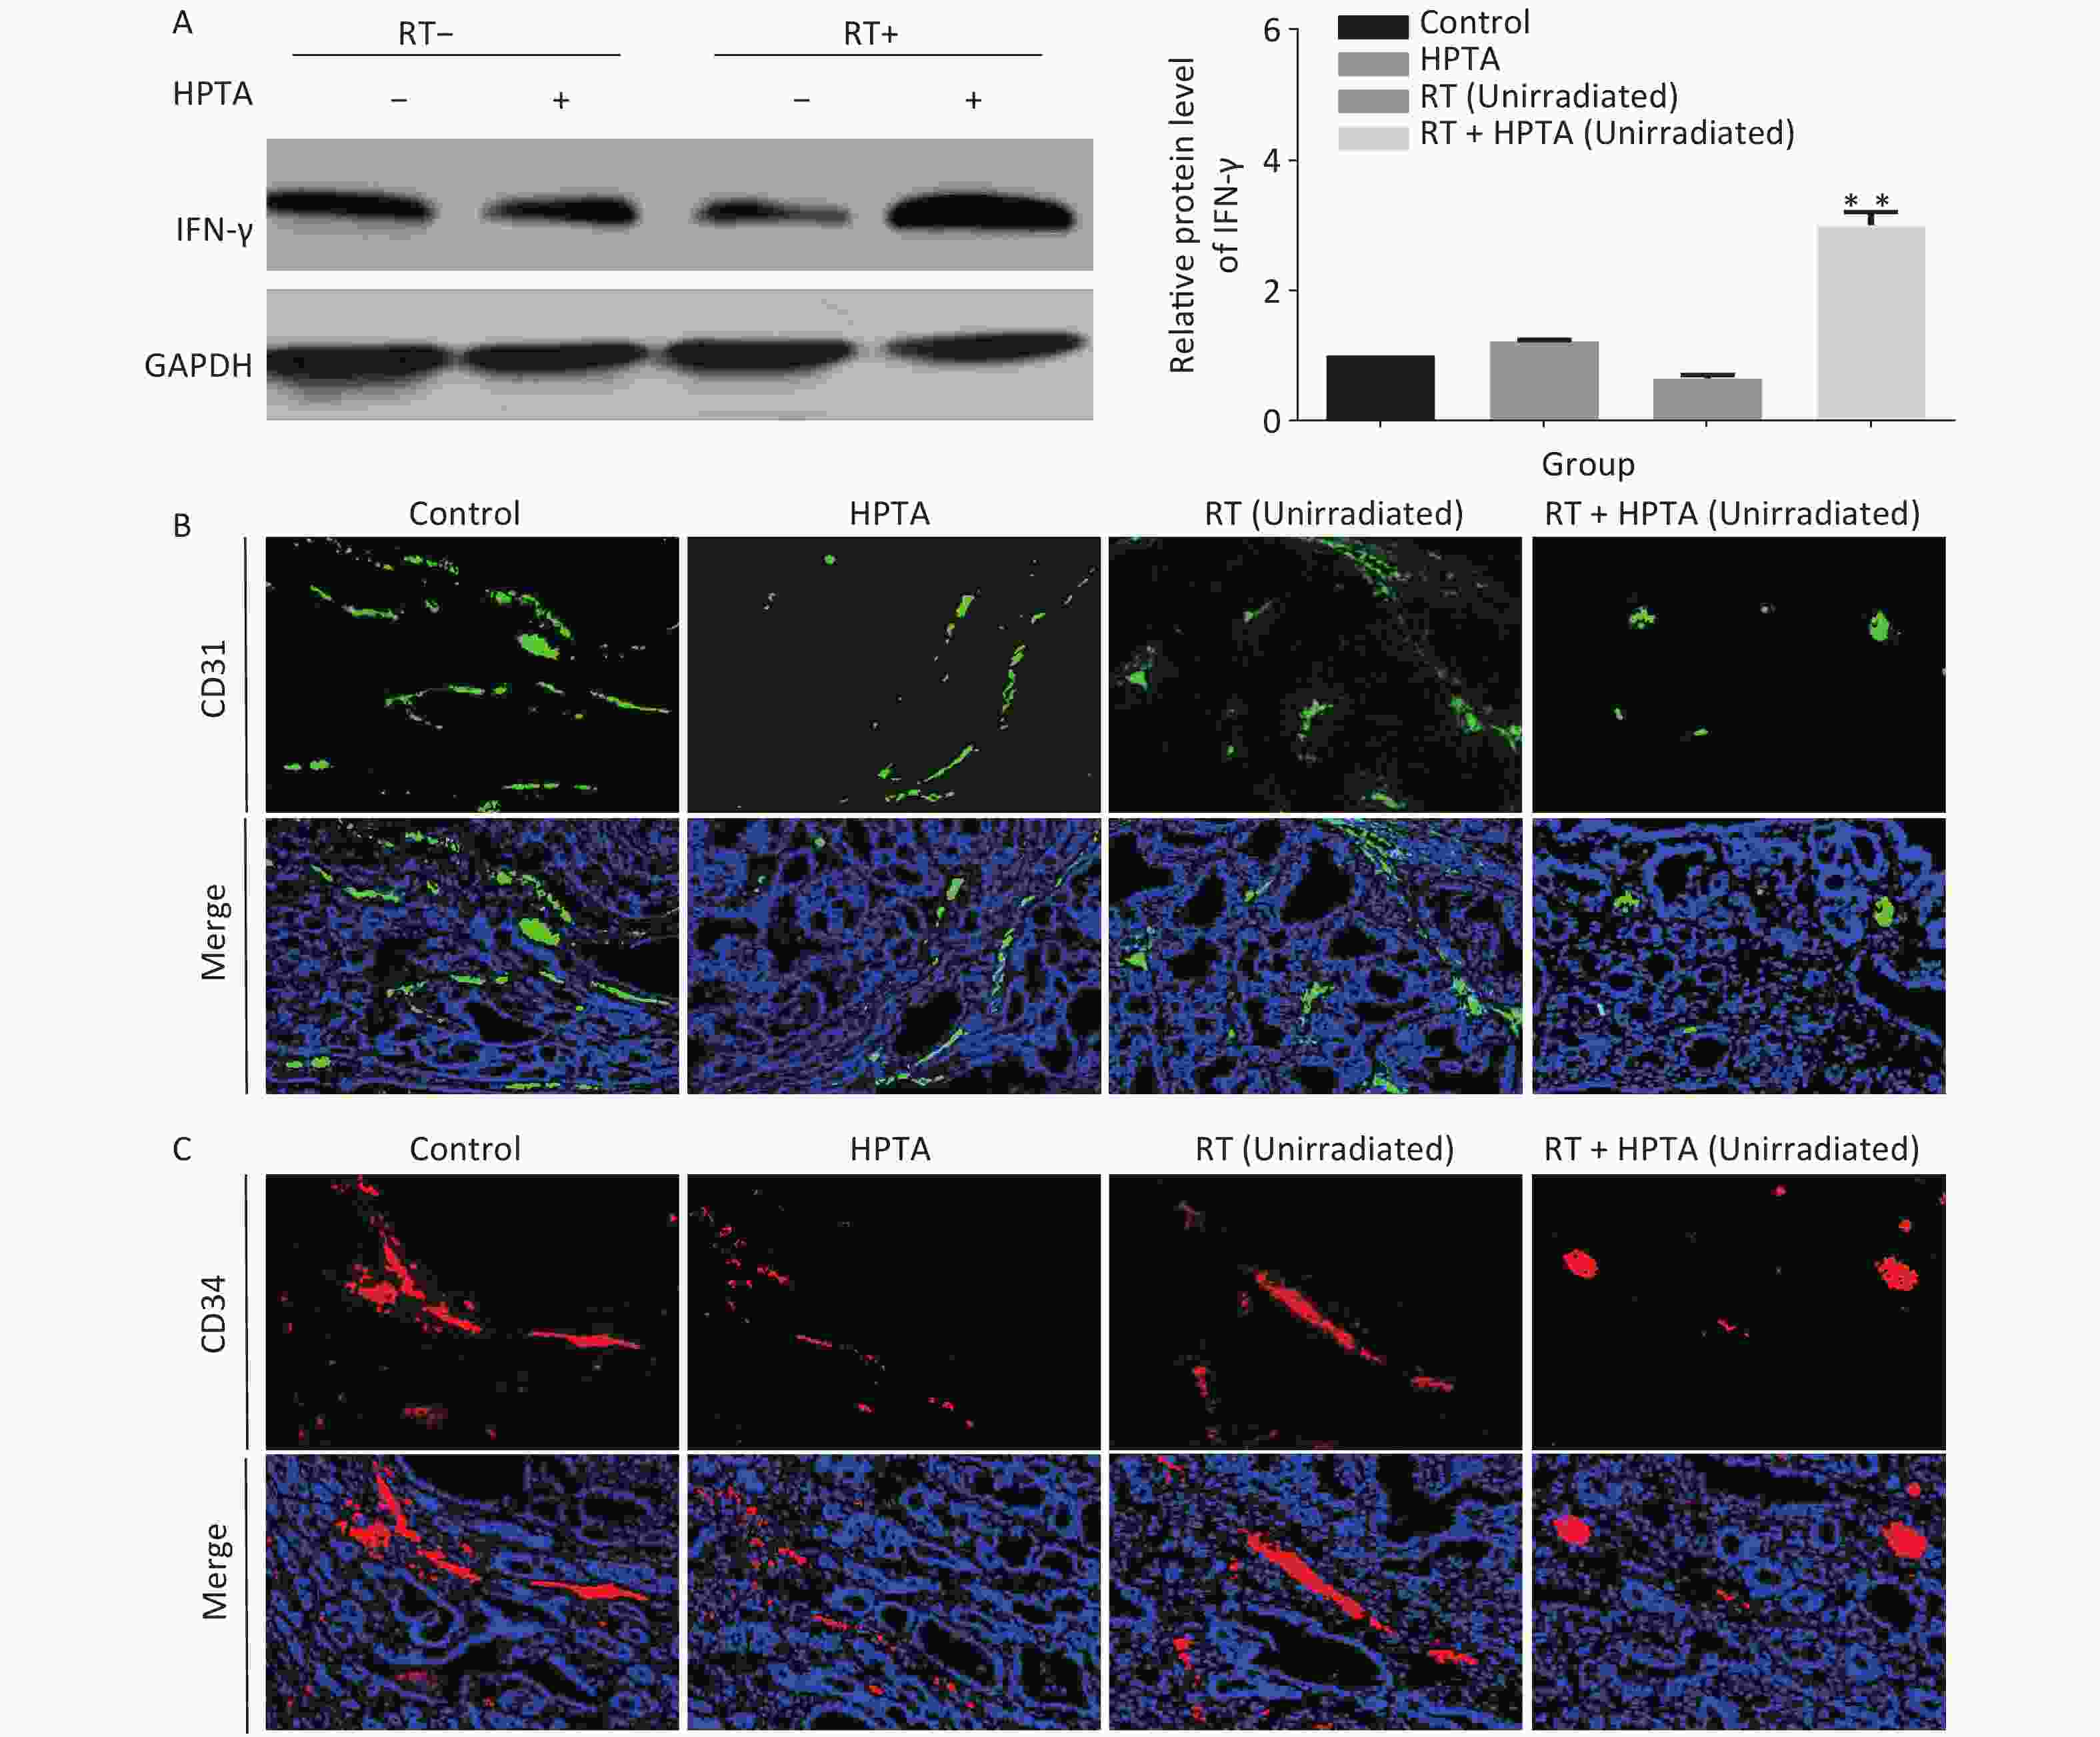
Figure 4. HPTA combined with RT inhibited tumor neovascularization. (A) The protein level of IFN-γ in tumor tissues was detected by western blot (left) and was further analyzed by Image-J, as shown in the graphs (right). (B, C) Vascular density and integrity were assessed by immunofluorescence using the CD31 (B) and CD34 (C) markers. The data in the graph was obtained from three independent experiments (mean ± SD, **P < 0.01).
-
Ionizing radiation has been widely used to treat cancer by inducing DNA damage and causing cancer cell death. Recently, an increasing number of studies have shown that RT can also modify the immune environment of tumors to control cancer progression[38, 39]. In the 1950s, the occurrence of the abscopal effect was first observed in clinical settings[3]. The abscopal effect is a type of non-targeted effect whereby localized RT can generate tumor shrinkage at sites far away from the irradiated lesions based on systematic immune stimulation[40]. Indeed, the abscopal effect remains a rare phenomenon, and its clinical benefit is limited to a small number of patients[41, 42]. It is hypothesized that the use of immunomodulators can enhance the efficacy of RT by inducing a systemic antitumor immune response. Experiments were conducted in melanoma[19], lung cancer[43], renal cell carcinoma[44], cervical cancer[22], and breast cancer[45]; however, challenges remain[46]. Clinical reports have described immunosuppression caused by RT[8] and the side effects of immunotherapy on the skin, colon, liver, and lung[47]. Current oncological research is searching for a safe and less toxic preparation that can amplify the effects of RT while overcoming adverse immunosuppression. In our previous study, we reported that HPTA, as an efficacious low-toxicity valproic acid derivative, may be useful in the treatment of mammary tumors[26]. In the current study, our findings suggest that the combination of RT and HPTA may effectively augment the abscopal effect by regulating the polarization of TAMs towards the M1 phenotype, thus supporting the proposition of HPTA as a novel neoadjuvant therapeutic for mammary tumors.
-
TAMs are recruited into the tumor mass following RT and irradiated TAMs release cytokines and chemokines[48], leading to an increase in tumor growth rates[49]. Low-dose RT programs macrophage differentiation to an iNOS (+)/M1 phenotype that orchestrates an effective immune response[30]. Some studies have found that low-dose RT modulates the polarization of TAMs to the M2 phenotype to maintain their ability to promote invasion and angiogenesis[50, 11]. Thus, the dose and schedule of RT may evoke different changes in the tumor microenvironment. In our study, we did not observe the occurrence of abscopal response in unirradiated tumor tissues, but an increase in M2 macrophages was noted after RT. HPTA mitigated the increase in M2 phenotypes induced via RT by reprogramming TAM polarization towards the anti-tumor M1 phenotype, thereby enhancing anti-tumor immune responses and mediating distant unirradiated tumor reduction. Although the exact mechanism of action is unclear, and future studies are required to further explore how HPTA regulates M1 macrophage-dependent immune activity to inhibit tumor growth, the current study demonstrated that HPTA can modulate TAM differentiation and reverse the reduction in M2 macrophages induced by RT.
-
Neovascularization provides nutrition for tumor growth[51]. Tumor blood vessels are characterized by irregular branches and strong permeability, which lead to severe hypoxia, promoting tumor progression and resistance to treatment. RT-induced vascular damage aggravates tumor hypoxia and promotes TAM infiltration by inducing the release of cytokines and chemokines, which in turn promotes angiogenesis[52]. Previous studies have shown that M1 macrophages promote vascular normalization through the secretion of cytokine IFN-γ[13], and improved blood vessels relieve hypoxia, which in turn modulates the TAM polarization of an immunostimulatory M1 phenotype [53]. Moreover, Guerriero et al. reported that class IIa HDACi enabled macrophages to instruct IFN-γ to promote vascular normalization by altering the tumor microenvironment[27]. Therefore, targeted therapy of TAMs may be another way to inhibit tumor angiogenesis, which improves the effectiveness of RT. Our research indicated that combining HPTA with RT resulted in decreased vascular density and size, and more organized and less leaky tumor vasculature, which is associated with the secretion of IFN-γ by anti-tumor M1 macrophages. Although further studies are required, the results implied that HPTA may serve as a potential regulator of immunity for modifying the tumor microvasculature during RT.
In short, HPTA may be a novel neoadjuvant therapeutic capable of stimulating the RT-induced abscopal effect in mammary tumors.
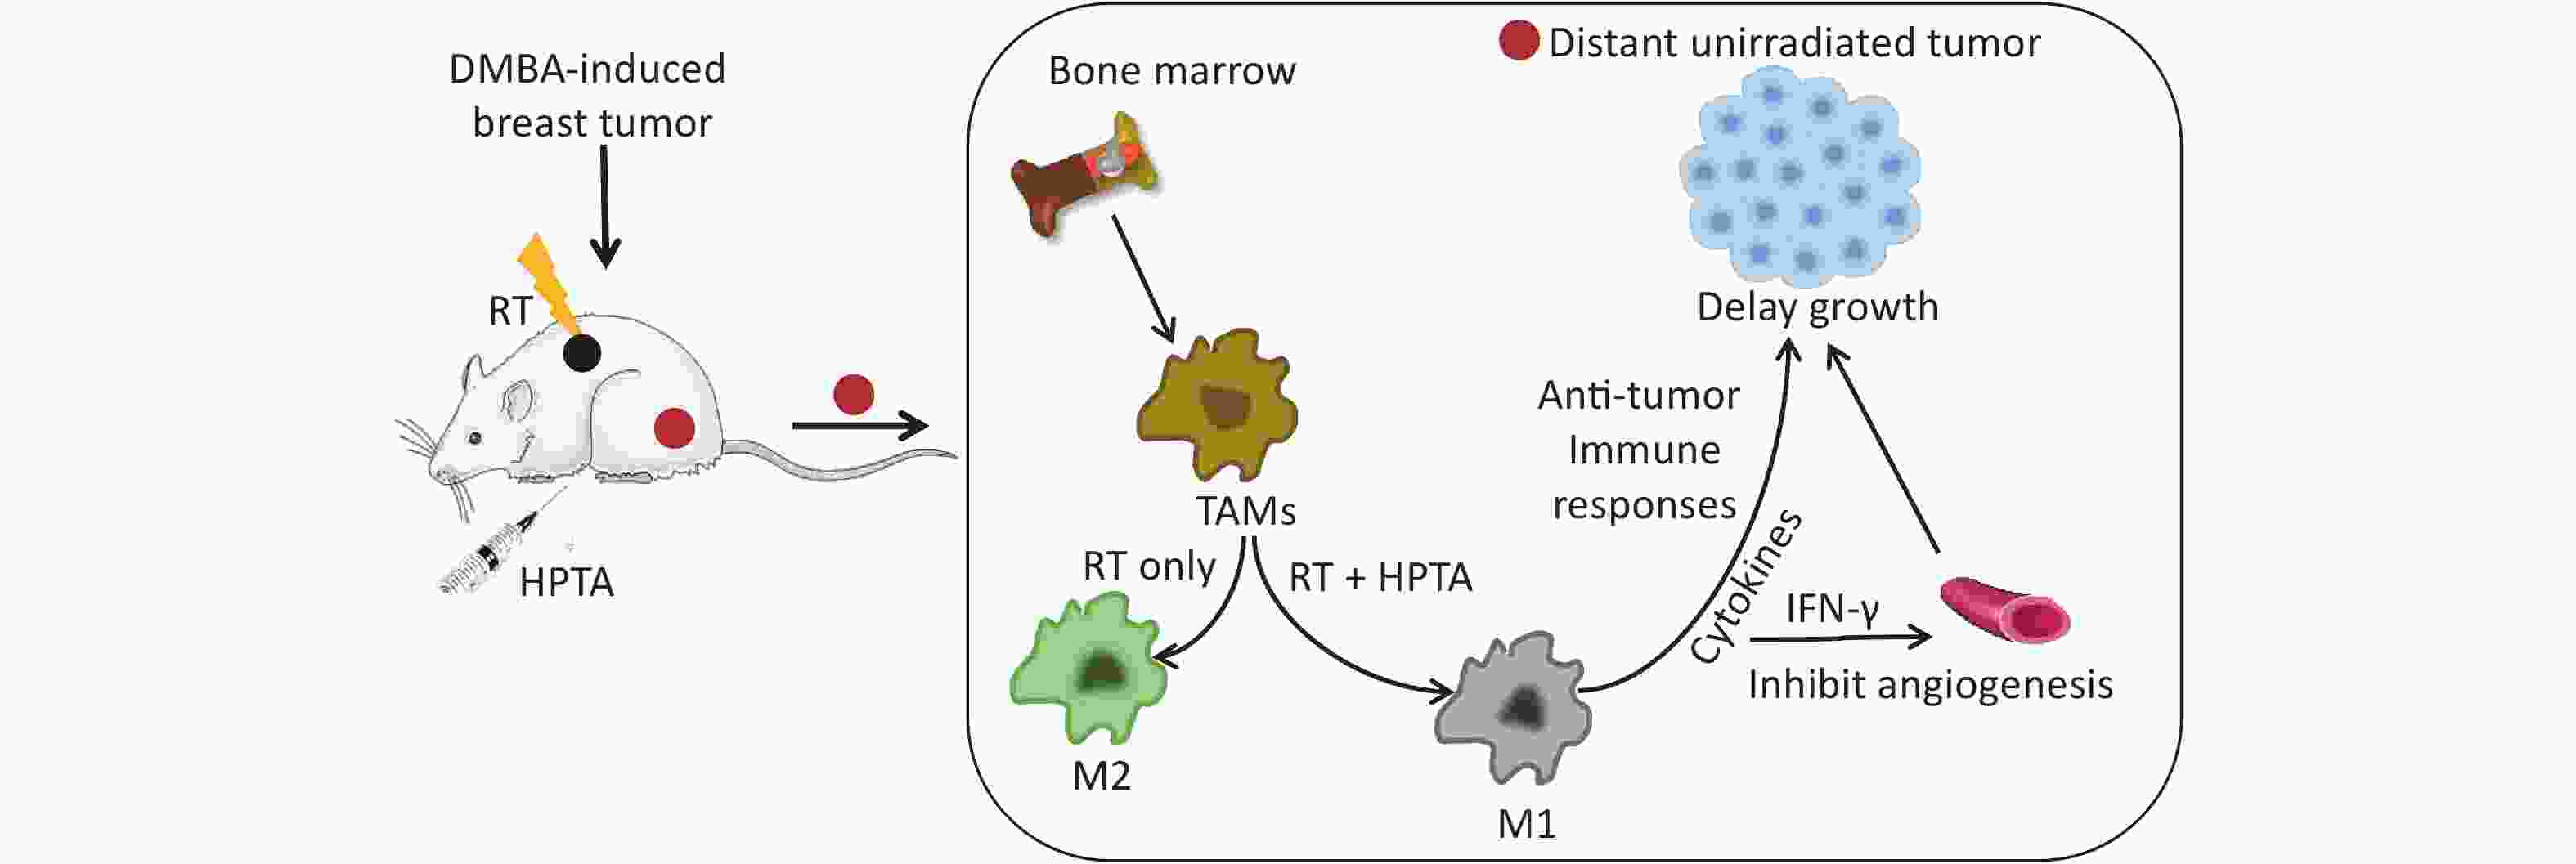
Figure S1. HPTA combined with RT exerts an abscopal effect in breast cancer.
HTML
Establishment of a Radiation-induced Abscopal Effect in Rat Model of Breast Cancer
Immunohistochemistry and Immunofluorescence
Quantitative Real-time PCR Analysis
Western Blot Analysis
Statistical Analysis
HPTA Can Stimulate the RT-induced Abscopal Effect on Distant Unirradiated Tumors
HPTA Combined with RT Can Effectively Inhibit the Proliferation of Tumor Cells and Promote the Infiltration of Myeloid-derived TAMs in Distal Unirradiated Tumors
HPTA Can Reprogram TAMs Polarization Towards the Anti-tumor M1 Phenotype and Reversed the Reduction of the M1/M2 Macrophages Ratio Induced by RT
HPTA Inhibited Tumor Angiogenesis in Unirradiated Tumors
HPTA May Act as a Novel Therapeutic for Boosting the Abscopal Effect of RT in Breast Cancer
HPTA Can Modulate the Differentiation of TAMs to Stimulate Anti-tumor Immune Responses in the Abscopal Effect
HPTA-targeted Therapy of TAMs is Another Potential Mechanism to Inhibit Tumor Angiogenesis for Controlling Distant Tumor Growth in the Abscopal Effect
 20460.pdf
|

|

 Quick Links
 DownLoad: