


-
The visit-to-visit variability (VVV) of metabolic factors, such as blood glucose level, blood pressure (BP), and lipid levels, is common[1-3]. An increasing number of studies have supported the role of VVV of metabolic factors in the development of cardiovascular diseases and other adverse health outcomes[3-9]. For example, VVV of BP is associated with a higher risk of stroke, coronary heart disease, and mortality independent of mean BP[4-6]. In addition, several studies revealed that the intraindividual lipid variability was also associated with an increased risk of cardiovascular events and death[3, 7, 8]. In a study on participants with coronary artery disease, VVV of low-density lipoprotein cholesterol (LDL-c) independently predicted cardiovascular events and death[3]. Similarly, increasing evidence suggested that the variability in fasting plasma glucose (FPG) level might be an independent risk factor for future cardiovascular events and all-cause mortality[9-11]. In addition, studies also reported associations between the VVV of metabolic factors and the incident end-stage renal disease (ESRD)[12, 13]. For example, one study reported that systolic and diastolic BP variabilities were independently associated with an increased incidence of ESRD, and the risk increased further when both variabilities were present[12]. However, previous studies mainly focused on the relationship of one selected metabolic factor and adverse health outcomes. The associations of combined variabilities in multiple metabolic factors (i.e., FPG, BP, and lipid levels) with the risk of health-related outcomes remain unclear.
Chronic kidney disease (CKD) is a public health problem, affecting more than 10% of adults worldwide, and its prevalence still continues to increase[14]. CKD leads to adverse consequences such as ESRD and cardiovascular morbidity and mortality. Hence, it is important to prevent the progression of CKD through the early detection of high risk and treatment of risk factors. Metabolic dysfunctions, such as impaired fasting glucose, elevated BP, and dyslipidemia, have been regarded as traditional and independent risk factors for CKD[15, 16]. Nevertheless, metabolic factors are characterized by high variabilities[2, 3, 17]. Data from in vitro and animal studies demonstrated that glucose variability had a more significant effect on oxidative stress and endothelial function compared with sustained hyperglycemia[18, 19]. Similarly, a variability in BP is associated with endothelial dysfunction, thereby promoting early target organ damage[20]. Furthermore, Kawai et al. found that participants with a higher variability in systolic blood pressure (SBP) had significantly higher renal vascular resistance[21]. The role of VVV of metabolic factors as a determinant of CKD in community residents was less evaluated.
On the basis of previous findings, we hypothesized that variabilities in metabolic factors, particularly multiple metabolic factors with high variabilities combined, could be associated with increased risks of CKD. Therefore, using data from a community-based cohort study, we examined the associations of variabilities in multiple metabolic factors with CKD in Shanghai community residents who participated in several metabolic health examinations.
-
The study participants were from an ongoing prospective cohort of adults in Shanghai, China. The details of the cohort have been described previously[22]. Briefly, the participants underwent three examination visits. At the baseline visit (June and July 2008), 10,185 participants aged ≥ 40 years from Songnan Community were included in the screening examination. The FPG levels were measured, and the participants were classified into three groups accordingly: normal glucose regulation (NGR), with FPG less than 100 mg/dL and without a history of diabetes; impaired fasting glucose (IFG), with FPG 100–125 mg/dL and without a history of diabetes; and diabetes, with FPG 126 mg/dL or higher or with a history of diabetes. All the participants completed a brief survey, including FPG, BP, and lipid level evaluation. In the second visit (June through August 2009), the participants were randomly selected from the three groups in a ratio of 1.0 (diabetes) to 1.2 (IFG) to 1.44 (NGR). Individuals with lower plasma glucose levels were expected to have a lower participation rate compared with those with higher plasma glucose levels. All the selected participants completed a detailed survey, including FPG, BP, lipids, urinary albumin, and urinary creatinine evaluation. In the third visit (March through May 2013), participants from the second visit were invited to have re-evaluations of parameters mentioned earlier.
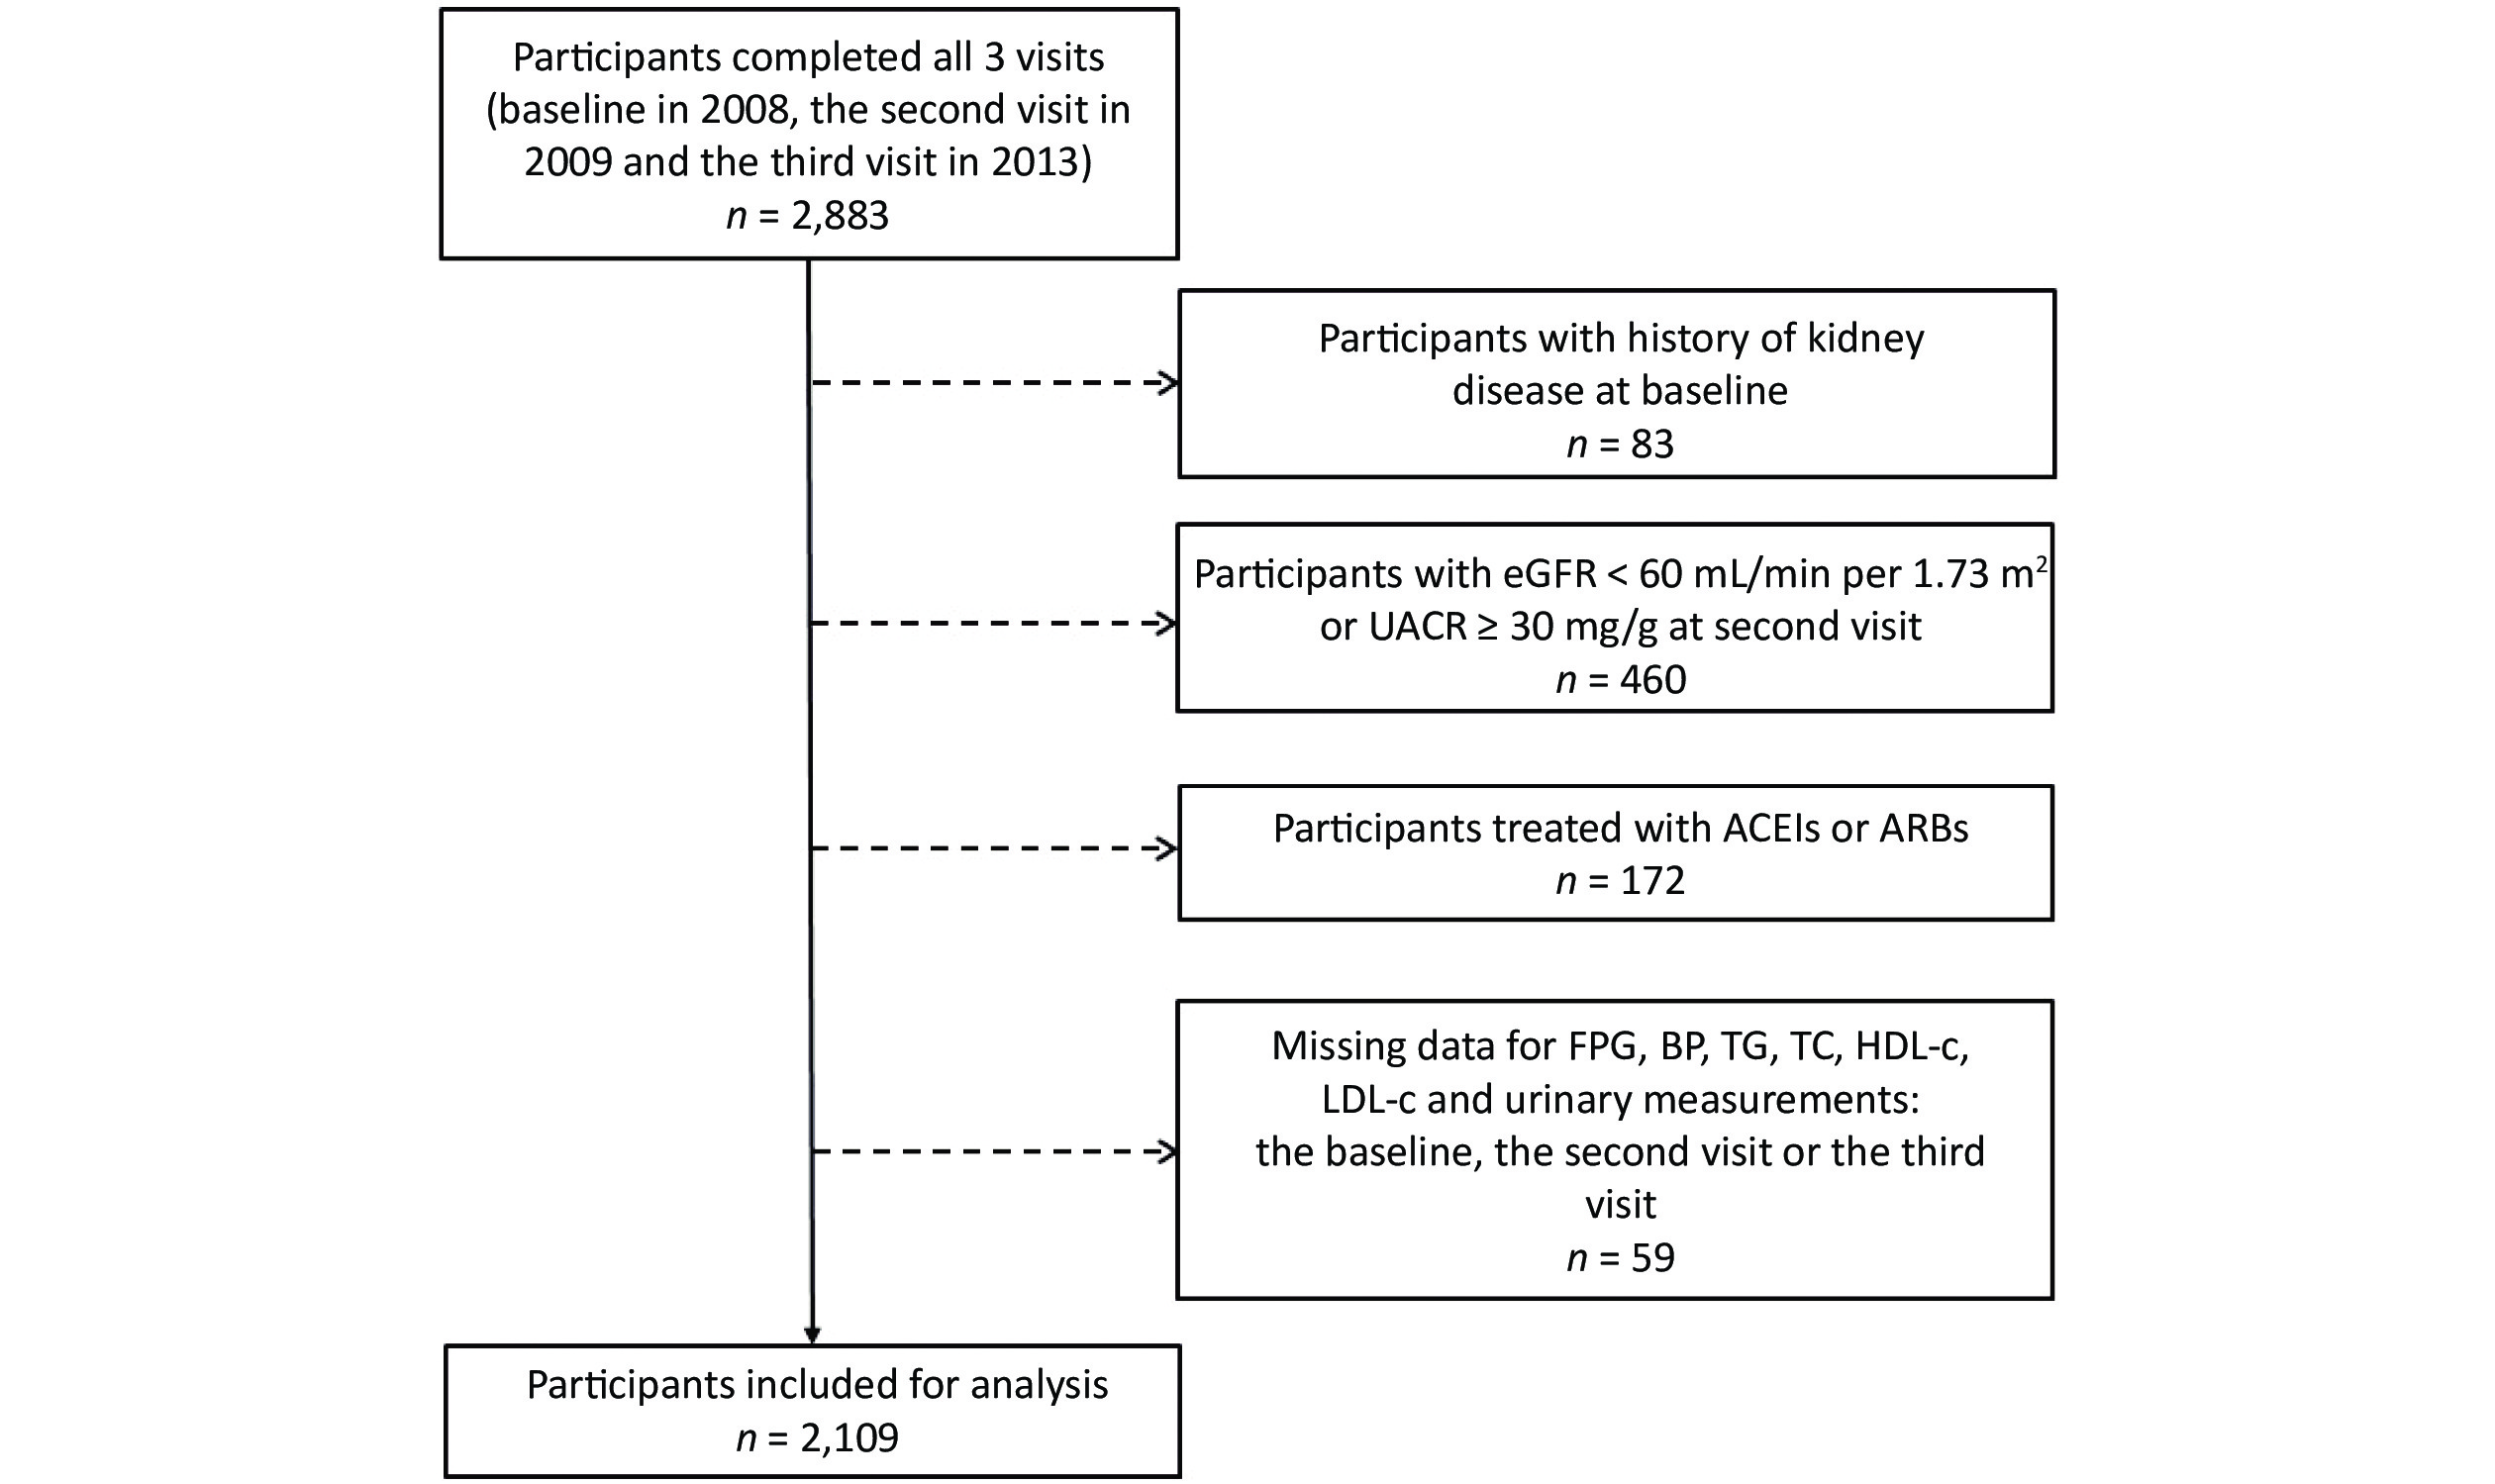
For the current analysis, participants with a history of kidney disease at baseline (n = 83), participants with the estimated glomerular filtration rate (eGFR) < 60 mL/min per 1.73 m2 or the urinary albumin-to-creatinine ratio (UACR) ≥ 30 mg/g at the second visit (n = 460), participants taking angiotensin-converting enzyme inhibitors (ACEIs) or angiotensin receptor blockers (ARBs) (n = 172), and participants with missing data on FPG, BP, lipids, urinary albumin, and urinary creatinine (n = 59) were excluded. Finally, our sample comprised 2,109 individuals (Figure 1).
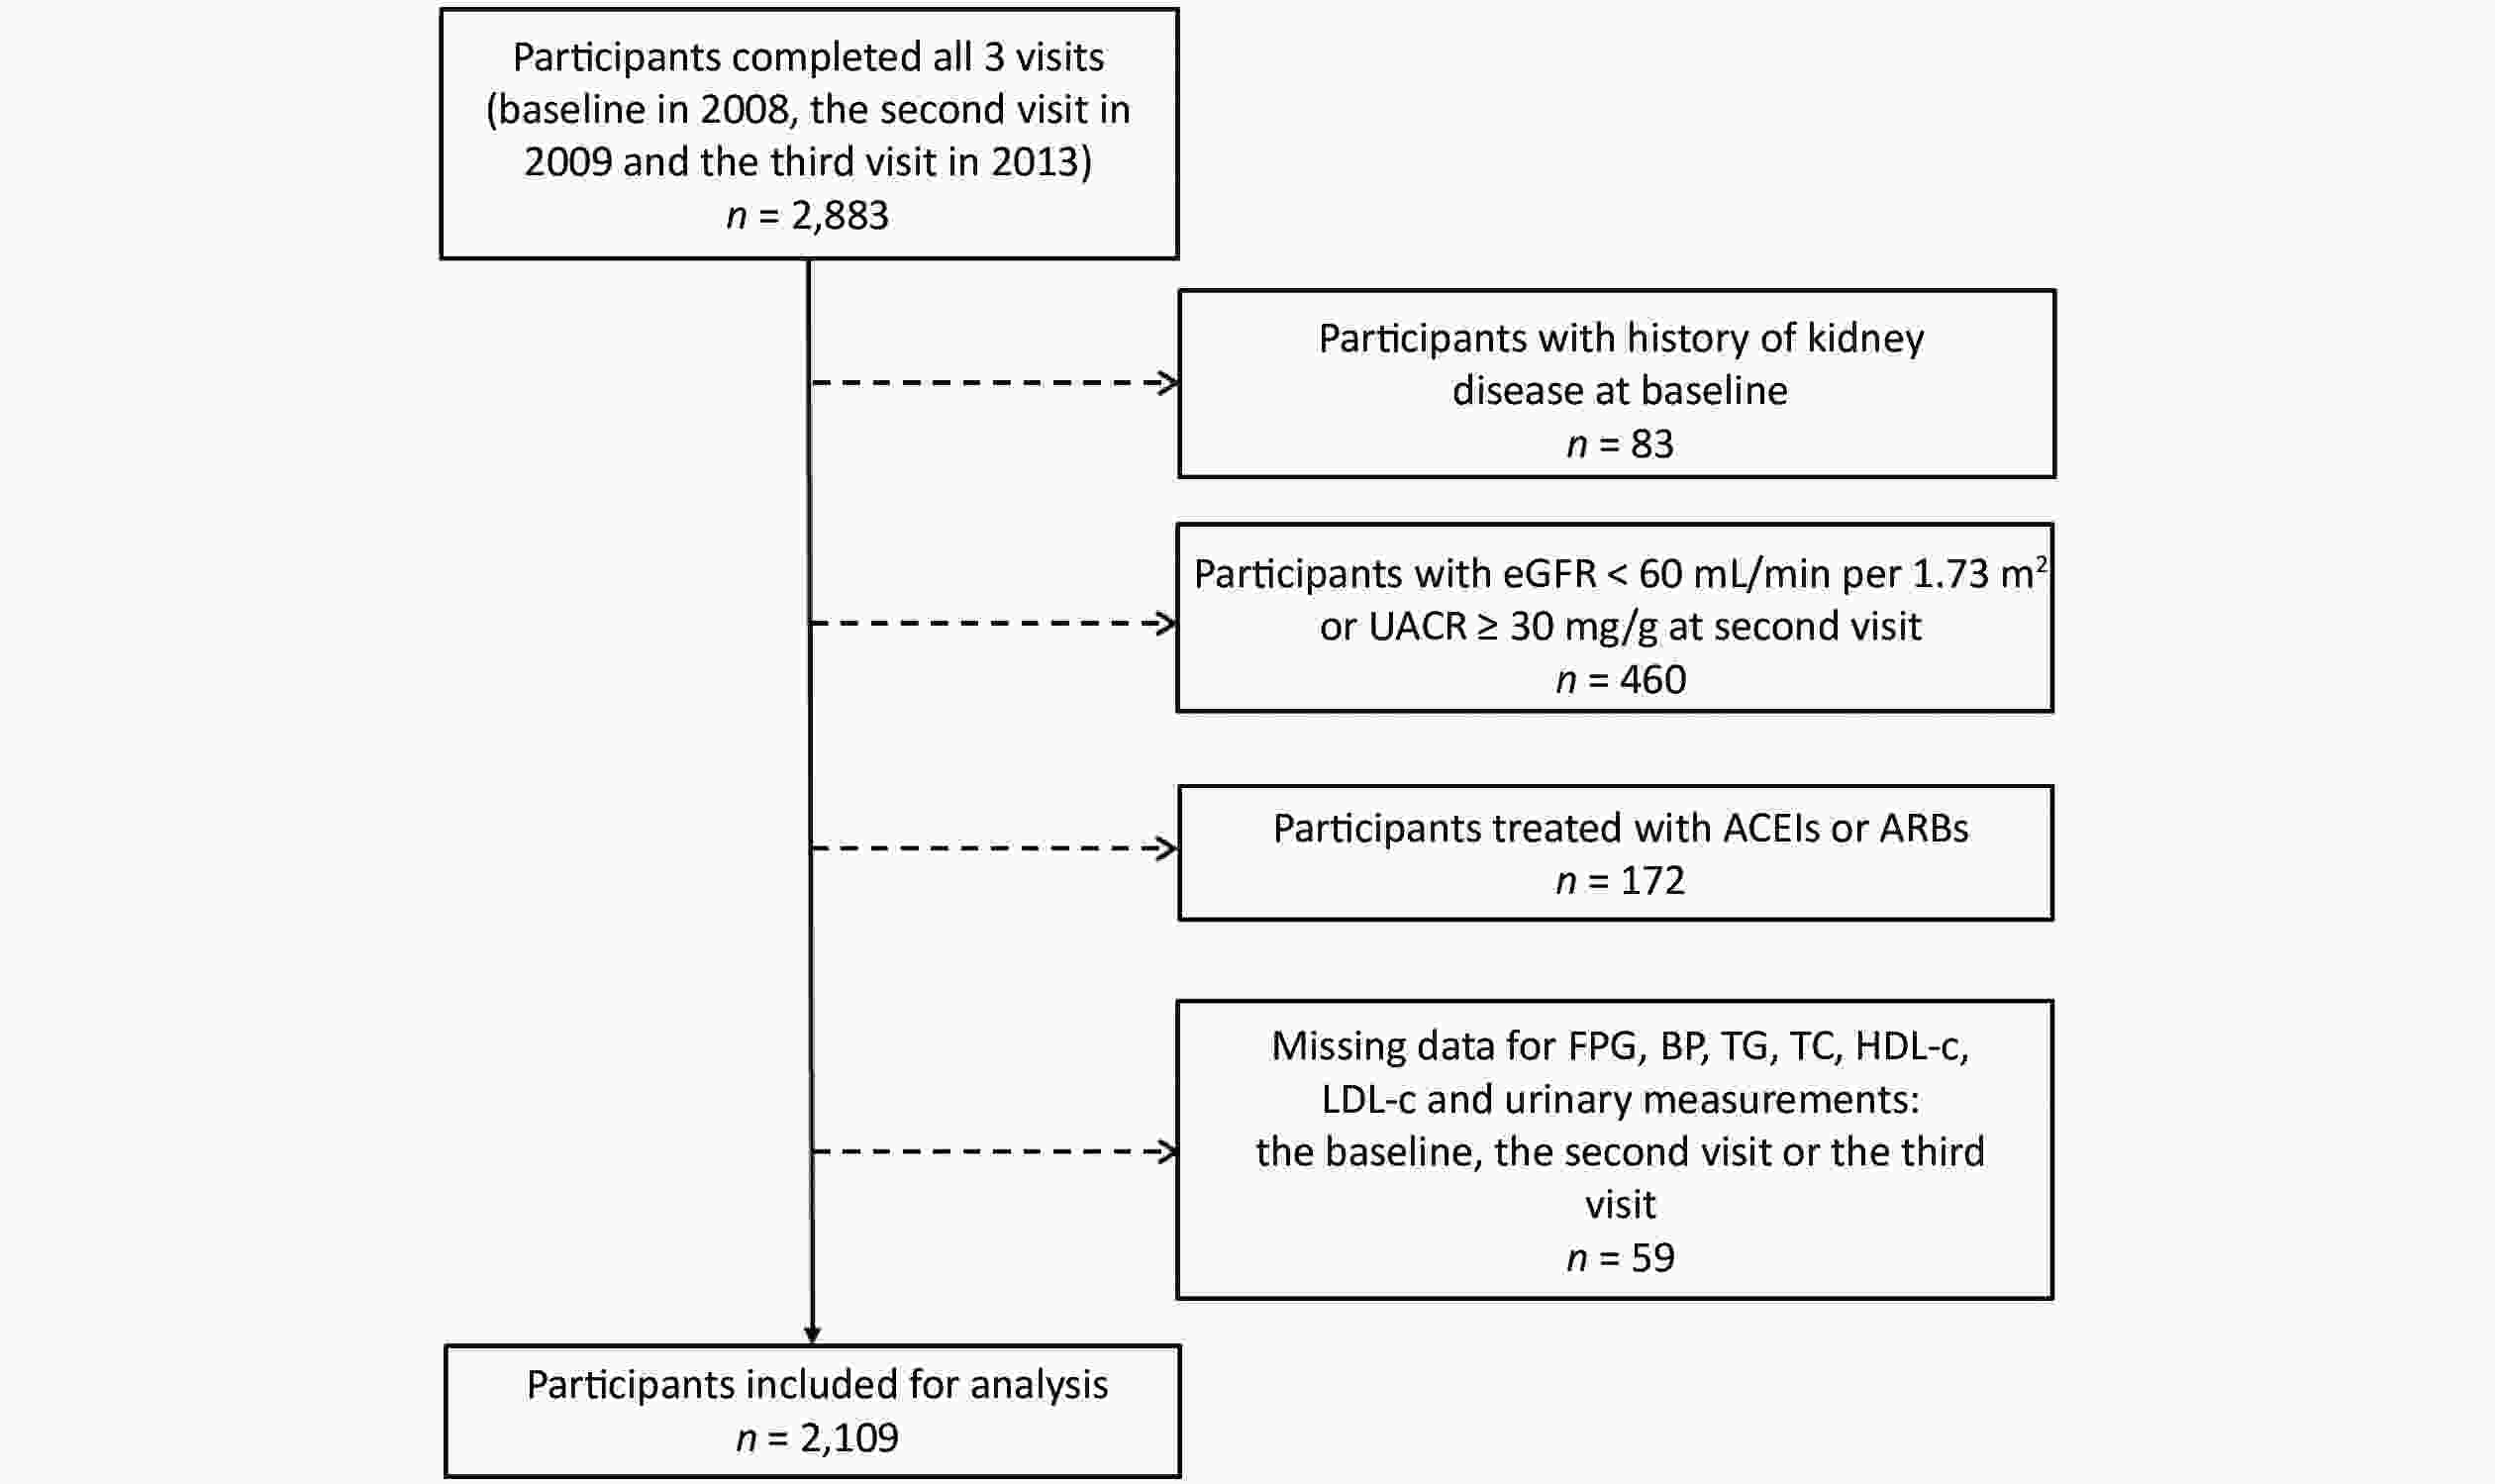
Figure 1. Flow chart of the study population. eGFR: Estimated glomerular filtration rate; UACR: urinary albumin-to-creatinine ratio; ACEIs: angiotensin-converting enzyme inhibitors; ARBs: angiotensin receptor blockers; FPG: fasting plasma glucose; BP: blood pressure; TG: triglyceride; TC: total cholesterol; HDL-c: high-density lipoprotein cholesterol; LDL-c: low-density lipoprotein cholesterol.
The study protocol was approved by the Institutional Review Board of Ruijin Hospital, Shanghai Jiaotong University School of Medicine. All participants provided written informed consent.
-
Data were collected from local community clinics at the first, second, and third visits. Detailed information regarding participant demographics, medical history, family history, and lifestyle factors (e.g., smoking status and drinking status) was obtained using a standardized questionnaire. The International Physical Activity Questionnaire was used to assess physical activity[23]. Questions on frequency and duration of mild, moderate, and vigorous activities in the previous week were asked. Regular exercise was defined as ≥ 150 min/week moderate-intensity activity, ≥ 75 min/week vigorous-intensity activity, or ≥ 150 min/week moderate- and vigorous-intensity activity[24]. Body mass index (BMI) was calculated as body weight (kg) divided by the square of body height in meters (kg/m2). Obesity was defined as BMI ≥ 25 kg/m2. Three consecutive BP measurements were made with 1-min interval after 5-min rest, using an automated electronic device (OMRON Model HEM-752, Omron, Dalian, China). The mean value of three measurements was analyzed.
Diabetes was defined as FPG ≥ 126 mg/dL, or self-reported previous diagnosis and taking antidiabetic medications. Hypertension was defined as SBP ≥ 140 mmHg, or diastolic blood pressure (DBP) ≥ 90 mmHg, or self-reported previous diagnosis and taking antihypertensive medications. Dyslipidemia was defined as total cholesterol (TC) ≥ 240 mg/dL, triglyceride (TG) ≥ 200 mg/dL, high-density lipoprotein cholesterol (HDL-c) < 40 mg/dL, or low-density lipoprotein cholesterol (LDL-c) ≥ 160 mg/dL or taking lipid-lowering medications[25].
Plasma glucose levels and serum concentrations of creatinine (Cr), TG, TC, HDL-c, and LDL-c were measured using an automatic analyzer (ADVIA-1650 Chemistry System, Bayer Corporation, Leverkusen, Germany).
-
No internationally agreed-upon gold standard measures exist regarding VVV of metabolic factors (FPG level, SBP, and lipid level). For example, using FPG levels at each of the three visits, we calculated the coefficient of variation [CV, calculated as the standard deviation (SD) divided by the mean] to determine the VVV of FPG (CV of FPG). High variability was defined as the highest quartile (Q4) of the CV, while low variability was defined as the lower three quartiles (Q1–Q3) of the CV[26, 27]. We assigned zero points to the low variability (Q1–Q3) and one point to the high variability (Q4) for each of the factors. A variability score was calculated for each participant by adding points of high-variability metabolic factors (FPG level, SBP, and lipid levels) associated significantly with CKD. Therefore, a score of three indicated a high variability in three of the total positive factors.
-
The CKD was defined according to the Kidney Disease Improving Global Outcomes (KDIGO) 2012 clinical practice guideline as UACR ≥ 30 mg/g or eGFR < 60 mL/min per 1.73 m2 at the third visit in participants without CKD at the second visit[28, 29]. The eGFR was calculated using the Chronic Kidney Disease-Epidemiology Collaboration (CKD-EPI) equation[30].
UACR was measured using the first-voided, early-morning spot urine samples obtained from each participant (second and third visits). Urinary albumin concentrations (mg/dL) were determined by rate nephelometry (Beckman Coulter, CA, USA), and urinary creatinine concentrations (mmol/L) were measured by the alkaline nitroxanthic acid method. UACR was calculated as mg of urinary albumin divided by per g of urinary creatinine.
-
Continuous variables were expressed as the means ± SDs or medians (interquartile ranges, IQRs). Categorical variables were expressed as numbers (percentages). Differences between participants with and without CKD were compared using t-tests for continuous variables or χ2 tests for categorical variables. Skewed variables such as TG and UACR were log10-transformed before analysis.
Logistic regression analysis was used to calculate the associations of metabolic factor variabilities and variability score with CKD. This was done by modeling each metabolic factor (FPG, SBP, DBP, TG, TC, HDL-c, and LDL-c) variability as a continuous variable as well as quartiles of each metabolic parameter variability with the lowest quartile (Q1) serving as the reference. The number of factors with high variability was treated as a categorical variable, and the variability score of zero was used as the reference. Three models were used. Taking CV-FPG for example, model 1 was adjusted for age, sex, waist circumference, current drinking, current smoking, and regular exercise; model 2 was additionally adjusted for antidiabetic medications, baseline SBP, LDL-c, log10TG, and eGFR at the second visit; and model 3 was additionally adjusted for mean FPG. P values for trend across quartiles of CV for all metabolic factors were calculated in regression analyses using the CV quartile as an ordinal variable. In addition, the multivariable-adjusted association between the variability score and CKD was evaluated in the overall study population and in subgroups of men and women, age < 65 and ≥ 65 years, BMI < 25 and ≥ 25 kg/m2, with and without current smoking, with and without current drinking, and with and without diabetes.
Significance tests were two-tailed, with a P value < 0.05 indicating a statistically significant difference. All statistical analyses were performed using SAS version 9.4 (SAS Institute Inc., NC, USA).
-
The characteristics of the participants with and without CKD are listed in Table 1. Overall, the mean age of the study population was 57.9 ± 8.9 years, and 38.7% (n = 817) participants were men. A total of 9.5% (n = 200) participants had CKD. Compared with participants without CKD, those with CKD were more likely to be older and have higher levels of BMI, waist circumference, FPG, BP, UACR, and lower levels of eGFR (all P < 0.05). The proportions of hypertension, diabetes, antidiabetic medications, and antihypertensive medications were significantly higher in those with CKD (both P < 0.001). In addition, CVs of FPG, SBP, DBP, TC, and LDL-c significantly increased in participants with CKD compared with those without (all P < 0.05). No significant differences in sex distribution, proportions of current smoking, current drinking, being physically active, dyslipidemia, lipid-lowering medications, and the levels of lipids and CVs of TG and HDL-c were found between the two groups (all P > 0.05).
Characteristics Total Without CKD With CKD P value Participants, n 2,109 1,909 200 Age (years) 57.9 ± 8.9 57.5 ± 8.7 61.9 ± 9.9 < 0.001* Men, n (%) 817 (38.7) 751 (39.3) 66 (33.0) 0.080 BMI (kg/m2) 25.1 ± 3.5 24.9 ± 3.5 26.2 ± 3.8 < 0.001* Waist circumference (cm) 84.2 ± 9.6 83.9 ± 9.6 87.1 ± 9.9 < 0.001* Lifestyle factors, n (%) Current smoking 503 (23.9) 465 (24.4) 38 (19.0) 0.091 Current drinking 368 (17.4) 334 (17.5) 34 (17.0) 0.860 Regular exercise 106 (5.0) 101 (5.3) 5 (2.5) 0.086 FPG (mg/dL) 101.2 ± 32.8 99.6 ± 31.2 115.8 ± 42.8 < 0.001* Blood pressure (mmHg) SBP 131 ± 21 130 ± 20 142 ± 24 < 0.001* DBP 79 ± 10 79 ± 10 83 ± 11 < 0.001* Lipid profiles (mg/dL) TG 105.3 (75.2–154.1) 104.5 (74.4–151.9) 118.8 (77.1–168.4) 0.073 TC 197.5 ± 36.0 197.3 ± 35.7 199.1 ± 38.7 0.513 HDL-c 53.8 ± 11.5 53.9 ± 11.5 53.4 ± 11.6 0.588 LDL-c 95.0 ± 25.8 95.1 ± 25.6 94.5 ± 27.3 0.784 eGFR at the second visit (mL/min per 1.73 m2) 91.0 ± 12.5 91.4 ± 12.3 87.6 ± 14.0 < 0.001* eGFR at the third visit (mL/min per 1.73 m2) 91.7 ± 11.9 92.6 ± 10.7 83.5 ± 18.6 < 0.001* UACR at the second visit (mg/g) 4.4 (2.0–10.6) 4.1 (2.0–10.0) 8.5 (2.9–16.7) < 0.001* UACR at the third visit (mg/g) 7.8 (5.2–12.9) 7.3 (5.0–10.8) 51.5 (37.4–84.1) < 0.001* Diabetes, n (%) 447 (21.2) 362 (19.0) 85 (42.5) < 0.001* Hypertension, n (%) 838 (39.7) 711 (37.2) 127 (63.5) < 0.001* Dyslipidemia, n (%) 597 (28.3) 532 (27.9) 65 (32.5) 0.167 Medications Antidiabetic medications at three visits, n (%) 398 (18.9) 319 (16.7) 79 (39.5) < 0.001* Antihypertensive medications at three visits, n (%) 504 (23.9) 427 (22.4) 77 (38.5) < 0.001* Lipid-lowering medications at three visits, n (%) 22 (1.0) 17 (0.9) 5 (2.5) 0.078 Variability, coefficient of variation FPG, % 12.4 ± 10.2 11.9 ± 9.5 17.7 ± 13.9 < 0.001* SBP, % 7.3 ± 4.2 7.2 ± 4.1 8.3 ± 4.5 < 0.001* DBP, % 6.6 ± 3.8 6.5 ± 3.8 7.4 ± 3.9 0.002* TG, % 26.7 ± 17.4 26.5 ± 17.3 28.5 ± 17.5 0.124 TC, % 9.5 ± 6.3 9.3 ± 6.1 11.0 ± 7.8 0.004* HDL-c, % 10.7 ± 7.5 10.6 ± 7.4 11.5 ± 8.4 0.141 LDL-c, % 20.7 ± 11.1 20.5 ± 10.9 22.6 ± 12.7 0.028* Note. Data are means ± SDs and medians (IQRs) for continuous variables, or numbers (percentages) for categorical variables. *Statistically significant. BMI, Body mass index; CKD, chronic kidney disease; DBP, diastolic blood pressure; eGFR, estimated glomerular filtration rate; FPG, fasting plasma glucose; HDL-c, high-density lipoprotein cholesterol; IQR, interquartile range; LDL-c, low-density lipoprotein cholesterol; SBP, systolic blood pressure; SD, standard deviation; TC, total cholesterol; TG, triglyceride; UACR, urinary albumin-to-creatinine ratio. Table 1. Characteristics of participants with and without CKD
-
Table 2 shows the associations of VVV of FPG with the risk of CKD. After adjustment for confounding factors including mean FPG, the risk of CKD increased with increasing CV quartiles of FPG (P value for trend = 0.017). Participants in the highest quartile of CV-FPG had a 70% increased risk for CKD than those in the lowest quartile (OR = 1.70, 95% CI 1.06–2.72). In addition, the risk increased by 2% for each 1 increment in CV-FPG (OR = 1.02, 95% CI 1.00–1.03).
Measures of variability Cases/
No. of participantsCumulative incidence (%) OR (95% CI) Model 1 Model 2 Model 3 Quartiles of CV-FPG (%) Q1 (0–6.22) 33/529 6.2 1 (ref.) 1 (ref.) 1 (ref.) Q2 (6.22–9.65) 34/526 6.5 0.99 (0.60–1.63) 1.00 (0.60–1.66) 0.97 (0.58–1.61) Q3 (9.65–14.96) 43/527 8.2 1.30 (0.81–2.10) 1.19 (0.73–1.93) 1.10 (0.68–1.79) Q4 (14.96–78.23) 90/527 17.1 2.78 (1.81–4.27) 2.06 (1.30–3.26) 1.70 (1.06–2.72) P for trend < 0.001* < 0.001* 0.017* Each 1 increment 1.04 (1.03–1.05) 1.03 (1.01–1.04) 1.02 (1.00–1.03) Note. Model 1: adjusted for age, sex, waist circumference, current drinking, current smoking, and regular exercise. Model 2: adjusted for model 1 plus antidiabetic medications, baseline SBP, LDL-c, log10TG, and eGFR at the second visit. Model 3: adjusted for model 2 plus mean FPG. *Statistically significant. CI, Confidence interval; CKD, chronic kidney disease; CV, coefficient of variation; DBP, diastolic blood pressure; eGFR, estimated glomerular filtration rate; FPG, fasting plasma glucose; HDL-c, high-density lipoprotein cholesterol; LDL-c, low-density lipoprotein cholesterol; SBP, systolic blood pressure; TC, total cholesterol; TG, triglyceride; VVV, visit-to-visit variability; OR, odds ratios. Table 2. Odds ratios and 95% confidence intervals of CKD by the VVV of FPG
-
Table 3 shows the associations of VVV of BP with the risk of CKD. After adjustment for confounding factors including mean SBP, participants in the highest quartile of CV-SBP had a 62% increased risk for CKD than those in the lowest quartile (OR = 1.62, 95% CI 1.04–2.50). In addition, the risk increased by 4% for each 1 increment in CV-SBP (OR = 1.04, 95% CI 1.01–1.08). However, no significant association with the risk of CKD was found for higher quartiles of CV-DBP than for the lowest quartile.
Measures of variability Cases/
No. of participantsCumulative incidence (%) OR (95% CI) Model 1 Model 2 Model 3 Quartiles of CV-SBP (%) Q1 (0–4.29) 38/528 7.2 1 (ref.) 1 (ref.) 1 (ref.) Q2 (4.29–6.65) 52/526 9.9 1.38 (0.88–2.15) 1.31 (0.84–2.07) 1.31 (0.83–2.06) Q3 (6.65–9.83) 43/528 8.1 1.07 (0.67–1.70) 1.07 (0.67–1.71) 1.05 (0.66–1.69) Q4 (9.83–31.87) 67/527 12.7 1.76 (1.15–2.70) 1.69 (1.10–2.62) 1.62 (1.04–2.50) P for trend 0.027* 0.041* 0.072 Each 1 increment 1.05 (1.02–1.09) 1.05 (1.01–1.08) 1.04 (1.01–1.08) Quartiles of CV-DBP (%) Q1 (0–3.91) 38/528 7.2 1 (ref.) 1 (ref.) 1 (ref.) Q2 (3.91–6.06) 40/526 7.6 1.01 (0.63–1.61) 1.02 (0.64–1.64) 1.02 (0.64–1.65) Q3 (6.06–8.70) 54/528 10.2 1.34 (0.86–2.08) 1.32 (0.84–2.06) 1.34 (0.85–2.10) Q4 (8.70–32.39) 68/527 12.9 1.61 (1.05–2.47) 1.41 (0.91–2.18) 1.47 (0.95–2.28) P for trend 0.011* 0.069 0.044* Each 1 increment 1.04 (1.00–1.08) 1.02 (0.98–1.06) 1.02 (0.99–1.06) Note. Model 1: adjusted for age, sex, waist circumference, current drinking, current smoking, and regular exercise. Model 2: adjusted for model 1 plus antihypertensive medications, baseline DBP (for the CV of SBP), SBP (for the CV of DBP), FPG, LDL-c, log10TG, and eGFR at the second visit. Model 3: adjusted for model 2 plus mean SBP (for the CV of SBP) or DBP (for the CV of DBP). *Statistically significant. CI, Confidence interval; CKD, chronic kidney disease; CV, coefficient of variation; DBP, diastolic blood pressure; eGFR, estimated glomerular filtration rate; FPG, fasting plasma glucose; HDL-c, high-density lipoprotein cholesterol; LDL-c, low-density lipoprotein cholesterol; VVV, visit-to-visit variability; OR, odds ratios; SBP, systolic blood pressure; TC, total cholesterol; TG, triglyceride. Table 3. Odds ratios and 95% confidence intervals of CKD by the VVV of BP
-
Table 4 shows the associations of VVV of lipids with the risk of CKD. After adjustment for confounding factors including mean LDL-c, participants in the highest quartile of CV-LDL had an 85% increased risk for CKD compared with the lowest quartile (OR = 1.85, 95% CI 1.23–2.80). In addition, the risk increased by 2% for each 1 increment in CV-LDL (OR = 1.02, 95% CI 1.00–1.03). However, no significant associations with the risk of CKD were found for higher quartiles of CV-TG, CV-TC, and CV-HDL compared with their lowest quartiles.
Measures of variability Cases/
No. of participantsCumulative incidence (%) OR (95% CI) Model 1 Model 2 Model 3 Quartiles of CV-TG (%) Q1 (0–14.62) 34/527 6.5 1 (ref.) 1 (ref.) 1 (ref.) Q2 (14.62–23.21) 59/528 11.2 1.83 (1.17–2.86) 1.76 (1.11–2.77) 1.75 (1.11–2.77) Q3 (23.21–34.29) 50/527 9.5 1.63 (1.03–2.58) 1.63 (1.02–2.60) 1.62 (1.02–2.59) Q4 (34.29–137.16) 57/527 10.8 1.78 (1.14–2.80) 1.56 (0.98–2.47) 1.54 (0.96–2.45) P for trend 0.035* 0.130 0.148 Each 1 increment 1.01 (1.00–1.02) 1.01 (1.00–1.01) 1.01 (1.00–1.01) Quartiles of CV-TC (%) Q1 (0–5.20) 51/526 9.7 1 (ref.) 1 (ref.) 1 (ref.) Q2 (5.20–8.11) 31/529 5.9 0.58 (0.37–0.94) 0.60 (0.37–0.96) 0.60 (0.37–0.96) Q3 (8.11–12.08) 52/527 9.9 1.04 (0.69–1.57) 0.98 (0.64–1.49) 0.98 (0.64–1.49) Q4 (12.08–59.43) 66/527 12.5 1.35 (0.91–2.01) 1.26 (0.84–1.89) 1.26 (0.84–1.90) P for trend 0.026* 0.088 0.090 Each 1 increment 1.04 (1.01–1.06) 1.03 (1.01–1.05) 1.03 (1.01–1.05) Quartiles of CV-HDL (%) Q1 (0–5.74) 51/528 9.7 1 (ref.) 1 (ref.) 1 (ref.) Q2 (5.74–9.13) 42/526 8.0 0.83 (0.54–1.28) 0.79 (0.51–1.24) 0.79 (0.51–1.23) Q3 (9.13–13.85) 46/527 8.7 0.87 (0.57–1.33) 0.88 (0.57–1.36) 0.87 (0.56–1.35) Q4 (13.85–68.96) 61/528 11.6 1.18 (0.79–1.77) 1.14 (0.75–1.71) 1.11 (0.74–1.68) P for trend 0.375 0.445 0.505 Each 1 increment 1.01 (0.99–1.03) 1.01 (0.99–1.03) 1.01 (0.99–1.03) Quartiles of CV-LDL (%) Q1 (0–13.05) 48/528 9.1 1 (ref.) 1 (ref.) 1 (ref.) Q2 (13.05–19.08) 44/527 8.3 0.91 (0.59–1.41) 0.87 (0.56–1.36) 0.87 (0.56–1.36) Q3 (19.08–26.73) 33/526 6.3 0.75 (0.47–1.19) 0.70 (0.43–1.13) 0.70 (0.43–1.13) Q4 (26.73–79.55) 75/528 14.2 1.91 (1.28–2.84) 1.86 (1.24–2.79) 1.85 (1.23–2.80) P for trend 0.003* 0.005* 0.007* Each 1 increment 1.02 (1.01–1.03) 1.02 (1.00–1.03) 1.02 (1.00–1.03) Note. Model 1: adjusted for age, sex, waist circumference, current drinking, current smoking, and regular exercise. Model 2: adjusted for model 1 plus lipid-lowering medications, baseline SBP, FPG, LDL-c (for the CV of TG), log10TG (for the CV of TC, HDL-c, and LDL-c), and eGFR at the second visit. Model 3: adjusted for model 2 plus mean TG (for the CV of TG), mean TC (for the CV of TC), mean HDL-c (for the CV of HDL-c), or mean LDL-c (for the CV of LDL-c). *Statistically significant. CI, Confidence interval; CKD, chronic kidney disease; CV, coefficient of variation; DBP, diastolic blood pressure; eGFR, estimated glomerular filtration rate; FPG, fasting plasma glucose; HDL-c, high-density lipoprotein cholesterol; LDL-c, low-density lipoprotein cholesterol; OR, odds ratios; SBP, systolic blood pressure; TC, total cholesterol; TG, triglyceride; VVV, visit-to-visit variability. Table 4. Odds ratios and 95% confidence intervals of CKD by the VVV of lipids
-
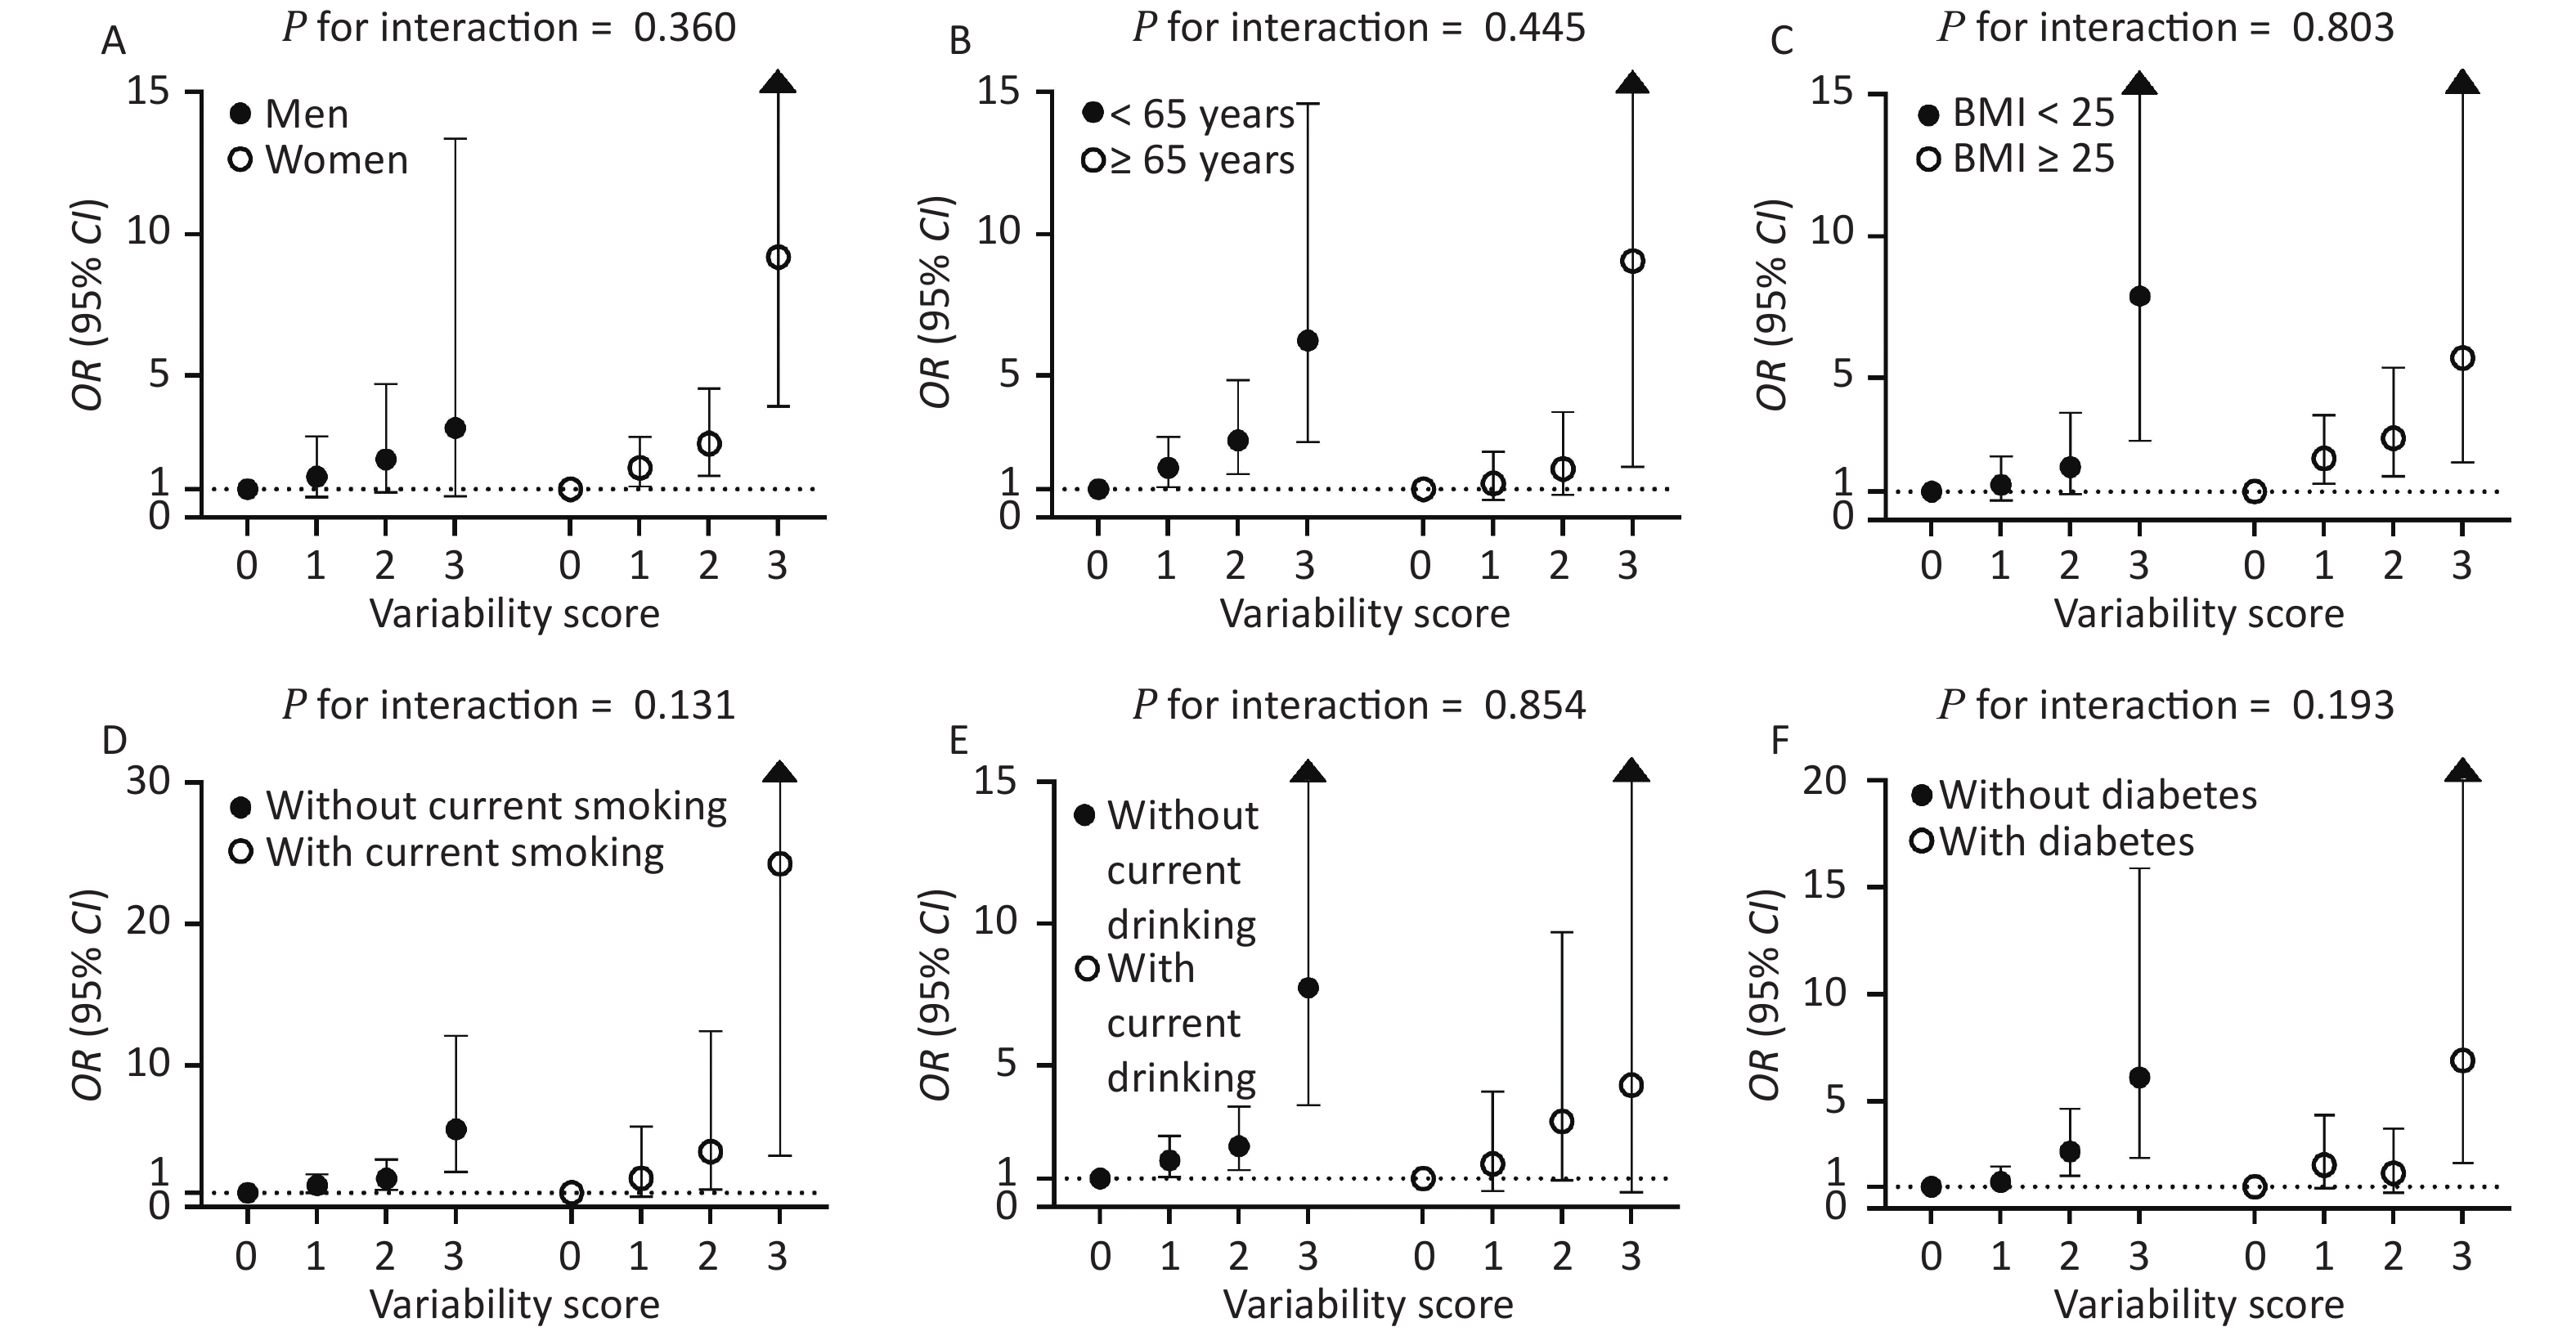
The CV-FPG, CV-SBP, and CV-LDL significantly associated with CKD were used to calculate the variability score. Therefore, the variability score had a range of 0–3. The cumulative incidence of CKD was 5.5%, 10.0%, 16.6%, and 32.0% in participants with a variability score of 0, 1, 2, and 3, respectively (Figure 2). Using participants with a variability score of 0 as the reference, the risk of CKD increased by 58% (OR = 1.58, 95% CI 1.08–2.32), 121% (OR = 2.21, 95% CI 1.40–3.49), and 548% (OR = 6.48, 95% CI 3.18–13.21) for participants with a variability score of 1, 2, and 3, respectively, after adjusting for traditional risk factors including mean FPG, mean SBP, and mean LDL-c (P value for trend < 0.001). The graded relationship between the variability score and the risk of CKD was consistent among subgroups of men and women, age < 65 and ≥ 65 years, BMI < 25 and ≥ 25 kg/m2, with and without current smoking, with and without current drinking, and with and without diabetes (all P values for interaction > 0.05; Figure 3).
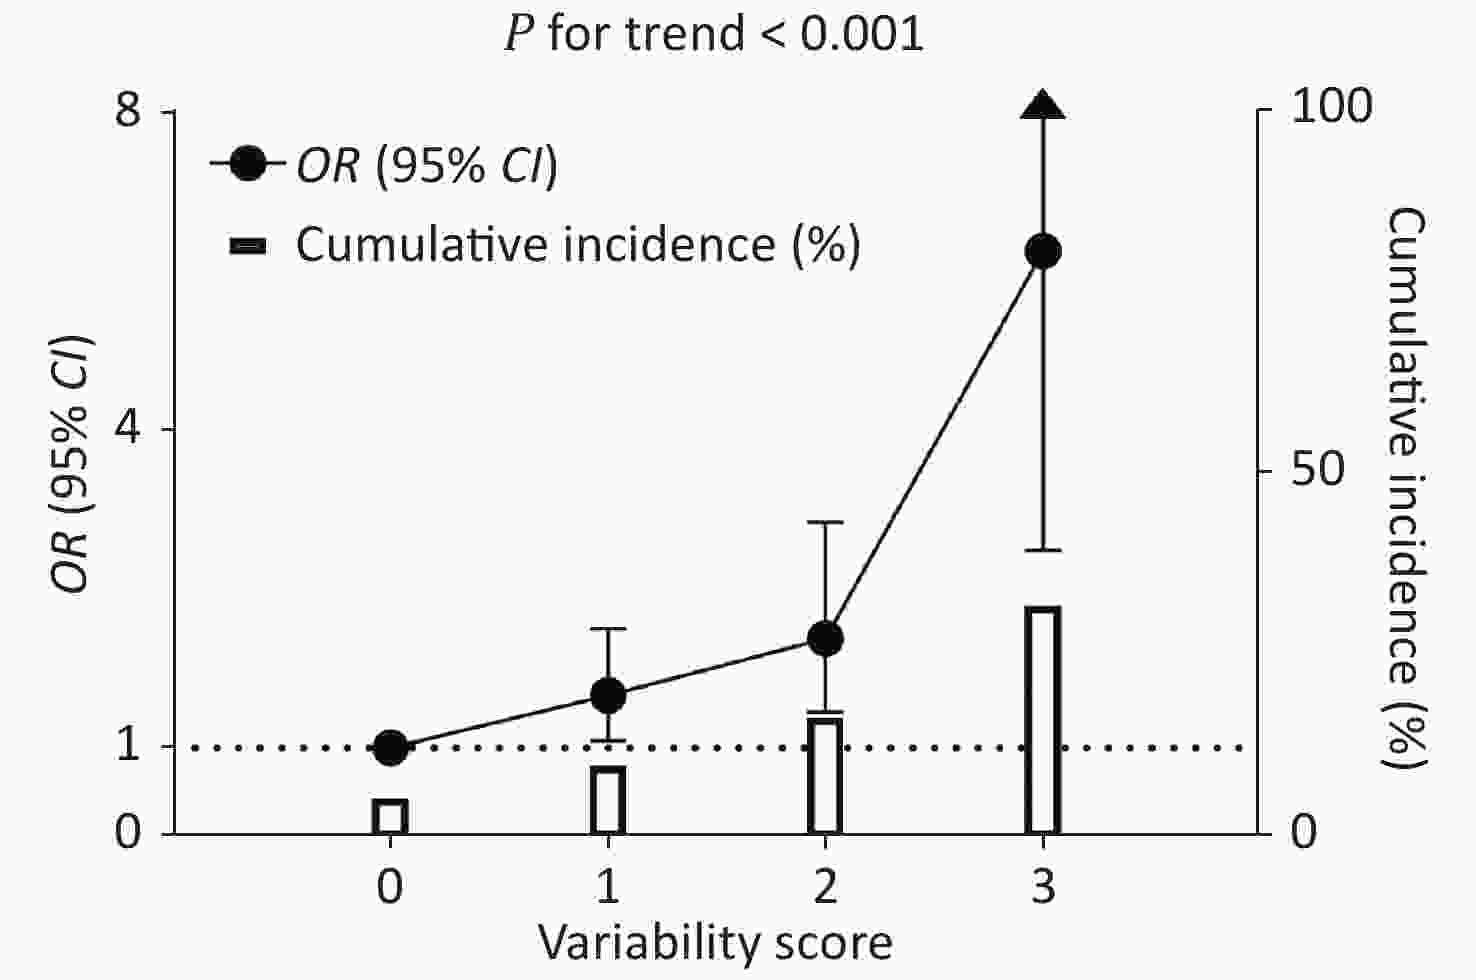
Figure 2. Cumulative incidence of CKD and the association between variability score and CKD risk. The hollow columns indicate a cumulative incidence of CKD. The black circles and bars indicate ORs and 95% CIs of CKD risk using participants with a score = 0 as the reference. The regression analysis was adjusted for age, sex, waist circumference, current drinking, current smoking, regular exercise, antidiabetic medications, antihypertensive medications, lipid-lowering medications, baseline log10TG, eGFR at the second visit, mean FPG, mean SBP, and mean LDL-c. OR: odds ratio; CI: confidence interval; FPG: fasting plasma glucose; SBP: systolic blood pressure; LDL-c: low-density lipoprotein cholesterol.
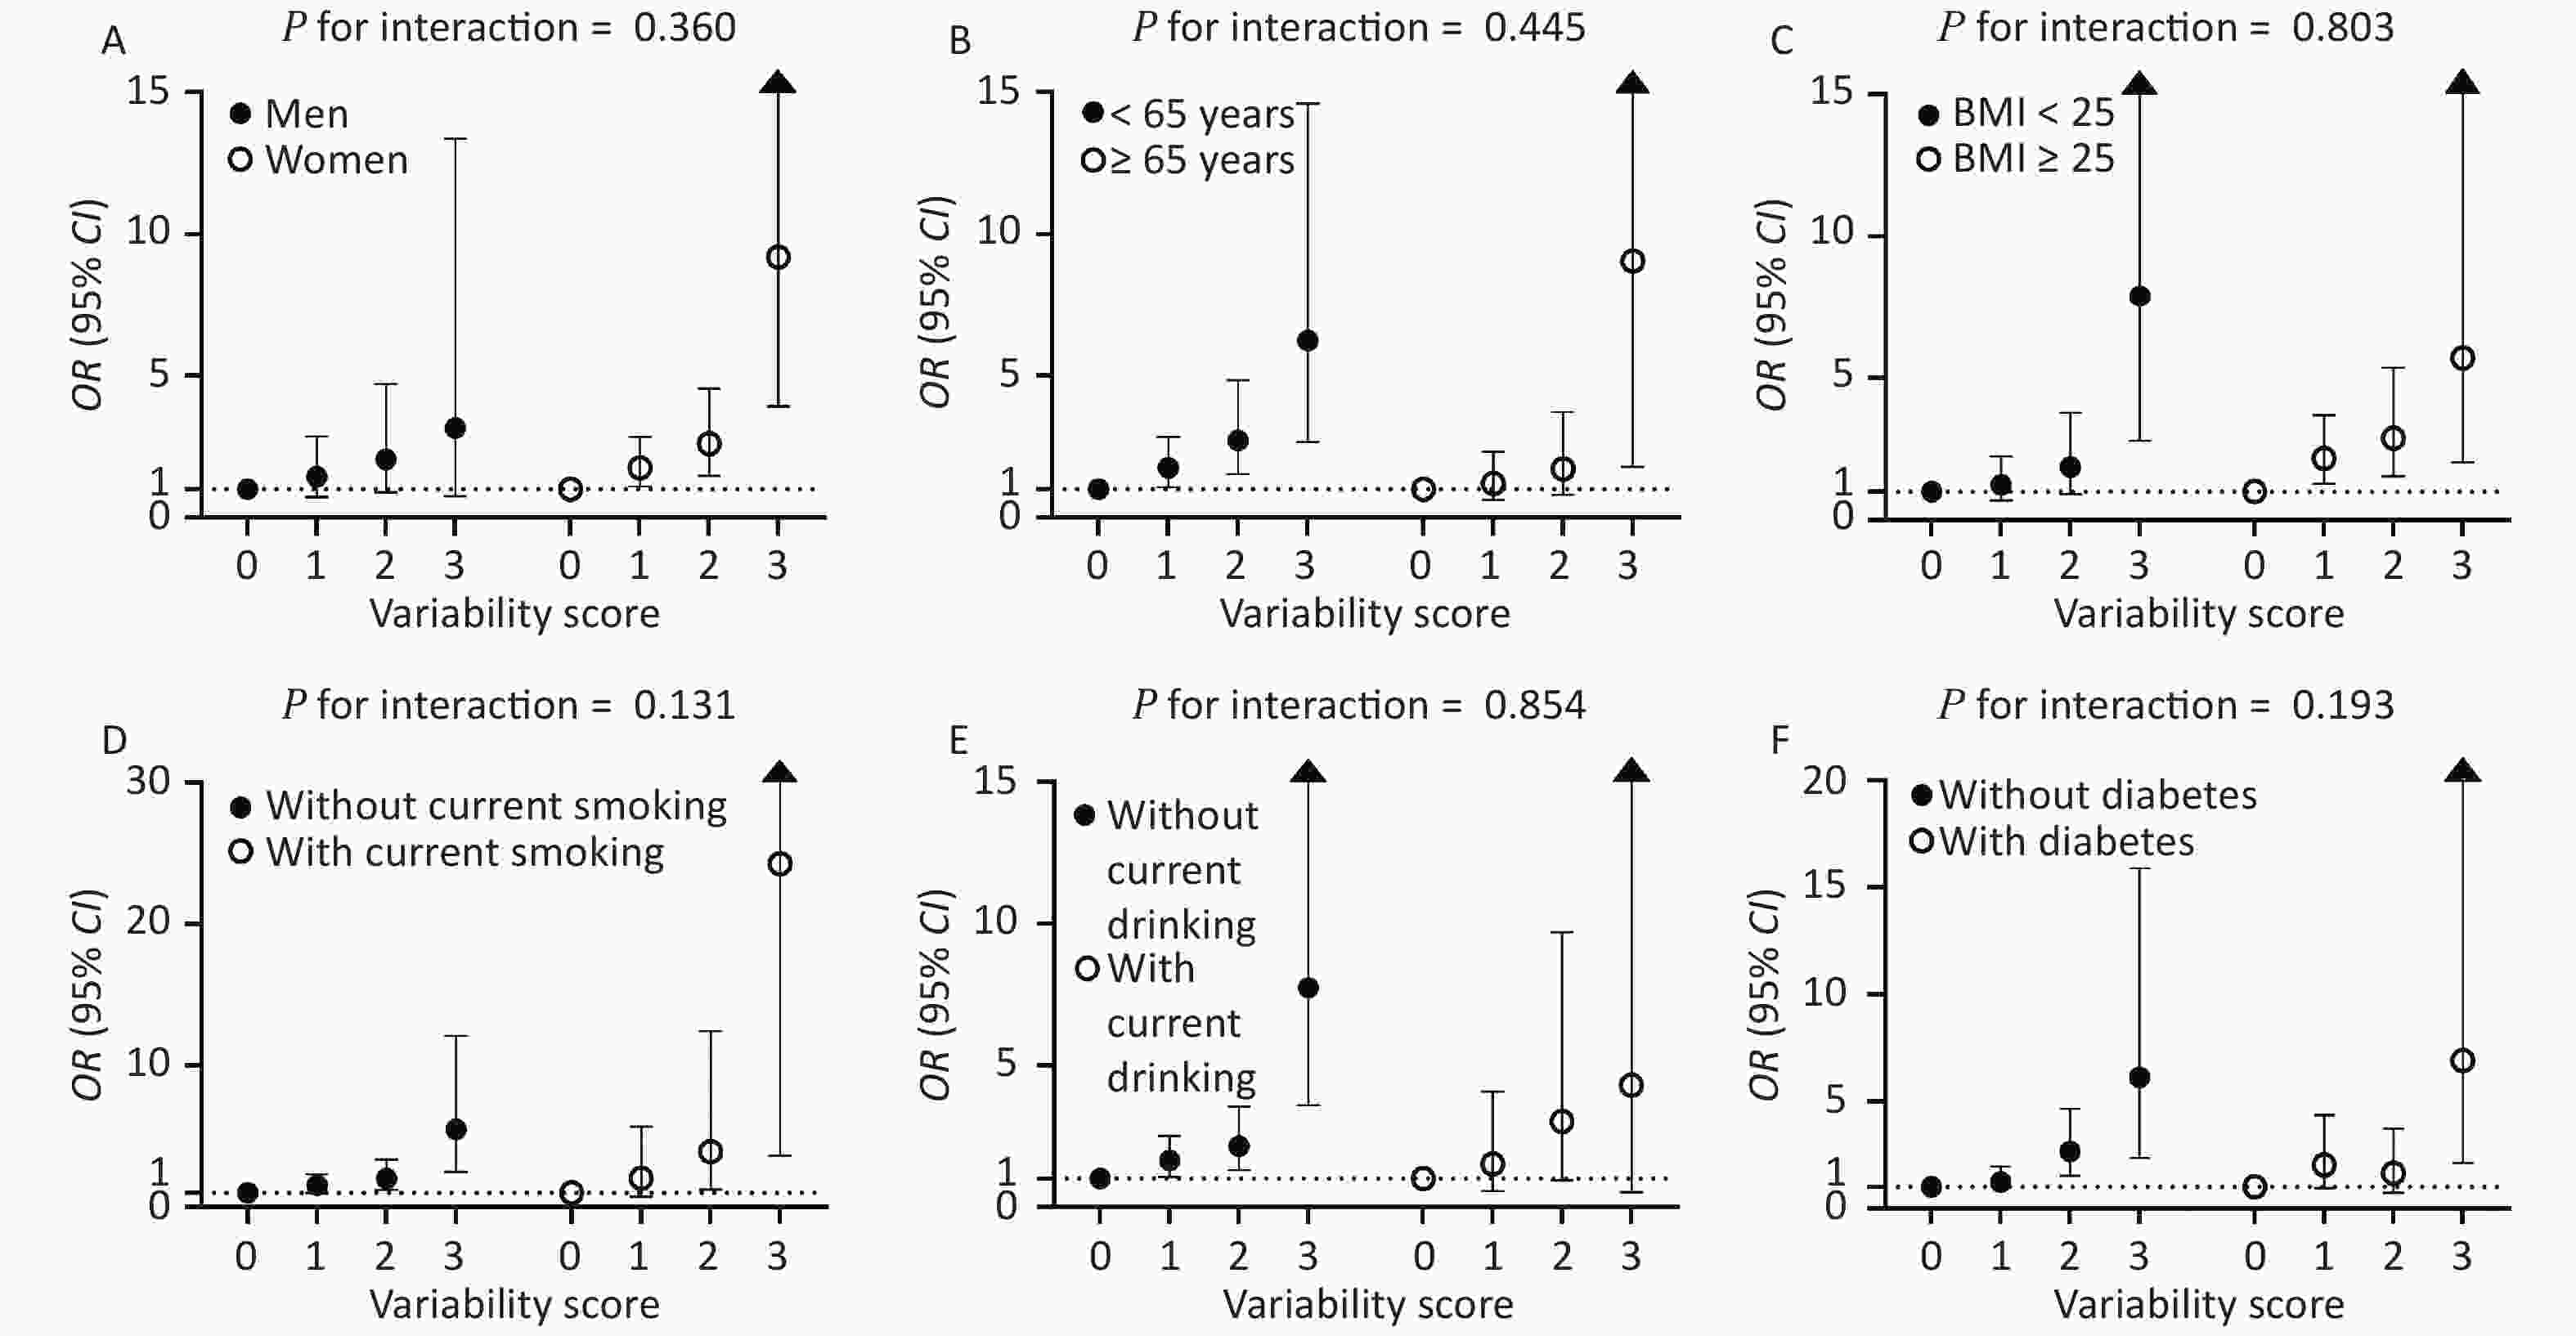
Figure 3. Associations of variability score with the risks of CKD stratified by sex (A), age (B), BMI (C), current smoking (D), current drinking (E), and diabetes status (F). The regression analysis was adjusted for age, sex, waist circumference, current drinking, current smoking, regular exercise, antidiabetic medications, antihypertensive medications, lipid-lowering medications, baseline log10TG, eGFR at the second visit, mean FPG, mean SBP, and mean LDL-c. OR: odds ratio; CI: confidence interval; BMI: body mass index; FPG: fasting plasma glucose; SBP: systolic blood pressure; LDL-c: low-density lipoprotein cholesterol.
-
This study found that the high variabilities in FPG, SBP, and LDL-c were associated with an increased risk of CKD in Shanghai community residents aged ≥ 40 years. Compared with the lowest quartile, participants in the highest quartile of metabolic factor (FPG, SBP, and LDL-c) variability had a significantly higher risk of CKD. In addition, a graded relationship was found between the variability score and the risk of CKD. These associations remained significant after multivariable adjustment for traditional risk factors, including mean levels of the aforementioned metabolic factors.
The VVV of FPG was significantly associated with CKD in the present study. Compared with constantly high glucose levels, oscillating glucose levels might have more deleterious effects on endothelial function and oxidative stress[31]. Moreover, increased glycemic variability might be an indicator of the likely development of poor health, morbidity, or complications[32, 33]. Previous studies reported that glycemic VVV predicts deterioration in renal function in patients with type 2 diabetes[34-36]. Another study found that the highest quartile of the hemoglobin A1c (HbA1c) variability (vs. the lowest quartile) was associated with a 30% higher risk of developing albuminuria (hazard ratio, HR = 1.3; 95% CI 1.1–1.6). In contrast, the highest quartile of HbA1c variability was not associated with a higher risk of decline in eGFR[37]. However, little was known about the relationship between the FPG variability and the CKD risk among the general population. The present study demonstrated a significant association among Shanghai community residents.
The VVV of SBP was significantly associated with CKD in the present study. Prior studies indicated the associations of BP variability with incident CKD[38, 39]. In a Japanese study, long-term BP variability in 3 years was associated with the development of proteinuria or eGFR < 60 mL/min per 1.73 m2 among 48,587 adults without CKD or diabetes[38], which was in agreement with the current findings. Among patients with hypertension, long-term VVV of SBP over 15 years was an independent determinant of renal deterioration[40]. Furthermore, studies reported a higher risk of advanced renal disease such as ESRD associated with higher variabilities in SBP in patients with diabetes[5]. These findings supported the hypothesis that SBP variability was an important predictor of the progression of CKD. The underlying mechanisms are not well-known. Some studies found that participants with a higher variability in SBP had significantly higher renal vascular resistance[21]. Increased BP variability might contribute to impaired endothelial function by enhancing neointimal formation and inhibiting nitric oxide production[20].
The VVV of LDL-c was significantly associated with CKD in the present study. This was relevant because the glomerulus was adversely affected by the same pathophysiological factors that led to atherosclerosis, including impaired cholesterol metabolism, impaired chylomicron metabolism, inflammation, and oxidative stress[41]. In models of hyperlipidemia, the appearance of foam cells and the glomerular lipid deposits accompanied renal injury[42, 43]. VVV of lipid levels could directly contribute to the progression of CKD by leading to instability of the vascular wall due to fluctuations in the composition of lipid deposits. Substantial evidence supports a significant association between lipid variability and renal outcome. In a Korean population, greater VVV of TC was associated with a higher risk of ESRD[13]. In a Chinese community-based hypertensive population, the VVV of TC correlated with the renal function decline[44]. However, except LDL-c, no significant associations of TG, TC, and HDL-c variability with the risk of CKD were found in the present study. The different findings might be due to the differences in the characteristics of study participants, definitions of lipid variability, and covariates adjusted in the multivariable analyses.
The risk of CKD increased with an increase in variability score, suggesting that the associations of variabilities in FPG, SBP, and LDL-c with the outcome of CKD were synergistic. Similarly, Kim et al.[26] reported a graded association between the number of high-variability metabolic factors (FPG, SBP, TC, and BMI) and cardiovascular outcomes. The group with a high variability in all four metabolic factors was associated with a 2.27-fold higher risk of all-cause mortality (HR = 2.27; 95% CI 2.13–2.42), 1.43-fold higher risk of myocardial infarction (HR = 1.43; 95% CI 1.25–1.64), and 1.41-fold higher risk of stroke (HR = 1.41; 95% CI 1.25–1.60) compared with low variability in all four metabolic factors[26]. In addition, similar results were obtained showing the relationship between the number of high variability metabolic factors and ESRD outcome[27]. Unlike the aforementioned previous studies, our study focused on the association of variabilities in FPG, SBP, and LDL-c with CKD. Our findings suggested that variabilities in FPG, SBP, and LDL-c might play an important role in the risk of CKD in an early stage. Moreover, the variability score was directly proportional to the cumulative incidence of CKD. This had important clinical and public health implications. Regular monitoring of FPG level, SBP, and LDL-c level should be implemented. Further, besides assessing glucose level, BP, and lipid level, an evaluation of metabolic factor variabilities should also be considered in the early prevention of CKD, even in the general population.
Our study had several strengths. A comprehensive assessment of metabolic factors, including glucose level, BP, and lipid level at three consecutive examinations in 2008, 2009, and 2013, was conducted, allowing for evaluating metabolic factor variabilities in a general population of Shanghai community residents. The CKD was assessed using eGFR and UACR levels at both visits of 2009 and 2013. An extensive adjustment for traditional risk factors was conducted, including adjustment for mean levels of the interested metabolic factors. Nevertheless, the study also had some limitations. First, the metabolic factor variability was calculated using FPG level, BP, and lipid level at the three visits, and eGFR and UACR were assessed at the second and third visits. We excluded participants having a history of kidney disease, eGFR < 60 mL/min per 1.73 m2, or UACR ≥ 30 mg/g. However, a prospective analysis with the assessment of incident CKD after the third visit is needed to better elucidate the potential causal relationship between metabolic factor variability and CKD. Second, eGFR was estimated using the 2009 CKD-EPI equation based on creatinine rather than directly measured. Third, most of our study participants with CKD were diagnosed based on UACR levels, which were assessed using a single morning urine sample. Fourth, our study was conducted on middle-aged and elderly Chinese with a mean age of approximately 60 years recruited from a single community center. Therefore, it was uncertain whether these findings could be generalized to other ethnic and age groups or geographical areas. Finally, no consensus exists on the ideal statistical measure for metabolic factor variabilities; CV was used to reduce the effect of the mean value.
-
Our findings suggested that greater variabilities in FPG level, SBP, and LDL-c level were associated with an increased risk of CKD, independent of the mean levels of these metabolic factors. Besides, the risk of CKD further increased in participants with a higher variability score calculated using variabilities in three metabolic factors in a graded manner. The co-existence of high variabilities in FPG level, SBP, and LDL-c level conferred the highest risk of CKD. Our findings provided additional evidence of the adverse effects of long-term variability in FPG level, SBP, and LDL-c level on the risk of CKD, highlighting the importance of stable FPG level, SBP, and LDL-c level in the long-term prevention of CKD.
-
LI Ling, XU Yu, CAI Wei Min, and NING Guang contributed to the study design and concept. LI Ling and WANG Fei analyzed the data and drafted the manuscript. XU Min and LU Jie Li participated in the acquisition, analysis, and interpretation of the data. ZHAO Zhi Yun, LI Mian, WANG Tian Ge, WANG Shuang Yuan, and BI Yu Fang helped with the acquisition of the data. XU Yu, CAI Wei Min, and NING Guang critically revised the manuscript for important intellectual content. All authors have approved the final version to be published.
-
The authors would like to thank all the field workers for their contribution to the study and the participants for their cooperation. All study participants provided written informed consent at the beginning of enrollment.
-
All authors consent for the publication of this manuscript.
-
The authors have no conflicts of interest to declare.
-
The underlying data in this manuscript arose from a dataset of the National Clinical Research Center for Metabolic Diseases, and cannot be released due to security considerations.
-
The study was approved by the Institutional Review Board of Ruijin Hospital, Shanghai Jiaotong University School of Medicine, and was in accordance with the Declaration of Helsinki. Written informed consent was obtained from each participant.
Funds:
This work was supported by the grants from the National Key R&D Program of China [2017YFC1310700, 2016YFC1305600, 2018YFC1311800, 2016YFC0901200]; the National Natural Science Foundation of China [81870560, 81700764, 81561128019]; the Shanghai Municipal Government [18411951800]; the Shanghai Shenkang Hospital Development Center [SHDC12019101]; the Shanghai Jiaotong University School of Medicine [DLY201801]; the Ruijin Hospital [2018CR002]; and the Shanghai Municipal Education Commission [HJWR20196619]
&These authors contributed equally to this work.
 Quick Links
 DownLoad: