


-
Type 2 diabetes mellitus (T2DM) is a major non-communicable chronic disease in the population and is a major threat to global public health. According to the International Diabetes Federation[1], there were at least 463 million patients with diabetes between the ages of 20 and 79 in 2019, and this number will rise to 700 million by 2045. Dyslipidemia is the most important factor that influences T2DM. At present, cross-sectional studies are mainly used to determine the correlation between single lipid index, lipid ratio, and T2DM and its complications[2]. Few studies have focused on dyslipidemia and its aggregation patterns in relation to T2DM.
China has the largest number of T2DM cases globally, and the standardized prevalence of diabetes and pre-diabetes in Chinese adults was 12.8% and 35.2% in 2017, respectively[3]. In addition, the prevalence of dyslipidemia in Chinese adults has increased from 18.60% to 53.20%, with an average annual growth rate of 7% over the past ten years[4]. Therefore, a prospective cohort study will be used to evaluate the effects of serum lipid levels, aggregation, and the combination of different types of dyslipidemia on T2DM incidence.
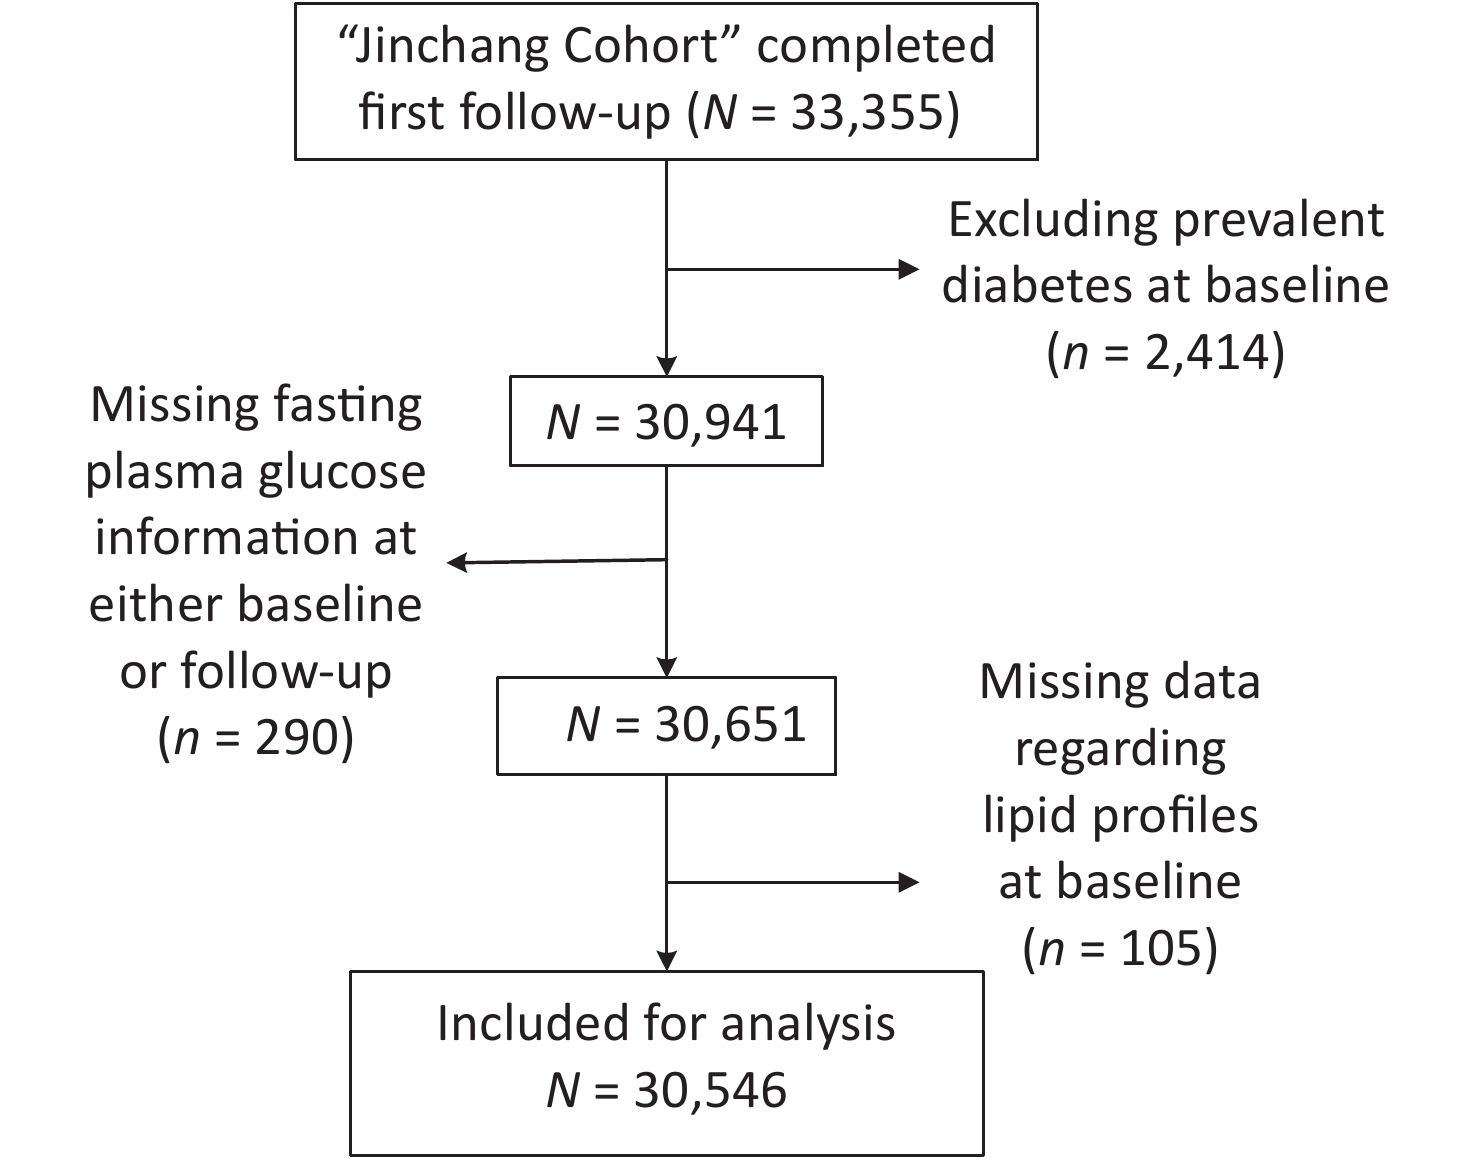
This study was conducted on the Jinchang Cohort platform[5]. This cohort consisted of all the employees (45,000 workers) in the Jinchuan Nonferrous Metals Corporation. The baseline survey began in June 2011 and ended in December 2013. The first follow-up survey was completed in December 2015. A total of 33,355 individuals completed the baseline and the first follow-up survey. Among these individuals, those with T2DM at baseline (n = 2,414) and incomplete fasting plasma glucose (n = 290) and lipid profile information including total cholesterol (TC), triglycerides (TG), low-density lipoprotein cholesterol (LDL-C), or high-density lipoprotein cholesterol (HDL-C) (n = 105) were excluded. In total, 30,546 participants were included in the study (Supplementary Figure S1, available in www.besjournal.com). The study protocol was approved by the ethical committee of the Public Health School of Lanzhou University.

Figure S1. Flow diagram of participant selection.
T2DM was defined according to the diagnostic criteria recommended by the American Diabetes Association[6]: a fasting plasma glucose (FPG) of ≥ 7.0 mmol/L and/or a self-reported clinical diagnosis of diabetes (patients were required to provide the name of the medical institution at which they were diagnosed and the time of diagnosis) and/or the self-reported use of antidiabetic drugs. According to the 2016 Chinese Guidelines for the Management of Dyslipidemia in Adults, dyslipidemia was defined based on the patients’ current lipid levels or the use of anti-dyslipidemia medication during the past 2 weeks. The cut-off values for higher TC, LDL-C, TG and lower HDL-C serum concentrations were TC ≥ 5.18 mmol/L, LDL-C ≥ 3.37 mmol/L, TG ≥ 1.70 mmol/L, and HDL-C < 1.04 mmol/L, respectively.
Hypertension was defined as a systolic blood pressure of ≥ 140 mmHg and/or a diastolic blood pressure of ≥ 90 mmHg, a self-reported clinical diagnosis of hypertension, or a prescription for antihypertensive medication. A family history of diabetes was defined as at least one of the first-degree relatives (parents and siblings) or second-degree relatives (grandparents, uncle, and aunt) having diabetes. Physical exercise levels were categorized as never, occasionally, or often. Dietary information included salt, oil, and sugar intake, and the levels of each substance were categorized into three groups (higher, moderate, and lower) based on individuals own subjective feelings. Smokers were defined as people who smoked at least one cigarette per day and continuously for at least 6 months. Drinkers were defined as those who drank at least once a week and continuously for more than 6 months.
This study was conducted as a prospective cohort study. A multivariate Cox regression model and restricted cubic spline functions were used to quantitatively calculate the intensity and dose-response relationship between different patterns of dyslipidemia and the risk of T2DM incidence after adjusting for confounding factors. The potential confounders included age, gender, marital status (married and others), family income per capita (< 2,000 yuan and ≥ 2,000 yuan), education level (junior high school and below, high school, undergraduate, and above), work type (management, technicians, services, and workers), smoking status (ever-smokers and never-smokers), drinking status (ever-drinkers and never-drinkers), body mass index (kg/m2, continuous variables), physical exercise levels (never, occasionally, and often), family history of diabetes (yes and no), dietary salt, oil, and sugar intake (higher, moderate, and lower), and other factors. The results were calculated as hazard ratio (HR) and 95% confidence interval (95% CI).
To determine the effect of dyslipidemia components on T2DM incidence, the participants were divided into four groups (0, 1, 2, and ≥ 3), according to the diagnostic criteria for dyslipidemia. Zero indicated that the participant did not have any abnormal lipid metabolism. One represented those with at least one type of dyslipidemia. Two indicated that participants had any of the two types of dyslipidemia. More than three indicated that the participants had any of the three or more types of dyslipidemia. By drawing a Venn diagram of dyslipidemia in newly diagnosed diabetic patients, combination patterns of dyslipidemia can be identified. Different patterns of the effect of dyslipidemia on T2DM incidence can also be estimated using the Cox proportional hazard regression model[7]. The P values for all hypothesis tests were two-sided, and P < 0.05 was interpreted as statistically significant. SAS 9.3 software (SAS Institute Inc., Cary, NC, USA) was used for all statistical analyses.
After a mean follow-up of 2.3 years (standard deviation: 0.5), 1,094 individuals (766 men and 328 women) were diagnosed with T2DM among the 30,546 eligible participants with a cumulative incidence rate of 3.58%. Diabetic individuals were male, older, had lower education levels and average family income, higher alcohol intake and incidence of current or previous smokers, and had a greater incidence of a family history of diabetes and hypertension than non-diabetic individuals (P < 0.001). The concentrations of serum TC, TG, LDL-C, and FBG at baseline were higher and the HDL-C concentrations were lower among newly diagnosed patients than among non-diabetic individuals (P < 0.001) (Supplementary Table S1, available in www.besjournal.com).
Characteristics T2DM (n = 1,094) Non-T2DM (n = 29,452) t/χ2 values P values Gender (n, %) Male 766 (70.02) 17,542 (59.56) 48.034 < 0.001 Female 328 (29.98) 11,910 (40.44) Age (years) 54.78 ± 12.21 45.25 ± 12.38 −25.325 < 0.001 Education level (n, %) Junior high school and below 622 (56.86) 10,409 (35.34) 241.370 < 0.001 High school 280 (25.59) 8,387 (28.48) Undergraduate and above 192 (17.55) 10,656 (36.18) Work type (n, %) Management 120 (11.97) 3,845 (13.06) 70.731 < 0.001 Technicians 40 (3.66) 1,402 (4.76) Services 104 (9.51) 1,265 (4.30) Workers 830 (75.87) 22,940 (77.89) Family income (yuan) (n, %) < 2,000 618 (56.49) 15,049 (51.10) 12.281 < 0.001 2,000– 476 (43.51) 14,403 (48.90) Marital status (n, %) Married 981 (89.67) 25,310 (85.94) 12.270 < 0.001 Others 113 (10.33) 4,142 (14.06) BMI (kg/m2, $\overline {\rm{X}} \pm {\rm{S}}$) 25.68 ± 3.23 23.32 ± 3.20 −23.704 0.563 Smokers (n, %) 593 (54.20) 12,875 (43.72) 47.083 < 0.001 Drinkers (n, %) 324 (29.62) 6,552 (22.25) 32.844 < 0.001 Physical exercise (n, %) Never 101 (9.23) 3,301 (11.21) 45.963 < 0.001 Occasionally 376 (34.37) 12,605 (42.80) Often 617 (56.40) 13,546 (45.99) Dietary salt intake level (n, %) Higher 277 (25.32) 6,513 (22.11) 13.433 0.001 Moderate 503 (46.00) 15,719 (51.54) Lower 314 (28.70) 7,760 (26.35) Dietary oil intake level (n, %) Higher 248 (22.70) 5,490 (18.64) 24.158 < 0.001 Moderate 557 (50.91) 17,171 (58.30) Lower 289 (26.42) 6,791 (23.06) Dietary sugar intake level (n, %) Higher 190 (17.37) 6,123 (20.79) 80.745 < 0.001 Moderate 310 (28.34) 11,309 (38.40) Lower 594 (54.30) 12,020 (48.81) Family history of DM (n, %) 189 (17.28) 4,241 (14.40) 7.038 0.008 Hypertension (n, %) 584 (53.82) 7,458 (25.57) 427.944 < 0.001 FPG (mmol/L, $\overline {\rm{X}} \pm {\rm{S}}$) 5.98 ± 0.62 5.03 ± 0.54 −50.221 < 0.001 TC (mmol/L, $\overline {\rm{X}} \pm {\rm{S}}$) 4.90 ± 0.96 4.68 ± 0.88 −8.056 < 0.001 TG (mmol/L, $\overline {\rm{X}} \pm {\rm{S}}$) 2.52 ± 1.87 1.88 ± 1.46 −11.067 < 0.001 HDL-C (mmol/L, $\overline {\rm{X}} \pm {\rm{S}}$) 1.26 ± 0.32 1.38 ± 0.35 12.020 < 0.001 LDL-C (mmol/L, $\overline {\rm{X}} \pm {\rm{S}}$) 3.17 ± 0.78 3.04 ± 0.74 −23.074 0.046 Table S1. Baseline characteristics of new onset T2DM and non-T2DM participants
As shown in Figure 1, the incidence of T2DM in patients with abnormal TC, TG, HDL-C, and LDL-C concentrations was 4.96%, 5.28%, 5.36%, and 4.32%, respectively, which was higher than those in the normal group (P < 0.05). After adjusting for confounding factors, only abnormal TC, TG, and HDL-C serum concentrations showed a significant association with T2DM onset, with HRs of 1.161 (95% CI: 1.006–1.339), 1.618 (95% CI: 1.423–1.841), and 1.393 (95% CI: 1.229–1.578), respectively. With increasing concentrations of TC, TG, and decreasing concentrations of HDL-C, the risk of T2DM also increased (P < 0.05). Studies have found that elevated TG and low HDL-C levels are early signs of insulin resistance[8].
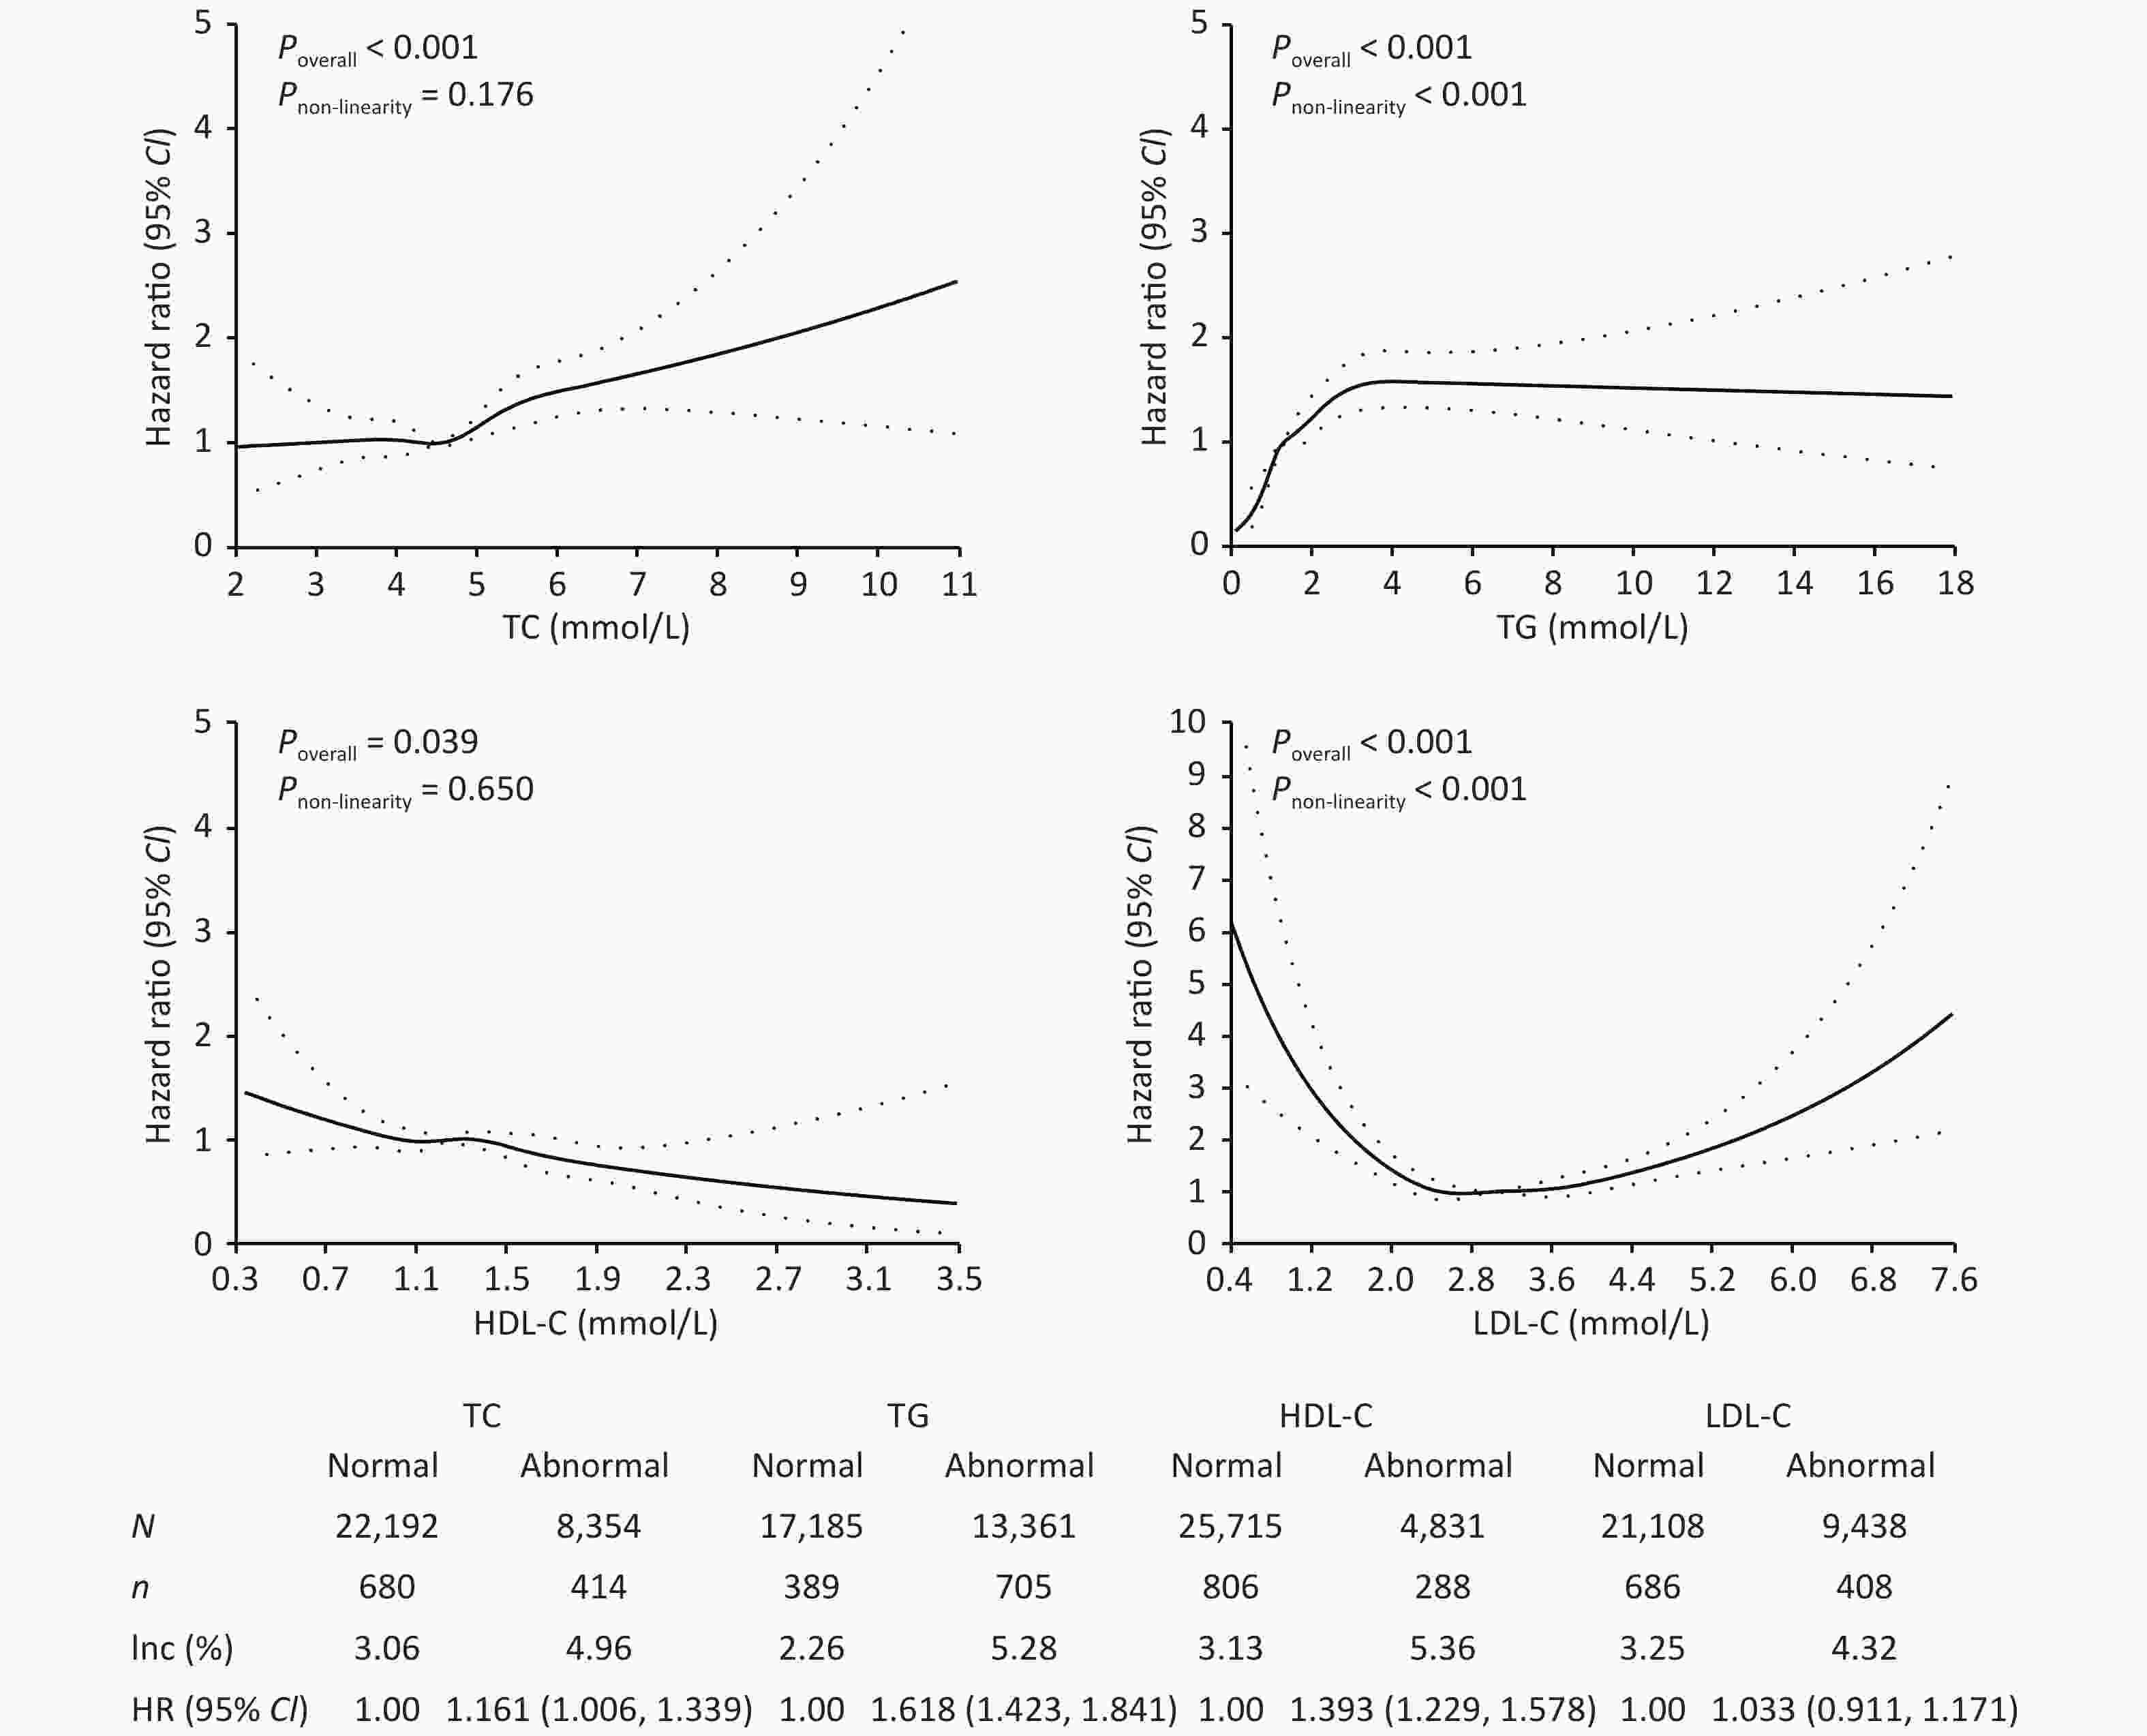
Figure 1. Effect of lipids on the risk of type 2 diabetes mellitus. TC, total cholesterol; TG, triglyceride; HDL-C, high-density lipoprotein cholesterol; LDL-C, low-density lipoprotein cholesterol; CI, confidence interval; Inc, incidence rate.
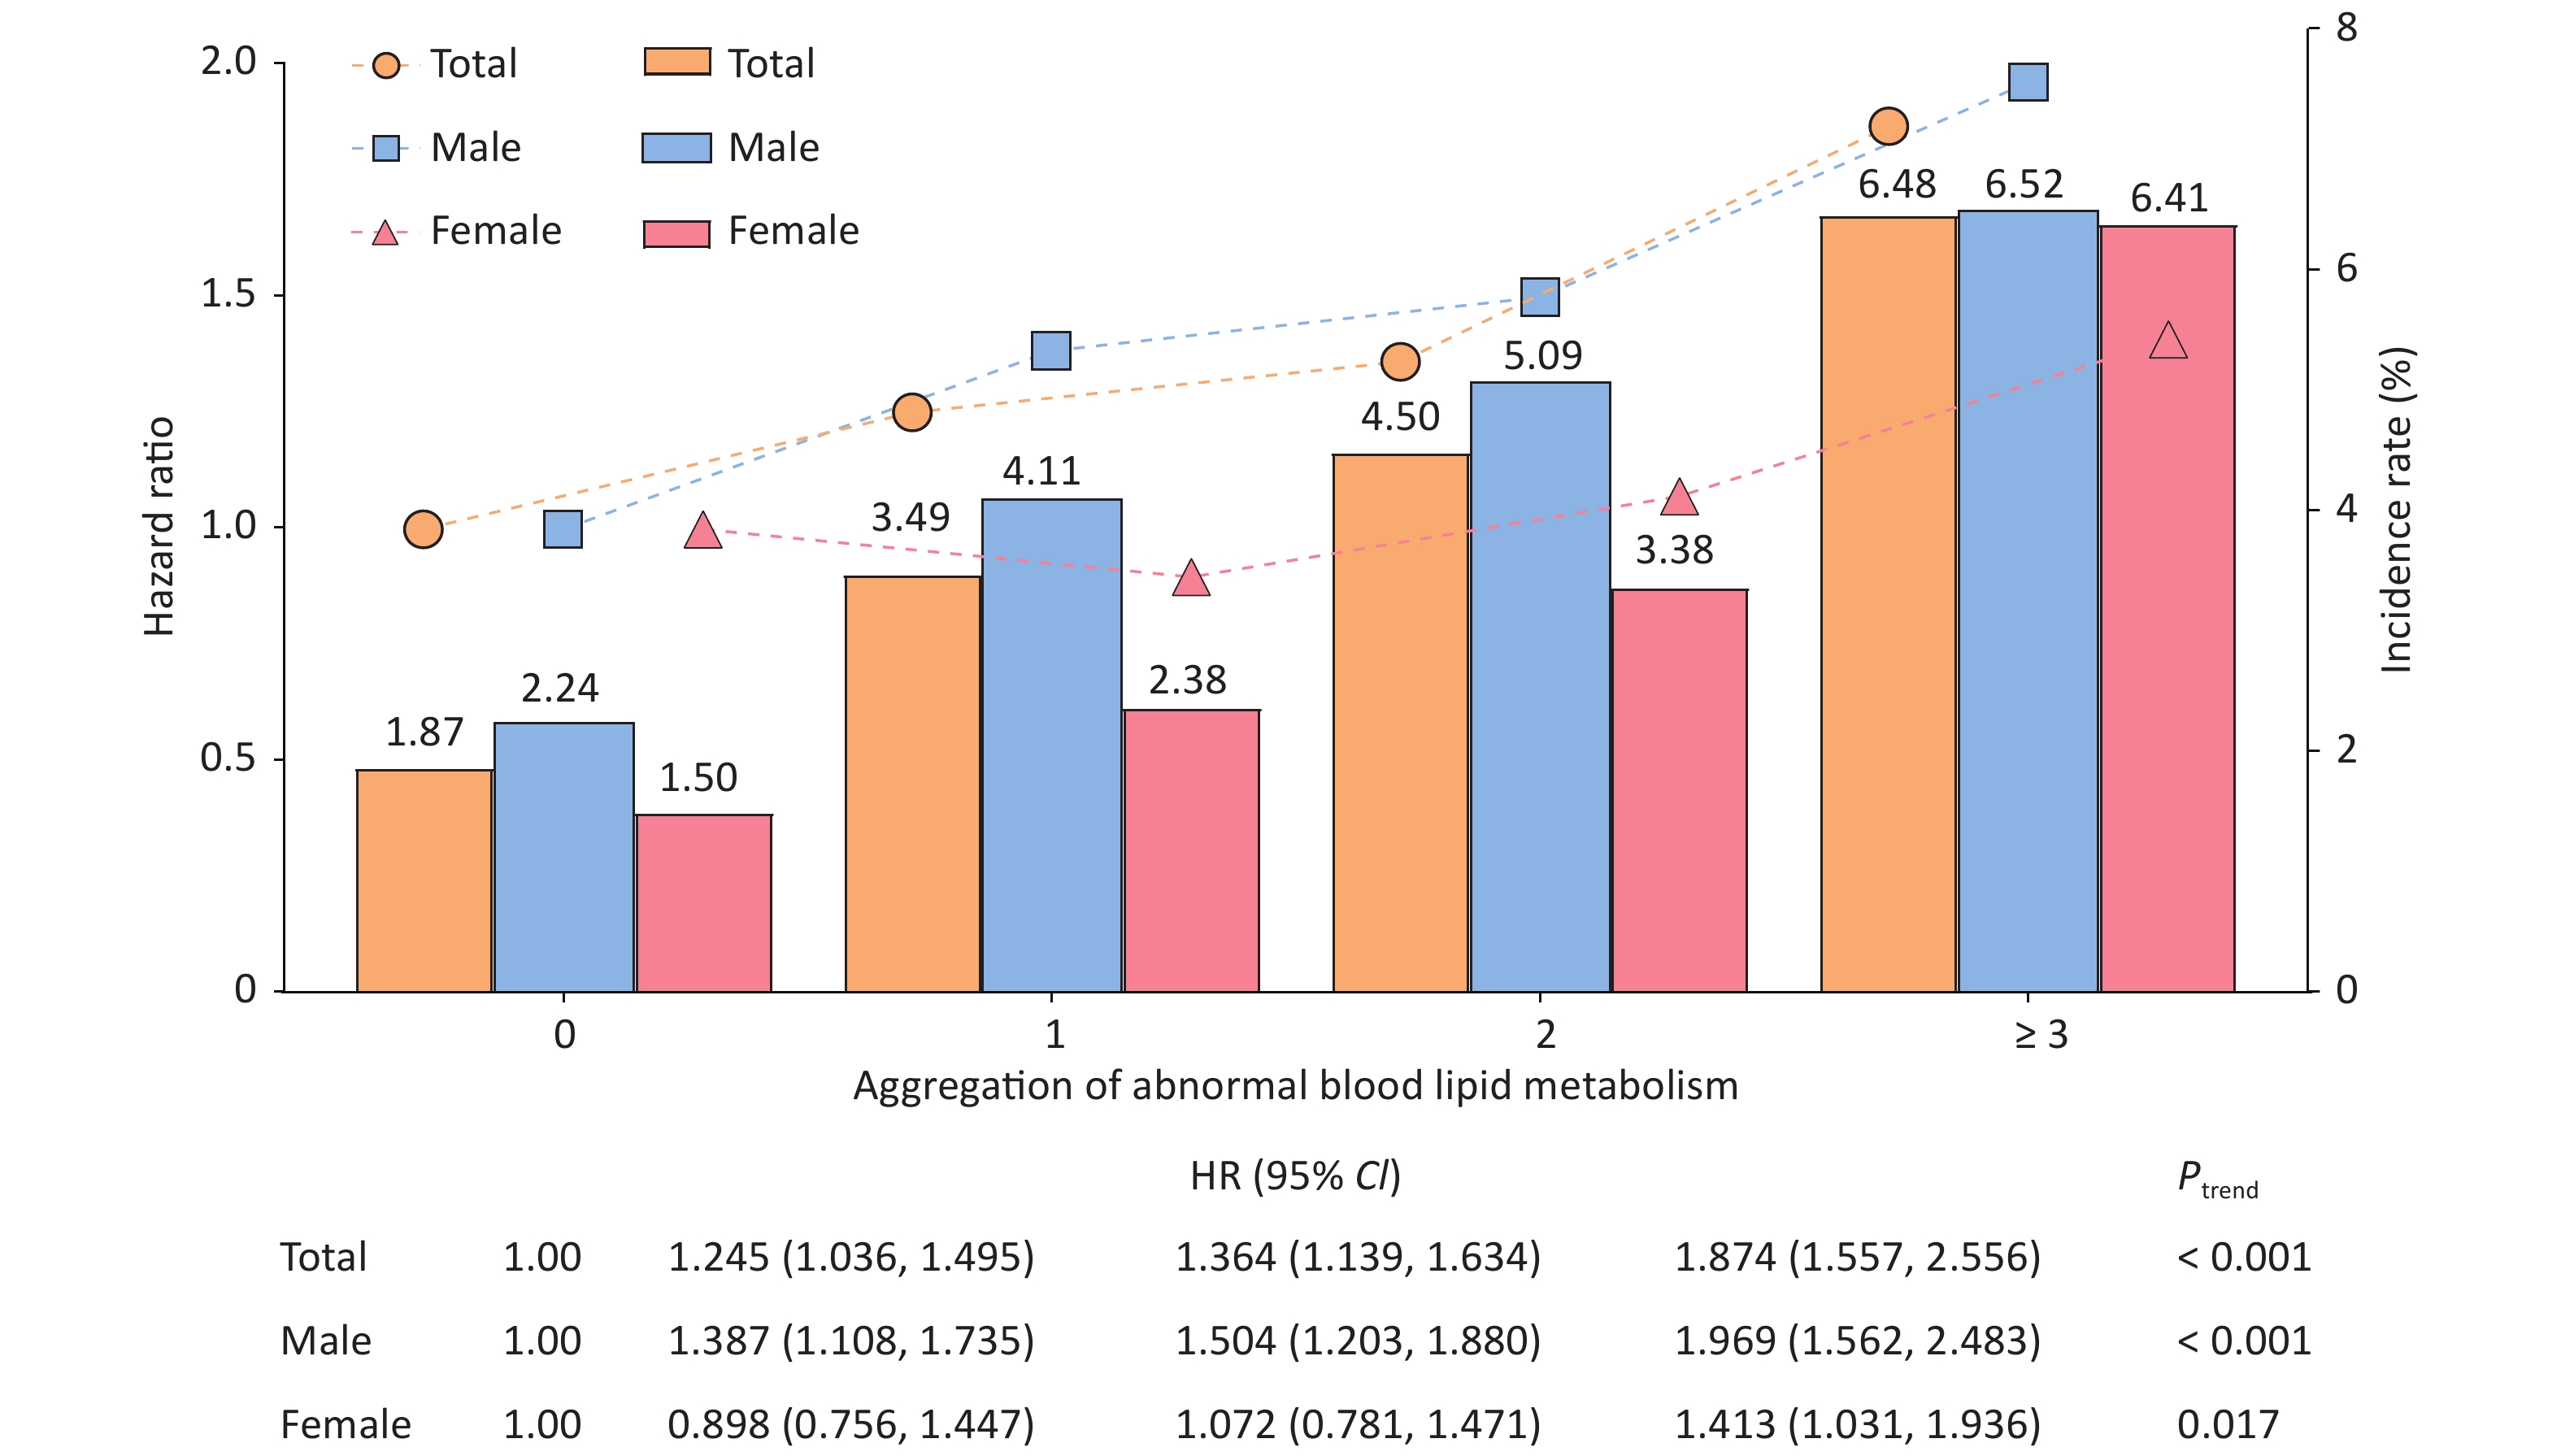
Analysis of the dyslipidemia aggregation showed that the incidence rates of T2DM in the four different groups were 1.87%, 3.49%, 4.50%, and 6.48%, respectively, in all populations. As the incidence of dyslipidemia increased, the risk of T2DM also increased (Ptrend < 0.001). The effect was maximized when the number of patients with dyslipidemia exceeded 3, and the adjusted HRs were 1.874 (95% CI: 1.557–2.256), 1.969 (95% CI: 1.562–2.483), and 1.413 (95% CI: 1.031–1.936) for total population, males, and females, respectively (Figure 2). Some studies have suggested that the combined abnormality of TG, TC, and HDL-C levels is the pathogenesis of "collective risk factors" for many chronic metabolic diseases, including diabetes[9], which illustrate that there is a phenomenon of "biological binding" between lipid molecules.
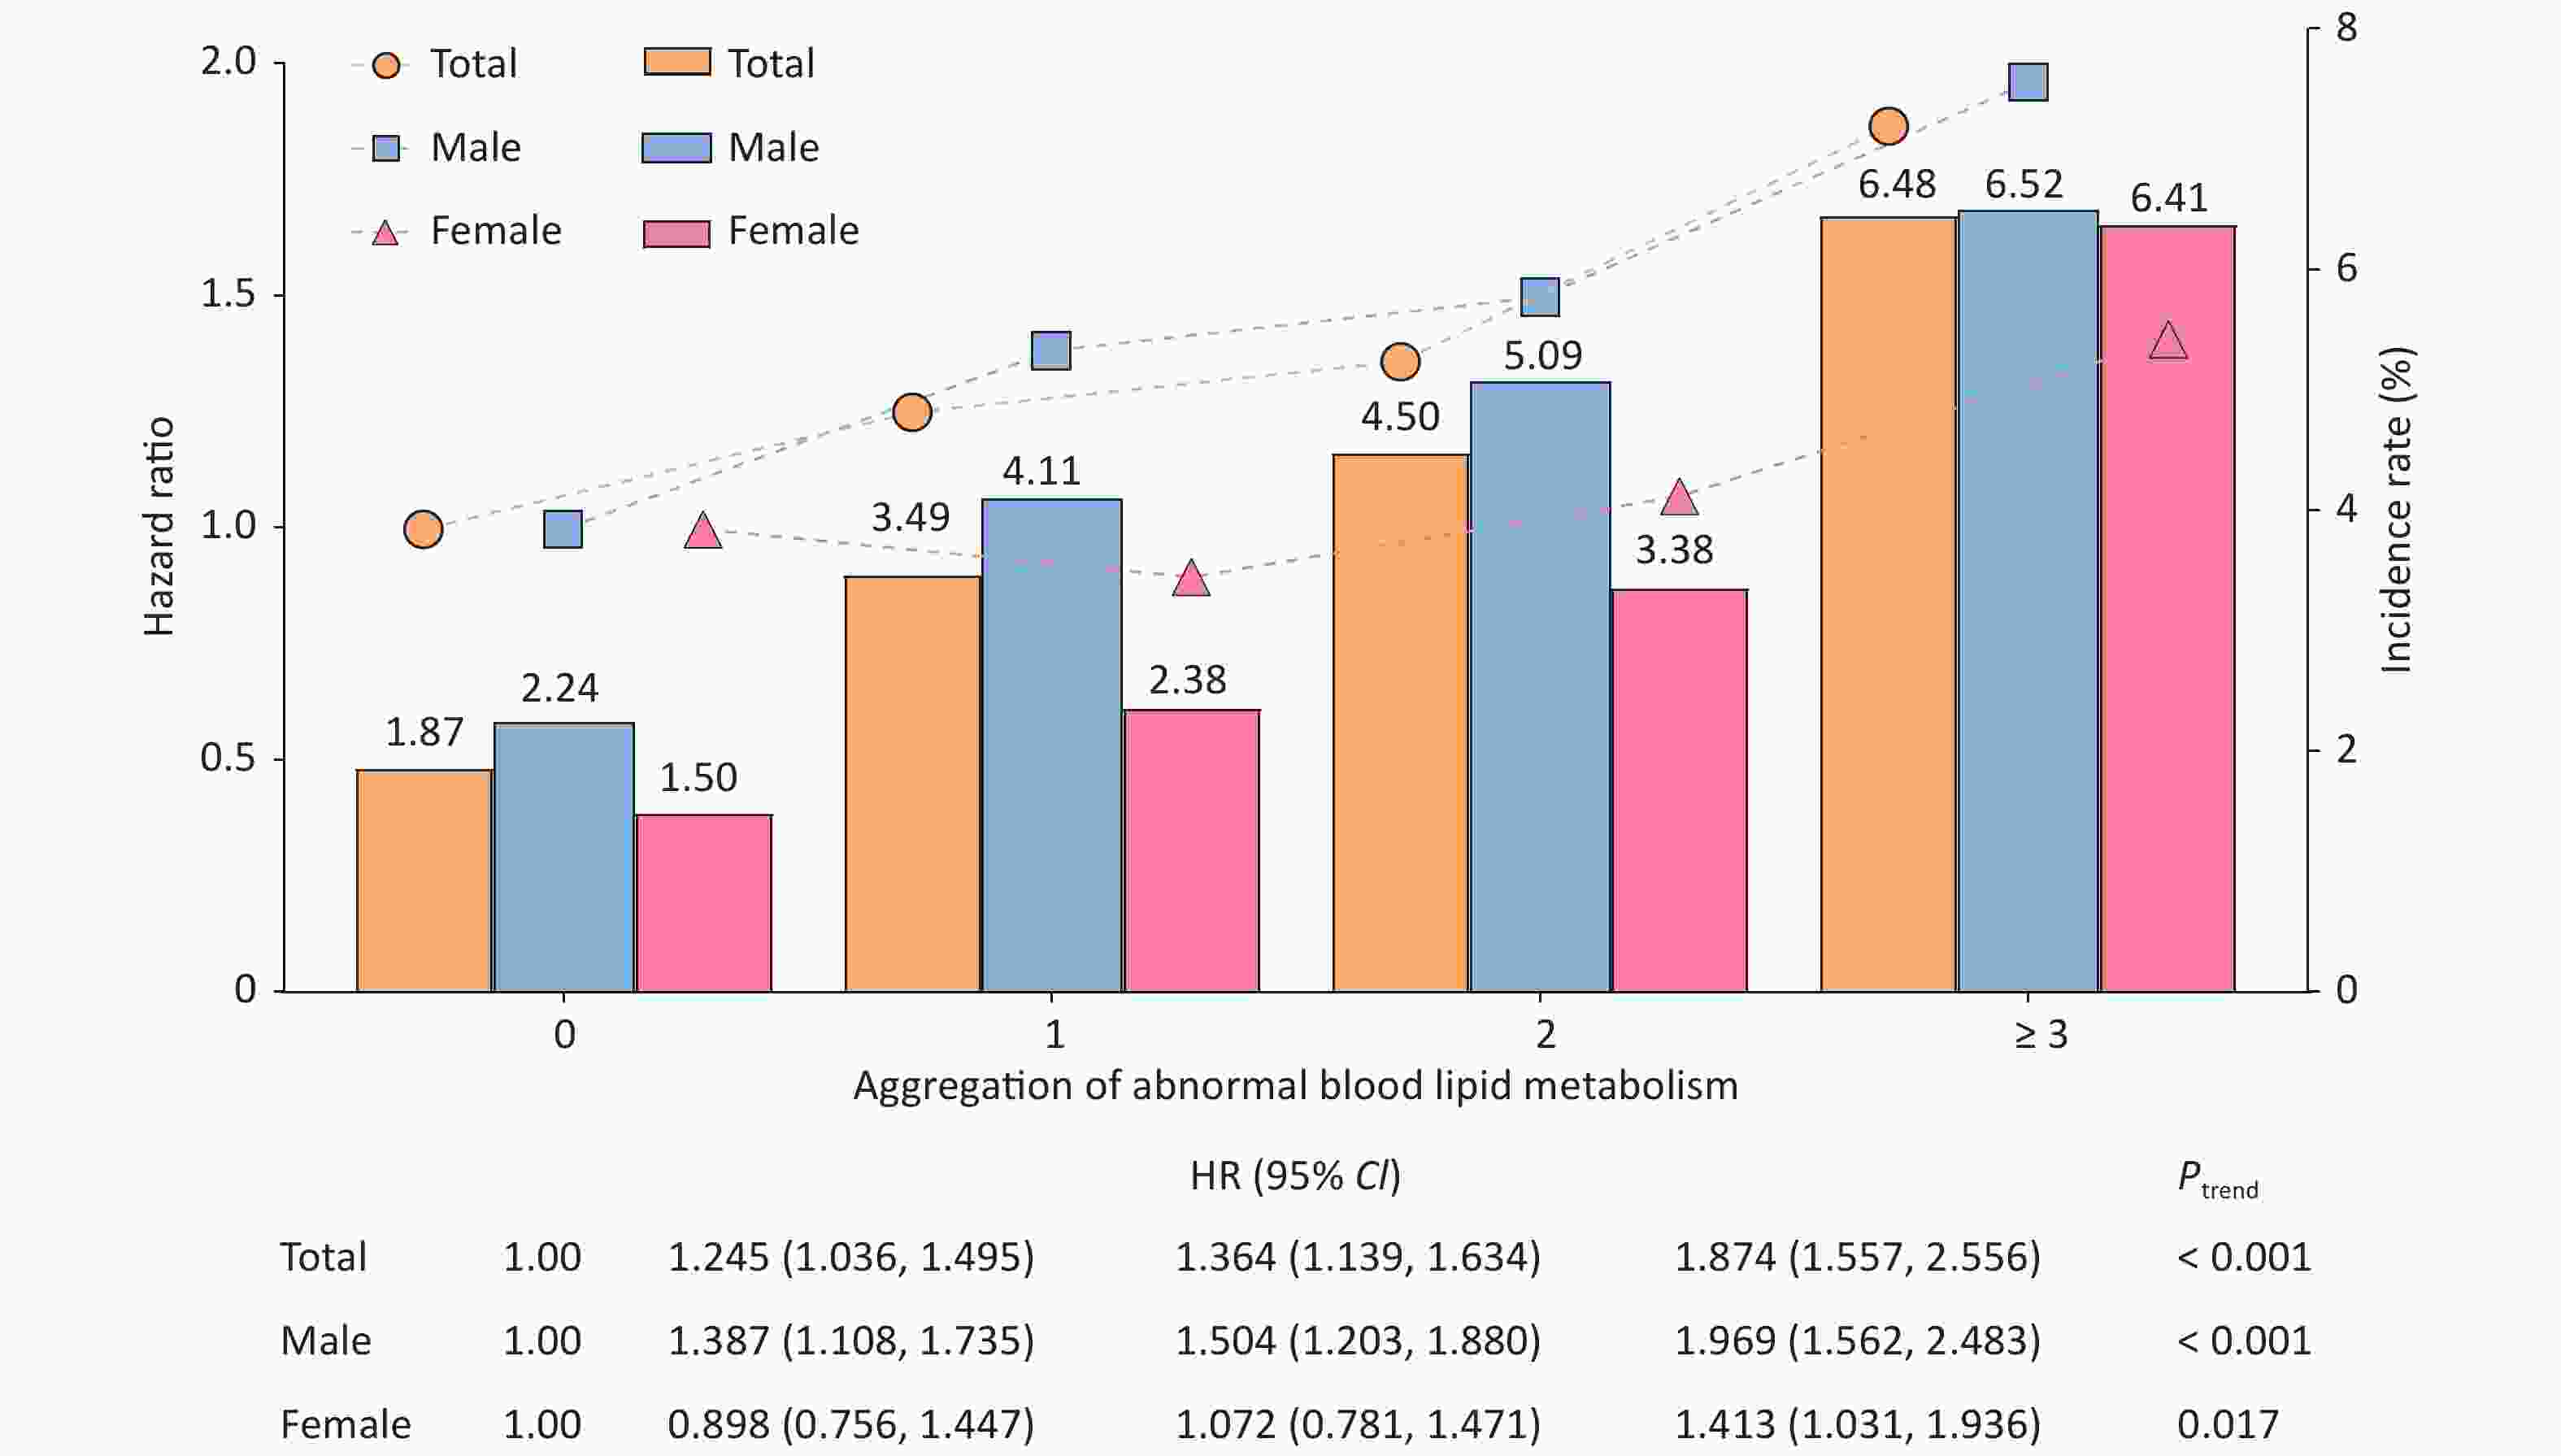
Figure 2. Association between the aggregation of abnormal serum lipid metabolism and the incidence of type 2 diabetes mellitus (T2DM). The bar graph represents the incidence of T2DM in different dyslipidemia aggregation groups. The broken line graph represents the Hazard ratio [HR] of the impact of differing serum lipid aggregation on the onset of T2DM.
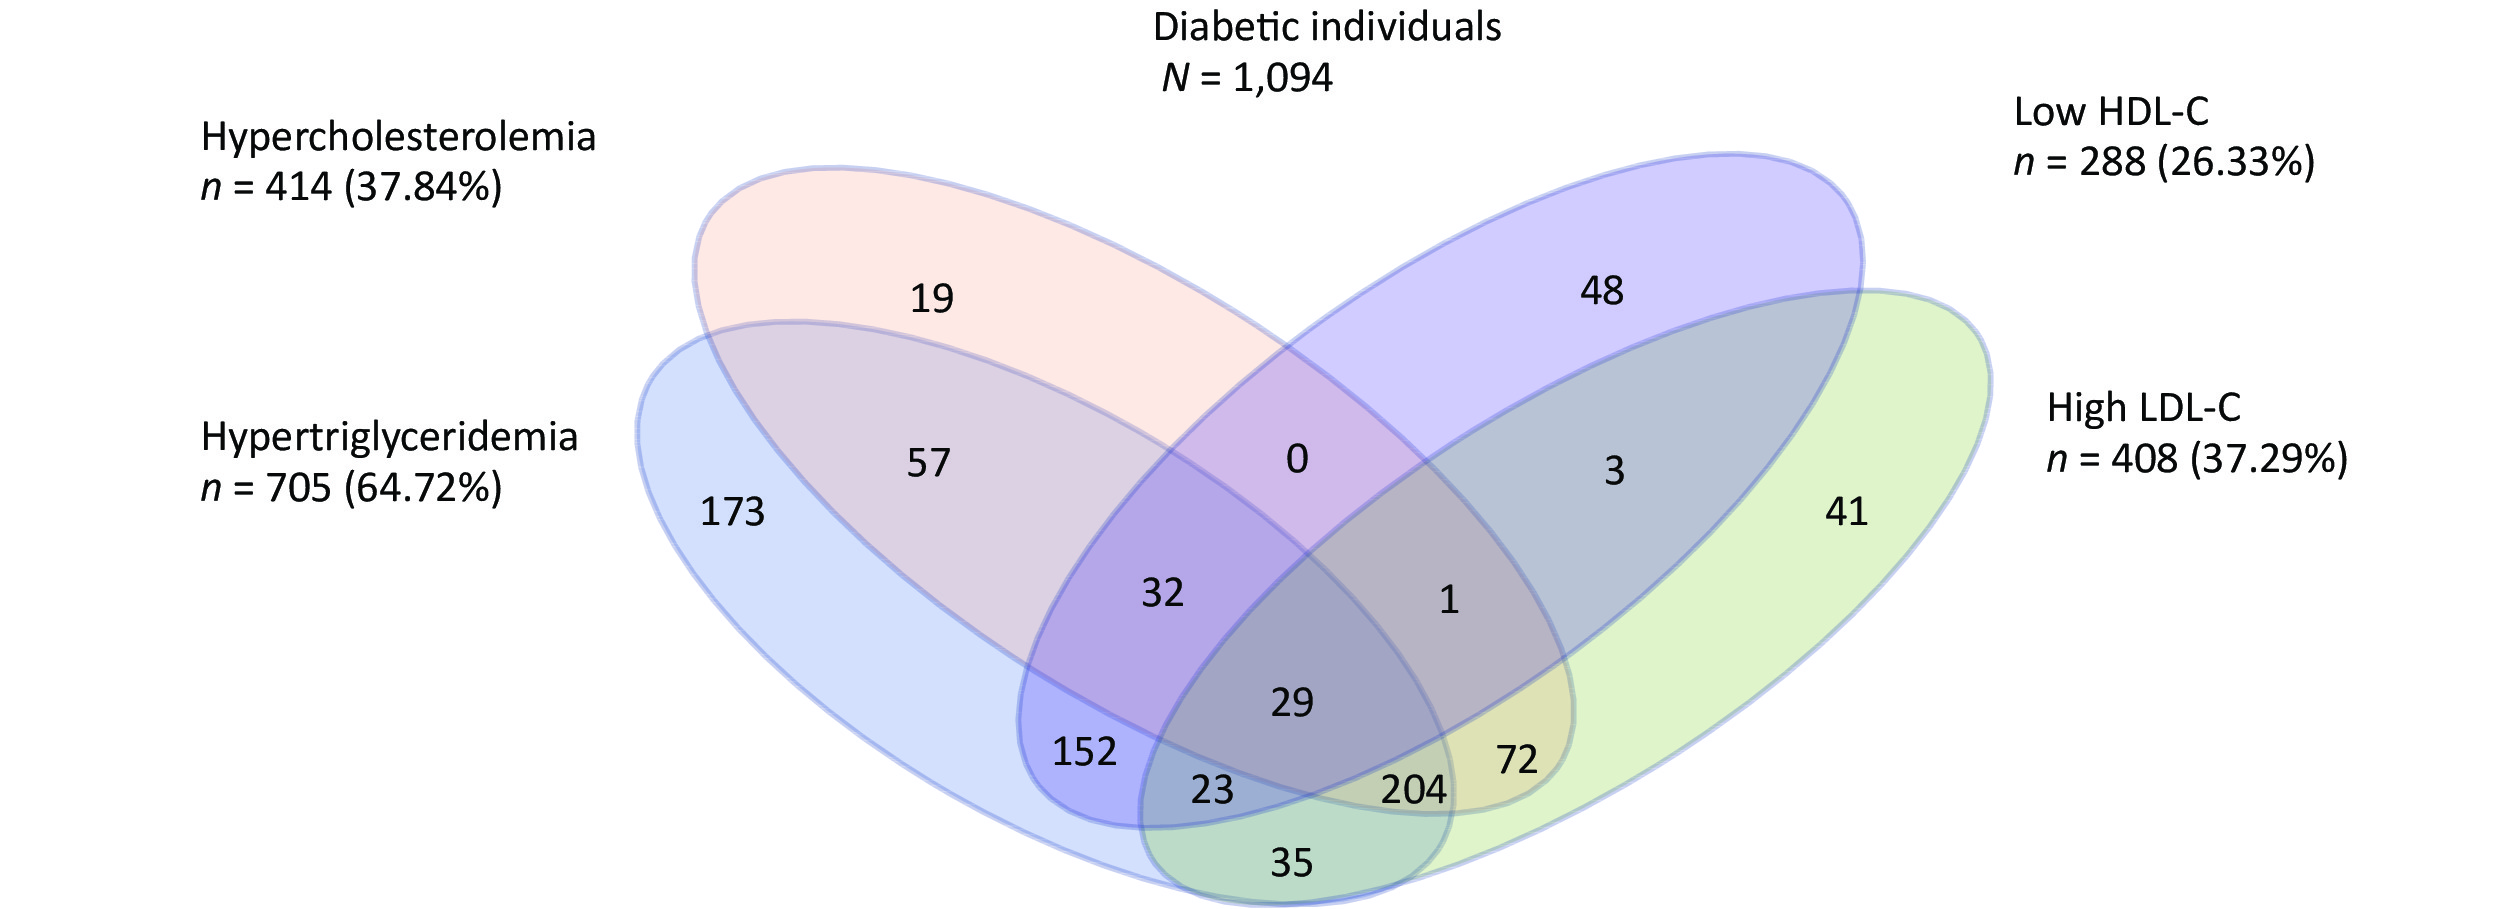
We further analyzed the impact of abnormal accumulation of blood lipids on T2DM. Among 1,094 new-onset T2DM patients, 204 (18.64%) experienced the most common pattern of dyslipidemia combination (hypercholesterolemia, hypertriglyceridemia, and an elevated LDL-C level) (Supplementary Figure S2, available in www.besjournal.com). Compared to people without dyslipidemia, people who displayed these patterns had the highest effect on T2DM incidence, with an HR of 4.169 (95% CI: 2.789–6.230) (Table 1). Therefore, when evaluating the impact of dyslipidemia on the development of diabetes, not only the effect of a single blood lipid index but also the compound effect of multiple abnormal blood lipid indexes should be considered.
Combination patterns N n Inc (%) HR 95% CI Non-dyslipidemia 10,939 205 1.87 1.00 − TG + HDL-C 2,608 152 5.83 1.486 1.176, 1.878 TC + LDL-C 2,353 72 3.06 1.017 0.771, 1.340 TG + TC 1,088 57 5.24 1.802 1.330, 2.441 TG + LDL-C 974 35 3.59 0.987 0.682, 1.429 TG + TC + LDL-C 3,465 204 5.89 1.720 1.404, 2.107 TG + TC + HDL-C 292 32 10.96 4.169 2.789, 6.230 TG + HDL-C + LDL-C 323 23 7.12 1.192 0.758, 1.876 TC + TG + HDL-C + LDL-C 363 29 7.99 1.687 1.114, 2.554 Note. HR, hazard ratio; CI, confidence interval; TG, triglyceride; HDL-C, high-density lipoprotein cholesterol; LDL-C, low-density lipoprotein cholesterol; TC, total cholesterol; Inc, incidence rate. Table 1. Association between dyslipidemia components and the risk of type 2 diabetes mellitus
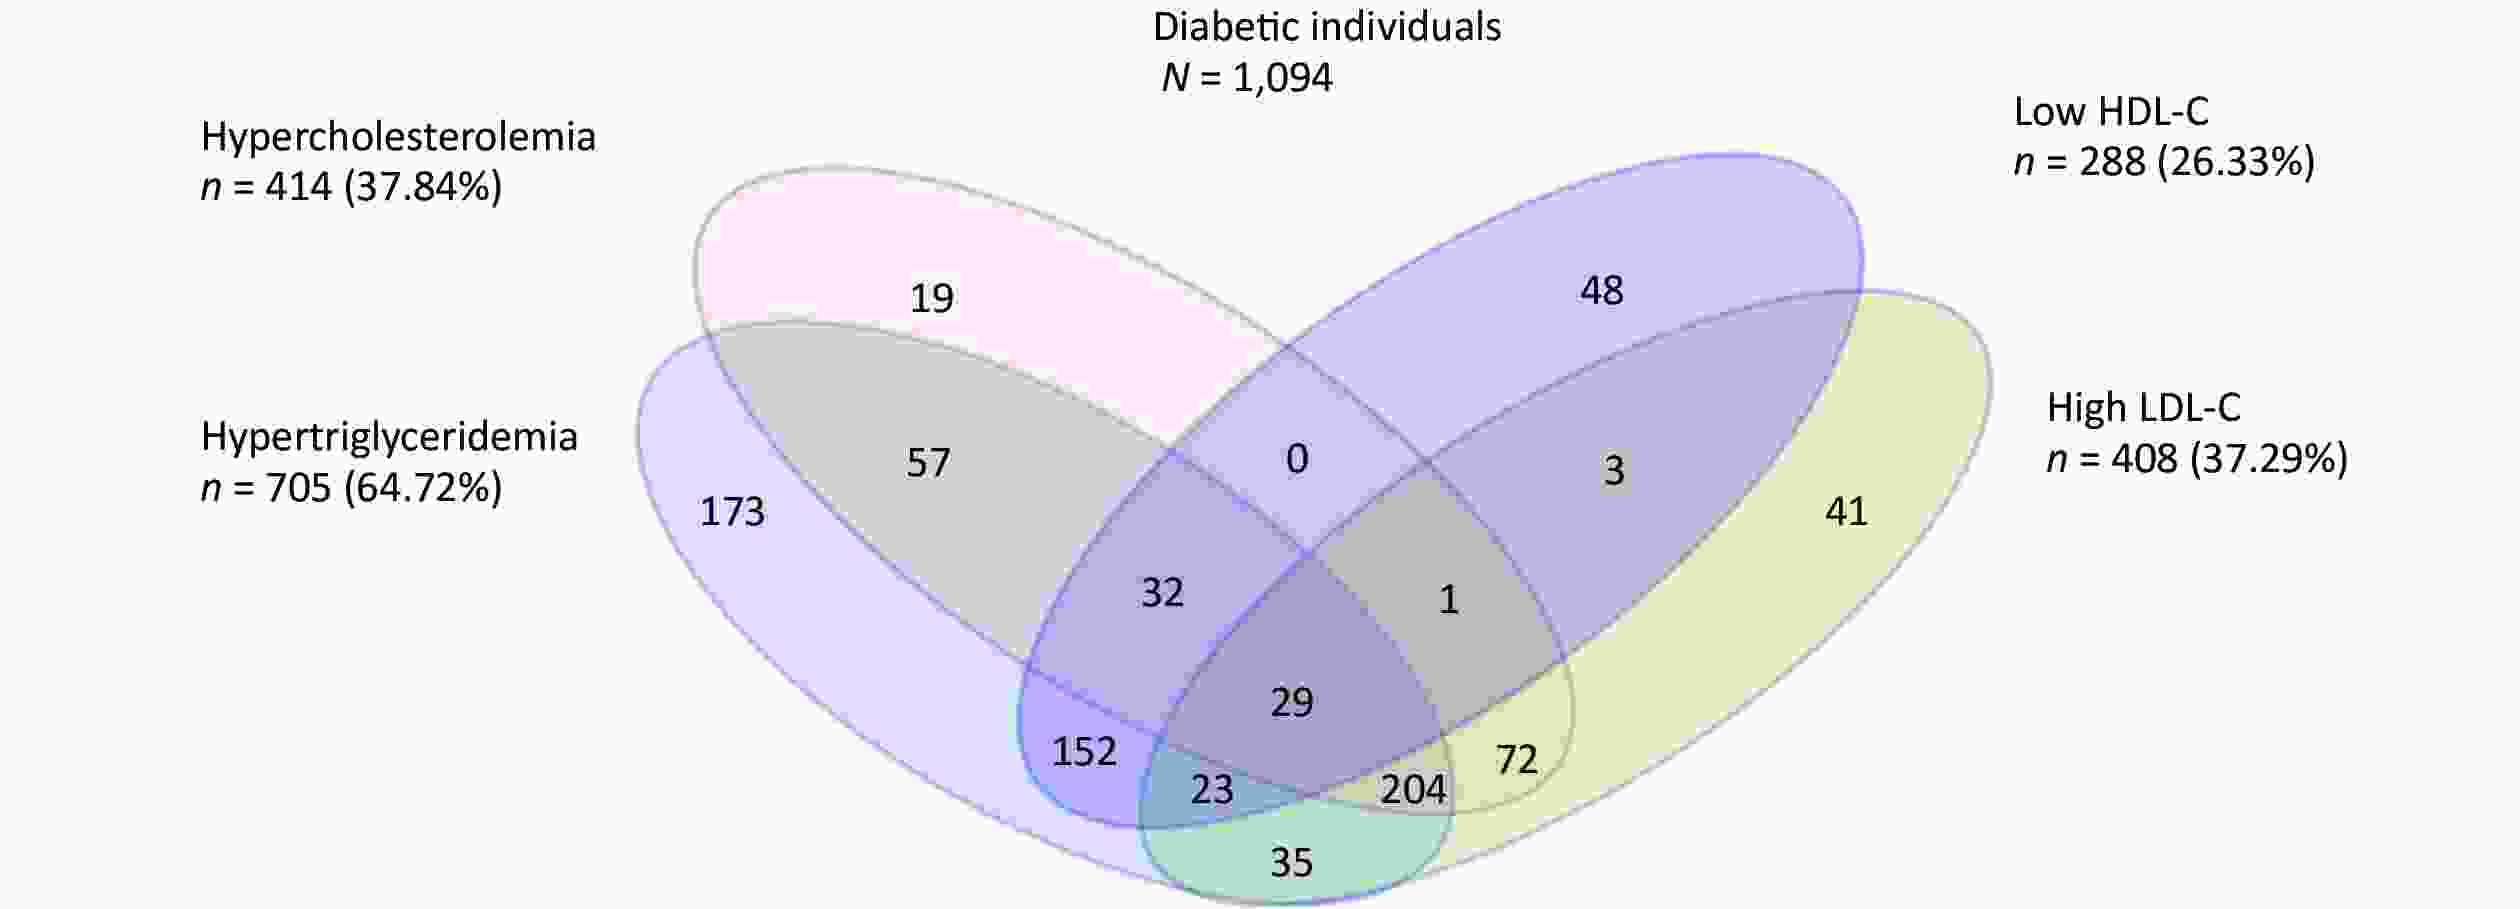
Figure S2. Venn diagram showing the overlapping of the individual components of dyslipidemia at baseline among newly onset T2DM patients.
Several limitations of this study should not be ignored when interpreting these results. First, participants did not undergo an oral glucose tolerance test; the inaccurate recognition of diabetes status may have appeared in some cases due to the identification of newly diagnosed diabetes with a single FPG testing or a self-reported history of diabetes at baseline or follow-up, which may have resulted in a confirmation bias towards new cases of diabetes. Despite this, in order to reduce the diagnosis bias, people who were self-reported diabetes patients were required to provide information about the specific time and the hospital at which they were diagnosed before they were established as new diabetic patients. Second, diabetes is a metabolic disease, and its occurrence is closely associated with factors such as nutrition and dietary habits. This study did not refine and quantify the dietary survey, which may have affected the results. Finally, there was limited follow-up time for this study. The current study participants were followed up for a mean of 2.3 years, which may have led to underestimation of the number of new cases of diabetes. With the continuous progress of cohort follow-up studies, further research is required to ascertain the relationship between dyslipidemia and T2DM.
In summary, abnormal blood lipid metabolism can increase the risk of T2DM, and it increases with the number of dyslipidemia components. The combined effect of different dyslipidemia indices was greater than that of a single dyslipidemia index. When high TG, high TC, and low HDL-C levels were present in a single patient, the incidence risk of diabetes was the highest. Therefore, adequate control of hyperlipidemia should be regarded as an indispensable strategy for preventing diabetes. The study also highlights the need for regular monitoring of lipid profiles and lipid-lowering drugs to ensure healthy lipid levels in the general population.
We thank all study participants and staff of the Worker’s Hospital of the Jinchuan Nonferrous Metals Corporation for their generous work, and the interviewers from the Department of Epidemiology and Health Statistics, School of Public Health, Lanzhou University.
M.W. and T.D. contributed to the study design, critical revision of the paper, statistical analysis, and wrote the manuscript. All authors contributed to the data collection, interpretation of the results and the review and editing of the manuscript. Y.B. was the guarantor of this work and, as such, had full access to all the data in the study and takes responsibility for the integrity of the data and the accuracy of the data analysis.
The authors declare that there is no conflict of interest.
HTML
Reference
 20510Supplementary Materials.pdf
|

|

 Quick Links
 DownLoad: