


-
In recent years, many investigations have indicated that environmental endocrine disruptors (EEDs) may accelerate the development of obesity[1]. One kind of EEDs, di-(2-ethylhexyl) phthalate (DEHP), is ubiquitous in natural environments due to its role in the manufacture and use of plastic products[2]. Recent research has shown that there are many harmful effects from the accumulation of DEHP in the body, especially in adipose tissue due to its lipid solubility. For example, a recently study indicated that DEHP promotes lipid peroxidation in rat liver[3]. So there is concern about its potential hepatotoxic effects. It is also reported to have lipid metabolism-disrupting effects on adult male animals. Therefore, an understanding of the relationship between phthalates and lipid metabolism disorder in men is urgently needed, and will help to elucidate the causes of obesity in men.
Recent studies have been focused on the detrimental effects of phthalates on liver function and hepatic lipid metabolism homeostasis, and have identified some potential mechanisms. However, the specific mechanisms of hepatic lipid metabolism disorders induced by long-term DEHP exposure in humans are not clear. Therefore there is an urgent need to apply a new technology or method to solve this problem. In recent years, environmental metabolomics has been widely used in animal and human studies[4]. However, the metabolic profiles induced by long-term DEHP exposure in male rats’ serum are unknown.
In this study, we aimed to solve the following problems: What is the effect of high-level long-term DEHP exposure on serum metabolomics in adult male rats? Which metabolic pathways are related to the hepatic lipid metabolism mechanisms altered by DEHP exposure? To address these questions, we performed serum metabolomics analyses on 30 male rats in order to identify the meaningful biomarkers induced by long-term DEHP exposure, and further to clarify the cause of hepatic lipid metabolism disorder resulted from DEHP toxicity in the body.
DEHP was purchased from Tokyo Chemical Industry (Tokyo, Japan, 99.9% purity). Primers for UDPGT, D1 and CYP2B1 were purchased from Invitrogen Custom Primers (Shanghai, China). Study subjects included thirty male Wistar rats (SPF grade) aged 21 days and weighing 60−80 g from Vital River Laboratory Animal Technology Co. Ltd (Beijing, China). Prior to treatment, the rats were divided randomly into three groups as follows: control group [C, 0 mg/(kg·day), n = 10], low-dose DEHP group [M, 300 mg/(kg·day), approximately ten times the “No Observed Adverse Effect Level”, NOAEL, n = 10] and high-dose DEHP group [H, 600 mg/(kg·day), approximately twenty times the NOAEL, n = 10]. DEHP was dissolved in corn oil and administered daily by oral gavage for 24 weeks between 08:00 am and 10:00 am. Control animals received corn oil vehicle alone. The NOAEL was obtained from a preliminary experiment in rats[5].
The mental state and activity of rats were recorded every day. Weights were recorded every four weeks during this study. All procedures with experimental animals were conducted in compliance with relevant laws and regulations in China. In addition, the animal study procedures were approved by the Medical Experimental Animal Committee of Harbin Medical University. After 6 months of treatment, blood samples were collected from the abdominal aorta of rats under sodium pentobarbital anesthesia. The serum samples were analyzed using an Autolab-PM4000 biochemical analyzer (AMS Co., Rome, Italy) to measure the levels of total cholesterol (TC), triglyceride (TG) aspartate aminotransferase (AST), high-density lipoprotein (HDL), and alanine aminotransferase (ALT) (Nanjing Jiancheng Bioengineering Institute, Nanjing, China) in rats’ serum. After the livers were removed, we measured the liver weight to detect any change in the organ/body weight ratio, examined any histopathological changes of the livers via hematoxylin and eosin (HE) staining and light microscopy, and detected the mRNA expression of liver-related genes (UDPGT, D1, and CYP2B1) using Real-Time Quantitative PCR.
For metabolomics analyses, serum samples were centrifuged at 10,000 rpm for 10 min, diluted with distilled water at a ratio of 1:3 (vol/vol) and subjected to UPLC-MS/MS analysis. A Waters BEH-C18 Reversed-phase column (100 mm × 2.1 mm, i.d. = 1.7. A partial least squares discriminant analysis (PLS-DA) with quality control (QC) samples was used to evaluate the repeatability of MS/MS spectra of identified biomarkers. The metabolite identification and metabolic pathway analysis were performed as previously described. All data are presented as mean ± standard deviation (SD). One-way analysis of variance (one-way ANOVA) was used for detecting differences between groups. When statistical differences were revealed, post hoc testing was conducted using LSD or Dunnett T3 methods. A two-tailed value of P < 0.05 was considered significant. All statistical analyses were performed using SPSS version 21.0 (Beijing Stats Data Mining Co. Ltd, Beijing, China).
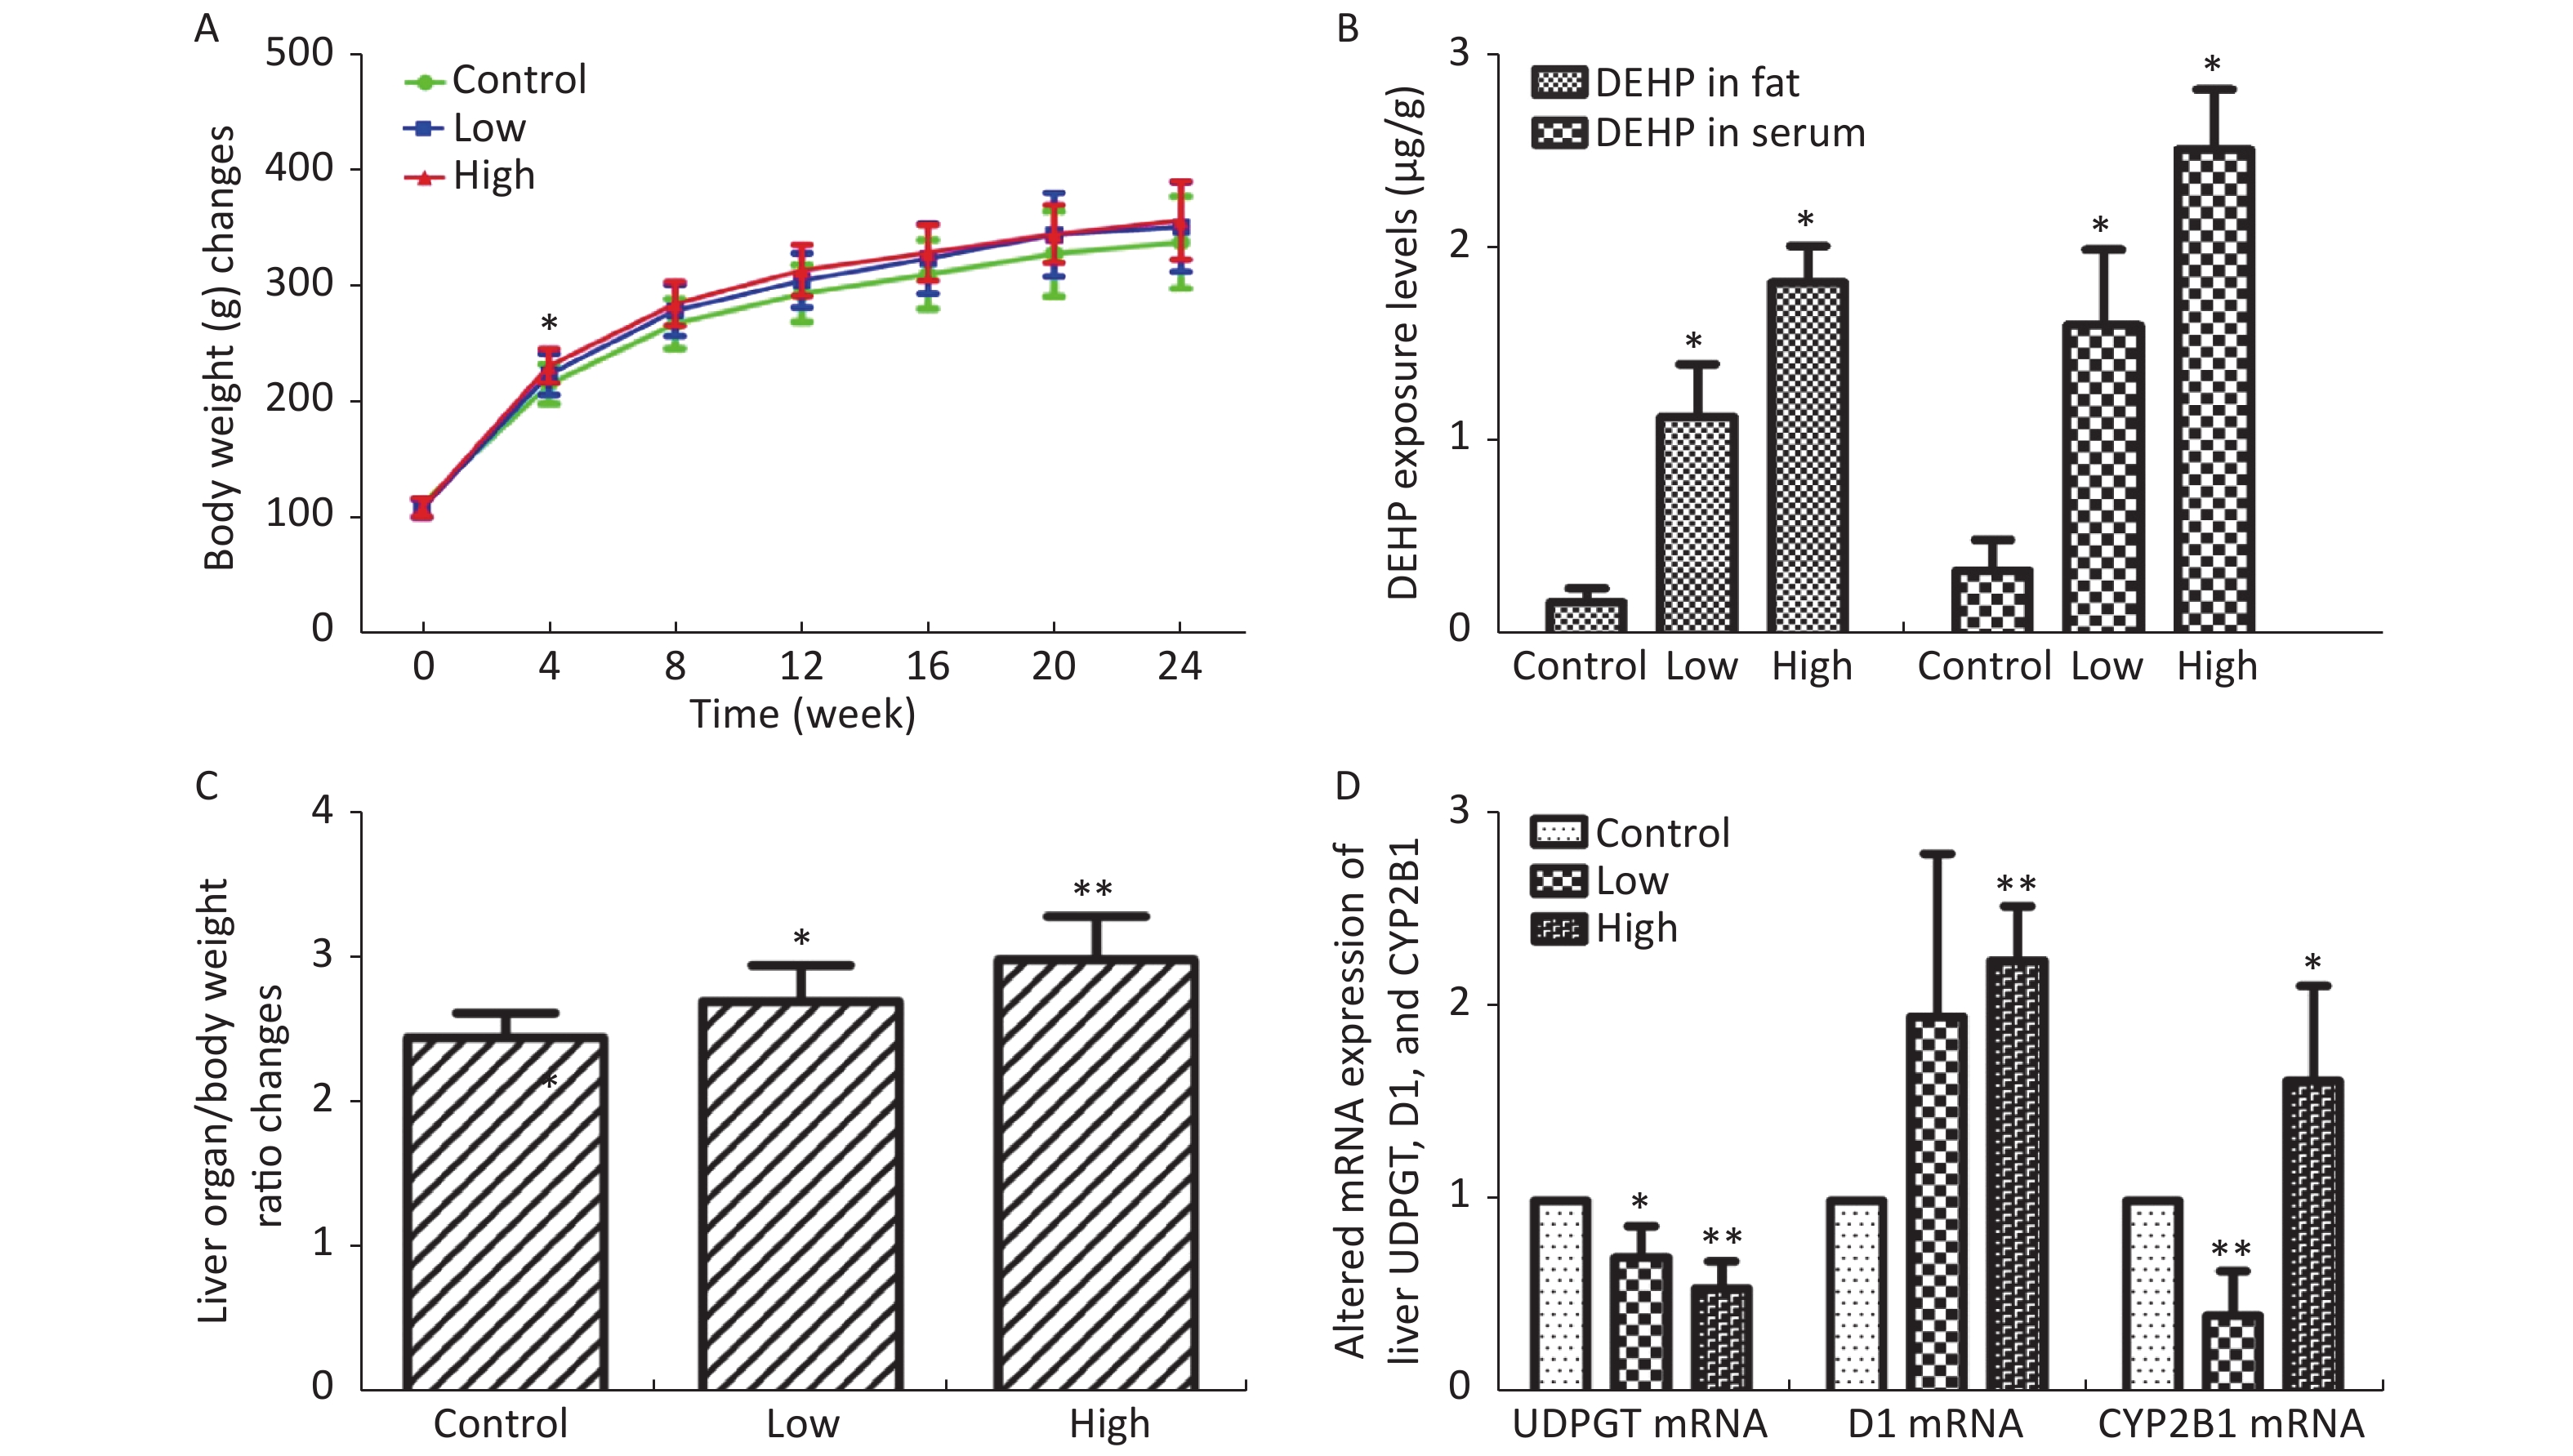
In this study, we established a rat model of disordered lipid metabolism induced by long-term DEHP treatment. Increased levels of DEHP within fat and serum of treated male rats indicated the propensity for accumulation of DEHP and the stability of this model (Supplementary Figure S1B, available in www.besjournal.com). In addition, increased levels of body weight changes in male rats induced by Long-term DEHP exposure further proved the stability of the above model (P < 0.05; Supplementary Figure S1A). In order to detect the liver function and fatty acid metabolism of rats caused by DEHP, we measured clinical parameters according to the kit instructions. We found that levels of TC, TG, ALT, AST and HDL were significantly increased at 6 months, indicating that the inhibition of the hepatic lipid metabolism pathway by DEHP exposure is profound and extensive. We also found that the organ/body weight ratios of livers in groups M were significantly increased (Supplementary Figure S1C), and liver histopathology were appeared. As expected, we observed lipid droplets appearing as subcircular vacuoles of varying sizes from in liver tissues of treated animals at 6 months (Supplementary Figure S2B, available in www.besjournal.com). We also observed the appearance of degenerative and necrotic tubular epithelial cells along with fat vacuoles in liver tissues from group H (Supplementary Figure S2C). These changes suggest impaired liver function induced by DEHP exposure at 6 months.
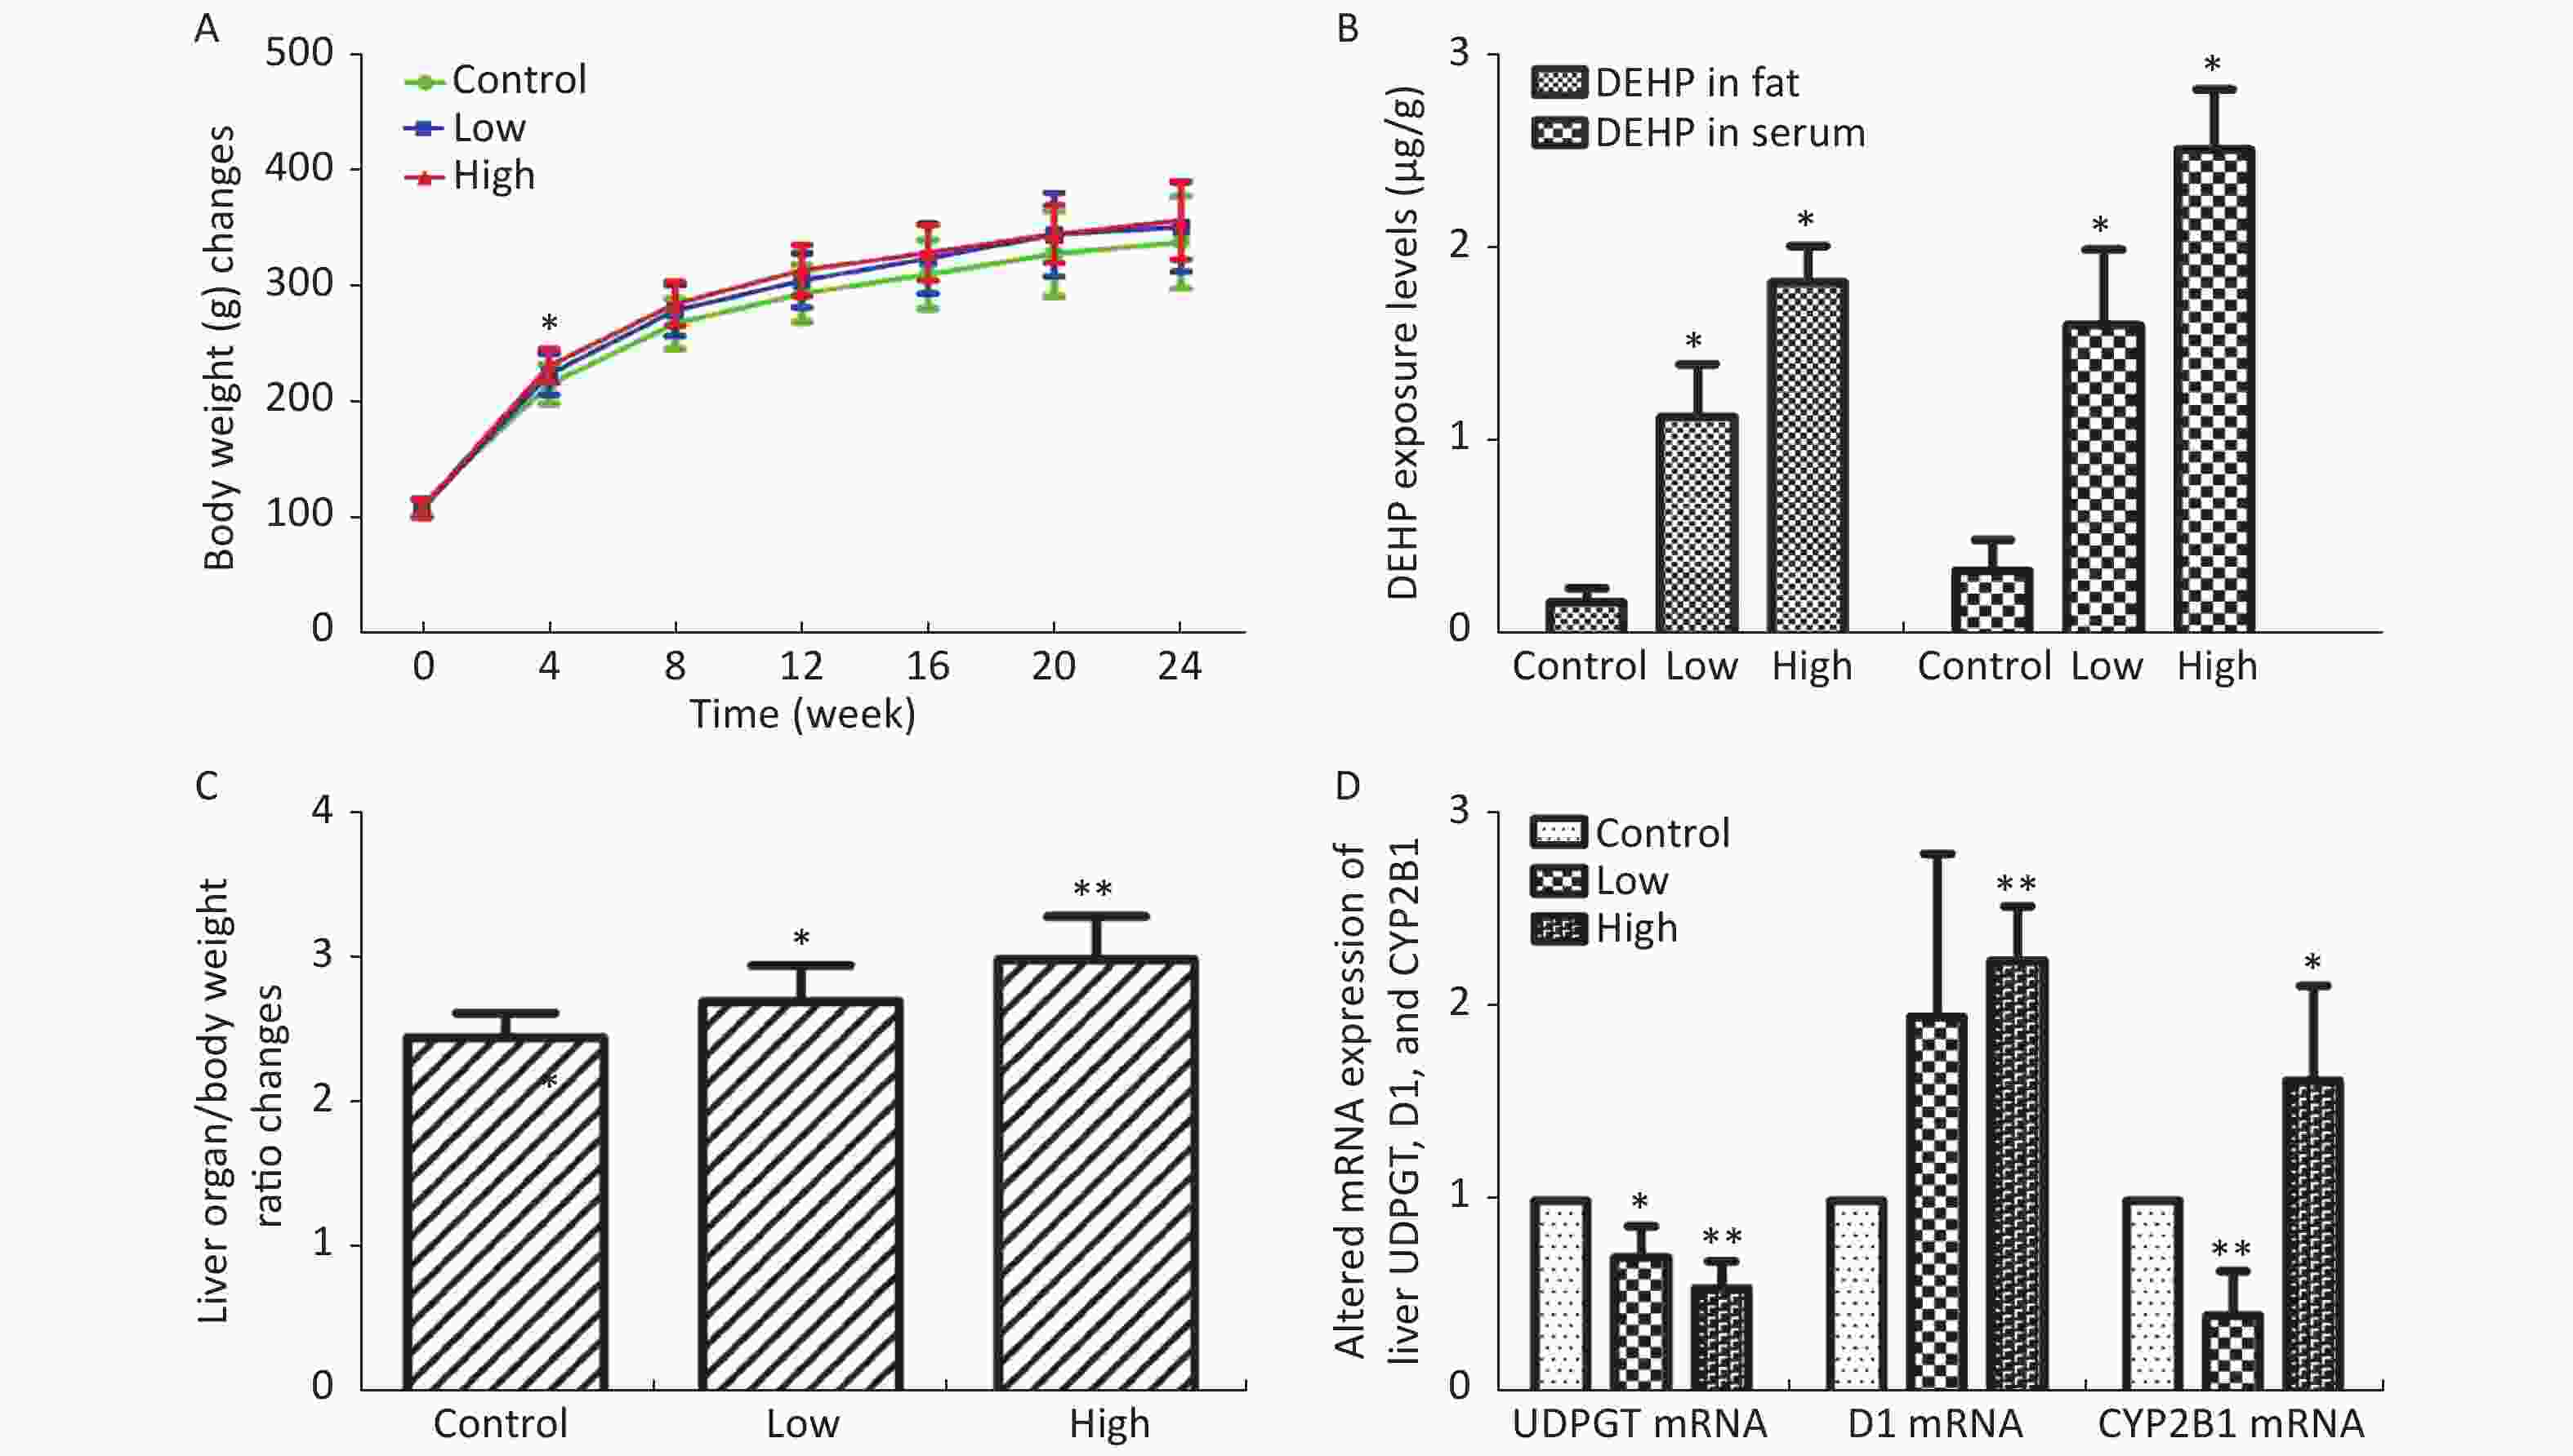
Figure S1. (A) Long-term DEHP exposure induced changes in rats’ body weight (BW) at each time point. (B) The DEHP exposure levels in male rats’ fat and serum at 6 months (means ± SD, μg/g). (C) Long-term DEHP exposure induced alterations of organ/body weight ratio in male rats’ liver at 6 month. (D) Altered mRNA expression of liver UDPGT, D1, and CYP2B1 revealed by real-time quantitative PCR. Control: Control group, 0 mg/(kg·day); Low: Low-dose DEHP group, 300 mg/(kg·day); High: High-dose DEHP group, 600 mg/(kg·day). Each data point represents mean ± standard deviation (SD). *P < 0.05, **P < 0.01 compared to the control group. Abbreviations: DEHP, di-(2-ethylhexyl) phthalate. UDPGT, Uridine diphosphate glucuronic acid transferase; CYP2B1, Cytochrome P450 2B1; D1, Cyclin D1
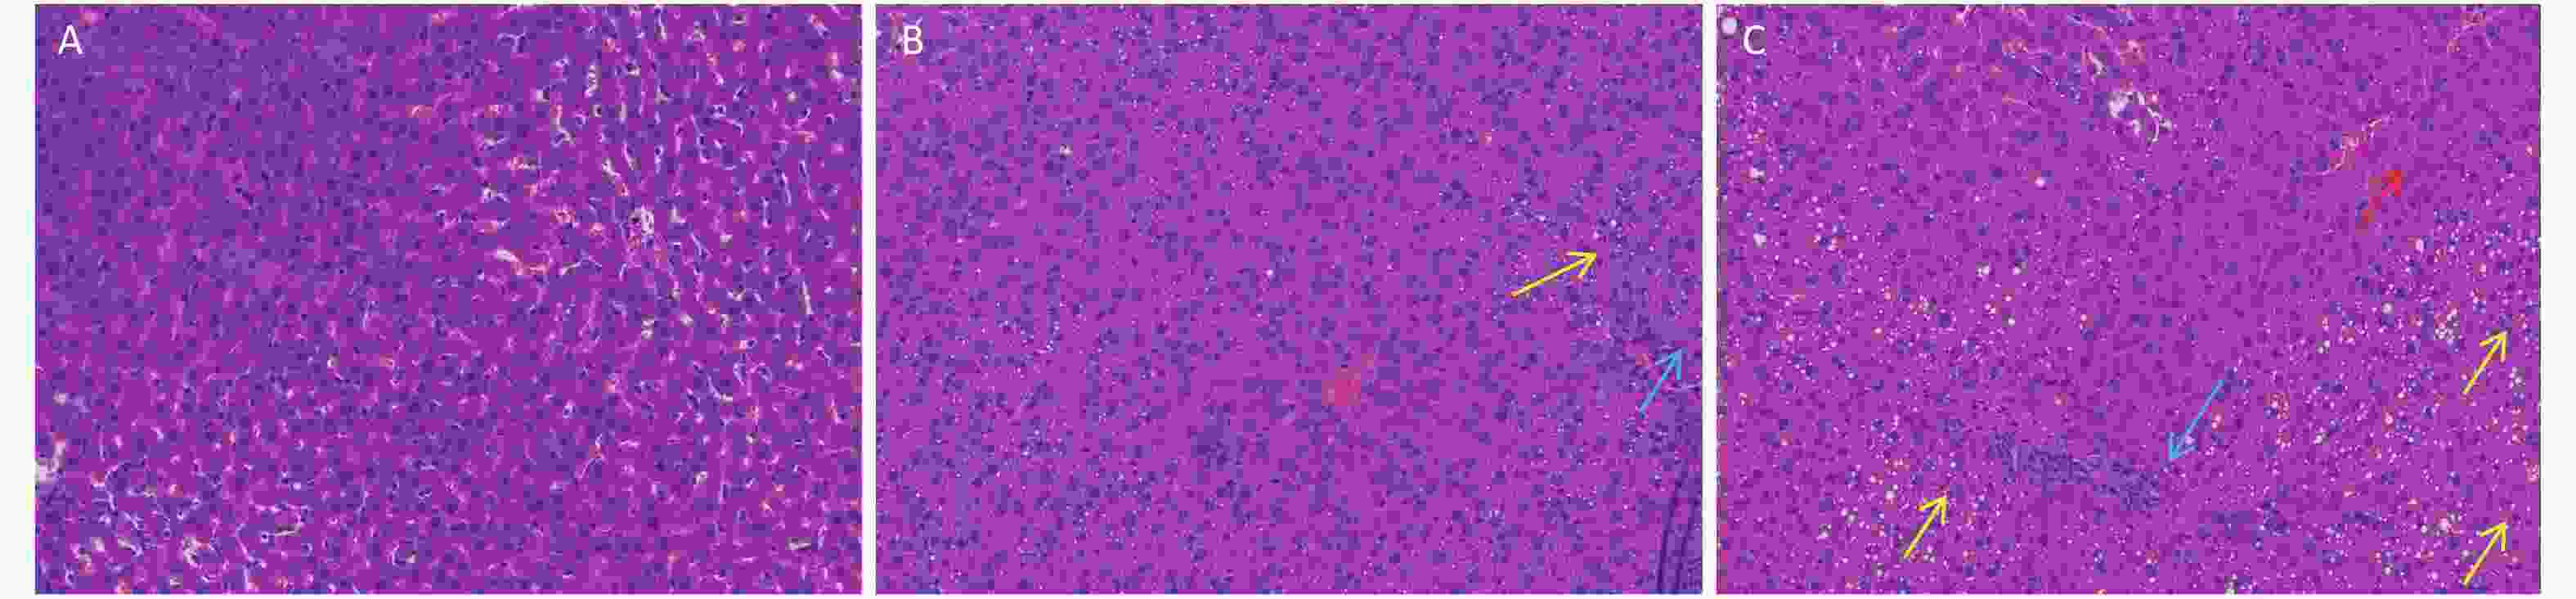
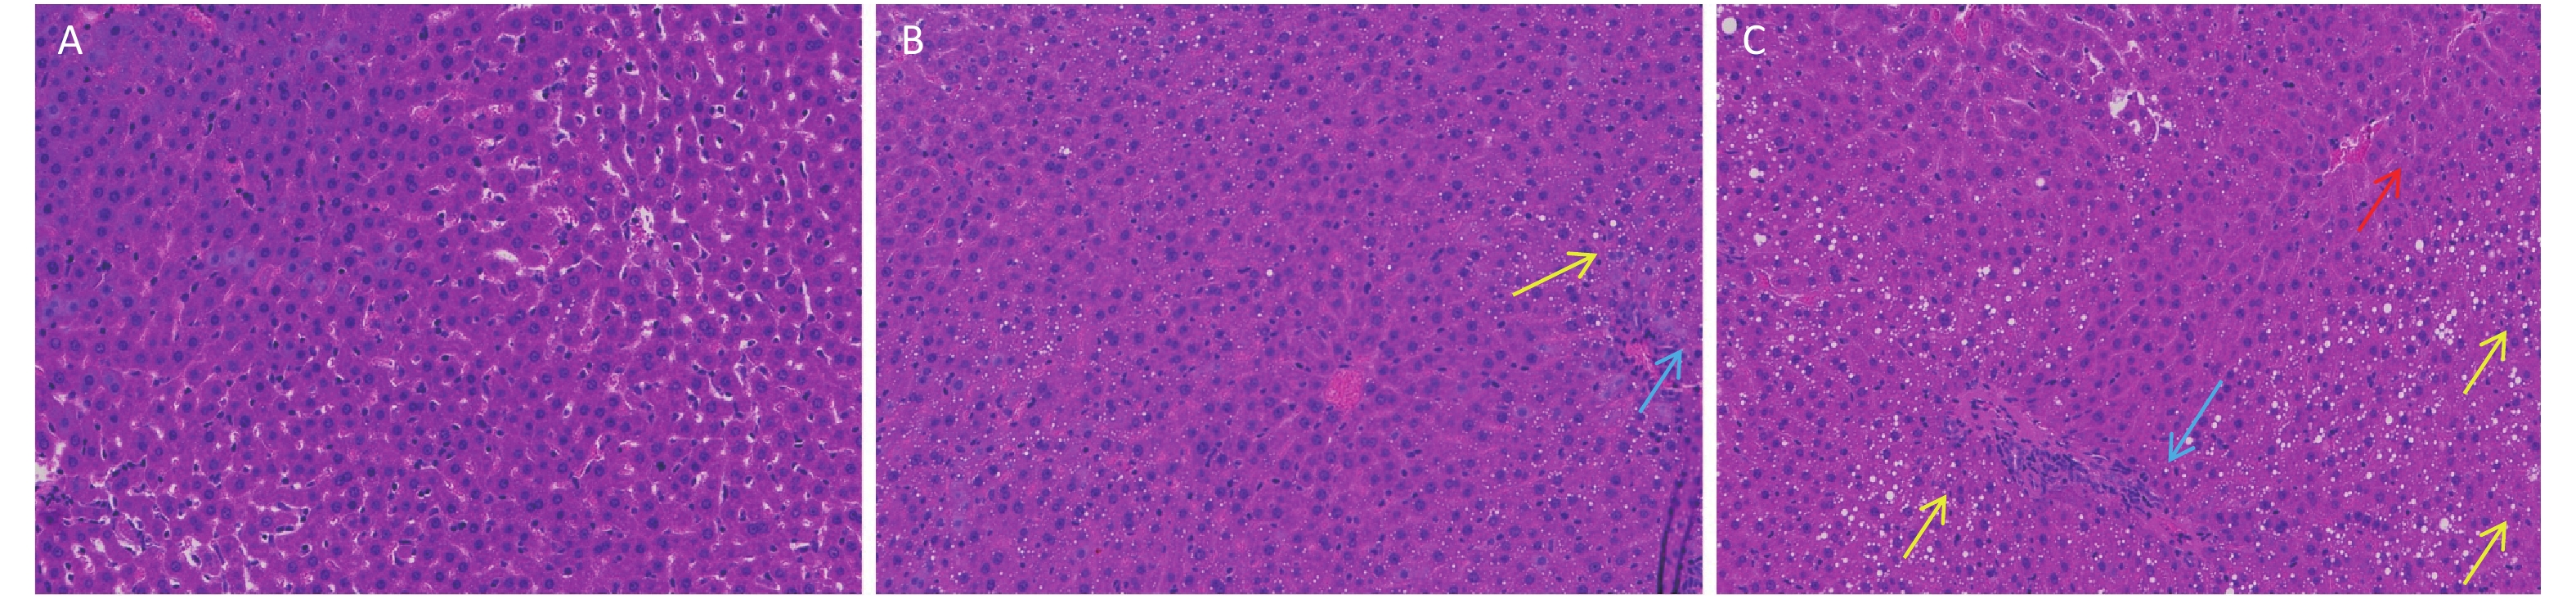
Figure S2. Long-term DEHP exposure altered histopathology in livers of male rats at 6 months. (A) Control group, 0 mg/(kg·day); (B) Low-dose DEHP group, 300 mg/(kg·day); (C) High-dose DEHP group, 600 mg/(kg·day). HE stain magnification, 200×. Yellow arrow: fat vacuoles; Blue arrow: inflammatory cell infiltration; Red arrow: hepatocellular injury. DEHP, di-(2-ethylhexyl) phthalate.
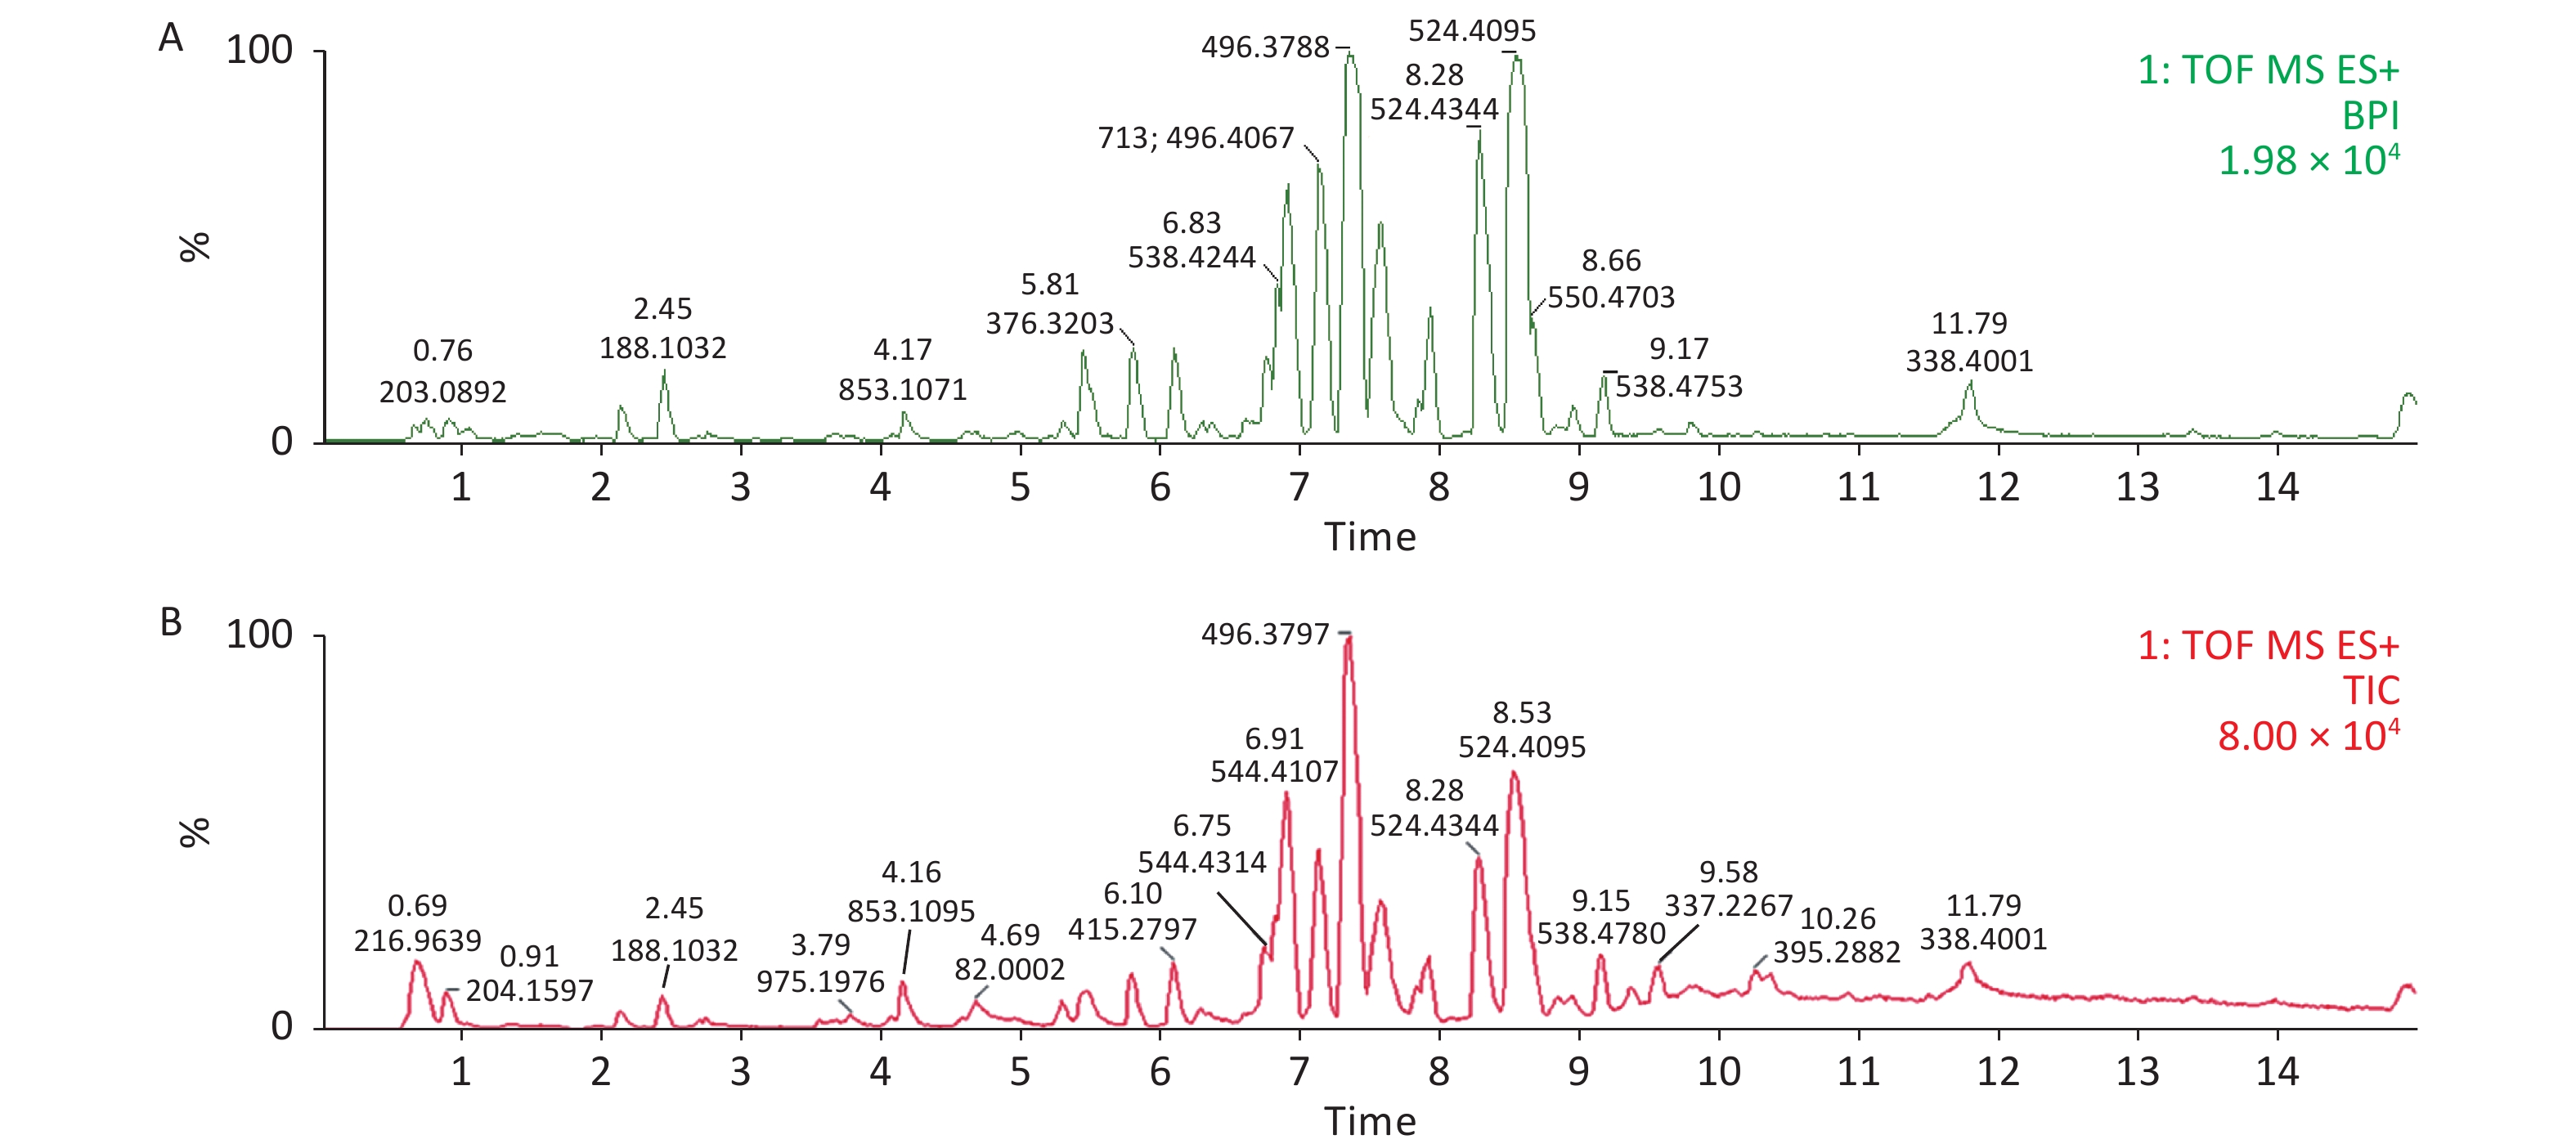
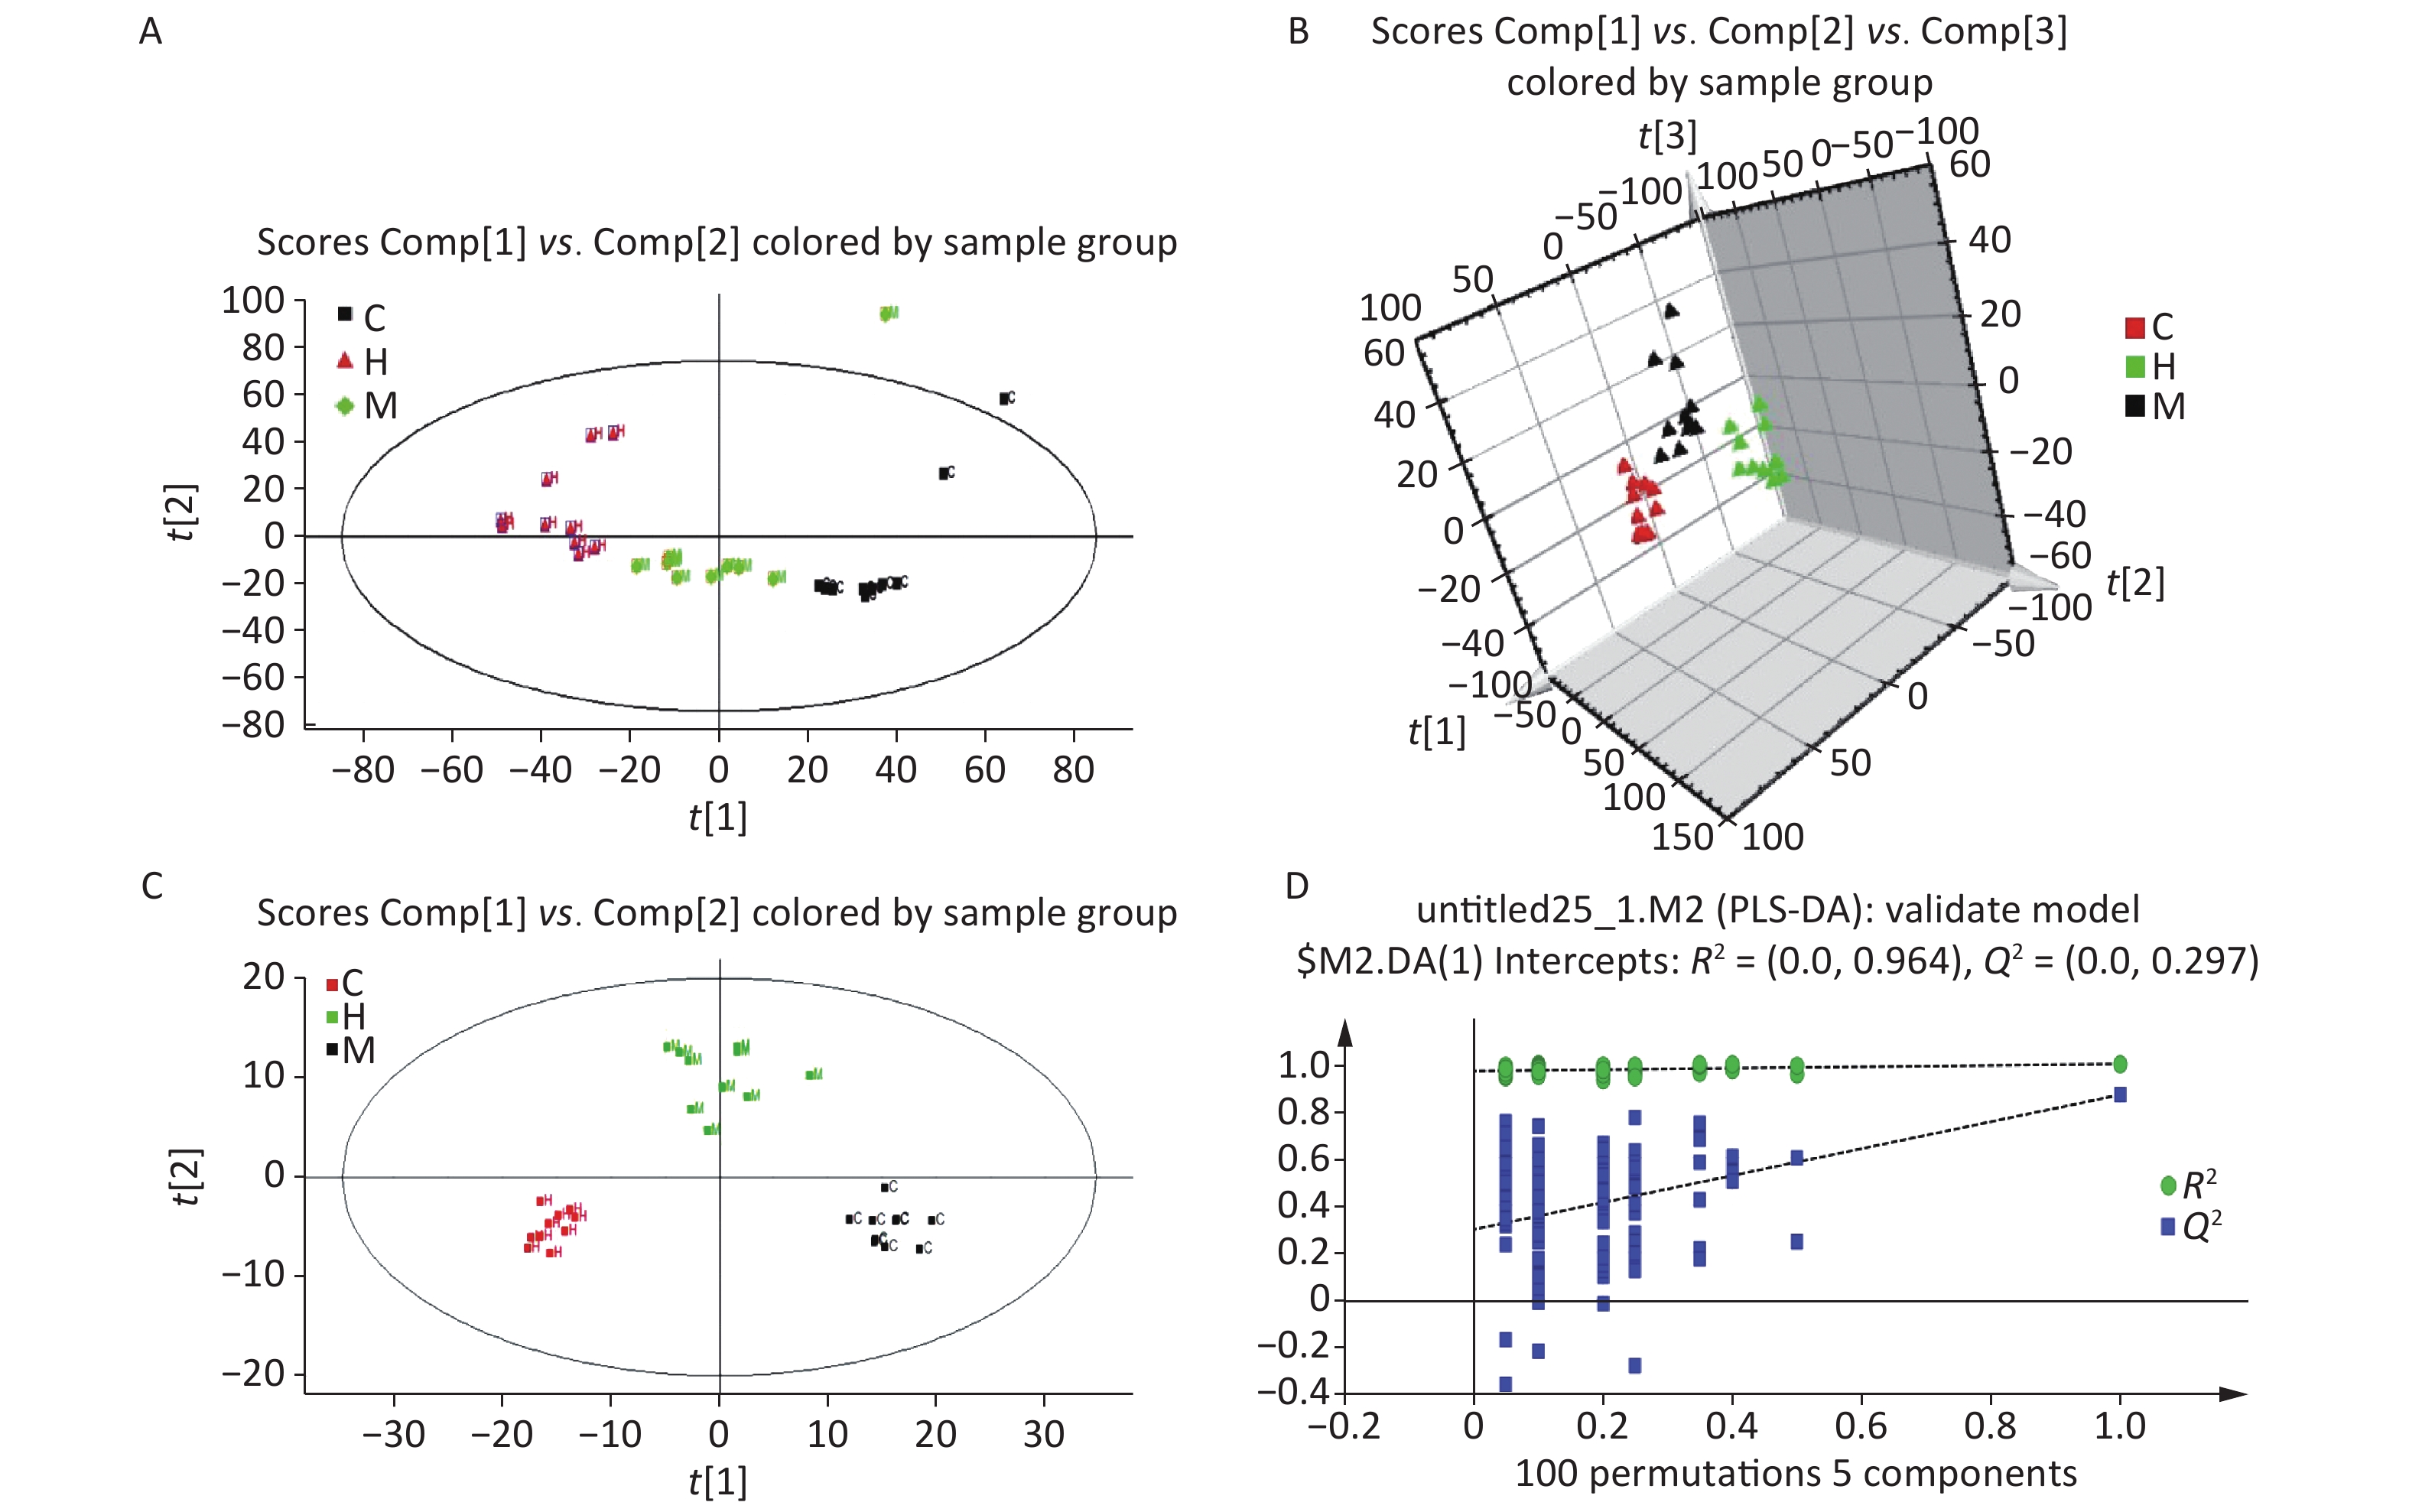
Serum profiles of male rats after long-term exposure to DEHP were generated by UPLC-MS-based metabolomics. Representative positive mode Base peak ion (BPI) and Total ion chromatogram (TIC) chromatograms from serum metabolic profiling of group C and group H are presented to show all the effusive metabolites using UPLC/ESI-Q-TOF/MS in Supplementary Figure S3, available in www.besjournal.com. To further characterize the differences between the control and DEHP-treated groups and examine systemic metabolic changes, we used an unsupervised PCA model from the serum results (Figure 1A, B). After the 24 weeks of treatment, the three groups formed three thoroughly separate clusters, indicating clearly that long-term DEHP treatment interfered with the normal serum metabolic profiles of male rats in the exposed groups. In addition, the LS-MS-based metabolic analysis used to generate a PLS-DA model was validated (for the first five components, R2Y = 0.964 and Q2 = 0.297, Figure 1D), and showed similar detachment between the three treatment groups, indicating systemic changes to male rat serum metabolite profiles after long-term DEHP exposure (Figure 1C). These results further indicate that metabolomics is an effective means for studying the DEHP toxicity.
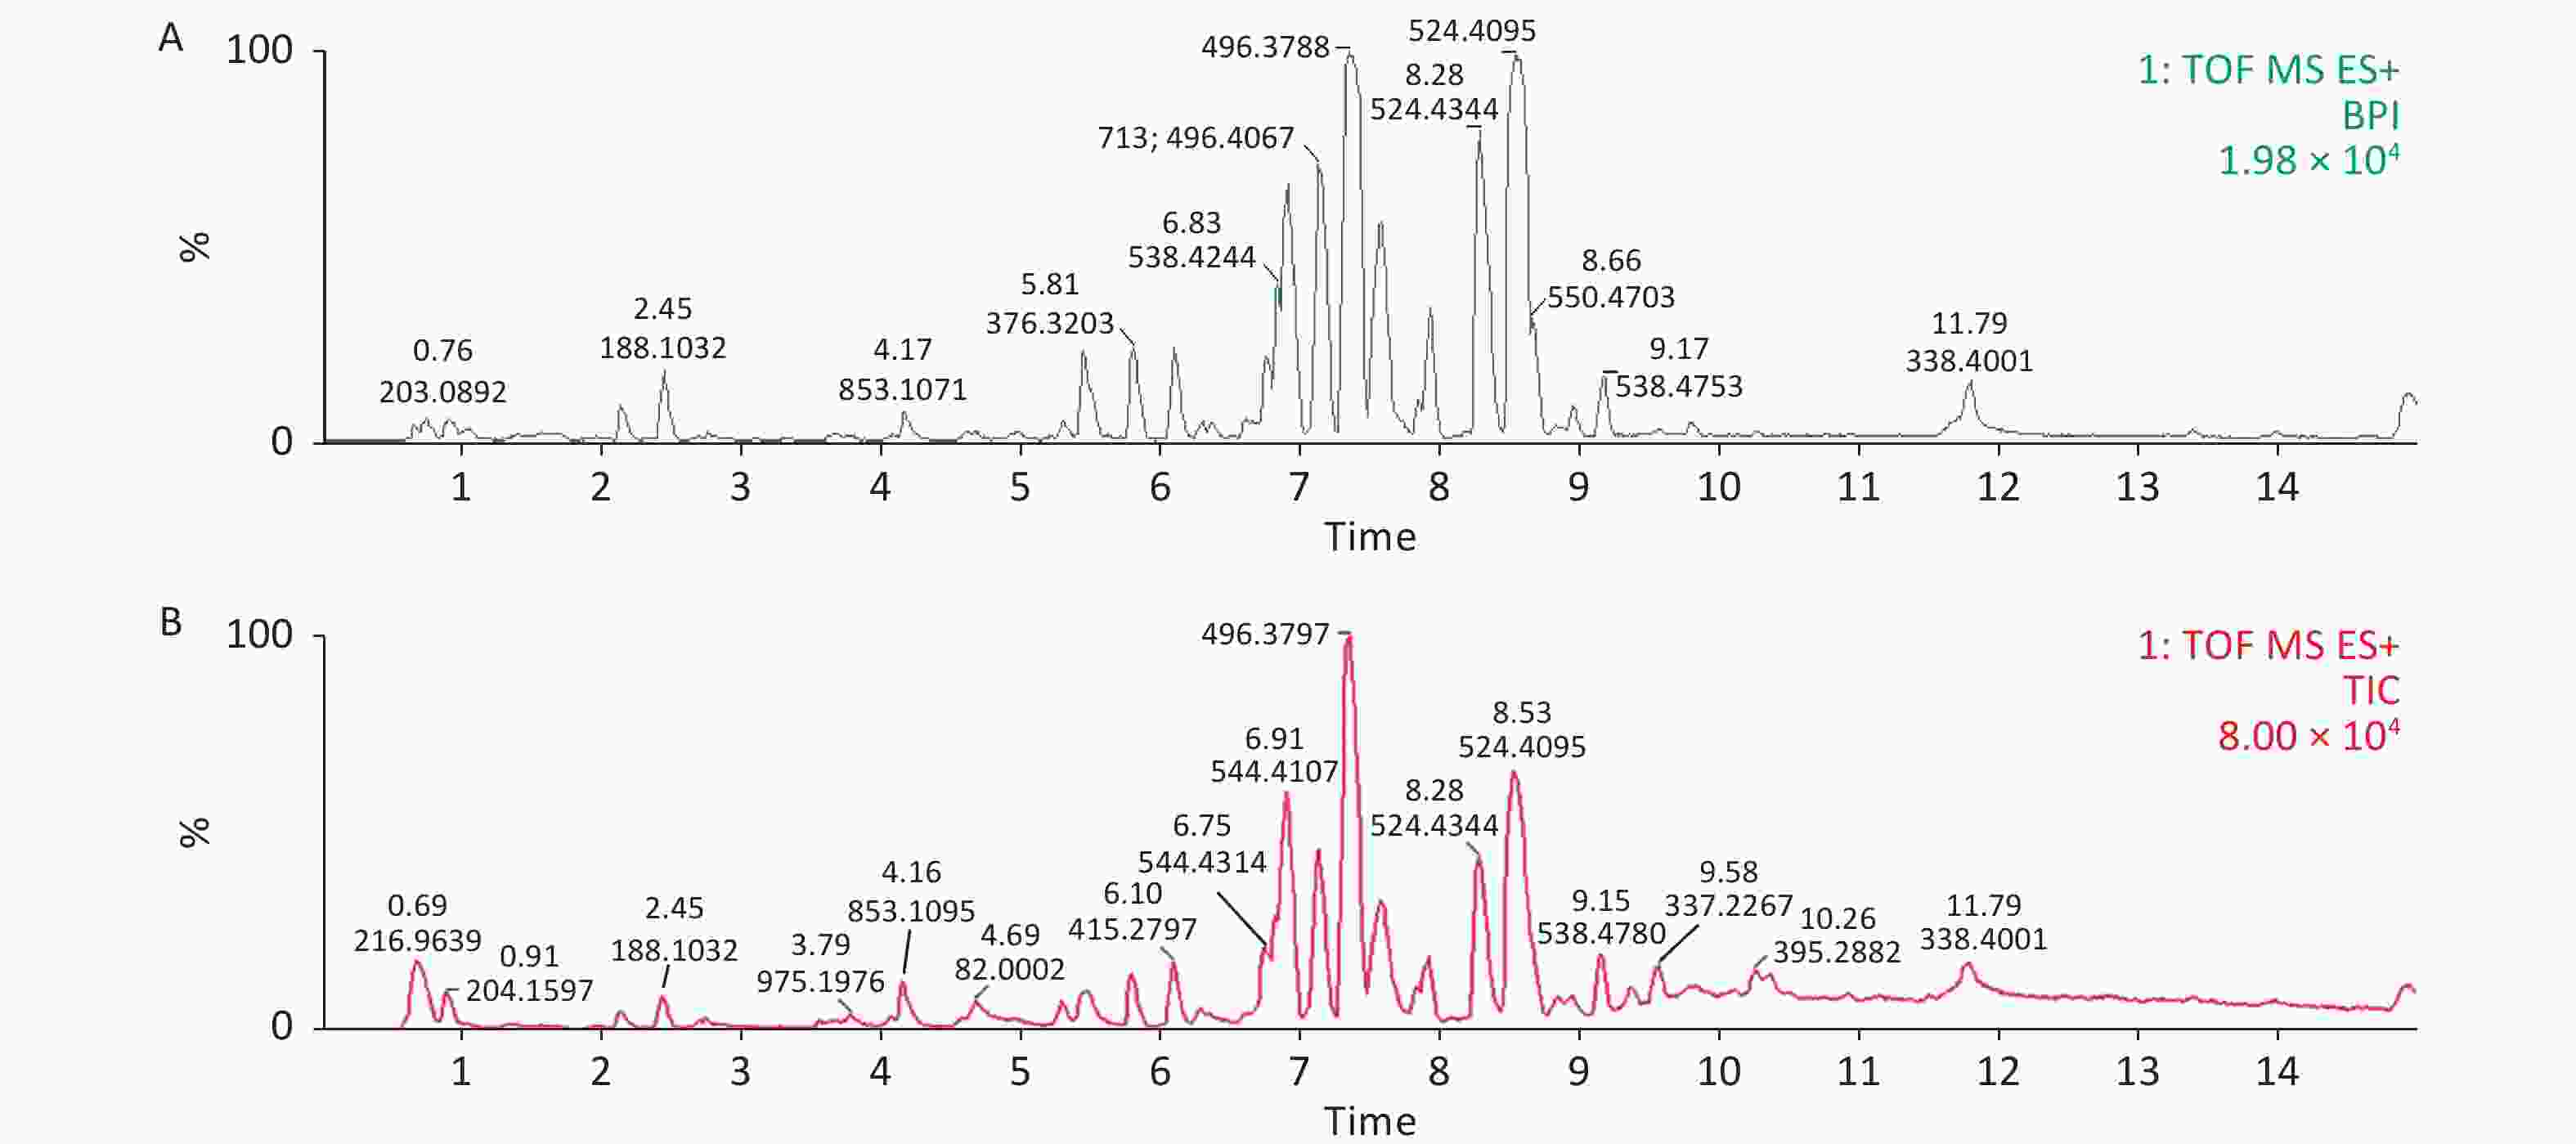
Figure S3. Representative positive mode BPI and TIC chromatograms of serum from the control (A) and high-dose DEHP (B) groups at month 6 using UPLC/ESI-Q-TOF/MS. BPI, base peak intensity; TIC, total ions chromatogram; ES+, positive ion mode. DEHP, di-(2-ethylhexyl) phthalate. Control group, 0 mg/(kg·day); High-dose DEHP group, 600 mg/(kg·day).
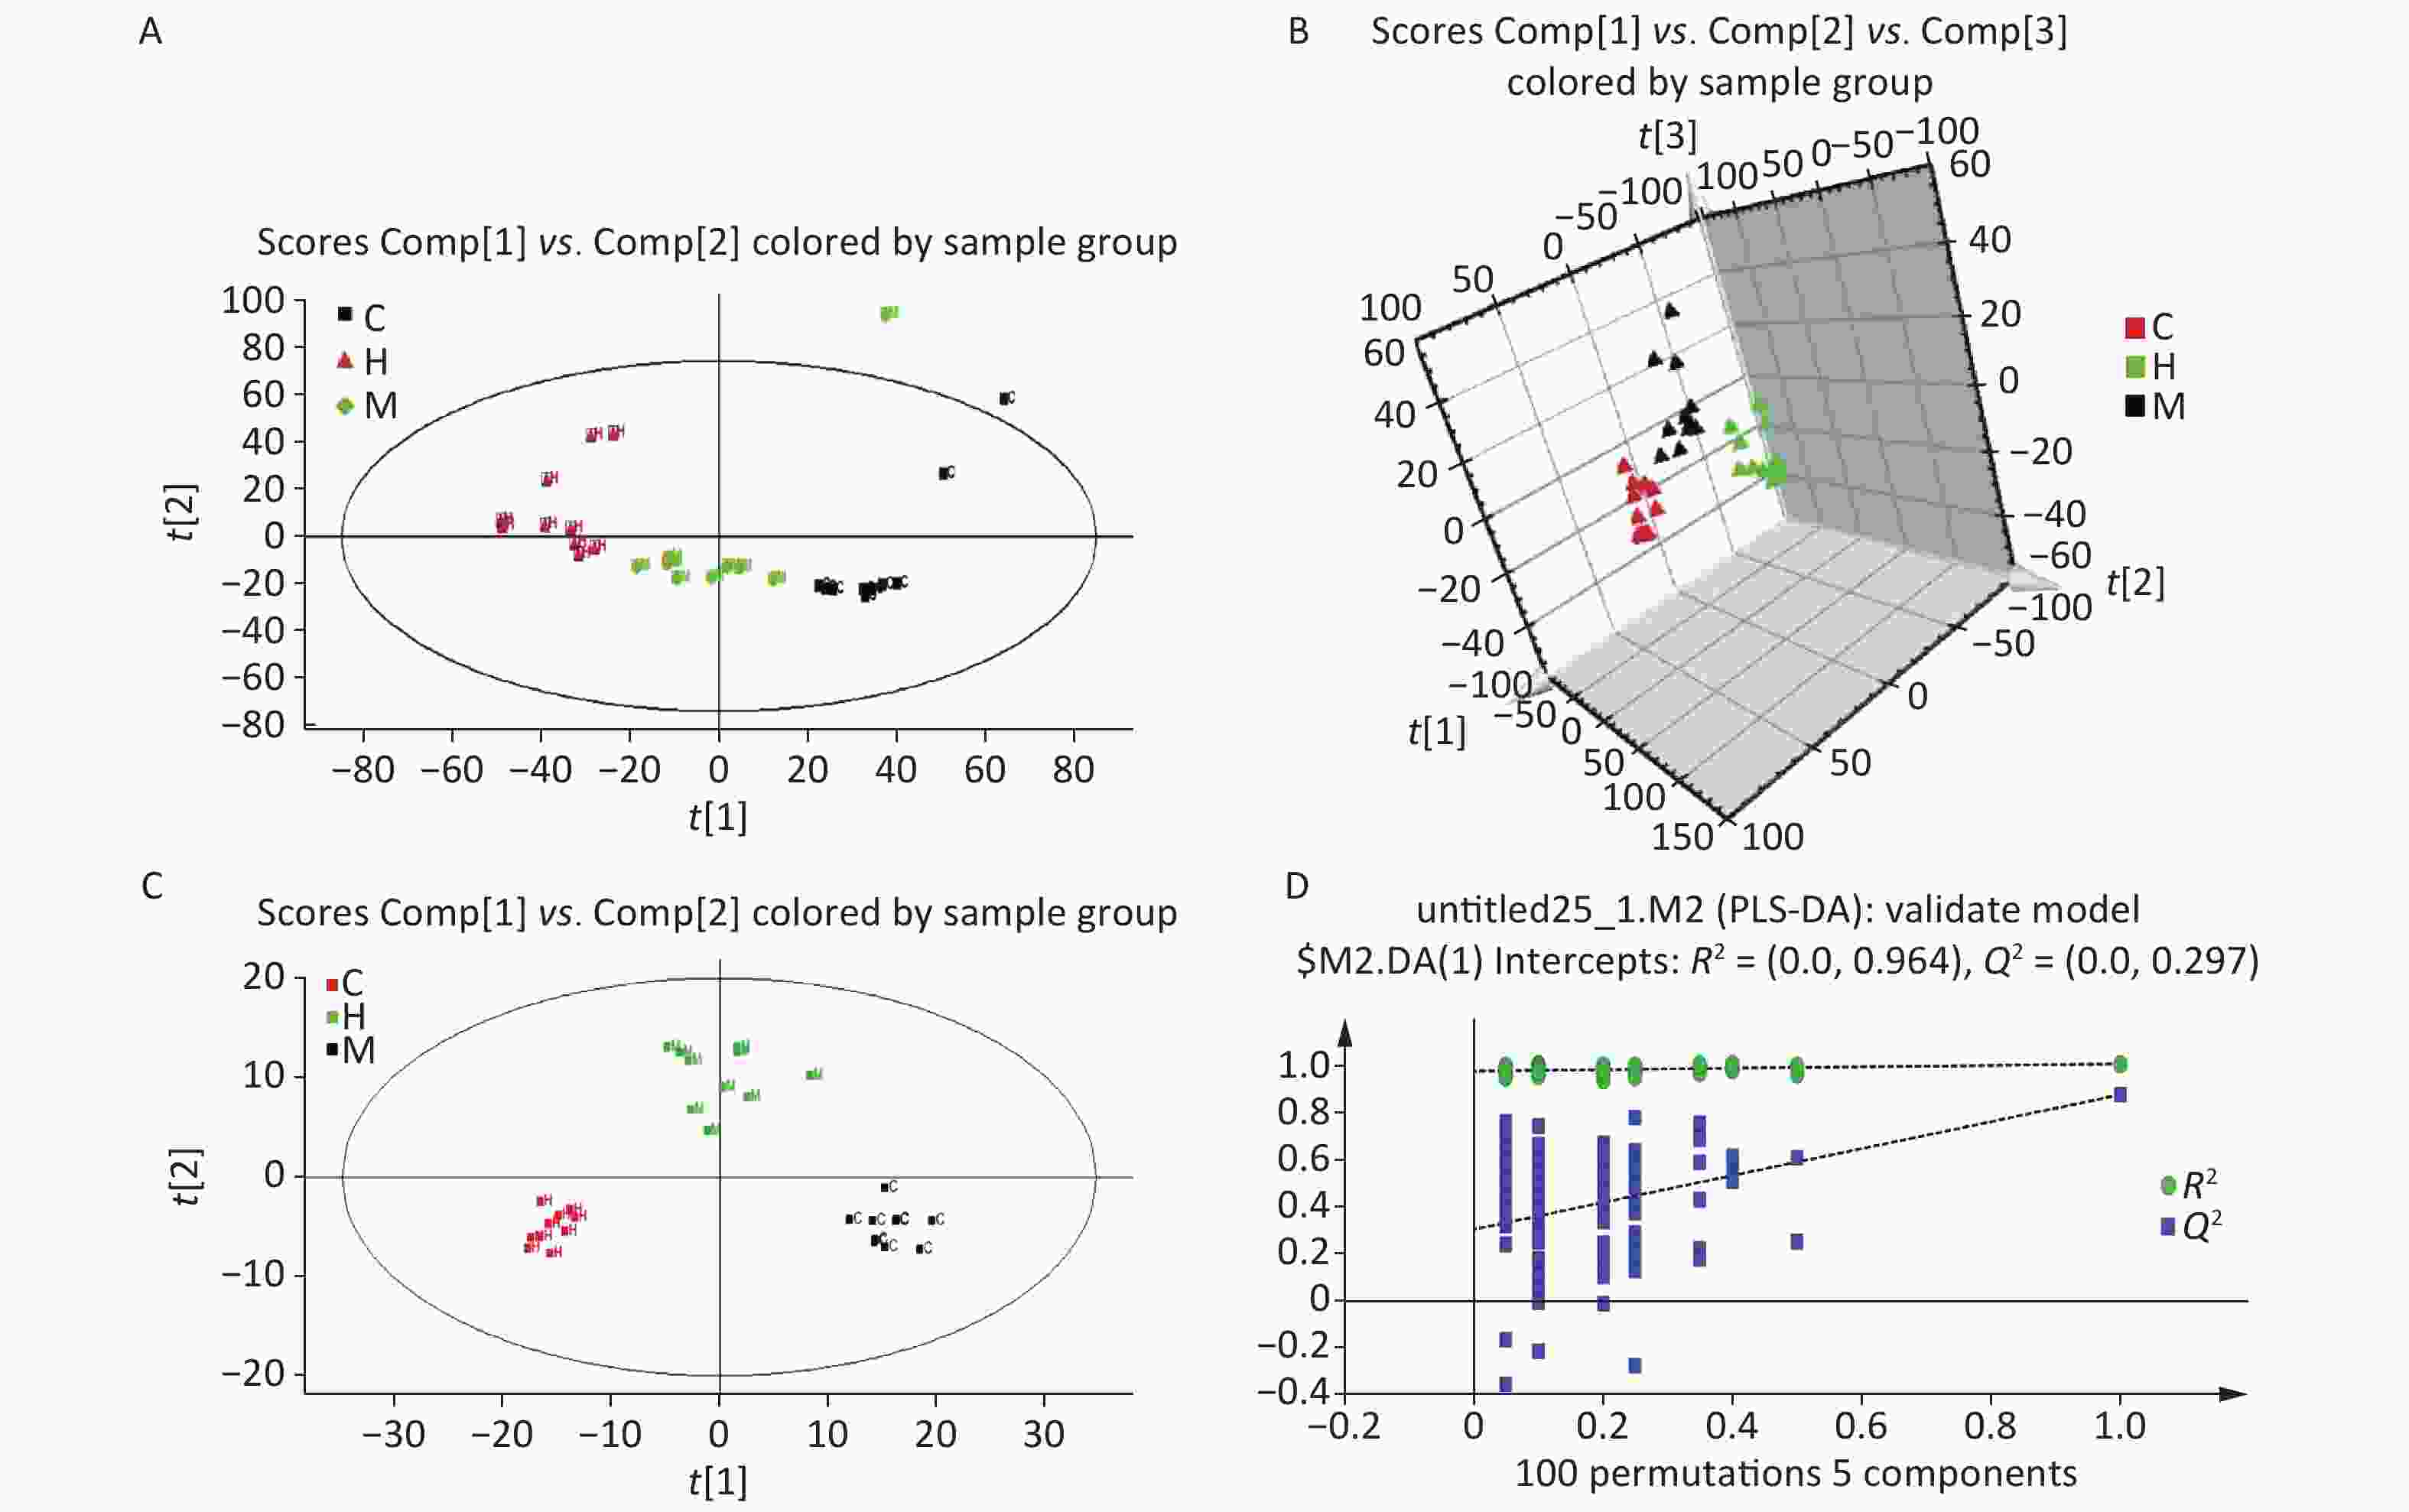
Figure 1. The PCA (A) and PLS-DA 3D score plots (B) from control and treatment groups derived from UPLC/ESI-Q-TOF/MS analysis of serum in positive ESI mode. Permutation test results of the ESI+ PLS-DA model (C) presented along with the model validation (D). R2 (0.0, 0.964), Q2 (0.0, 0.297). Control group, 0 mg/(kg·day); Low-dose DEHP group, 300 mg/(kg·day); High-dose DEHP group, 600 mg/(kg·day). (A) C - Control group, black square; H - High-dose DEHP group, red triangle; M - Low-dose DEHP group, green diamond. (B) C - Control group, red triangle; H - High-dose DEHP group, green triangle; M - Low-dose DEHP group, black triangle. (C) C - Control group, black square; H - High-dose DEHP group, red square; M - Low-dose DEHP group, green square. Abbreviations: ESI, electrospray ionization; ESI+, positive (ES+) ESI mode. PLS-DA, partial least squares-discriminant analysis. MS, mass spectrometry; PCA, principal component analysis; UPLC/ESI-Q-TOF/MS, ultra-performance liquid chromatography coupled with electrospray ionization quadrupole time-of-flight mass spectrometry; PLS-DA, partial least squares-discriminant analysis.
As a major synthetic material for lysophosphatidic acid (LPA), changes in lysophosphatidylcholine (LPC) levels will directly alter LPA content. LPA is often considered a lipid mediator because of its role in the maintenance of lipid homeostasis in living systems. In this study, the identified alterations in LPA levels indicate a decrease in lipid mediators, which will directly affect living systems and normal organ function. Compared to control group, the biomarkers of fatty acid metabolism (TC, TG, and HDL) were all significantly elevated in low- and high-dose DEHP groups at 24 weeks, indicating that DEHP may induce disordered lipid metabolism in male rats (Supplementary Table S1, available in www.besjournal.com).
Groups ALT (U/L) AST (U/L) TC (mmol/L) TG (mmol/L) HDL (mmol/L) C 108.53 ± 7.31 35.89 ± 3.67 4.89 ± 1.46 1.89 ± 0.16 1.45 ± 0.26 M 110.32 ± 15.28b 37.28 ± 8.15b 5.32 ± 2.08 2.52 ± 0.87 1.54 ± 0.68 H 140.32 ± 10.18a 55.79 ± 4.62a 6.89 ± 0.36a 3.24 ± 0.48a 2.51 ± 0.3a Note. aP < 0.05 compared to group C. bP < 0.05 compared to group M. C: Control group, 0 mg/(kg·day); M: Low-dose DEHP group, 300 mg/(kg·day); H: High-dose DEHP group, 600 mg/(kg·day). Abbreviations: DEHP, di (2-ethylhexyl) phthalate; ALT, alanine aminotransferase; AST, aspartic transaminase; TC, Serum total cholesterol; TG, Triglyceride; HDL, High-density lipoprotein. Table S1. Effects of long-term DEHP exposure on male rats’ liver enzyme activities and fatty acid levels (means ± SD, n = 10)
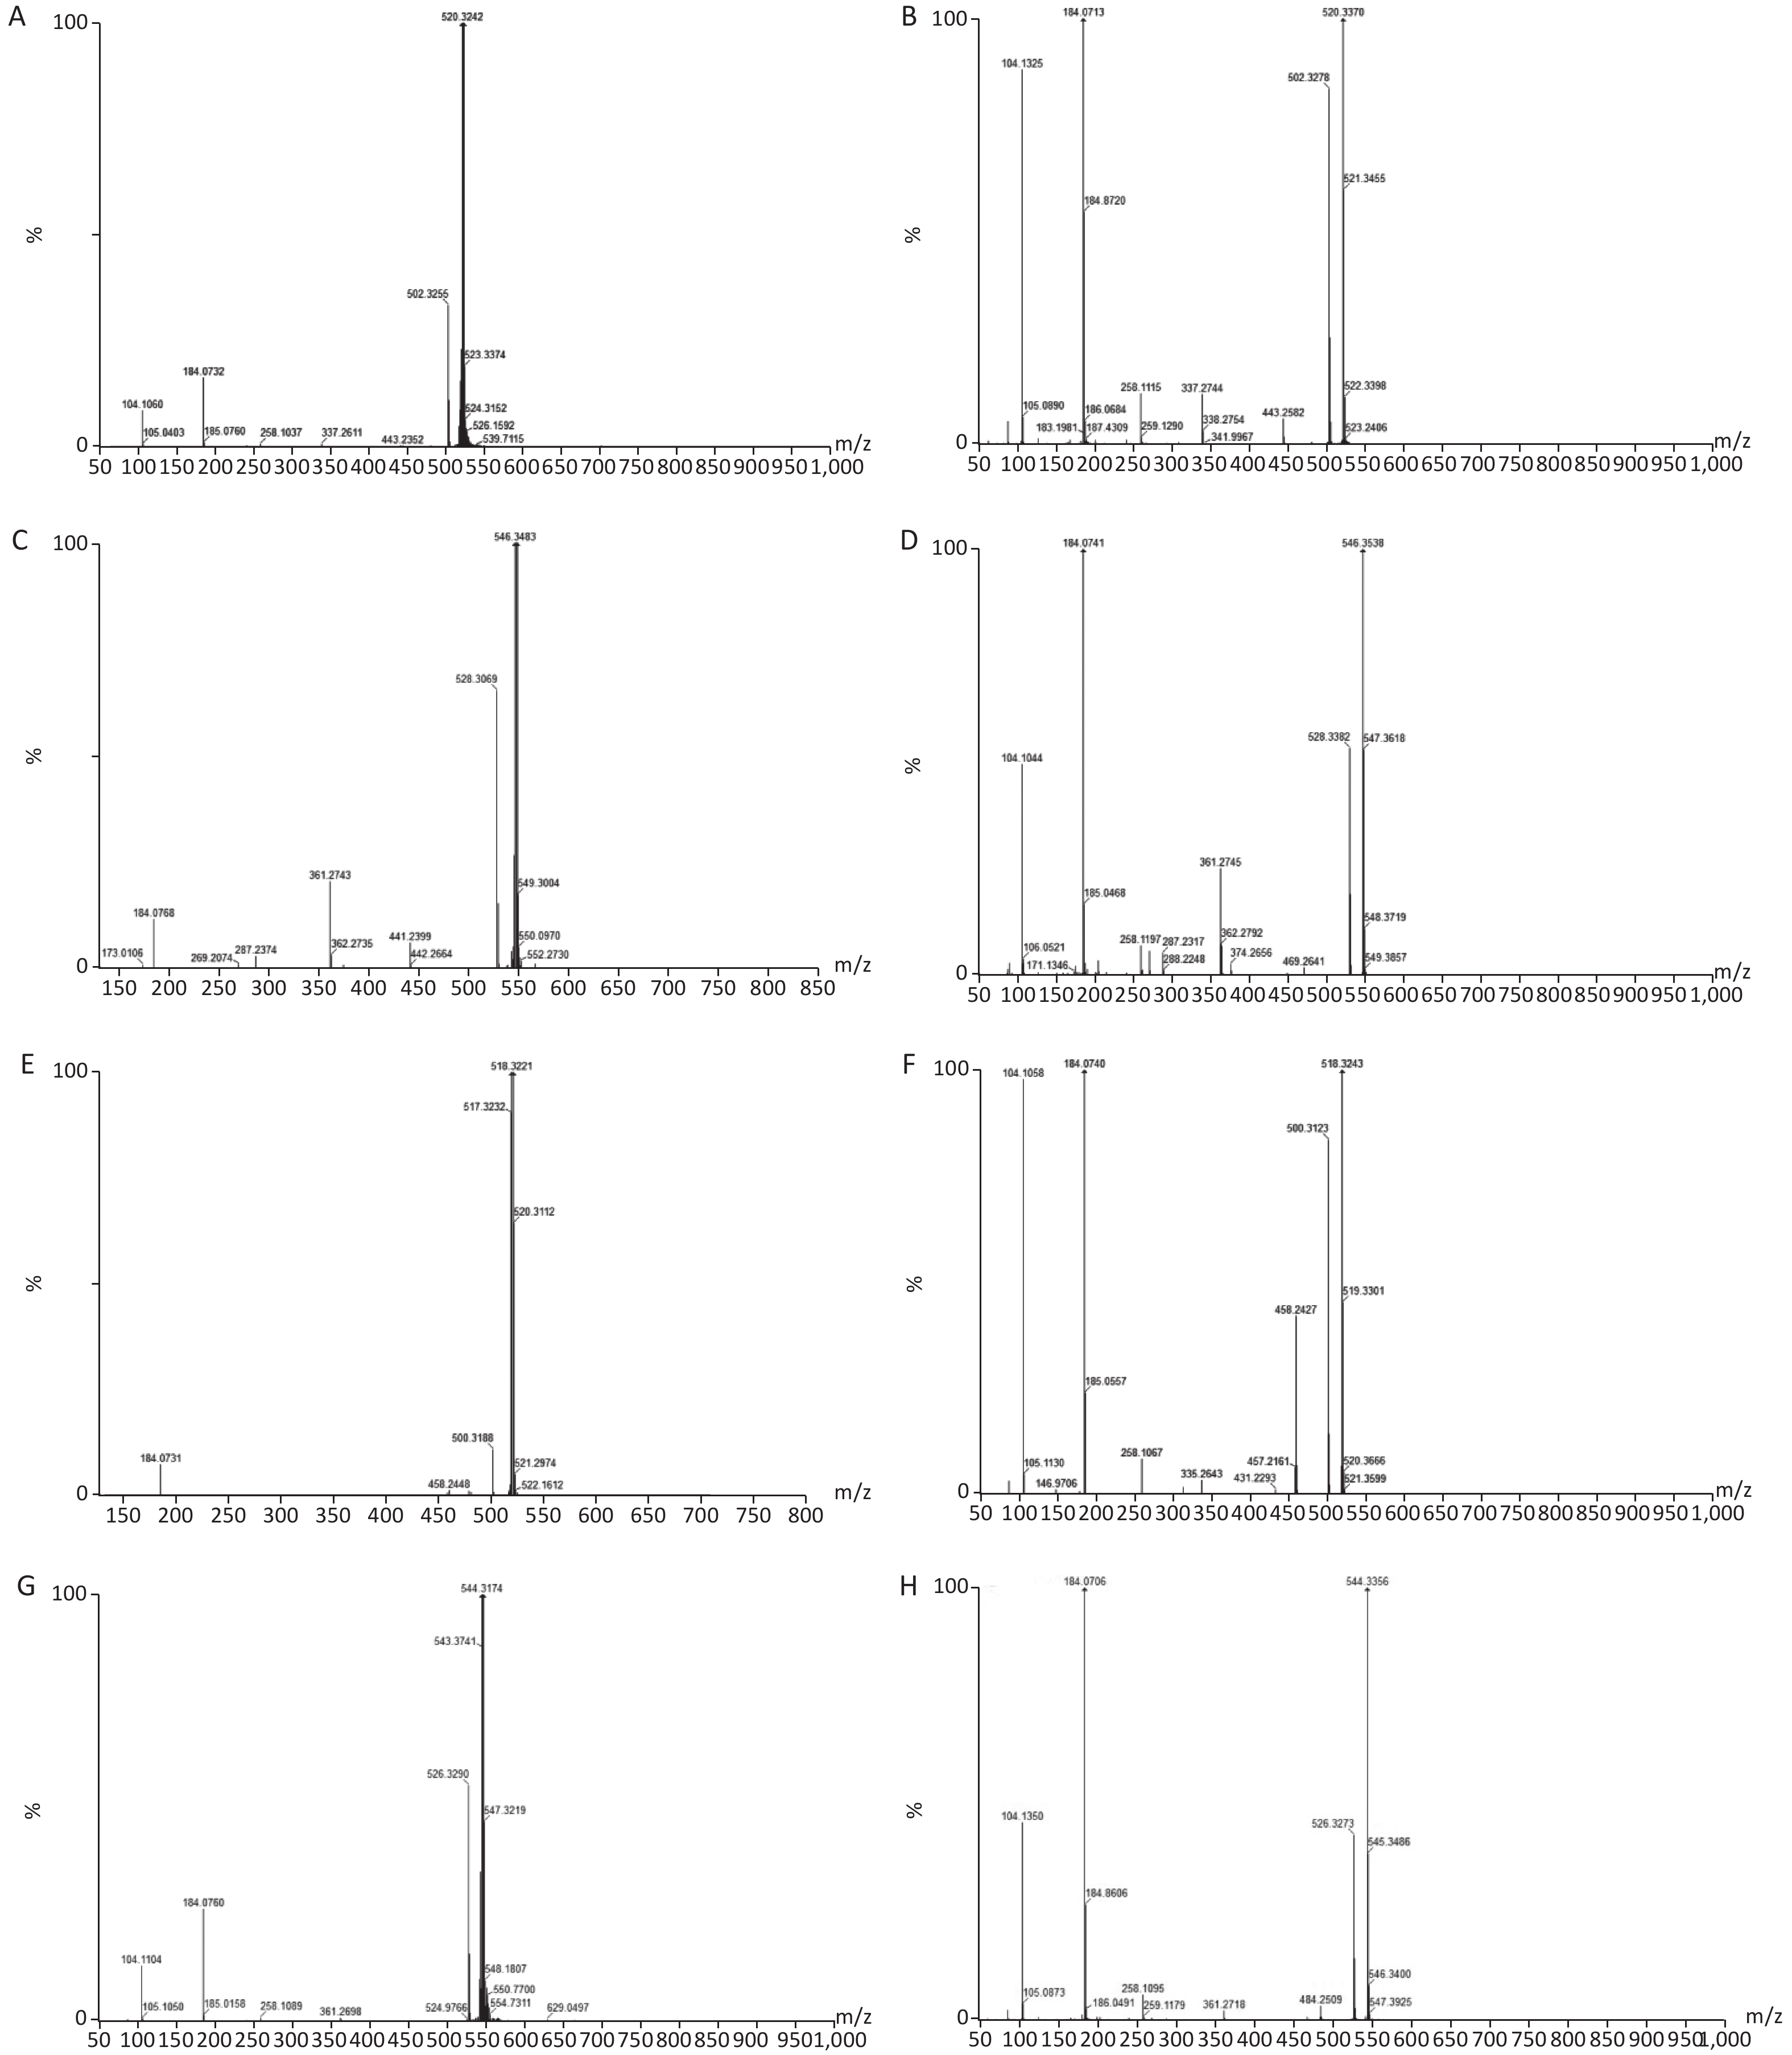
Twenty-five potential biomarkers were identified by the VIP parameters from loading plots and ANOVA. Both LS-MS/MS and HMDB were used to determine the elemental composition of each biomarker, and the biomarkers were further confirmed using MassFragment software and mass spectrometry patterns. The structural information of biomarkers, including m/z, retention time, postulated identity, and elemental composition is presented in Table 1. The chemical structures of representative hepatic lipid metabolism biomarkers are presented based on their collision energies (eV; Supplementary Figure S4, available in www.besjournal.com), and the intensity values of these metabolites are shown in Supplementary Table S2, available in www.besjournal.com. Twenty-five principal serum metabolites contributed to the clusters, with lipid metabolism signaling emerging as the most obviously disturbed pathway (Figure 2). This suggests that hepatic lipid metabolism in male rats was affected by long-term and high-dose intragastric DEHP administration. We identified 19 kinds of LPCs in the serum samples of the DEHP-exposed groups (Table 1). The serum levels of some membrane lipid bilayer components, including lysophospholipids, were significantly changed. These findings indicate that DEHP interferes with the metabolic balance of lipids in rat liver. We also noted a decrease in Indoleacrylic acid (IA). A recent study found that IA can induce inflammatory responses. Decreasing IA level could therefore induce anti-inflammatory responses and has positive benefits[6]. When inflammation occurs, the body's demand for tryptophan increases, and the catabolism of tryptophan is enhanced. The accumulation of indoleglycerol phosphate appears to be the result of a partial blockage of tryptophan synthetase, resulting in a deprivation of tryptophan. These results indicate that increasing levels of IA in the body could induce anti-inflammatory responses following DEHP-induced dysregulation of lipid metabolism.
Retention
time (min)Measured
m/z ion (Da)Calculated
m/z ion (Da)Mass error
(PPM)Elemental
compositionPostulated identity VIP Alteration
at 6M10.32 780.5534 780.5543 1 C44H78NO8P PC [18:1(11Z)/18:4(6Z,9Z,12Z,15Z)]a 2.1877 ↓* 9.79 552.4011 552.4029 3 C28H58NO7P LysoPC (20:0/0:0)a 2.5811 ↓** 8.93 538.3833 538.3873 7 C27H56NO7P LysoPE (22:0/0:0)b 3.0030 ↓** 8.81 466.3290 466.3298 1 C23H48NO6P LysoPE (P-18:0/0:0)a 1.1609 ↓** 8.65 550.3833 550.3873 7 C28H56NO7P LysoPC [20:1(11Z)/0:0]b 5.1805 ↓** 8.56 524.3663 524.3716 10 C26H54NO7P LysoPC (18:0/0:0)b 5.7536 ↑** 8.51 506.3573 506.3611 7 C26H52NO6P LysoPC [P-18:1(9Z)/0:0]a 1.5506 ↑** 7.91 510.3552 510.3560 1 C25H52NO7P LysoPC (17:0/0:0)b 3.0849 ↓** 7.84 548.3632 548.3716 15 C28H54NO7P LysoPC [20:2(11Z,14Z)/0:0]b 2.3481 ↓** 7.68 510.3546 510.3560 2 C25H52NO7P LysoPE (0:0/20:0)b 1.7546 ↓** 7.59 522.3404 522.3560 29 C26H52NO7P LysoPC [18:1(11Z)/0:0]b 5.1296 ↑** 7.23 546.3538 546.356 4 C28H52NO7P LysoPC [20:3(5Z,8Z,11Z)/0:0]b 3.5094 ↑** 7.13 496.332 496.3403 16 C24H50NO7P LysoPC (16:0/0:0)b 2.8206 ↑** 7.06 424.3405 424.3427 5 C25H45NO4 Linoelaidylcarnitineb 1.5196 ↓** 6.91 520.3370 520.3403 6 C26H50NO7P LysoPC [18:2(9Z,12Z)/0:0]b 5.7138 ↑** 6.85 544.3356 544.3403 8 C28H50NO7P LysoPC [20:4(5Z,8Z,11Z,14Z)/0:0]b 4.9367 ↑** 6.82 568.3342 568.3403 10 C30H50NO7P LysoPC [22:6(4Z,7Z,10Z,13Z,16Z,19Z)/0:0]b 3.2616 ↓* 6.61 494.3204 494.3247 8 C24H48NO7P LysoPC [16:1(9Z)/0:0]b 2.7394 ↑** 6.48 518.3243 518.3247 0 C26H48NO7P LysoPC [18:3(6Z,9Z,12Z)/0:0]b 1.2160 ↑** 6.37 468.3060 468.3090 6 C22H46NO7P LysoPC (14:0/0:0)b 2.4468 ↓* 5.55 333.2419 333.2430 3 C21H32O3 21-Hydroxypregnenoloneb 1.3367 ↓** 5.41 357.2758 357.2794 10 C24H36O3 Tetracosahexaenoic acidb 1.1079 ↓** 5.30 373.2710 373.2743 8 C24H36O3 Cervonoyl ethanolamideb 1.7246 ↓** 2.43 188.0691 188.0712 11 C11H9NO2 Indoleacrylic acida 2.0044 ↓** 0.80 132.0761 132.0773 9 C4H9N3O2 Creatinea 1.1823 ↓** Note. aPresents the ions that were identified by comparison to the standard chemicals. bPostulated identity of compound from HMDB and confirmed using exact mass data and MS fragmentation. ↑ increased; ↓ decreased; compared with the control group, *P < 0.05; **P < 0.01. Abbreviations: DEHP, di-(2-ethylhexyl) phthalate; UPLC/Q-TOF-MS - ultra-performance liquid chromatography coupled with quadrupole time-of-flight tandem mass spectrometry; VIP, Variable importance in projection; M, Months. ESI+, positive (ES+) ESI mode. Table 1. Alterations of potential serum biomarkers in high-dose DEHP-treated rats in UPLC/Q-TOF-MS ESI+

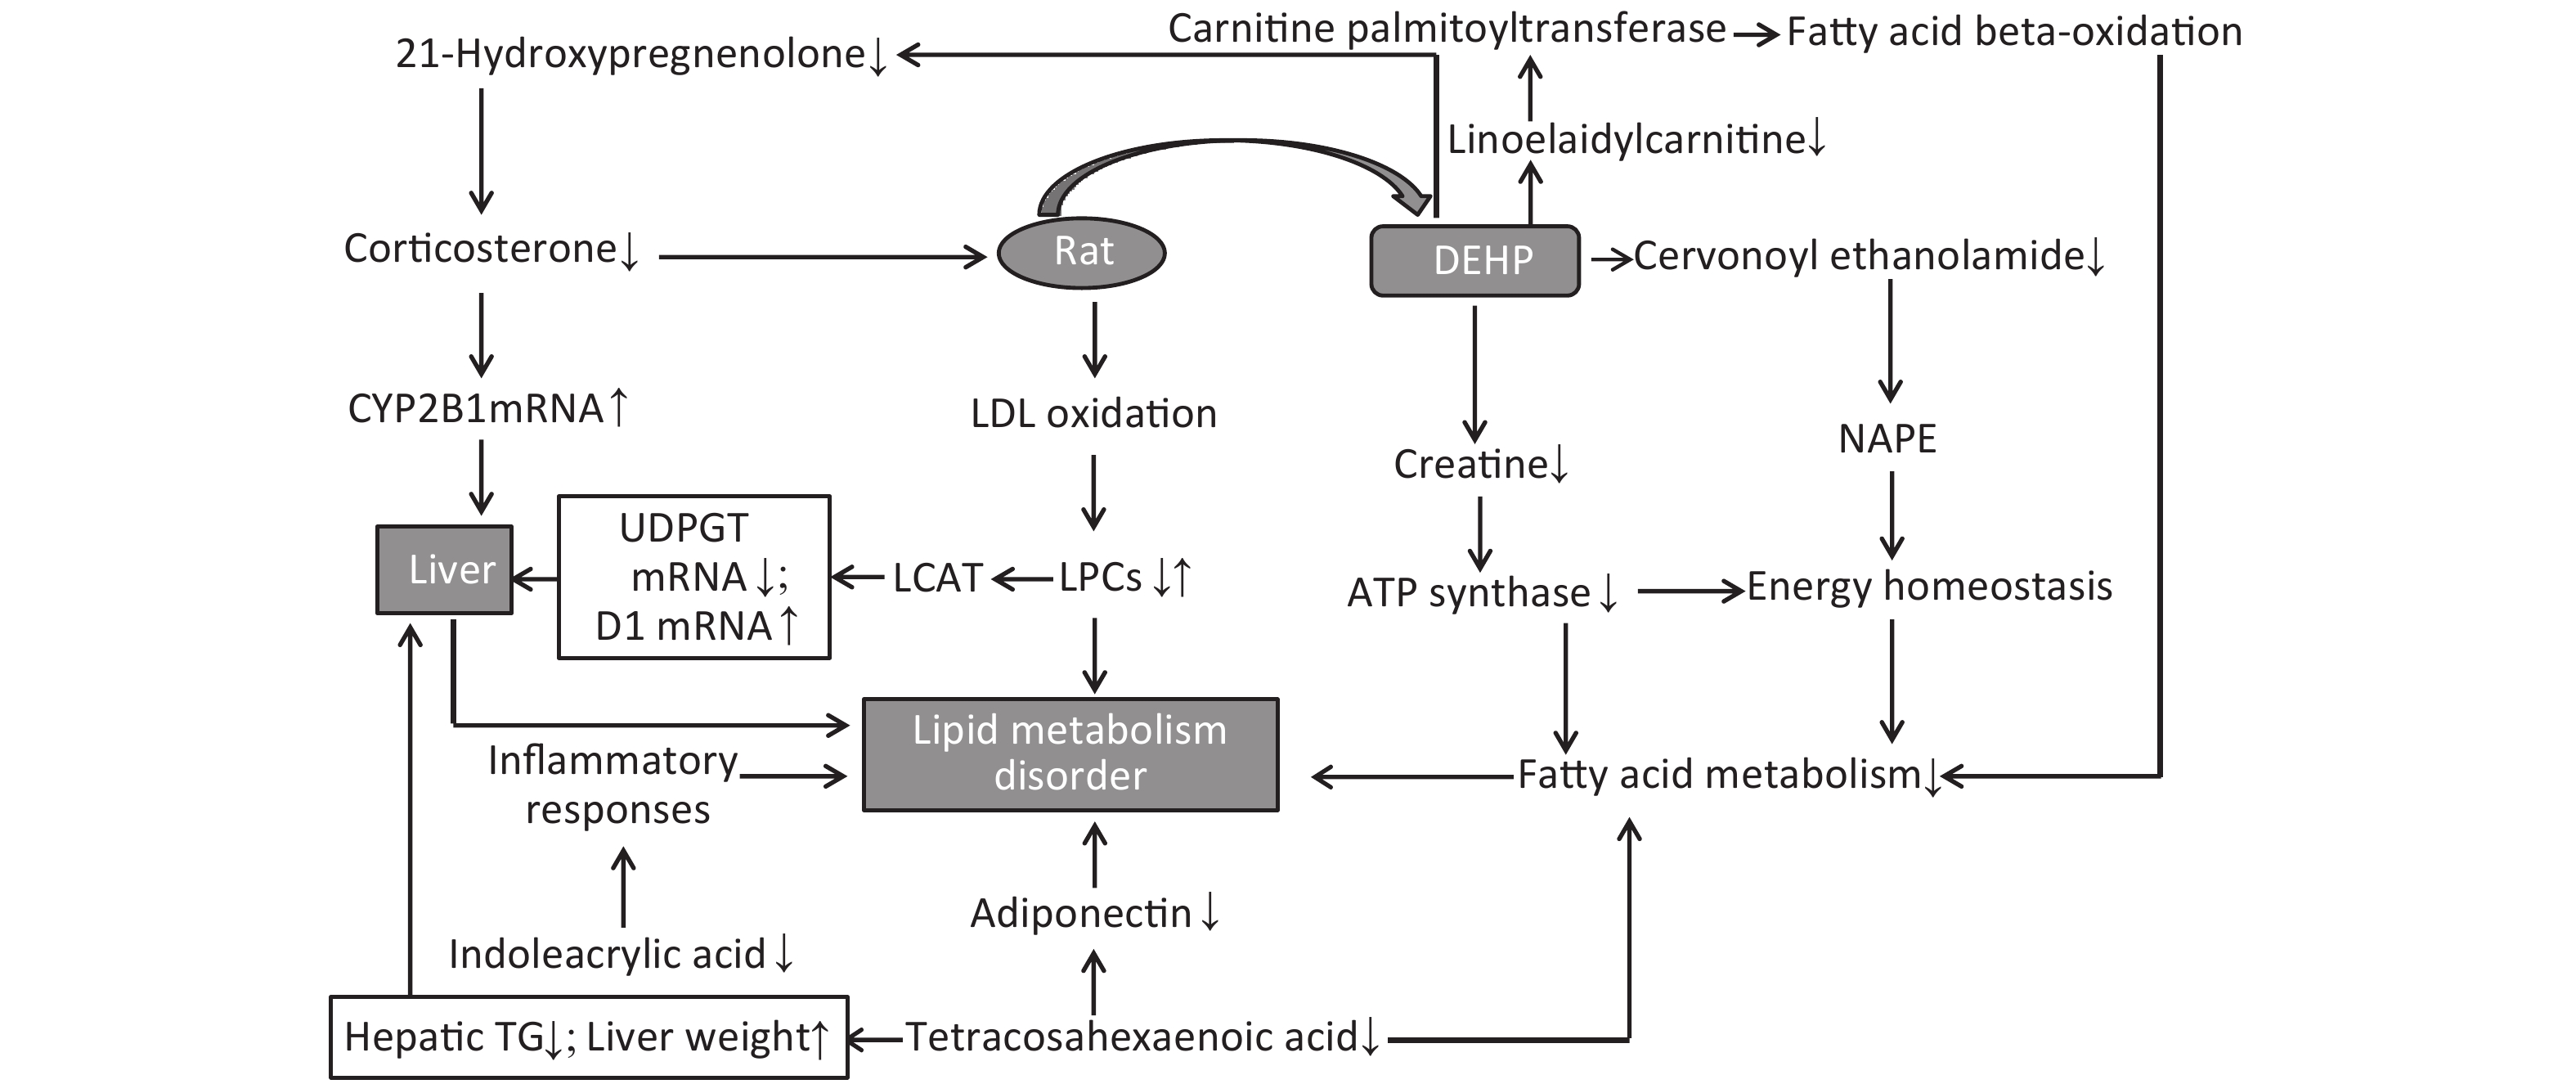
Figure 2. The altered lipid metabolism pathways in response to DEHP treatment.
Groups PC [18:1(11Z)/
18:4(6Z,9Z,12Z,15Z)]LysoPC (20:0/0:0) LysoPE (22:0/0:0) LysoPE (P-18:0/0:0) LysoPC [20:1(11Z)/0:0] LysoPC (18:0/0:0) LysoPC
[P-18:1 (9Z)/0:0]C 18.49 ± 9.34c 32.53 ± 3.08d 43.92 ± 11.54d 21.43 ± 2.25d 165.97 ± 34.73d 562.56 ± 47.04d 42.68 ± 3.62d M 14.02 ± 7.67 17.99 ± 3.67b 0.00 ± 0.00b 16.39 ± 3.68b 85.83 ± 32.81b 671.43 ± 49.31b 49.86 ± 4.44b H 4.34 ± 1.87a 19.40 ± 2.91b 2.56 ± 5.11b 14.93 ± 2.89b 72.95 ± 20.26b 734.41 ± 43.19b 49.43 ± 3.12b Groups LysoPC (17:0/0:0) LysoPC [20:2(11Z,14Z)/0:0] LysoPE (0:0/20:0) LysoPC [18:1(11Z)/0:0] LysoPC [20:3(5Z,8Z,11Z)/0:0] LysoPC (16:0/0:0) C 180.88 ± 21.71d 32.40 ± 2.79d 17.29 ± 9.65d 329.65 ± 22.54d 14.99 ± 6.51 389.56 ± 30.27 M 148.41 ± 24.36b 18.99 ± 3.35b 5.31 ± 8.77b 373.64 ± 30.56b 13.09 ± 14.03 409.49 ± 34.57 H 127.57 ± 17.42bc 18.71 ± 2.91b 3.27 ± 7.23b 457.43 ± 36.45bd 46.65 ± 18.74bd 443.44 ± 31.41bc Groups LysoPC
[18:2(9Z,12Z)/0:0]LysoPC
[20:4(5Z,8Z,11Z,14Z)/0:0]LysoPC [22:6(4Z,7Z,
10Z,13Z,16Z,19Z)/0:0]LysoPC [16:1(9Z)/0:0] LysoPC [18:3(6Z,9Z,12Z)/0:0] LysoPC (14:0/0:0) C 359.01 ± 38.72 369.88 ± 30.86 254.88 ± 18.81 36.49 ± 5.22 6.46 ± 2.49 29.08 ± 3.55d M 389.11 ± 18.13 454.28 ± 45.03b 267.34 ± 24.39 35.33 ± 6.22 8.23 ± 2.11 21.13 ± 3.40b H 491.28 ± 32.61bd 494.82 ± 43.44bc 225.10 ± 27.92ad 55.71 ± 12.16bd 13.56 ± 3.32bd 28.67 ± 4.64d Groups Linoelaidylcarnitine 21-Hydroxypregnenolone Tetracosahexaenoic acid Cervonoyl ethanolamide Indoleacrylic acid Creatine C 20.64 ± 6.07 14.74 ± 7.95 11.22 ± 4.63 44.66 ± 10.08d 108.38 ± 5.45 19.91 ± 2.32 M 15.32 ± 4.12 10.83 ± 6.04 9.29 ± 10.27 12.50 ± 10.78b 93.05 ± 14.22 18.99 ± 2.73 H 7.64 ± 1.65bd 3.37 ± 1.94bd 2.74 ± 1.02bc 3.81 ± 3.32b 86.48 ± 6.73b 14.33 ± 1.54bd Note. aP < 0.05 compared to group C. bP < 0.01 compared to group C. cP < 0.05 compared to group M. dP < 0.01 compared to group M. C: Control group, 0 mg/kg; M: Low-dose group, 300 mg/kg; H: High-dose group, 600 mg/kg. DEHP, di (2-ethylhexyl) phthalate; ESI, electrospray ionization. Table S2. Biomarkers detected in positive ESI mode in male rats serum (mean ± SD, n = 10)

Figure S4. Chemical structure and mass fragment information of representative serum biomarkers identified in this study with different collision energy (ev). (A), LysoPC [18:2(9Z, 12Z)/0:0] (25ev). (B), The mass spectra of LysoPC [18:2(9Z, 12Z)/0:0] from the authentic standard (25ev). (C), LysoPC [20:3(5Z, 8Z, 11Z)/0:0] (20ev). (D), The mass spectra of LysoPC [20:3(5Z, 8Z, 11Z)/0:0] from the authentic standard (25ev). (E), LysoPC [18:3(6Z, 9Z, 12Z)/0:0] (10ev). (F), The mass spectra of LysoPC [18:3(6Z, 9Z, 12Z)/0:0] from the authentic standard (15ev). (G), LysoPC [20:4(5Z, 8Z, 11Z, 14Z)/0:0] (15ev). (H), The mass spectra of [20:4(5Z, 8Z, 11Z, 14Z)/0:0] from the authentic standard (20ev).
LPCs are derived from LDL oxidation. Previous studies have also found increased levels of LDL in rat serum following DEHP treatment[7]. A number of LPCs are found in the liver due to its secretion of a specific enzyme named cholesterol acyltransferase (LCAT). The changes observed in these lysophospholipids indicate that the lipid metabolism in male rats can be dysregulated by DEHP exposure, which may then cause weight gain or obesity. Increases in body weight induced by long-term DEHP exposure in this study (Supplementary Figure S1A) further demonstrate the unhealthy effects of DEHP exposure.
It is known that abnormal lipid metabolism is positively correlated with LPC and LPA levels, which are common in patients with multiple liver diseases. The decreased LPC and LPE levels associated with DEHP in this study may then be correlated with liver dysfunction and abnormal lipid metabolism. In addition, high-dose DEHP further reduced such levels, suggesting that long-term high-dose DEHP exposure could increase liver damage by interfering with normal lipid metabolism. This conclusion was further validated by the increased organ/body weight ratios observed in this study (Supplementary Figure S1C). The study design indicates that the observed liver dysfunction was induced by DEHP exposure, and the results of clinical chemistry measurements further underscore this point. The liver indexes, such as AST and ALT, were all significantly increased in group M and H at 24 weeks, further indicating that exposure to DEHP may induce liver dysfunction. The consistent indications of metabolomics and clinical chemistry results suggest that long-term, high-dose DEHP caused disordered liver function in male rats. In addition, we observed liver cell necrosis, fatty degeneration, and vacuolar degeneration in liver cytoplasm appearing with increasing levels of DEHP in our study. Moreover, long-term DEHP exposure decreased the expression of UDPGT mRNA and increased the expression of D1 mRNA in hepatic tissue (Supplementary Figure S1D), thus further indicating hepatic lipid metabolism dysfunction.
21-hydroxypregnenolone is an essential intermediate in corticosterone production. It exhibits competitive inhibition of progesterone 17alpha-hydroxylation with steroidogenic cytochrome P450 c17 (CYP17), demonstrating that a hydroxyl group is important for substrate recognition by CYP17. Our results indicate that DEHP can inhibit 21-hydroxypregnenolone in male rats and thus increase the level of progesterone 17alpha-hydroxylation activity. The enhanced expression of CYP2B1 mRNA in hepatic tissue of the male rats in this study further indicates hepatic dysfunction and diseased lipid metabolism (Supplementary Figure S1D). Previous studies have indicated that THA can strongly inhibit hepatic TG accumulation and increase liver weight in exposed groups. Moreover, THA can increase adiponectin levels in serum[8]. The decreased levels of THA in groups M and H suggest that DEHP can disturb fatty acid metabolism.
Cervonoyl ethanolamide is an N-acylethanolamine that is part of a class of lipid compounds naturally present in animal membranes as constituents of the membrane-bound phospholipid, N-acylphosphatidylethanolamine (NAPE). NAPE is composed of a third fatty acid moiety that is linked to the amino head group of the commonly occurring membrane phospholipid, phosphatidylethanolamine. Thus, the reduction in N-acylethanolamines (NAE) is related to obesity and metabolic comorbidities[9]. Decreased levels of cervonoyl ethanolamide in group M and H indicate disordered lipid metabolism occurred, and could further lead to obesity and related comorbidities. Creatine can reduce fatty acid accumulation and inhibit ATP synthase expression, thus reducing the levels of high density lipoprotein and TG. A study recently indicated that creatine can regulate the activities of complex II, Na (+), K (+)-ATPase, and the levels of lipid peroxidation markers, suggesting that it is able to prevent lipid peroxidation[10]. The observed decreases in creatine levels in the DEHP-treated groups indicate that lipid peroxidation was impacted by DEHP to promote lipid and protein metabolism disorder.
Taken together, both the PCA and PLS-DA models indicate that the harmful effects of DEHP on the body are manifested by significant aggregation in different dose groups. We identified 25 meaningful biomarkers from the DEHP-treated and control groups. The results indicate that long-term DEHP exposure may induce obvious adverse outcomes, mainly via perturbations in lipid metabolism and hepatic function. The screened biomarkers for long-term DEHP exposure may serve as intervention targets for DEHP exposure in obese men. The LC-MS-based design used here is, to our knowledge, the first of its kind to study the effects on lipid metabolism induced by long-term DEHP exposure in male rats.
DONG Xin Wen contributed to the conceptualization, methodology and writing-original draft preparation; WU Wei Dong performed the study design and definition of intellectual content; YAO San Qiao performed the study concepts, supervision, literature research; ZHANG Yun Bo performed data acquisition and analysis; WANG Cheng performed the software, data analysis and validation; WU Hao Yu performed the experimental studies; NA Xiao Lin performed writing-reviewing and editing. All authors read and approved the final version of the manuscript.
The authors declare no competing financial interest.
HTML
 21027Supplementary Materials.pdf
|

|

 Quick Links
 DownLoad: