


-
Cardiovascular disease (CVD) is the leading cause of death globally[1]. Subclinical vascular abnormality presents as abnormal ankle-brachial index (ABI), elevated brachial-ankle pulse wave velocity (baPWV), and albuminuria, are precursors for major CVD events[2-4]. Early recognition of the subclinical vascular abnormality could help stratify the risk and prevent CVD events[5, 6]. Evidence demonstrates that systemic inflammations are risk factors and partly the underlying mechanism for CVD[7-9]. Therefore, evaluating the effect of inflammation on the progression of subclinical vascular abnormality may contribute to better prediction of CVD.
The white blood cell (WBC) count is a commonly used marker of systemic inflammation. Earlier studies have shown that it is independently associated with CVD and subclinical vascular disease. The neutrophil-to-lymphocyte ratio (NLR), a novel indicator of inflammatory response, is found to be more stable than individual leukocytic parameters and plays a critical role in subpopulations of WBC count[10, 11]. The NLR indicates an impaired cell-mediated immunity associated with systemic inflammation[12], and its prognostic role has been confirmed in several cancers such as colonic, pancreatic, and ovarian cancers[13-16]. Recently, the NLR has been found to be associated with the severity and prognosis of CVD[17]. Although several cross-sectional small-scale studies have confirmed the association between NLR and specific subclinical vascular conditions[18, 19], the predictive effect of NLR on subclinical vascular risk is less investigated. Moreover, the modified effect of obesity on the relationship between NLR and subclinical vascular abnormality has not been reported.
Therefore, in this prospective study, we aimed to examine the association between NLR and new-onset subclinical macrovascular and microvascular abnormalities manifested by an abnormal ABI, elevated baPWV, and albuminuria and further explored the modified effect by body mass index (BMI).
-
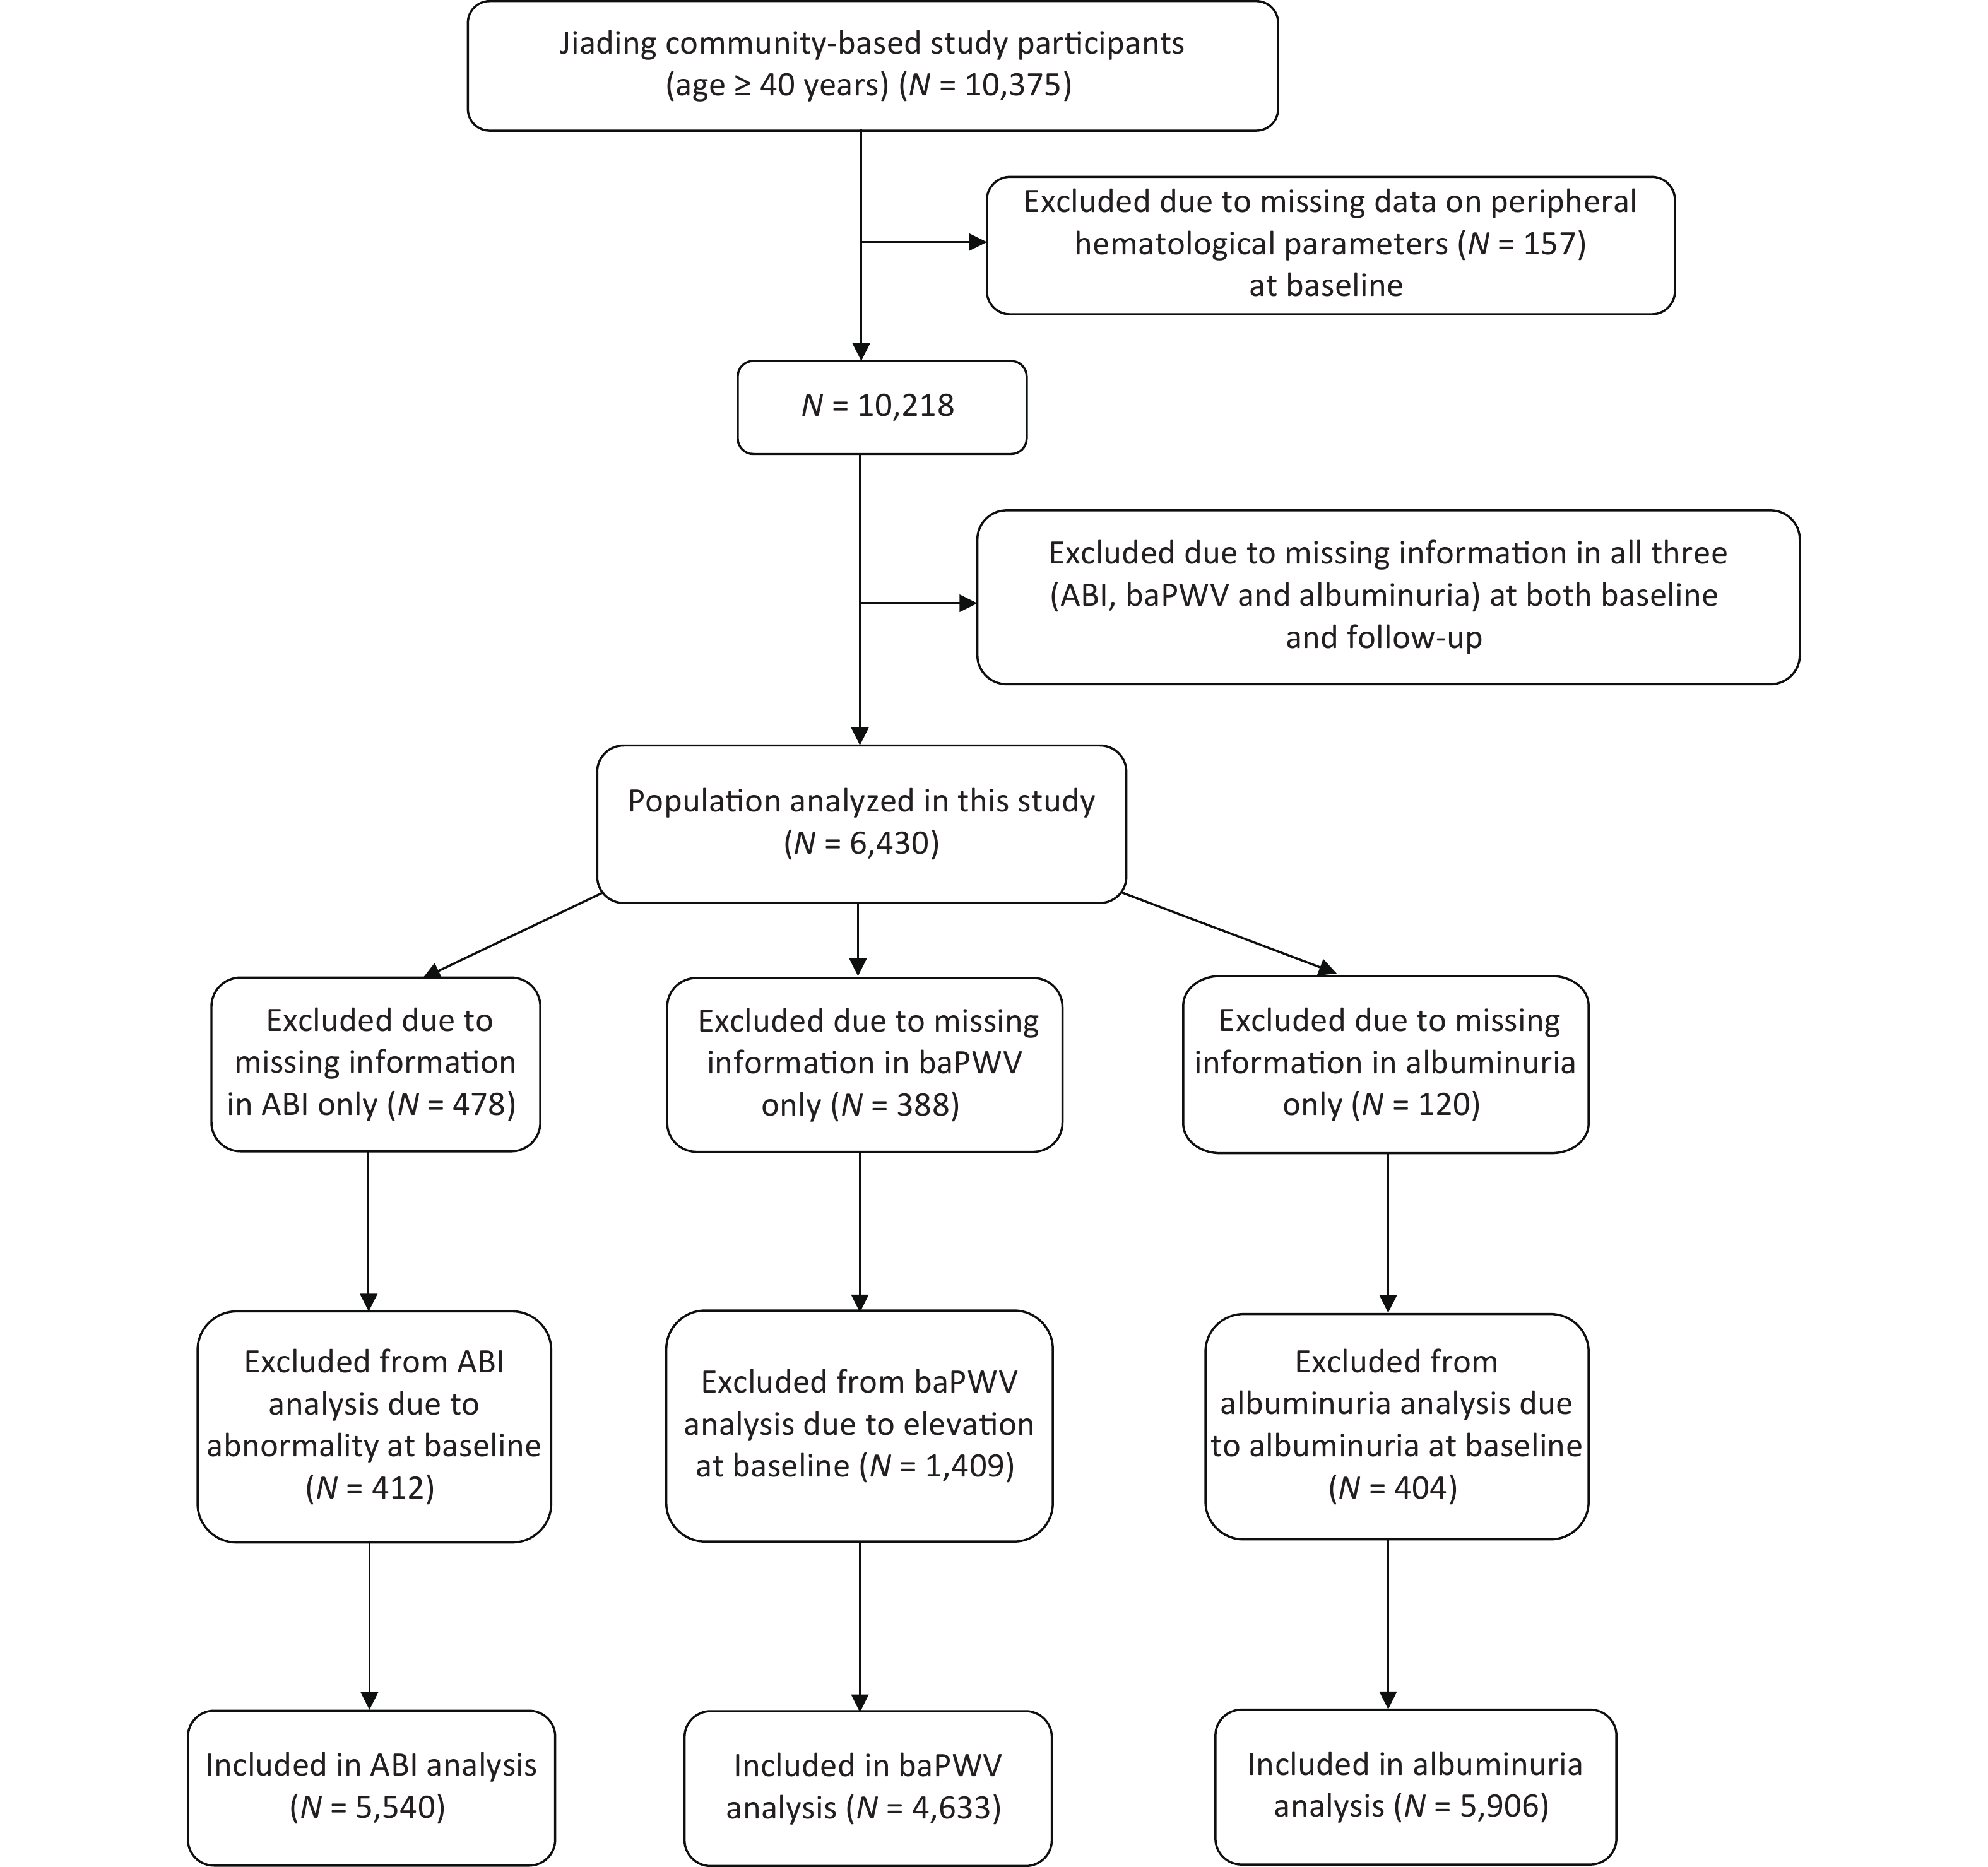
We randomly recruited subjects from Jiading District, Shanghai, China, between March and August 2010. A total of 10,375 residents aged ≥ 40 years were invited to participate and underwent a screening physical examination. We previously reported a detailed description of the study design and methods[20]. During August 2014 and May 2015, we invited all the participants to attend a follow-up visit. In this study, we excluded those with missing data on peripheral hematological parameters (n = 157) at baseline and those with all of the three indexes missing [ABI, baPWV, or urinary albumin/creatinine ratio (ACR), n = 3,788] at both baseline and follow-up. Finally, 6,430 participants were included in the present analysis. Additionally, we excluded 478 patients with missing data on ABI only at baseline or follow-up and 412 patients with abnormal ABI from the new-onset abnormal ABI analysis; we further excluded 388 patients with missing data in baPWV only at baseline or follow-up and 1,409 patients with elevated baPWV, and 120 patients with missing data in ACR only at baseline or follow-up and 404 patients with ACR ≥ 30 mg/g at baseline from the respective analysis (Figure 1). The study protocol was approved by the Institutional Review Board of Rui-Jin Hospital, and we obtained written informed consent from each participant.
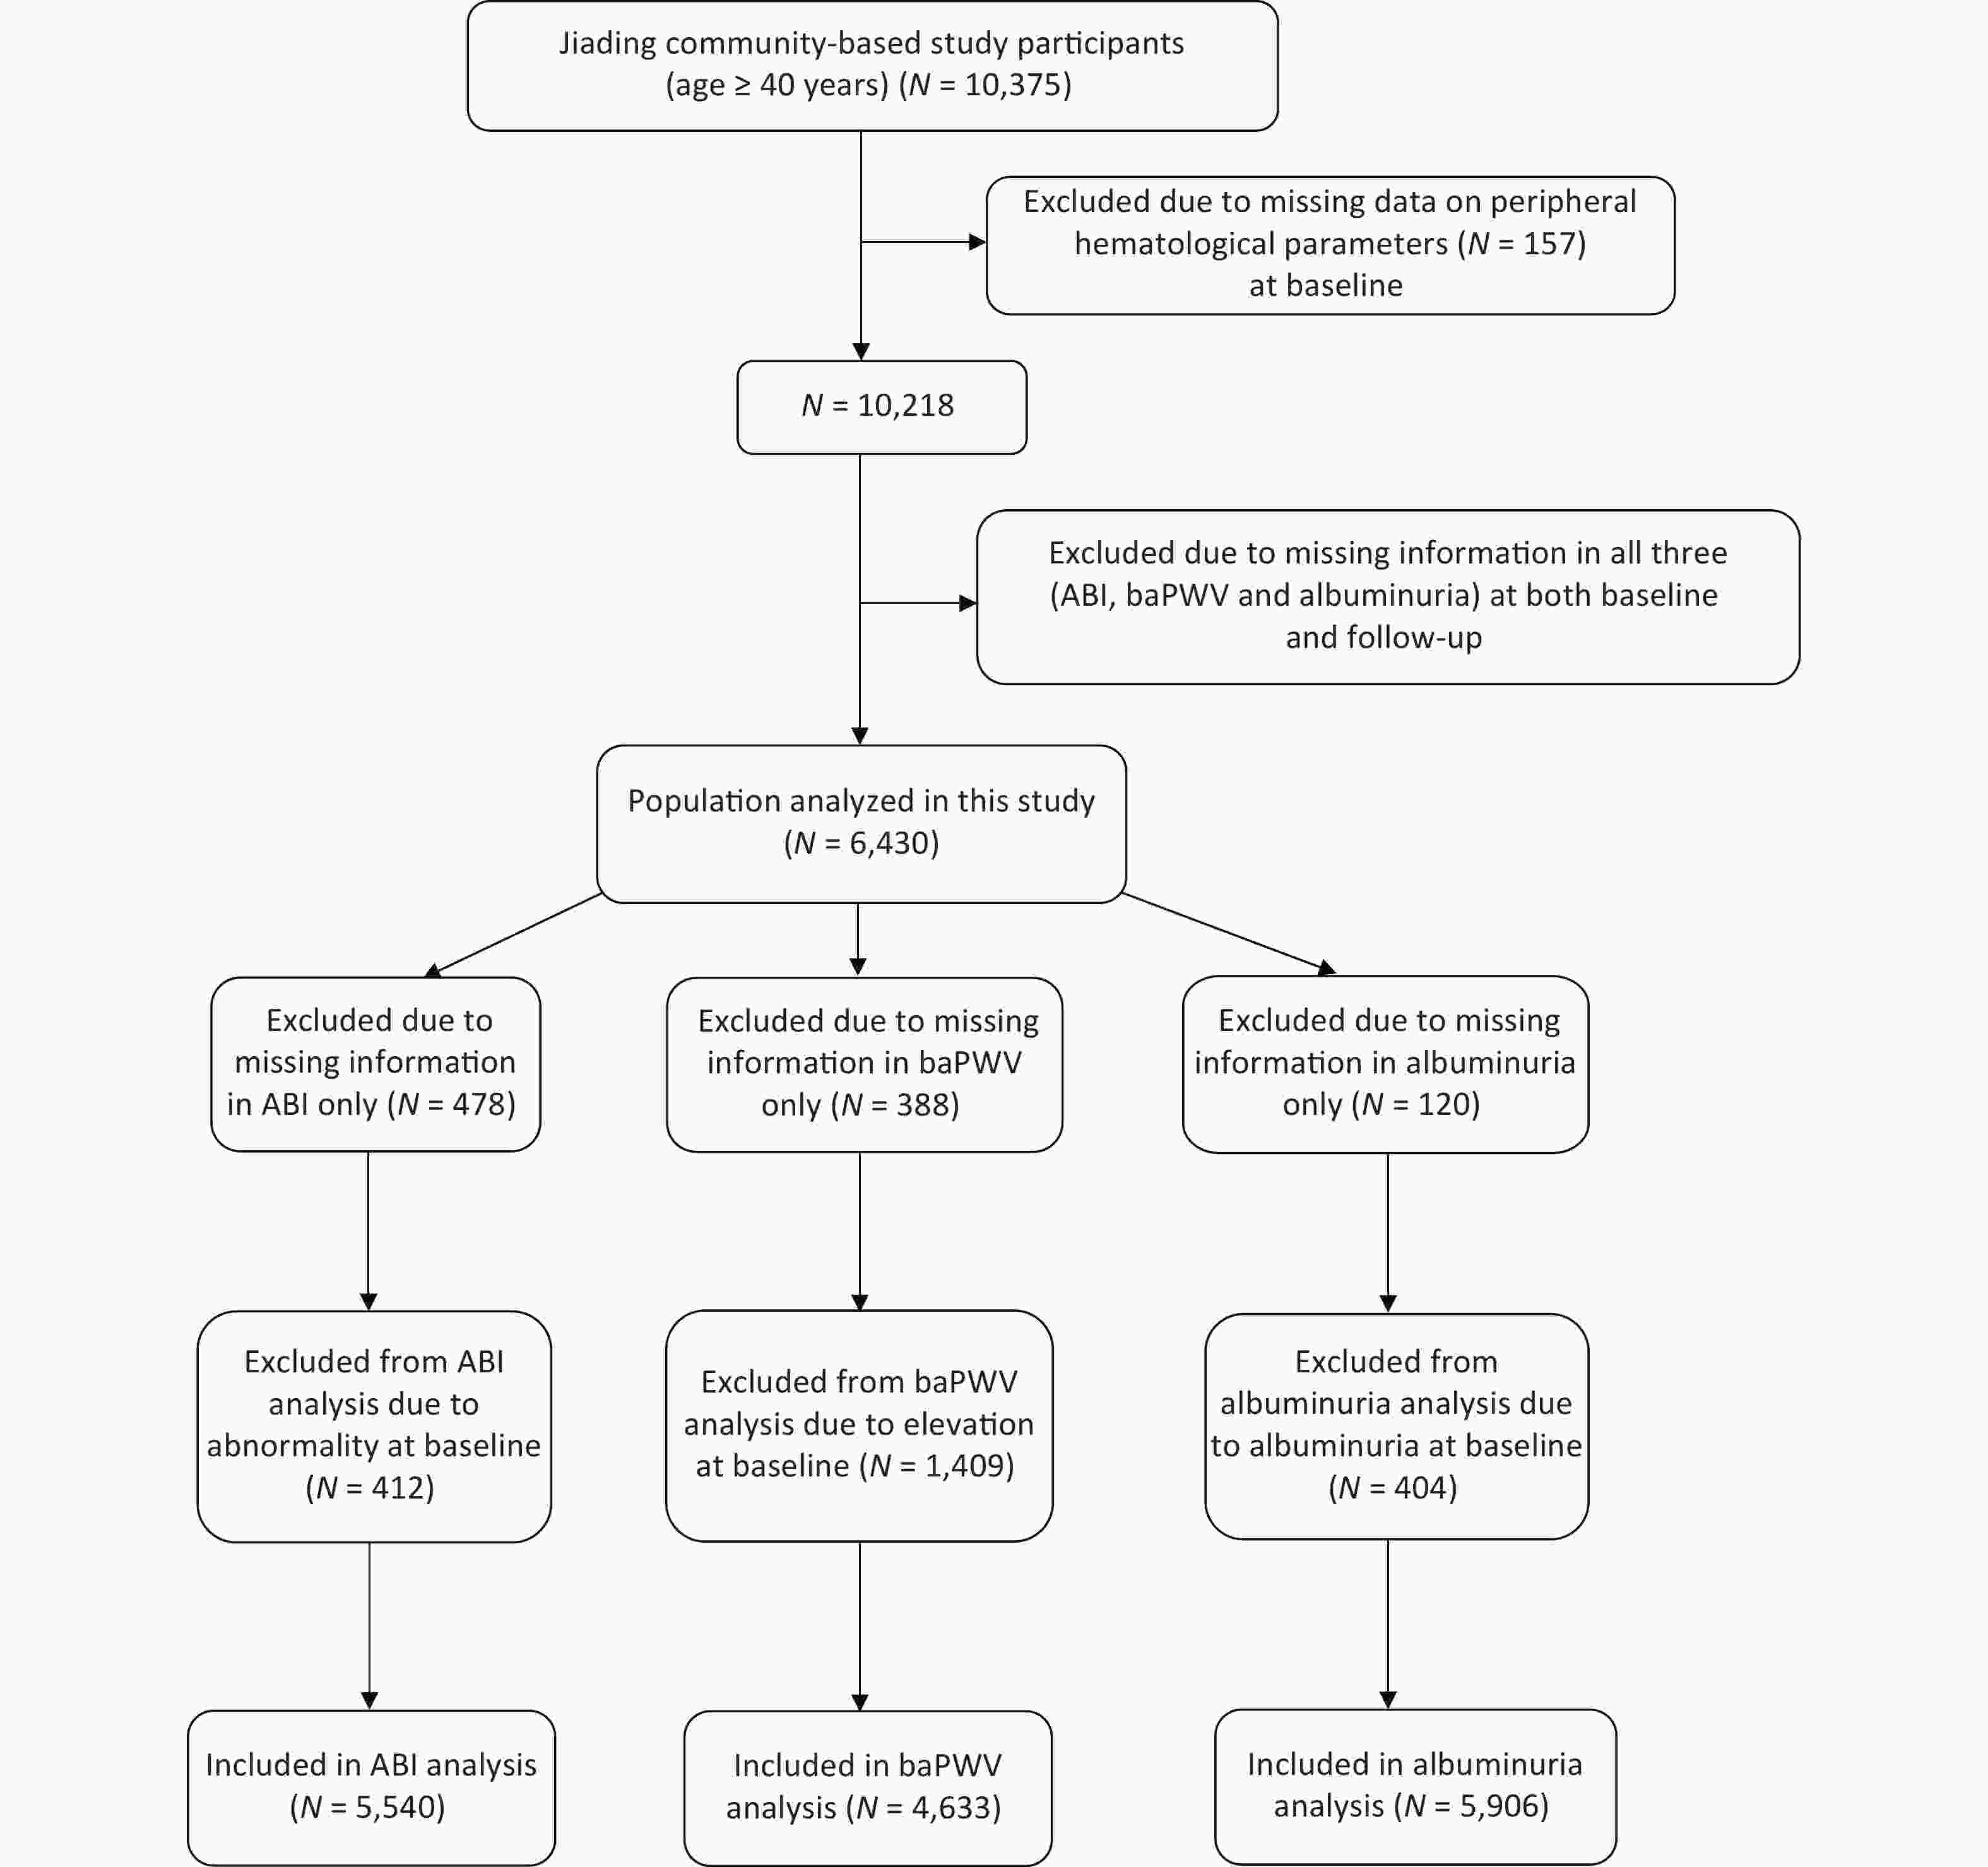
Figure 1. Flowchart of the study population.
-
Using face-to-face interviews, trained investigators obtained detailed information about demographic characteristics, education attainment, lifestyle factors, including smoking and drinking habits, and physical activity. Current smokers were defined as those who had smoked one or more cigarettes per day or seven or more cigarettes per week during the past six months. Likewise, current drinkers were defined as those who had consumed alcohol regularly in the past six months[21, 22]. Physical activity during leisure time was evaluated using the short form of the International Physical Activity Questionnaire (IPAQ), and positive physical activity was defined as ≥ 150 minutes of moderate or vigorous activity per week[23].
Trained personnel measured the body weight, height, waist circumference, and blood pressures according to a standard protocol. BMI was calculated as body weight in kilograms divided by body height squared in meters (kg/m2) and was classified into two categories based on the Chinese criteria[24]: normal weight (< 24 kg/m2) and overweight/obesity (≥ 24 kg/m2). The waist circumference was measured using a measuring tape placed midway between the lowest rib and the superior border of the iliac crest as the participant exhaled normally. After at least 5 minutes of rest in a seated position, the blood pressure was measured 3 times consecutively on the non-dominant arm with an automated electronic device (OMRON Model HEM-752 FUZZY, Omron Company, Dalian, China) with 1-minute interval each. We used the average value of the three readings of systolic blood pressure (SBP) and diastolic blood pressure (DBP) for analysis.
Blood samples were drawn in the morning after an overnight fast (at least 10 h). The chemiluminescence method with the auto-analyzer (Modular E170; Roche, Basel, Switzerland) was used to measure the total cholesterol (TC), low-density lipoprotein cholesterol (LDL-c), high-density lipoprotein cholesterol (HDL-c), and triglycerides. High-performance liquid chromatography (Variant II Hemoglobin Testing System, Bio-Rad Laboratories, Hercules, California) was used to measure glycated hemoglobin (HbA1c). Using an automated cell counter (Hematology analyzer 120; ABX, Montpellier, France), we measured peripheral hematological parameters. A first-voided, early-morning spot urine sample was obtained to measure the urinary albumin and creatinine using an immunoturbidimetric method (Beijing Atom High-Tech, Beijing, China) and Jaffe’s kinetic method on an automatic analyzer (Hitachi 7600-020, Tokyo, Japan), respectively. Urinary ACR measured in mg/g was calculated by dividing the urinary albumin concentration by the urinary creatinine concentration.
The automatic arteriosclerosis diagnosis device (Colin VP-1000, Model BP203RPE II, form PWV/ABI, Japan) was used to examine and calculate ABI and baPWV [25, 26]. These two measurements require participants to be at rest for 10–15 minutes in a thermostatic room (25 ℃) before starting. For ABI examination, the brachial artery pressure and ankle artery pressure were measured in both sides of the upper arm brachial arteries and 2 cm above the medial malleolus, respectively. An ABI < 0.90 or ABI > 1.40 was defined as abnormal. Measurements from the brachial and tibial arteries were obtained simultaneously for baPWV. We measured the transit time, the time interval between the initial increase in brachial and tibial waveforms, and the transit distance between the arm and ankle. The baPWV was calculated as the transit distance divided by the transit time. We adopted the mean value of the right and left common baPWV for analysis at baseline and follow-up.
-
We evaluated abnormal ABI, elevated baPWV, and albuminuria in the population using the same method and standard at baseline and follow-up. Those who did not have these abnormalities at baseline but occurred during follow-up were classified as new-onset. An ABI < 0.90 or ABI > 1.40 were defined as new-onset abnormal ABI[27]. New-onset elevated baPWV was defined as the upper quartile of baseline baPWV (≥ 1,800 cm/s). An ACR ≥ 30 mg/g was considered new-onset albuminuria[28].
-
Basic characteristics were described by the quartiles of NLR. The data were reported as mean ± standard deviation (SD) or median (interquartile range) depending on the normality of the continuous variables, or as number (percentage) for categorical variables. Differences between categories were compared using one-way ANOVA or χ2 as appropriate. For continuous variables especially, we log-10 transformed the variables which were not distributed normally to achieve normality assumption. Poisson regression analysis was used to generate estimated risk ratios (RRs) and 95% confidence interval (CIs) for the association of NLR and risk of abnormal ABI, elevated baPWV, and albuminuria. We adjusted potential confounders measured at baseline in the analysis. Model 1 was adjusted for age, sex, educational attainment, physical activity, smoking, and drinking status. Model 2 was further adjusted for metabolic risk factors (BMI, HbA1c, SBP, DBP, LDL-c, HDL-c, and triglycerides) based on model 1. Finally, we performed stratified analysis on the association between NLR and incident subclinical microvascular and macrovascular abnormalities according to the BMI level (< 24 or ≥ 24 kg/m2) and waist circumference (< 90 or ≥ 90 cm for men and < 80 or ≥ 80 cm for women).
Significance tests were two-tailed and a P < 0.05 was considered statistically significant. All statistical analyses were performed using SAS version 9.4 (SAS Institute Inc., Cary, North Carolina)
-
Table 1 shows the baseline characteristics of the participants stratified according to quartiles of NLR. The proportion of men, current smokers, and current drinkers increased with increased NLR quartiles (P < 0.05). With the increment of NLR, participants tended to be with lower levels of LDL-c, HDL-c, TC, and higher levels of waist circumference, SBP, and DBP (all P < 0.05; Table 1). Moreover, the baseline prevalence of baPWV and albuminuria increased with NLR quartiles. There was no significant difference between NLR levels and the proportion of participants in high school or above and those doing moderate to vigorous physical activity (both P > 0.05; Table 1).
CharacteristicsNLR Quartiles Q1 Q2 Q3 Q4 P value N (%) 1,566 (24.4) 1,620 (25.2) 1,623 (25.2) 1,621 (25.2) Age (years) 58.10 ± 8.14 57.77 ± 8.39 57.84 ± 8.97 58.39 ± 9.37 0.16 Male sex, n (%) 453 (28.9) 530 (32.7) 628 (38.7) 738 (45.5) < 0.0001 ≥ 9 years of Education, n (%) 997 (63.9) 1,051 (65.2) 1,055 (65.3) 1,027 (63.7) 0.93 Current drinking, n (%) 119 (7.8) 142 (9.0) 179 (11.4) 184 (11.8) < 0.0001 Current smoking, n (%) 229 (15.1) 296 (19.0) 334 (21.3) 386 (24.7) < 0.0001 Ideal physical activity, n (%) 1,136 (72.5) 1,150 (71.0) 1,160 (71.5) 1,156 (71.3) 0.53 BMI (kg/m2) 25.06 ± 3.25 25.41 ± 3.34 25.32 ± 3.26 25.10 ± 3.15 0.01 Waist circumference (cm) 87.22 ± 6.13 87.73 ± 6.15 88.14 ± 6.04 88.11 ± 6.08 < 0.0001 SBP (mmHg) 140.09 ± 18.93 141.52 ± 19.99 141.68 ± 19.79 142.40 ± 20.46 0.01 DBP (mmHg) 82.36 ± 10.14 82.84 ± 10.23 83.23 ± 10.18 83.77 ± 10.60 0.001 HbA1c (%) 5.82 ± 0.84 5.84 ± 0.93 5.84 ± 0.91 5.85 ± 0.99 0.74 Triglycerides (mmol/L) 1.40 (0.98–1.91) 1.41 (1.00–2.02) 1.39 (1.02–2.00) 1.33 (0.95–1.89) 0.01 LDL-c (mmol/L) 3.34 ± 0.89 3.25 ± 0.86 3.19 ± 0.86 3.07 ± 0.83 < 0.0001 HDL-c (mmol/L) 1.36 ± 0.32 1.33 ± 0.31 1.30 ± 0.32 1.31 ± 0.32 < 0.0001 TC (mmol/L) 5.51 ± 1.01 5.43 ± 1.06 5.32 ± 0.97 5.20 ± 0.96 < 0.0001 Baseline abnormal ABI, n (%) 101 (6.6) 99 (6.3) 112 (7.1) 120 (7.6) 0.19 Baseline elevated baPWV, n (%) 318 (21.1) 335 (21.5) 373 (24.1) 426 (27.3) < 0.0001 Baseline albuminuria, n (%) 76 (4.9) 108 (6.7) 117 (7.2) 116 (7.2) 0.007 Note. Data are expressed as mean ± SD, median (interquartile range), or n (%). NLR, neutrophil-to-lymphocyte ratio; BMI, body mass index; SBP, systolic blood pressure; DBP, diastolic blood pressure; HbA1c, glycated hemoglobin; LDL-c, low-density lipoprotein cholesterol; HDL-c, high-density lipoprotein cholesterol; TC, total cholesterol; ABI, ankle-brachial index; baPWV, brachial-ankle pulse wave velocity; SD, standard deviation. Table 1. Baseline characteristics according to quartiles of NLR (n = 6,430)
-
Table 2 shows the risk of new-onset abnormal ABI, elevated baPWV, or albuminuria according to baseline NLR quartiles. On Poisson regression analysis, NLR was significantly associated with increased risk of new-onset abnormal ABI, elevated baPWV, and albuminuria. The incidence of abnormal ABI was 1.4%, 1.5%, 1.9%, and 3.1%, the incidence of elevated baPWV was 14.8%, 15.3%, 17.1%, and 17.2%, and the incidence of albuminuria was 7.8%, 8.1%, 8.5%, and 9.8% from the lowest to highest NLR quartiles. After full adjustment for age, sex, educational attainment, physical activity, smoking status, drinking status, and metabolic risk factors, the RRs and related 95% CIs for quartile 2 to quartile 4 compared with the lowest quartile for abnormal ABI analysis were 1.07 (95% CI 0.57–2.01), 1.35 (95% CI 0.75–2.44) and 2.05 (95% CI 1.17–3.57), respectively (Table 2). Similarly, participants in the highest NLR quartile presented an increased risk of new-onset albuminuria (RR: 1.37; 95% CI 1.06–1.77). Furthermore, compared with the lowest quartile of NLR, quartiles 3 and 4 presented a significantly higher risk of new-onset elevated baPWV (RR: 1.25; 95% CI 1.01–1.54 for quartile 3; RR: 1.25; 95% CI 1.01–1.55 for quartile 4). In addition, the multivariable-adjusted RR per SD increment of NLR was 1.32 (95% CI 1.15–1.50) for new-onset abnormal ABI, 1.11 (95% CI 1.03–1.19) for new-onset elevated baPWV, and 1.13 (95% CI 1.04–1.23) for new-onset albuminuria.
NLR
No. of participants
Cases, n (%)RR (95% CI) Model 1 Model 2 Abnormal ABI Quartile 1 1,389 20 (1.4) 1.00 (ref.) 1.00 (ref.) Quartile 2 1,366 20 (1.5) 1.07 (0.57−2.01) 1.07 (0.57−2.01) Quartile 3 1,415 27 (1.9) 1.38 (0.76−2.48) 1.35 (0.75−2.44) Quartile 4 1,370 43 (3.1) 2.02 (1.16−3.51) 2.05 (1.17−3.57) Per SD increase 1.31 (1.15−1.50) 1.32 (1.15−1.50) Elevated baPWV Quartile 1 1,162 172 (14.8) 1.00 (ref.) 1.00 (ref.) Quartile 2 1,160 178 (15.3) 1.07 (0.86−1.33) 1.04 (0.84−1.29) Quartile 3 1,149 196 (17.1) 1.26 (1.02−1.56) 1.25 (1.01−1.54) Quartile 4 1,162 200 (17.2) 1.28 (1.03−1.58) 1.25 (1.01−1.55) Per SD increase 1.10 (1.03−1.18) 1.11 (1.03−1.19) Albuminuria Quartile 1 1,471 114 (7.8) 1.00 (ref.) 1.00 (ref.) Quartile 2 1,493 121 (8.1) 1.11 (0.86−1.44) 1.09 (0.84−1.41) Quartile 3 1,468 124 (8.5) 1.15 (0.88−1.49) 1.13 (0.87−1.47) Quartile 4 1,474 144 (9.8) 1.38 (1.07−1.78) 1.37 (1.06−1.77) Per SD increase 1.13 (1.04−1.22) 1.13 (1.04−1.23) Note. Model 1: Adjusted for age, sex, educational attainment, physical activity, smoking status, and drinking status. Model 2: Further adjusted for metabolic risk factors (HbA1c, SBP, DBP, LDL-c, HDL-c, and triglycerides, BMI) based on model 1. NLR, neutrophil-to-lymphocyte ratio; ABI, ankle-brachial index; baPWV, brachial-ankle pulse wave velocity; SD, standard deviation BMI, body mass index; SBP, systolic blood pressure; DBP, diastolic blood pressure; HbA1c, glycated hemoglobin; LDL-c, low-density lipoprotein cholesterol; HDL-c, high-density lipoprotein cholesterol, RR, risk ratio; CI, confidence interval. Table 2. Association of NLR with subclinical macrovascular and microvascular diseases
-
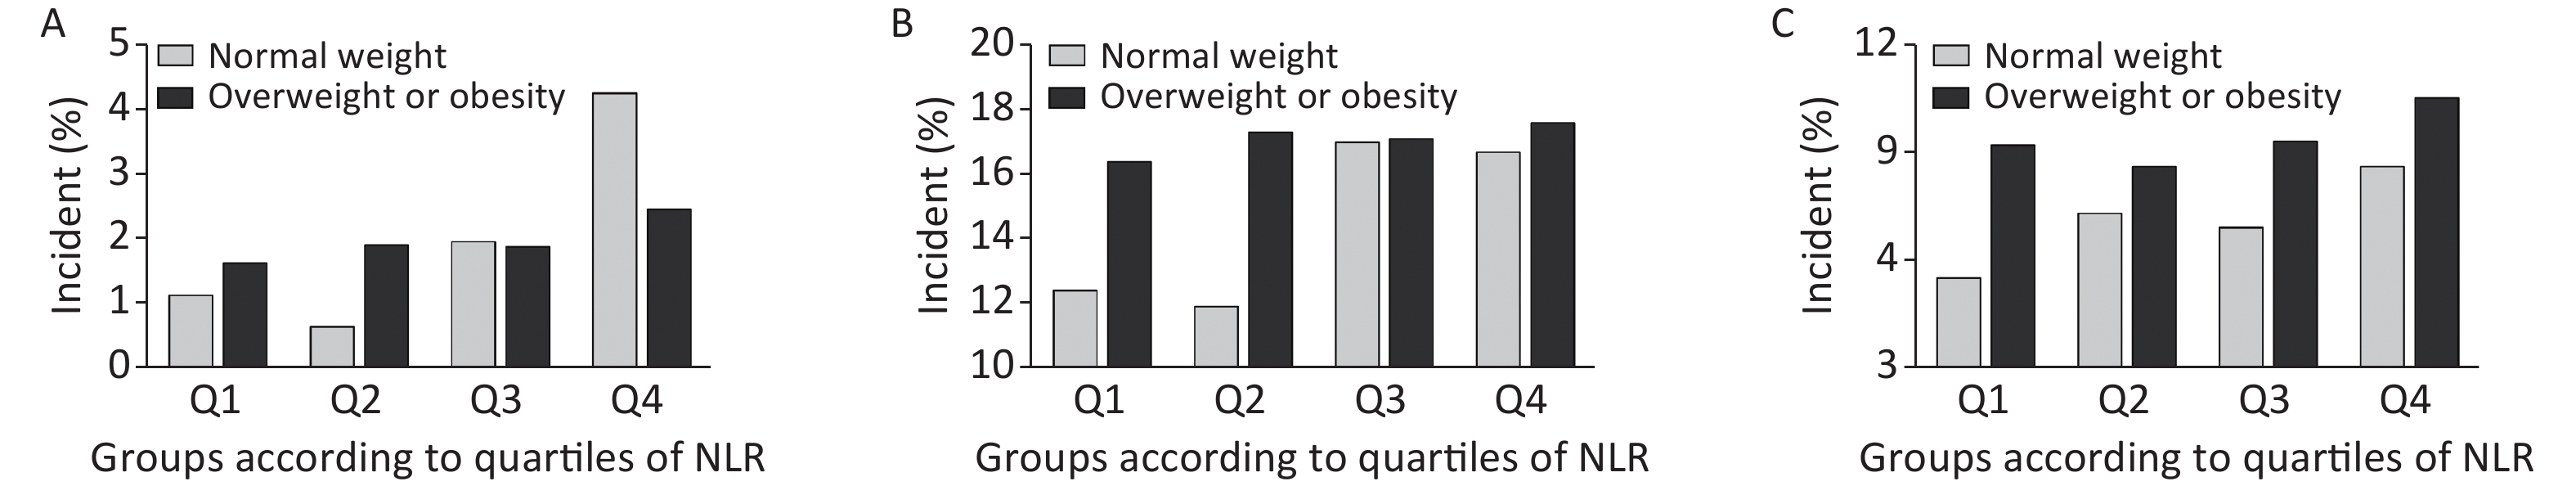
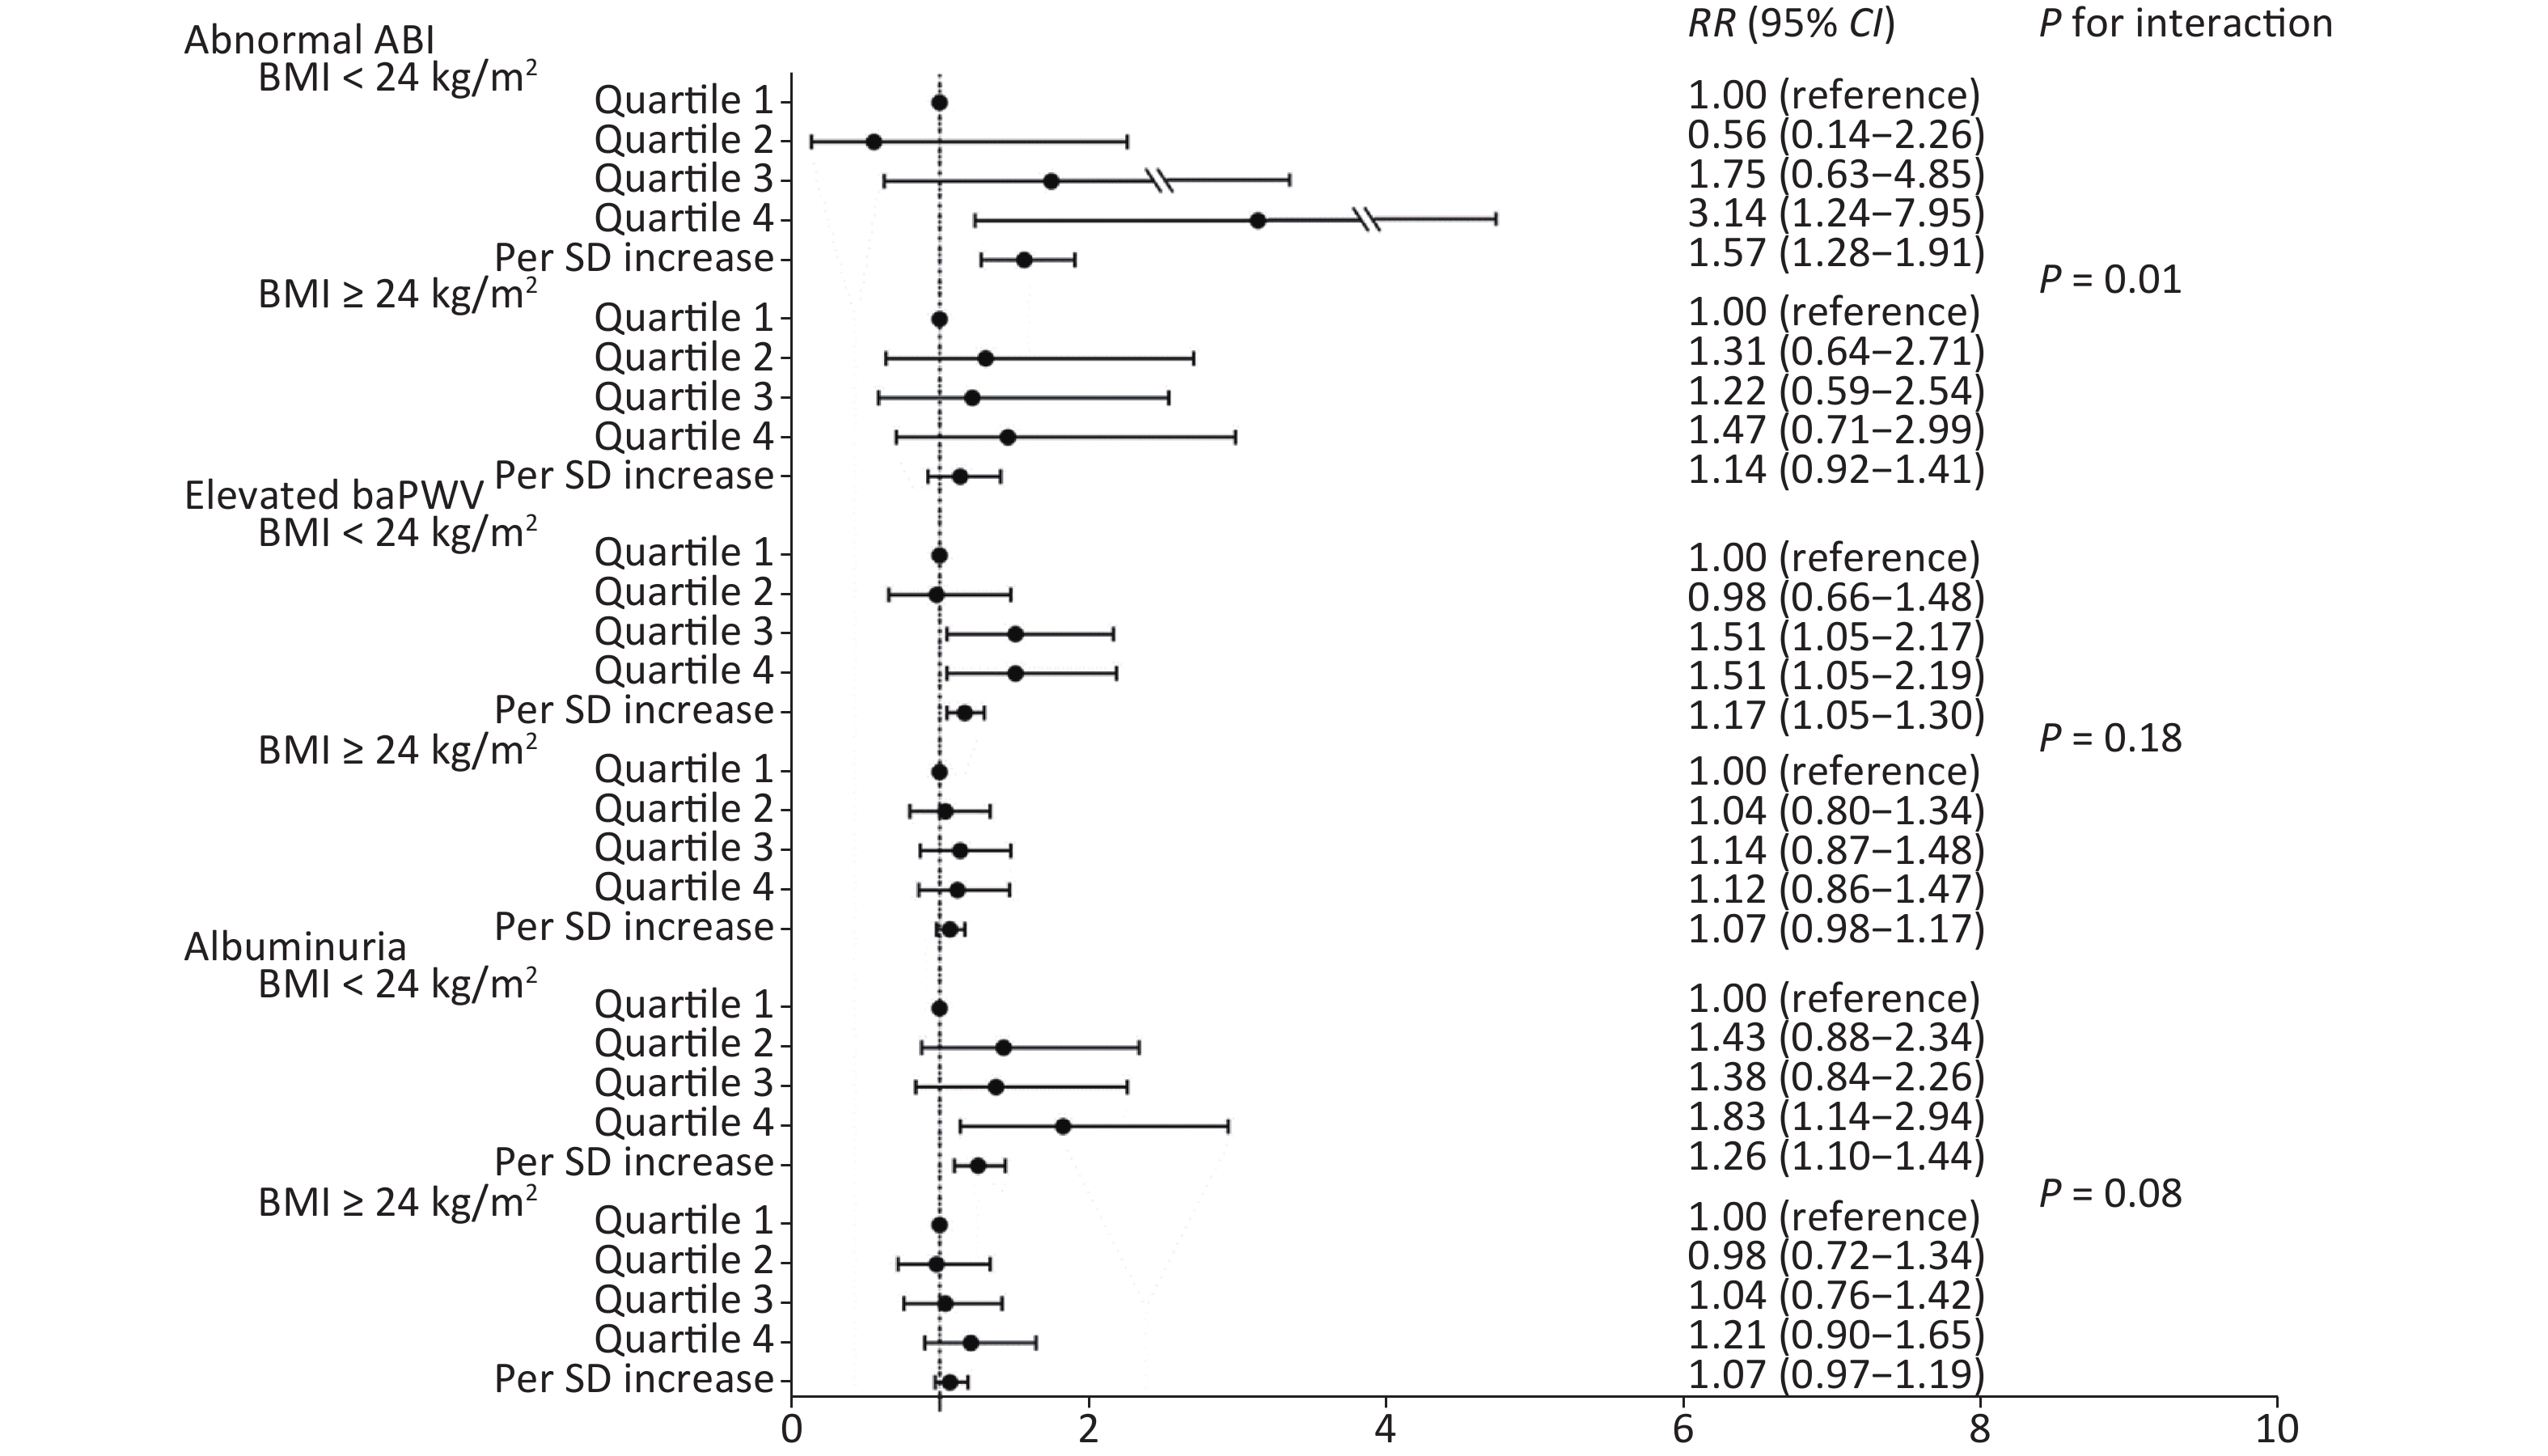
We further conducted a stratified analysis to see the association between NLR and new-onset abnormal ABI, elevated baPWV, and albuminuria according to BMI categories (BMI < 24 kg/m2 or BMI ≥ 24 kg/m2). Figure 2 shows the incidence of each outcome according to quartiles of NLR by BMI category. In particular, in participants with normal weight, the incidence of abnormal ABI, elevated baPWV, and albuminuria increased gradually with NLR level, compared to that in those with a BMI ≥ 24 kg/m2. After fully adjusting covariates and using the Poisson regression model, we found that the association between NLR and subclinical vascular abnormalities was much stronger in participants with normal weight. The increased risk of new-onset abnormal ABI, elevated baPWV, and albuminuria per SD increment of NLR was 57% (RR 1.57; 95% CI 1.28–1.91), 17% (RR 1.17; 95% CI 1.05–1.30), and 26% (RR 1.26; 95% CI 1.10–1.44), respectively (Figure 3). However, no significant association was found among participants with BMI ≥ 24 kg/m2. Furthermore, we found an interaction between the NLR and BMI on the risk of new-onset abnormal ABI (P for interaction = 0.01) and a borderline significant interaction on new-onset albuminuria (P for interaction = 0.08).
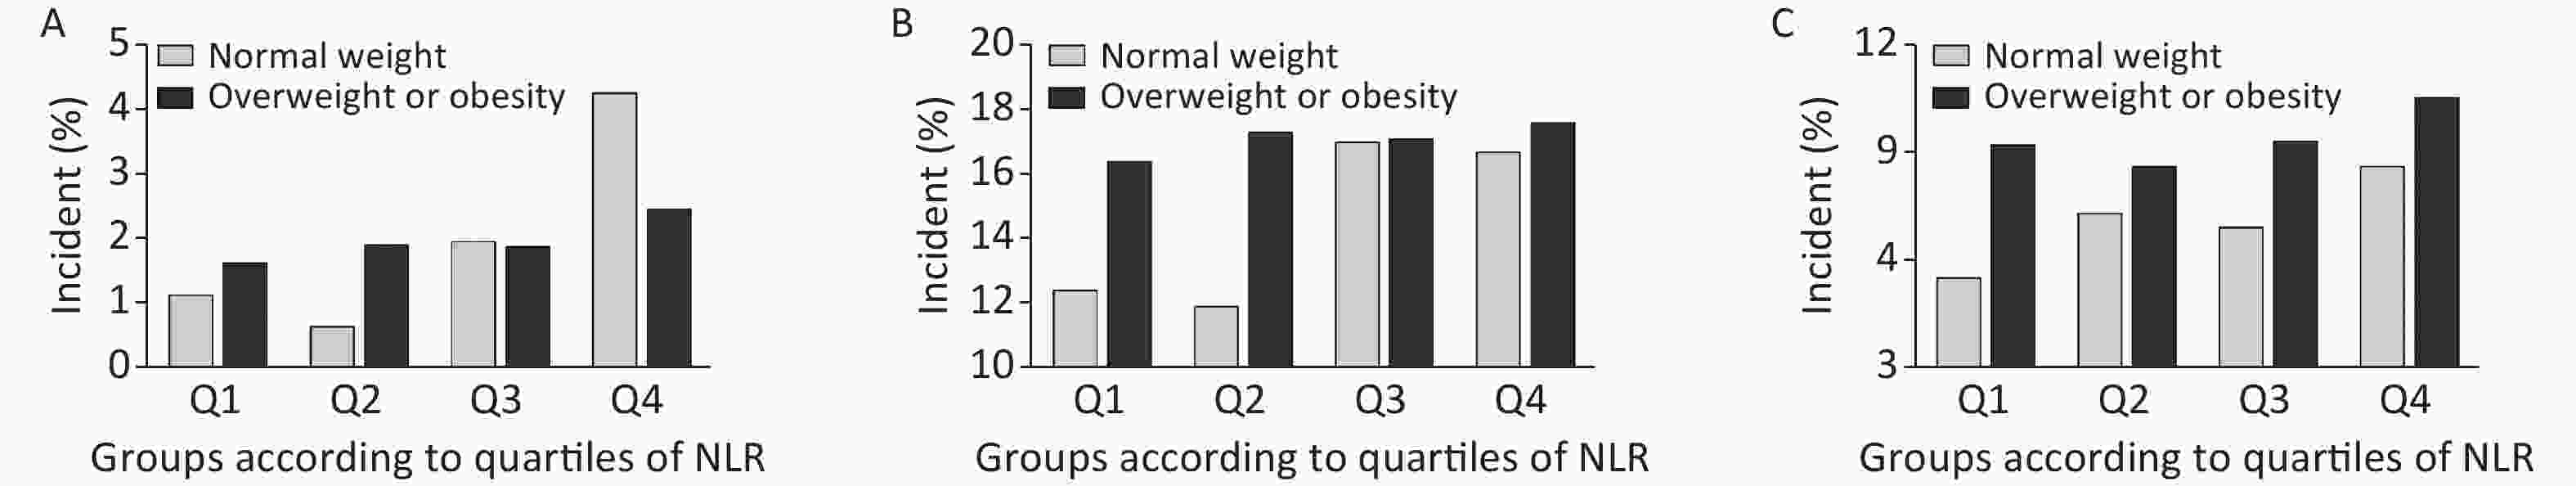
Figure 2. Incidence of each outcome by NLR/BMI category. Incidence of (A) abnormal ABI, (B) elevated baPWV, and (C) albuminuria. NLR, neutrophil-to-lymphocyte ratio; ABI, ankle-brachial index; baPWV, brachial-ankle pulse wave velocity.
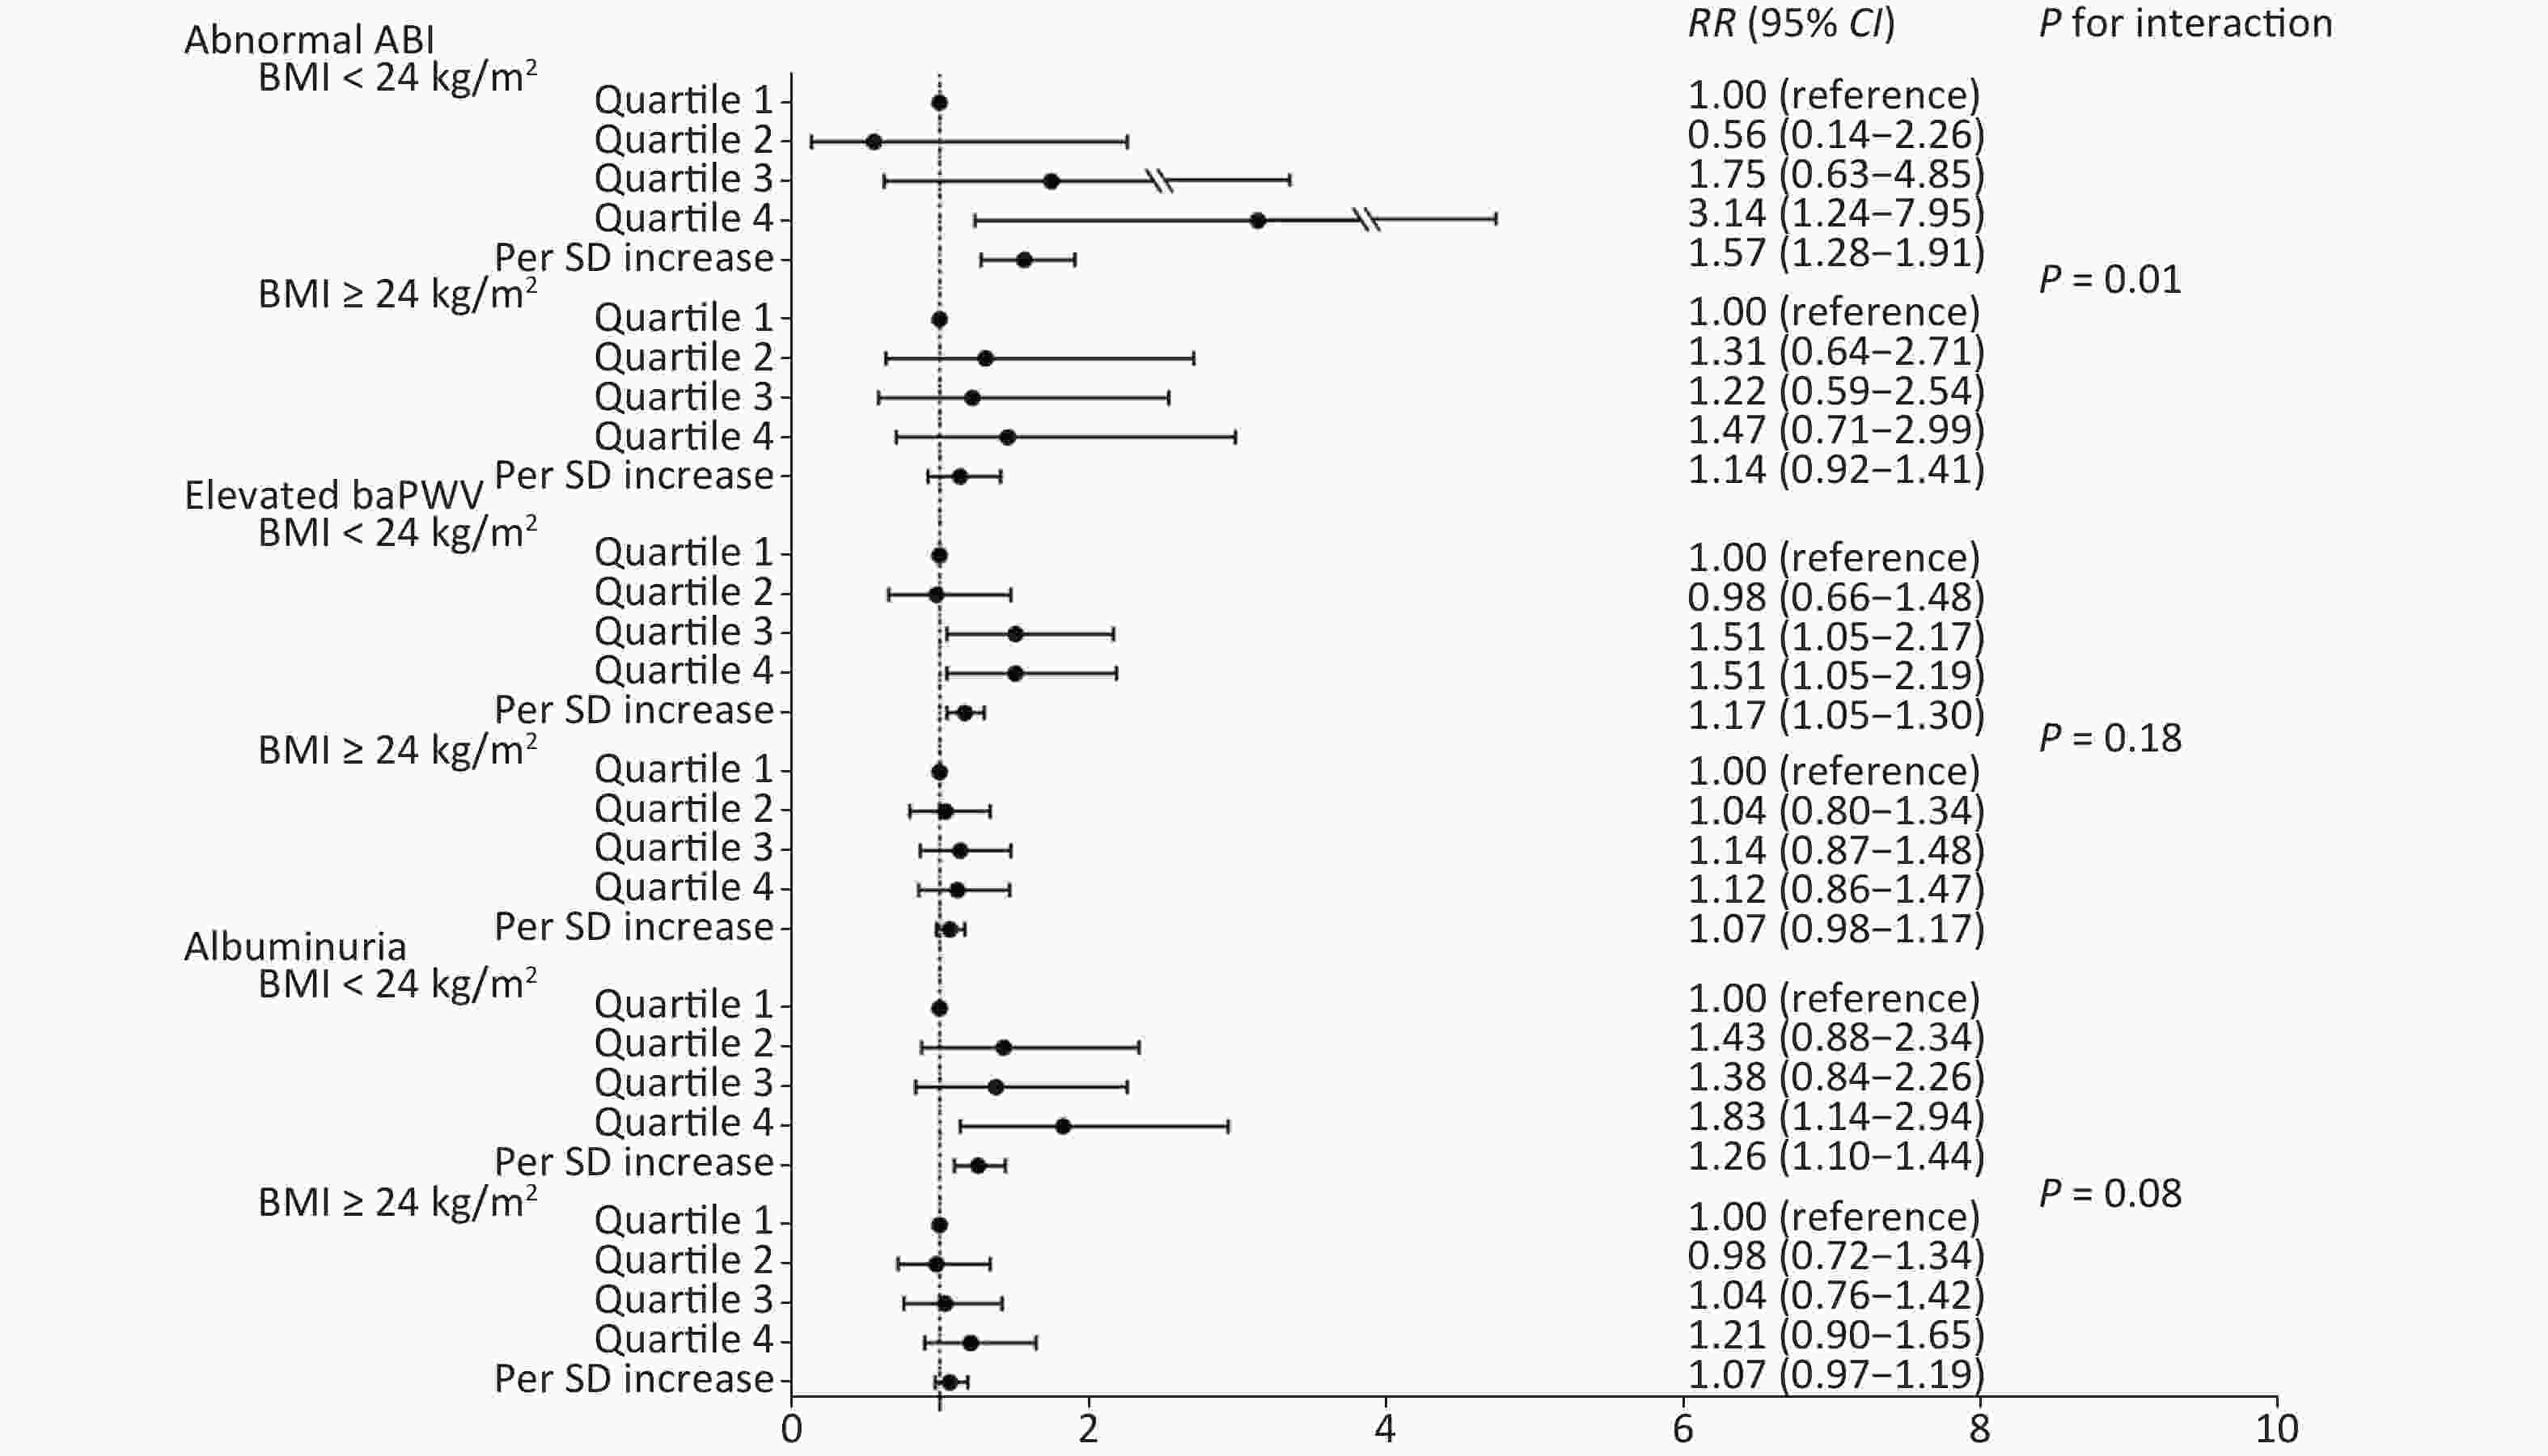
Figure 3. Association of NLR quartiles with subclinical macrovascular and microvascular diseases by BMI categories. NLR, neutrophil-to-lymphocyte ratio; BMI, body mass index; ABI, ankle-brachial index; baPWV, brachial-ankle pulse wave velocity; SD, standard deviation; RR, risk ratio; CI, confidence interval.
In addition, we explored the association between NLR and new-onset abnormal ABI, elevated baPWV, and albuminuria on the basis of the waist circumference categories (Supplementary Table S1 available in www.besjournal.com). We also found a statistically significant relationship between NLR and subclinical atherosclerosis abnormalities in participants with normal waist circumference. A higher NLR quartile was associated with a higher incidence of abnormal ABI (RR 2.31; 95% CI 1.10–3.00) and albuminuria (RR 1.70; 95% CI 1.13–3.11). However, we did not find the modified effect of waist circumference on such relationships.
NLR Abnormal ABI Elevated baPWV Albuminuria Model 1 Model 2 Model 1 Model 2 Model 1 Model 2 WC < 90 cm (men)/80 cm (women) (n = 3,428) Quartile 1 1.00 (ref.) 1.00 (ref.) 1.00 (ref.) 1.00 (ref.) 1.00 (ref.) 1.00 (ref.) Quartile 2 0.74 (0.28−1.32) 0.75 (0.29−1.33) 0.91 (0.65−1.91) 0.89 (0.63−1.88) 1.42 (0.93−2.53) 1.45 (0.94−2.57) Quartile 3 0.90 (0.37−1.45) 0.91 (0.38−1.46) 1.39 (1.04−2.82) 1.32 (0.97−2.65) 1.28 (0.84−2.31) 1.24 (0.81−2.24) Quartile 4 2.27 (1.09−2.98) 2.31 (1.10−3.00) 1.29 (0.95−2.59) 1.21 (0.89−2.44) 1.72 (1.16−3.17) 1.70 (1.13−3.11) Per SD increase 1.35 (1.14−3.13) 1.36 (1.15−3.15) 1.13 (1.03−2.81) 1.11 (1.01−2.75) 1.19 (1.07−2.91) 1.19 (1.07−2.91) WC ≥ 90 cm (men)/80 cm (women) (n = 3,002) Quartile 1 1.00 (ref.) 1.00 (ref.) 1.00 (ref.) 1.00 (ref.) 1.00 (ref.) 1.00 (ref.) Quartile 2 1.43 (0.61−1.84) 1.46 (0.62−1.87) 1.17 (0.88−2.41) 1.13 (0.85−2.33) 0.93 (0.67−1.95) 0.92 (0.66−1.93) Quartile 3 2.03 (0.90−2.46) 2.01 (0.89−2.43) 1.12 (0.83−2.29) 1.15 (0.84−2.33) 1.09 (0.78−2.19) 1.09 (0.78−2.18) Quartile 4 1.57 (0.66−1.93) 1.58 (0.66−1.93) 1.27 (0.94−2.55) 1.27 (0.94−2.55) 1.20 (0.86−2.36) 1.17 (0.84−2.32) Per SD increase 1.24 (1.01−2.74) 1.24 (1.00−2.71) 1.08 (0.98−2.66) 1.10 (0.99−2.70) 1.08 (0.96−2.62) 1.08 (0.96−2.60) P for interactiona 0.52 0.68 0.27 Note. Model 1: Adjusted for age, sex, education attainment, physical activity, smoking status and drinking status. Model 2: Further adjusted for metabolic risk factors (HbA1c, SBP, DBP, LDL-c, HDL-c, and triglycerides) based on model 1. aThe interactions of WC category with NLR (per SD increase) on risks of diseases was examined by including respective multiplicative interaction term in the final model 2. NLR, neutrophil-to lymphocyte ratio; ABI, ankle brachial index; baPWV, brachial-ankle pulse wave velocity; SD, standard deviation BMI, body mass index; SBP, systolic blood pressure; DBP, diastolic blood pressure; HbA1c, glycated hemoglobin; LDL-c, low density lipoprotein cholesterol; HDL-c, high density lipoprotein cholesterol; WC, waist circumference. Table S1. Association of NLR quartiles with subclinical macrovascular and microvascular diseases by waist circumference categories
-
In this prospective study, we found that NLR was positively associated with subclinical macro-/microvascular disease, and these associations were not dependent on traditional cardiovascular risk factors. Our data further detected a stronger association between NLR and macro-/microvascular abnormality among adults with normal weight, with significant interactions between NLR and BMI.
The resting ABI is used to diagnose peripheral arterial disease (PAD), which is a manifestation of generalized atherosclerosis, known to affect the quality of life and is associated with a higher risk of cardiovascular morbidity and mortality[29,30]. Previous studies have investigated the relationship between NLR and PAD in specific groups. A cross-sectional study conducted in Chinese patients found that NLR was positively correlated with lower extremity arterial disease in type 2 diabetes[31]. Demirdal et al. also found that NLR could predict PAD in patients with diabetic foot infections [32]. A retrospective study on 3,687 patients who underwent elective endovascular or open procedures for PAD selected from the Cerner Health Facts database showed that the NLR positively correlated with disease severity, and an elevated NLR value during the perioperative period was associated with death[33]. The current study came to the same conclusion in a general population and further observed that a high NLR was associated with an abnormal ABI in a dose-responsive manner. NLR has also been reported to be associated with arterial stiffness in some retrospective studies[18, 34, 35]. BaPWV has been widely used to noninvasive assess systemic arterial stiffness[36]. Early detection of abnormal levels of NLR may help to detect increased arterial stiffness in patients with coronary heart disease, diabetes, and polycystic kidney disease[37-39]. Our findings strengthen the hypothesis in a large-scale prospective study and found a significant relationship between high NLR and elevated baPWV.
So far, very few studies have focused on the associations between NLR and albuminuria. A pilot cross-sectional study of 112 patients found a positive correlation between albuminuria and NLR levels in type 2 diabetic patients[40]. Another cross-sectional study of 386 diabetic patients suggested that NLR was negatively related to the eGFR but positively related to urinary albumin excretion (UAE)[19]. Our findings were in line with these in that we showed a high degree of correlation between NLR and albuminuria, and we provided evidence on the associations between NLR and new-onset albuminuria in the general population.
Importantly, we found a stronger association between NLR and macro-/microvascular abnormality among adults with normal weight rather than those overweight or obese. Obesity is characterized by chronic low-grade inflammation, and adipose tissue inflammation is linked with obesity-related metabolic complications[41]. In recent years, a lot of studies focused on the association between different obesity phenotypes with CVDs and also have demonstrated that an abnormal metabolic status, and not obesity itself, might cause CVDs[42-45]. The metabolically unhealthy non-obesity population (MUNO) might be more likely to develop CVD than the metabolically healthy non-obesity population (MHNO). Our finding indicated that the NLR, an inflammatory biomarker, had a stronger association with macro-/microvascular abnormality in those with normal weight, suggesting the need to evaluate inflammatory biomarkers for better risk stratification of atherosclerotic vascular disease among the non-obese.
The strength of this study is the comprehensive analysis of the association between NLR and macro-/microvascular disease in a well-defined community with a fair-sized sample and desirable population homogeneity. The present study also has several limitations. First, the 4.3-year follow-up may not be long enough to fully capture the onset of incident macro-/microvascular events. A longer-term prospective cohort study is necessary. Second, although we have adjusted for several confounders that could explain the relationship between NLR and macro-/microvascular abnormality, residual factors that were not captured in this study may not have been included in our analysis. Third, laboratory data were only collected at baseline; the changes in NLR during follow-up for incident macro-/microvascular abnormality cannot be estimated.
In conclusion, our study found that NLR showed a positive association with subclinical macro-/microvascular abnormality, and this association was stronger among adults with normal weight, firstly verified in a Chinese population. NLR may be used as a synergistic biomarker to help us identify possible vascular disease earlier in normal-weight adults.
-
We declare that we have no conflict of interest.
-
The investigators are grateful to all participants for their cooperation in the study. Dr. BI Yu Fang was supported by the “Shanghai Outstanding Academic Leader Program”, and Dr. XU Yu was supported by the “Outstanding Young Talent Program” from Shanghai Municipal Government. The funding agencies had no role in the study design and conduct, in the data collection, management, analysis, and interpretation of the data, or in the manuscript preparation, review, or approval.
HTML
Study Population
Data Collection and Measurements
Definitions of Subclinical Macrovascular and Microvascular Diseases
Statistical Analyses
Characteristics of Enrolled Participants
NLR and Risk of New-onset Abnormal ABI, Elevated BaPWV, and Albuminuria
Stratified Analysis for the Association between NLR and New-onset Abnormal ABI, Elevated BaPWV, and Albuminuria
 Supplementary Materials21126.pdf
|

|

 Quick Links
 DownLoad: