

-
Bietti crystalline dystrophy (BCD) is an autosomal recessive disease with a wide range of genotypic and phenotypic variability. However, a particular type of retinitis pigmentosa presents numerous yellowish-white crystalline deposits at the posterior retinal pole, retinal pigment epithelium (RPE) atrophy, and choroidal sclerosis [1, 2, 3, 4]. The radial peripapillary capillary (RPC) vascular plexus is a complex network located in the superficial nerve fiber layers surrounding the optic nerve, which is derived mainly from the retinal arterioles or ganglion cell layer arterioles in the macular region [5]. Thus, the primary function of the RPC is to nourish the retinal nerve fiber layer [6].
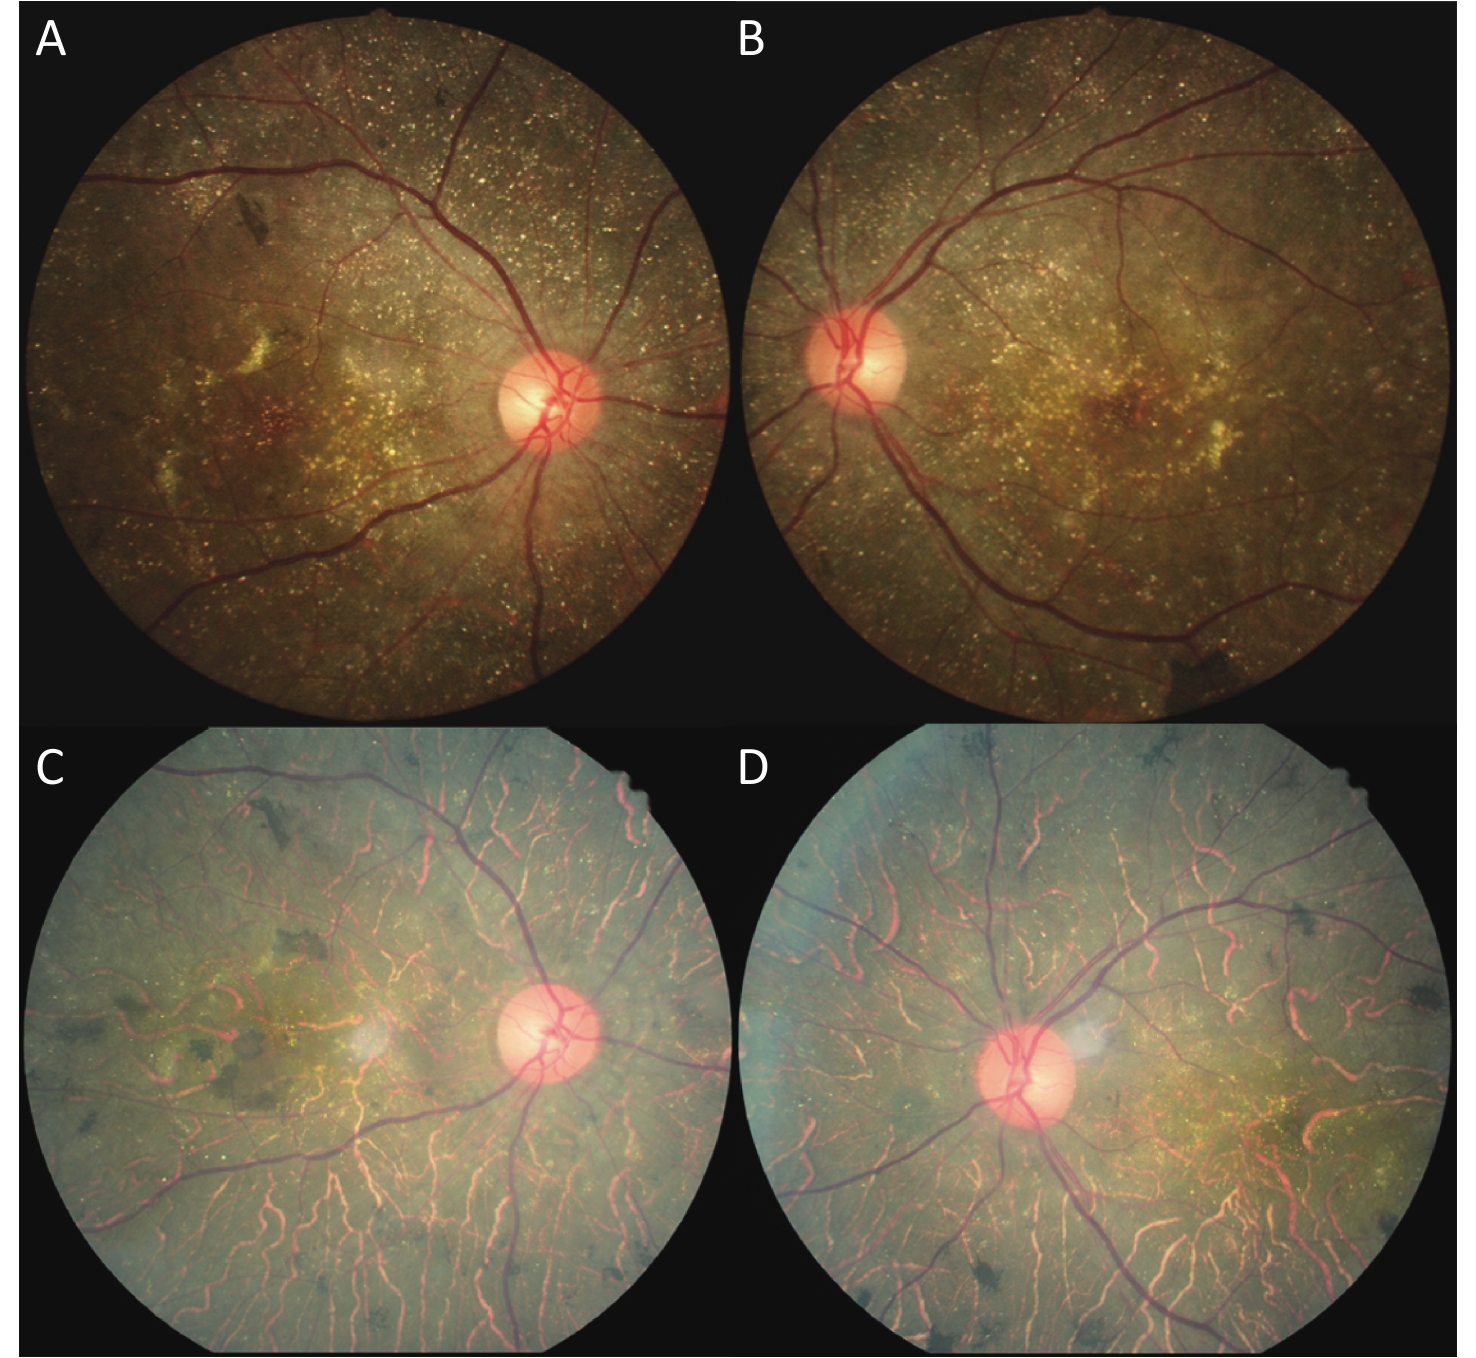
In our clinic, we observed that the optic disk color was pink in advanced patients with BCD, unlike the pale optic disk color of pigmentosa (Figure 1). Some studies have reported that the retinal vessels of patients with BCD are markedly attenuated and sclerosed, but their disks retain a healthy color [7, 8]. Researchers have also reported that the patients with BCD optic nerve head (ONH) and vessels show no significant changes even in the late stage [9-11]. However, to the best of our knowledge, no studies have so far evaluated the RPC network in these patients. Thus, the purpose of this study was to determine the RPC network changes in patients with BCD using optical coherence tomography angiography (OCTA) and to acquire a better understanding of the ONH capillaries.
Figure 1. Color fundus photographs of a patient with BCD, seven years apart. (A, B) Fundus images (both eyes) of the patient showing retinal crystalline deposits at the posterior pole. Pigment clumping was found in the peripheral retina of both eyes. The pink color of both optic disks was normal. The retinal artery was attenuated. (C, D) After seven years, fundus images (both eyes) of the same patient showing fewer crystalline deposits at the posterior pole. More pigment clumping was found in the posterior pole. The color of the optic disk did not significantly change. The retinal artery was more attenuated than before.
-
The implementation of all research methods in this study followed the provisions of the Declaration of Helsinki, the Ethics Committee of Tongren Hospital in Beijing, Capital Medical University, and the Ethics Committee of the Hebei Provincial Eye Hospital. Twenty unrelated and two related (sisters) Chinese patients were recruited between July 2018 and December 2018. The control group consisted of 22 healthy subjects matched for the age, sex, and refraction error and were enrolled in December 2020. Clinical characteristics and OCTA results of these patients were then analyzed. Written informed consent was obtained from each patient before peripheral venous blood was drawn for genomic DNA extraction and CYP4V2 gene mutation screening using direct sequencing.
The exclusion criteria for the patients were the presence of ocular hypertension, glaucoma, and any systemic disease that could potentially affect RPC density. The control groups were healthy subjects matched to the BCD group by age, sex, ethnicity, and refraction error. Specifically, sex was perfectly matched, age was within ± 5 years, ethnicity was Chinese, and refraction error was matched with a spherical equivalent within ± 1.00 diopters.
-
All patients and healthy subjects had undergone complete ophthalmologic examinations, including best-corrected visual acuity (BCVA) measurements, slit-lamp microscopy, Goldmann applanation tonometry, dilated fundus examinations, and fundus photography (Kowa, Nonmyd 7, Kowa, Japan). The BCVA measurements were then converted to the logarithm of the minimum angle of resolution (logMAR). All OCTA images were obtained by the same technician using a spectral-domain optical coherence tomography system with the AngioVue OCTA software (Avanti RTVue XR100-2, Optovue Inc, Fremont, CA). OCTA provides the scanning area vascular information on retinal layers as an en face angiogram, a vessel density map, and a vessel density percentage, all automatically performed, obtaining 4.5 mm × 4.5 mm, optical disk images of each patient. Image quality scores ≥ 5 were used to obtain the data from the study, while images with poor quality (signal strength index < 5), segmentation errors, or any residual motion artifacts were excluded.
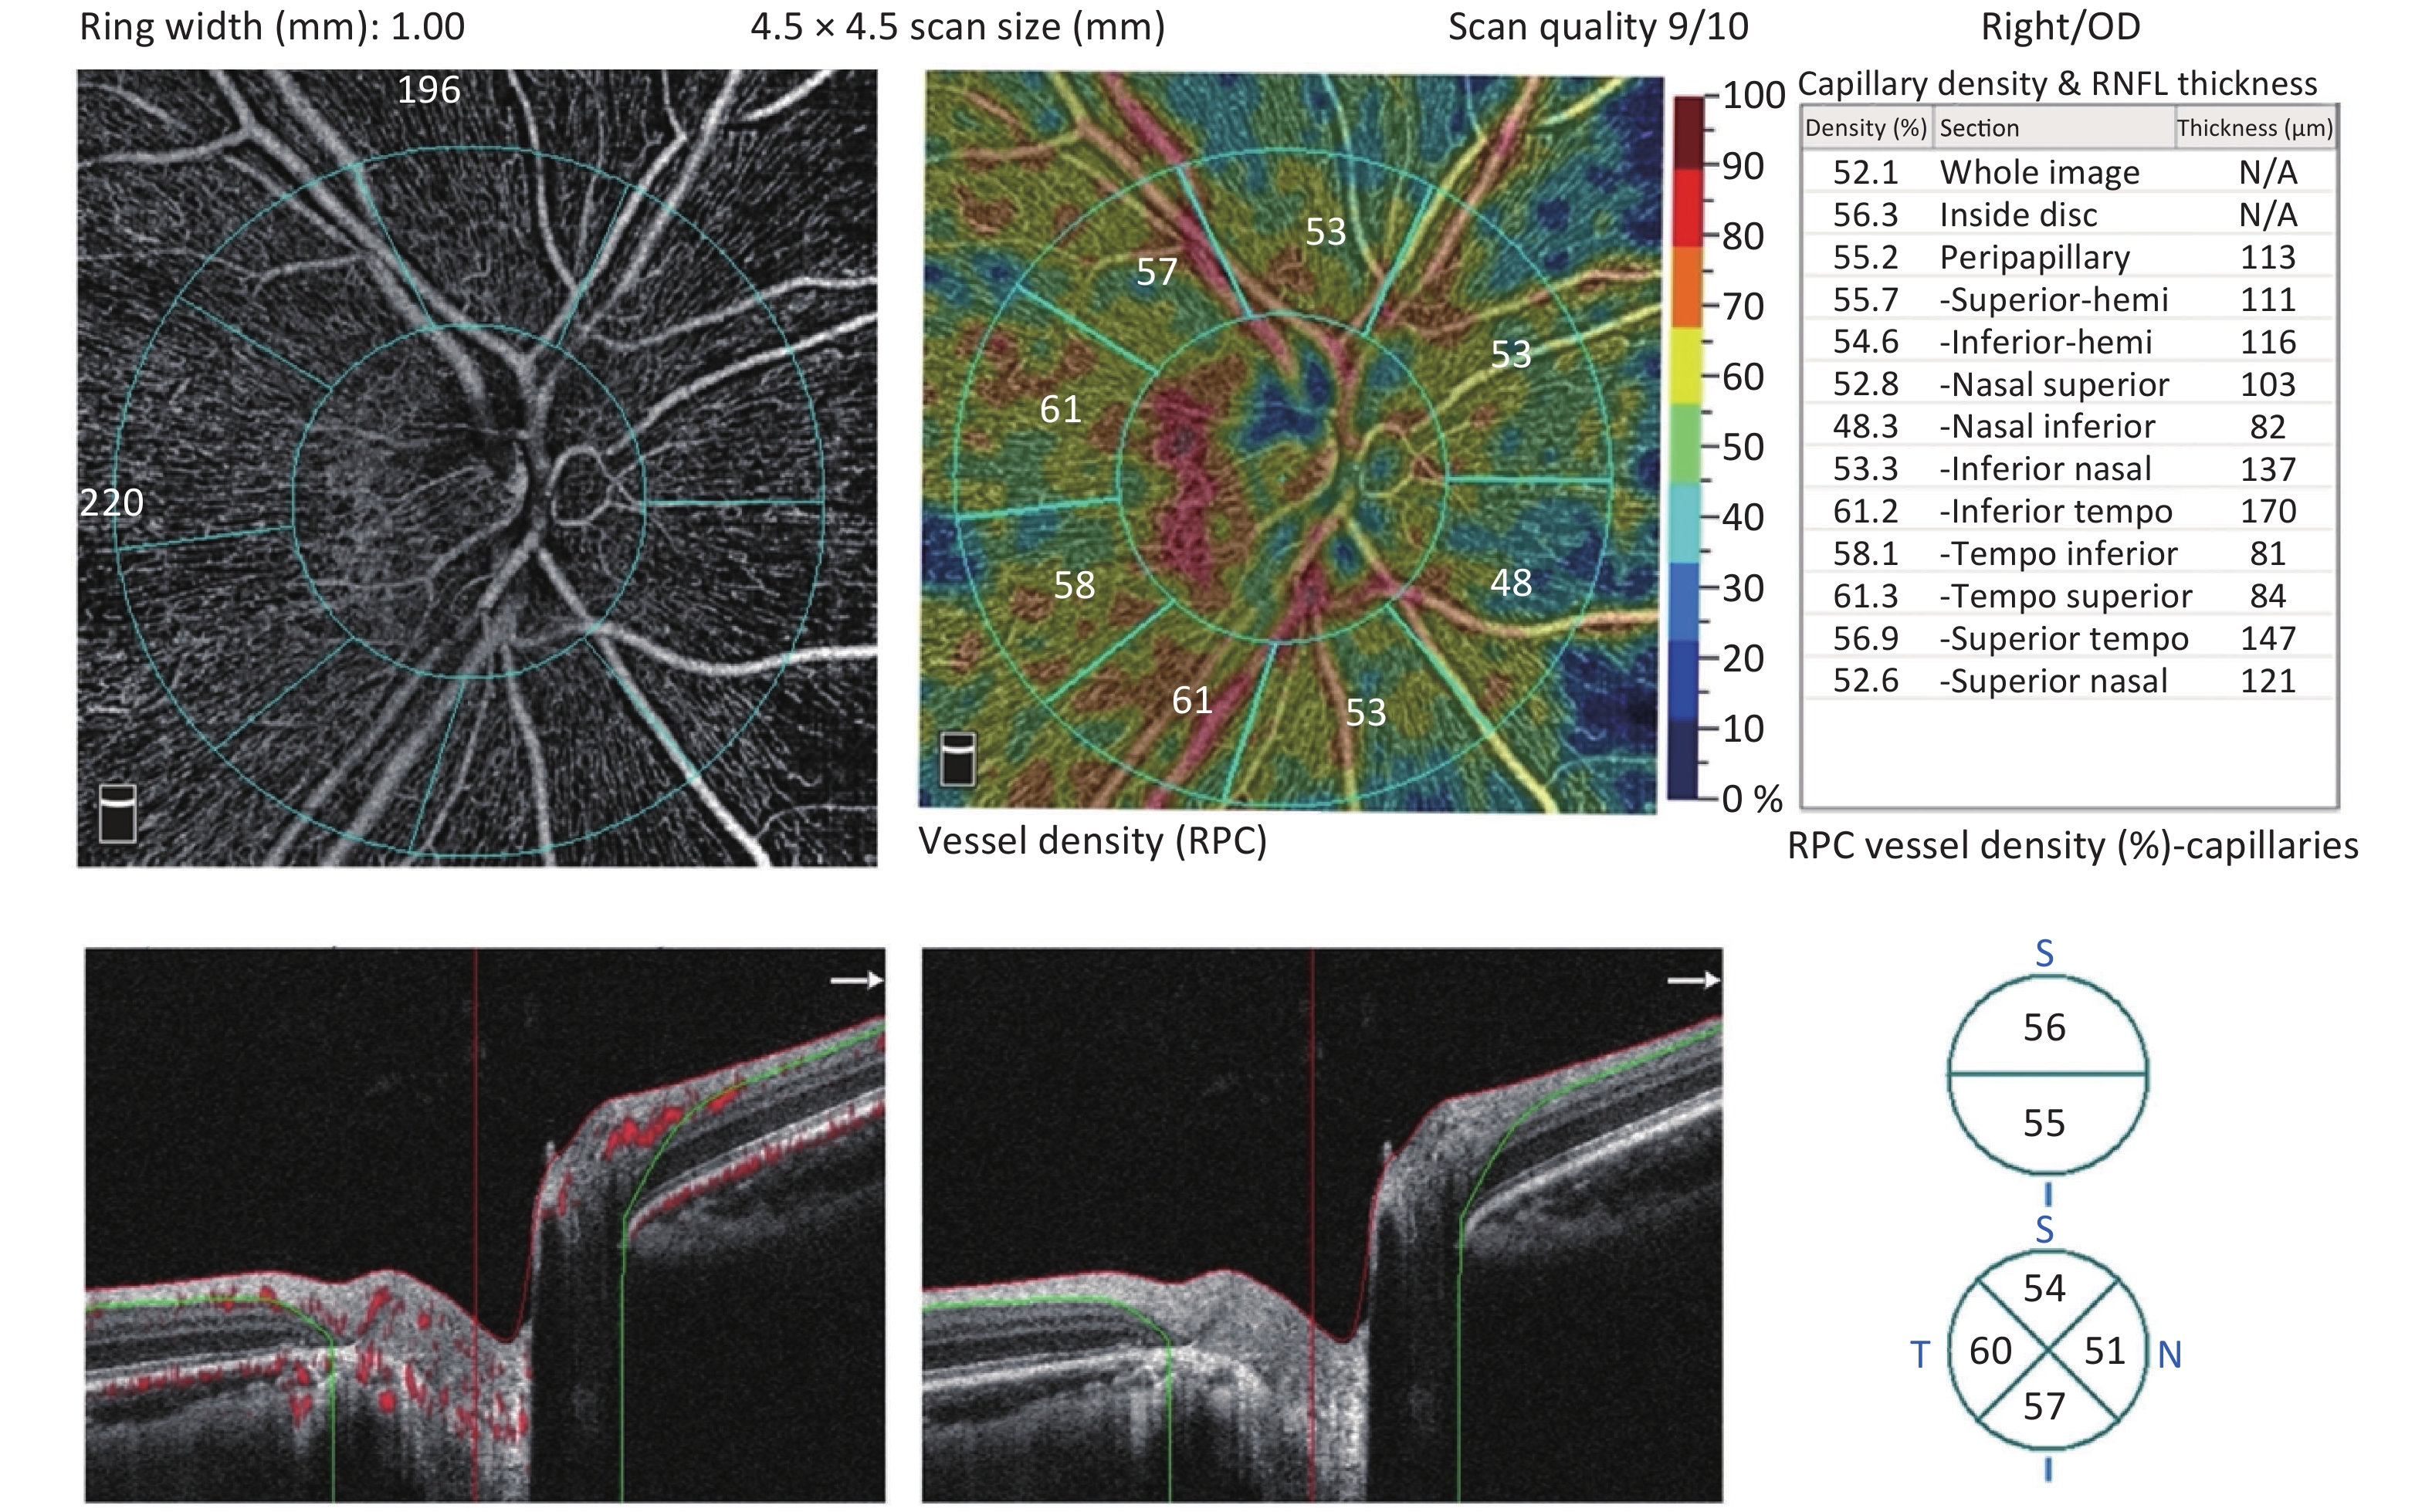
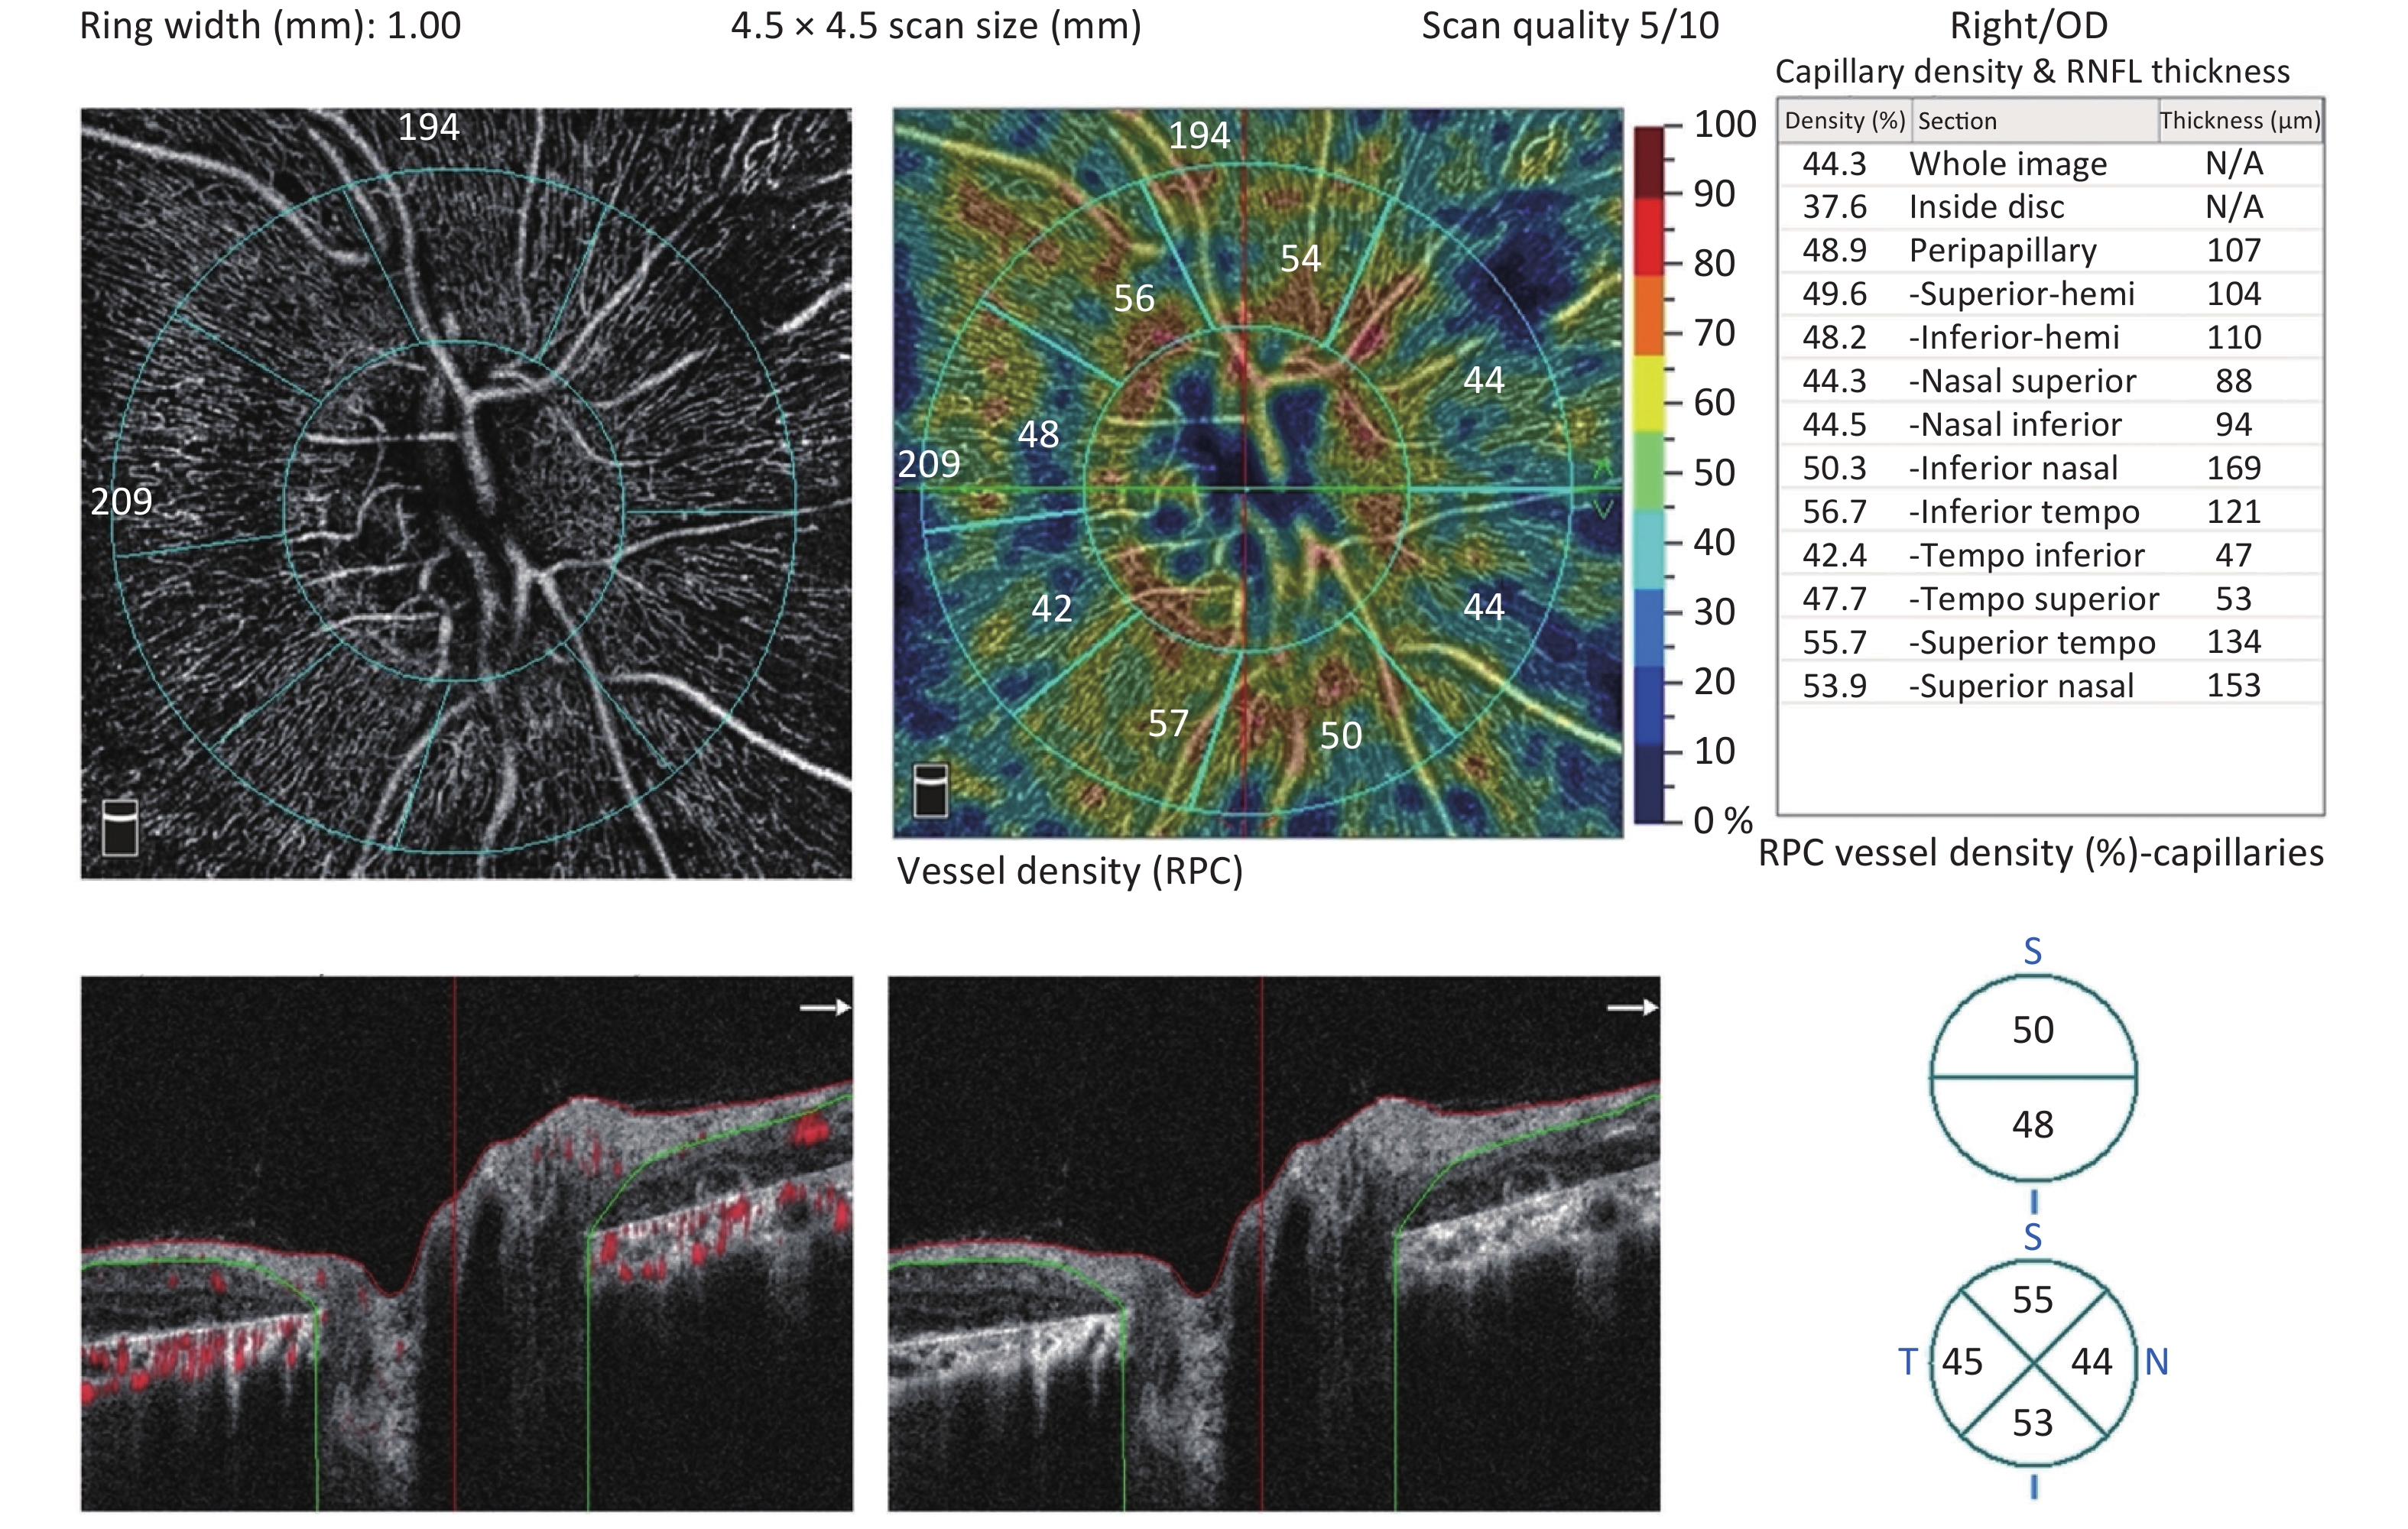
The optic disk status for the RPC network was collected as the whole image, inside disk, peripapillary, superior-hemi, inferior-hemi, superior quadrant (S), nasal quadrant (N), inferior quadrant (I), and temporal quadrant (T) capillary densities. The peripapillary region was divided into eight sectors: the nasal superior (NS), nasal inferior (NI), inferior nasal (IN), inferior tempo (IT), tempo inferior (TI), tempo superior (TS), superior tempo (ST), and superior nasal (SN) sectors. All RPC density (%) calculations were performed automatically (Figures 2 and 3), and values between the BCD and control groups were compared.
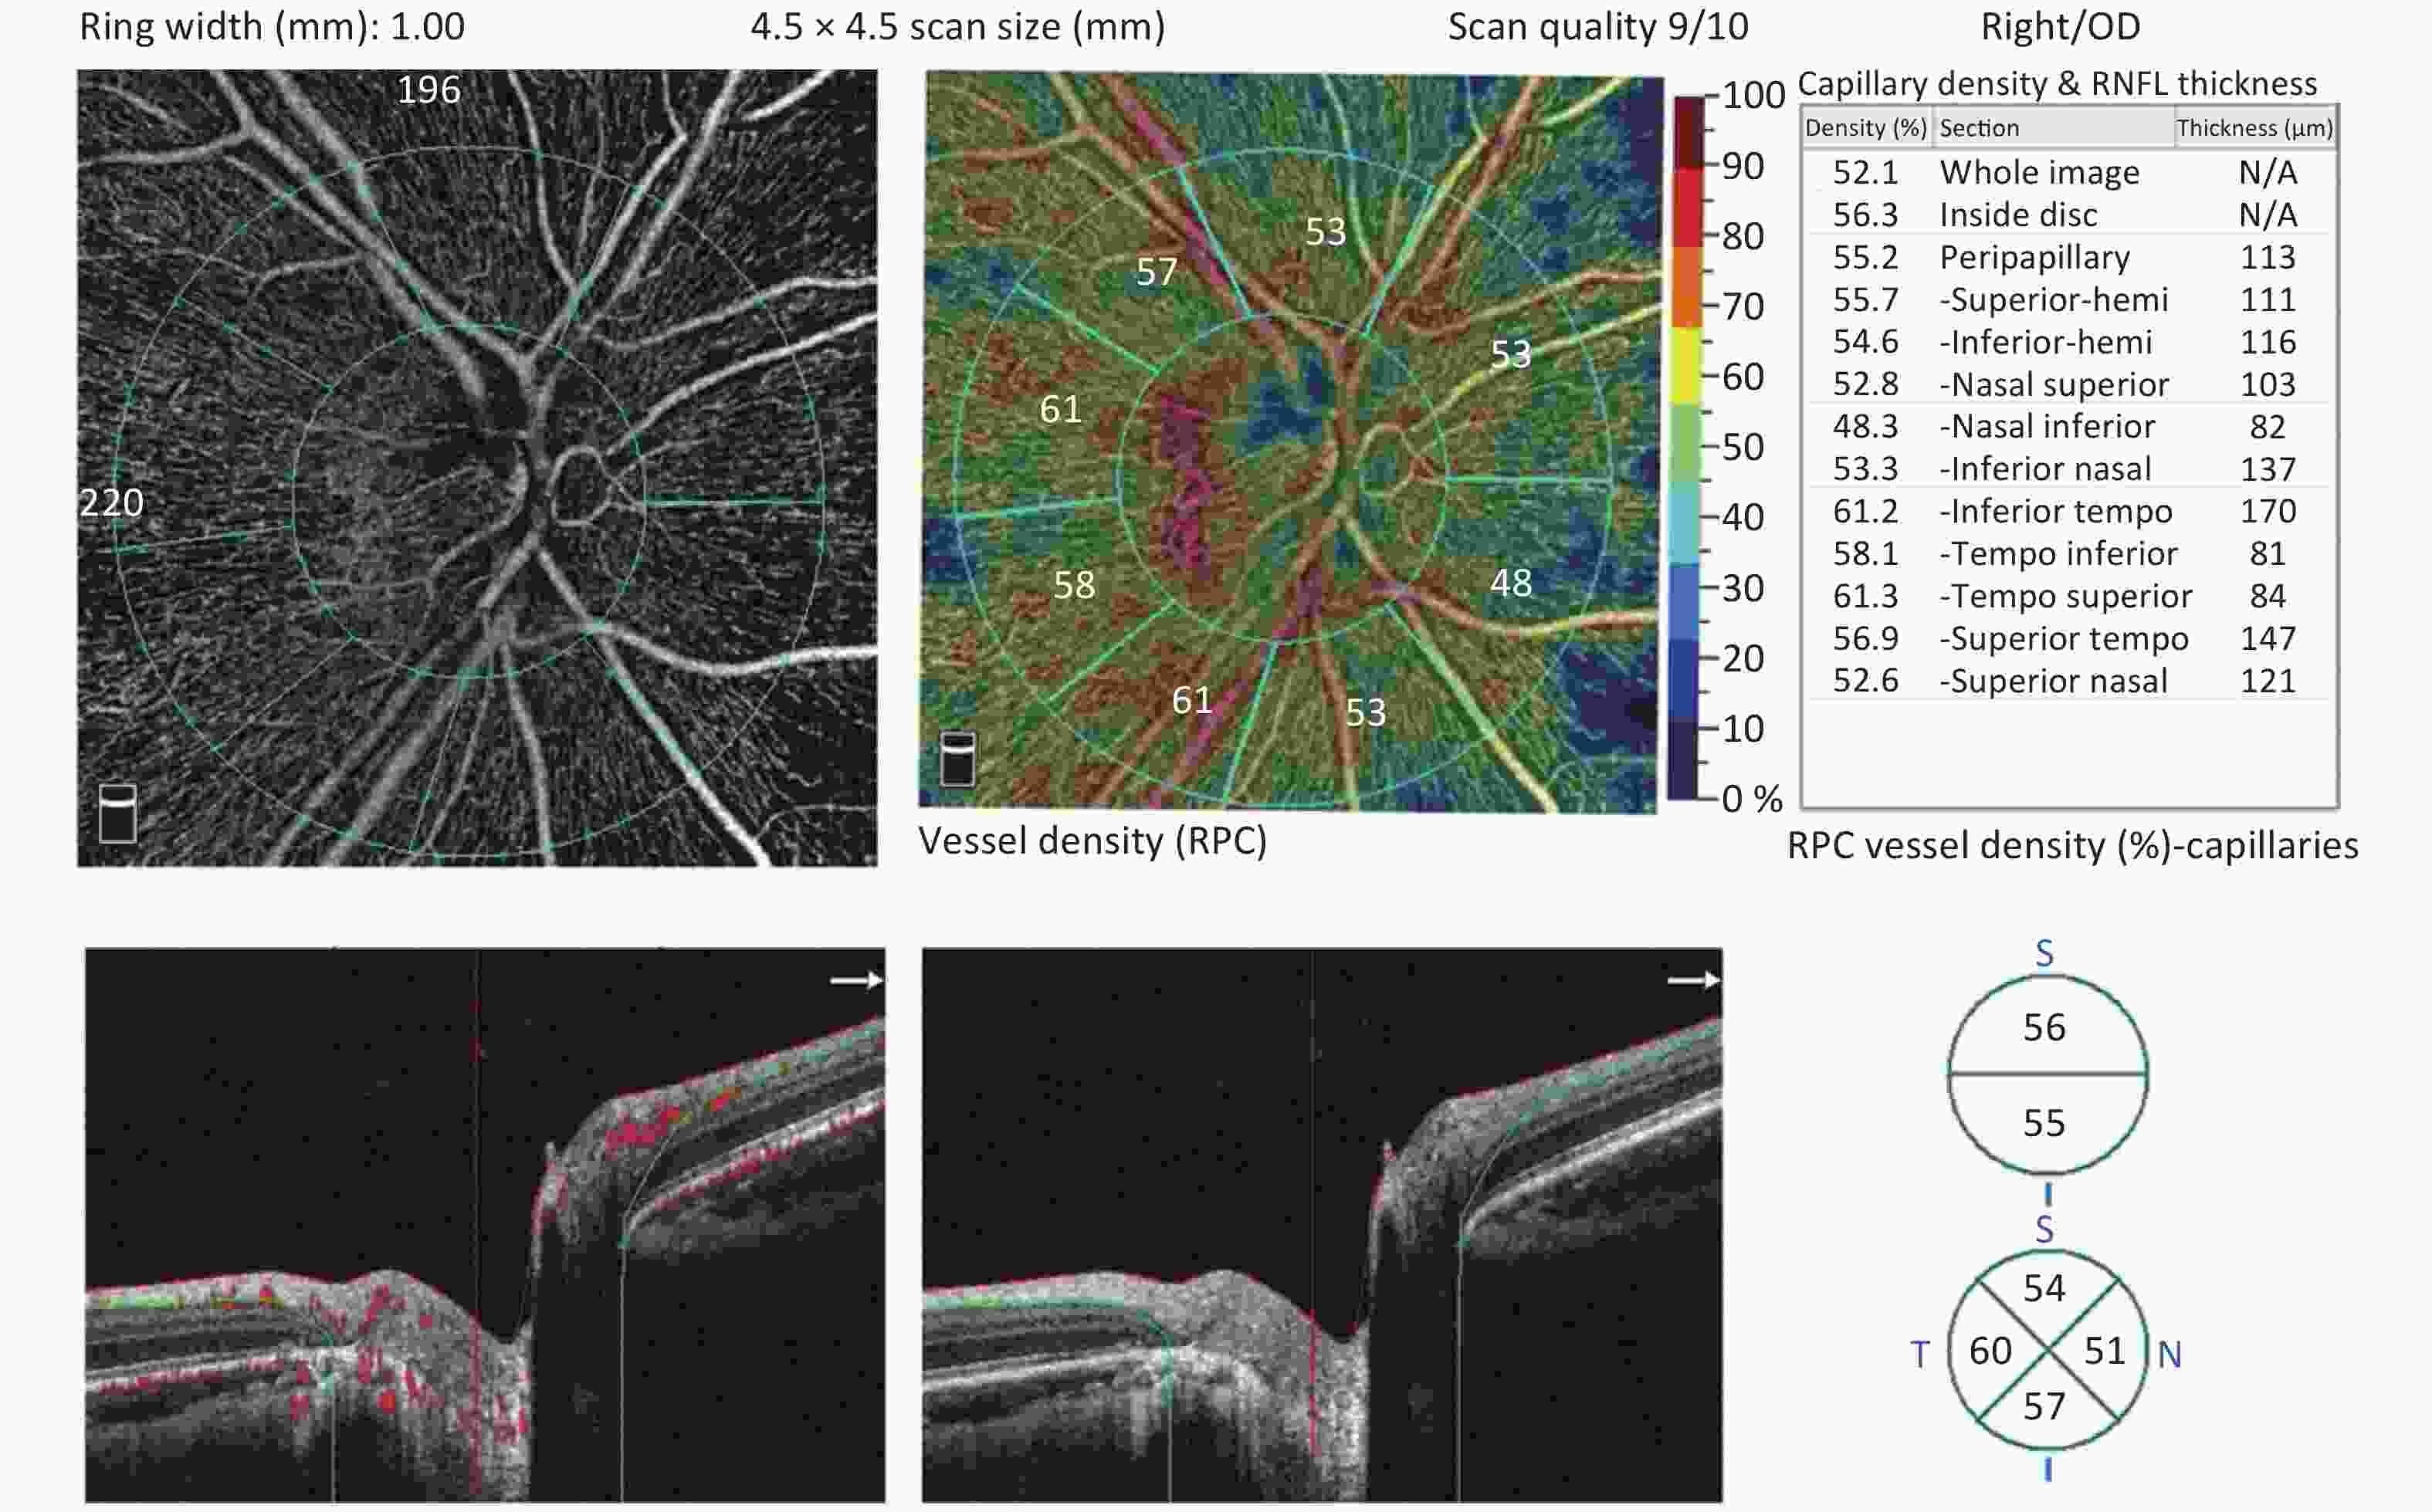
Figure 2. The radial peripapillary capillary (RPC) plexus was assessed using a 4.5 × 4.5 optic nerve head (ONH) angiography scan acquisition protocol. RPC plexus of a normal eye
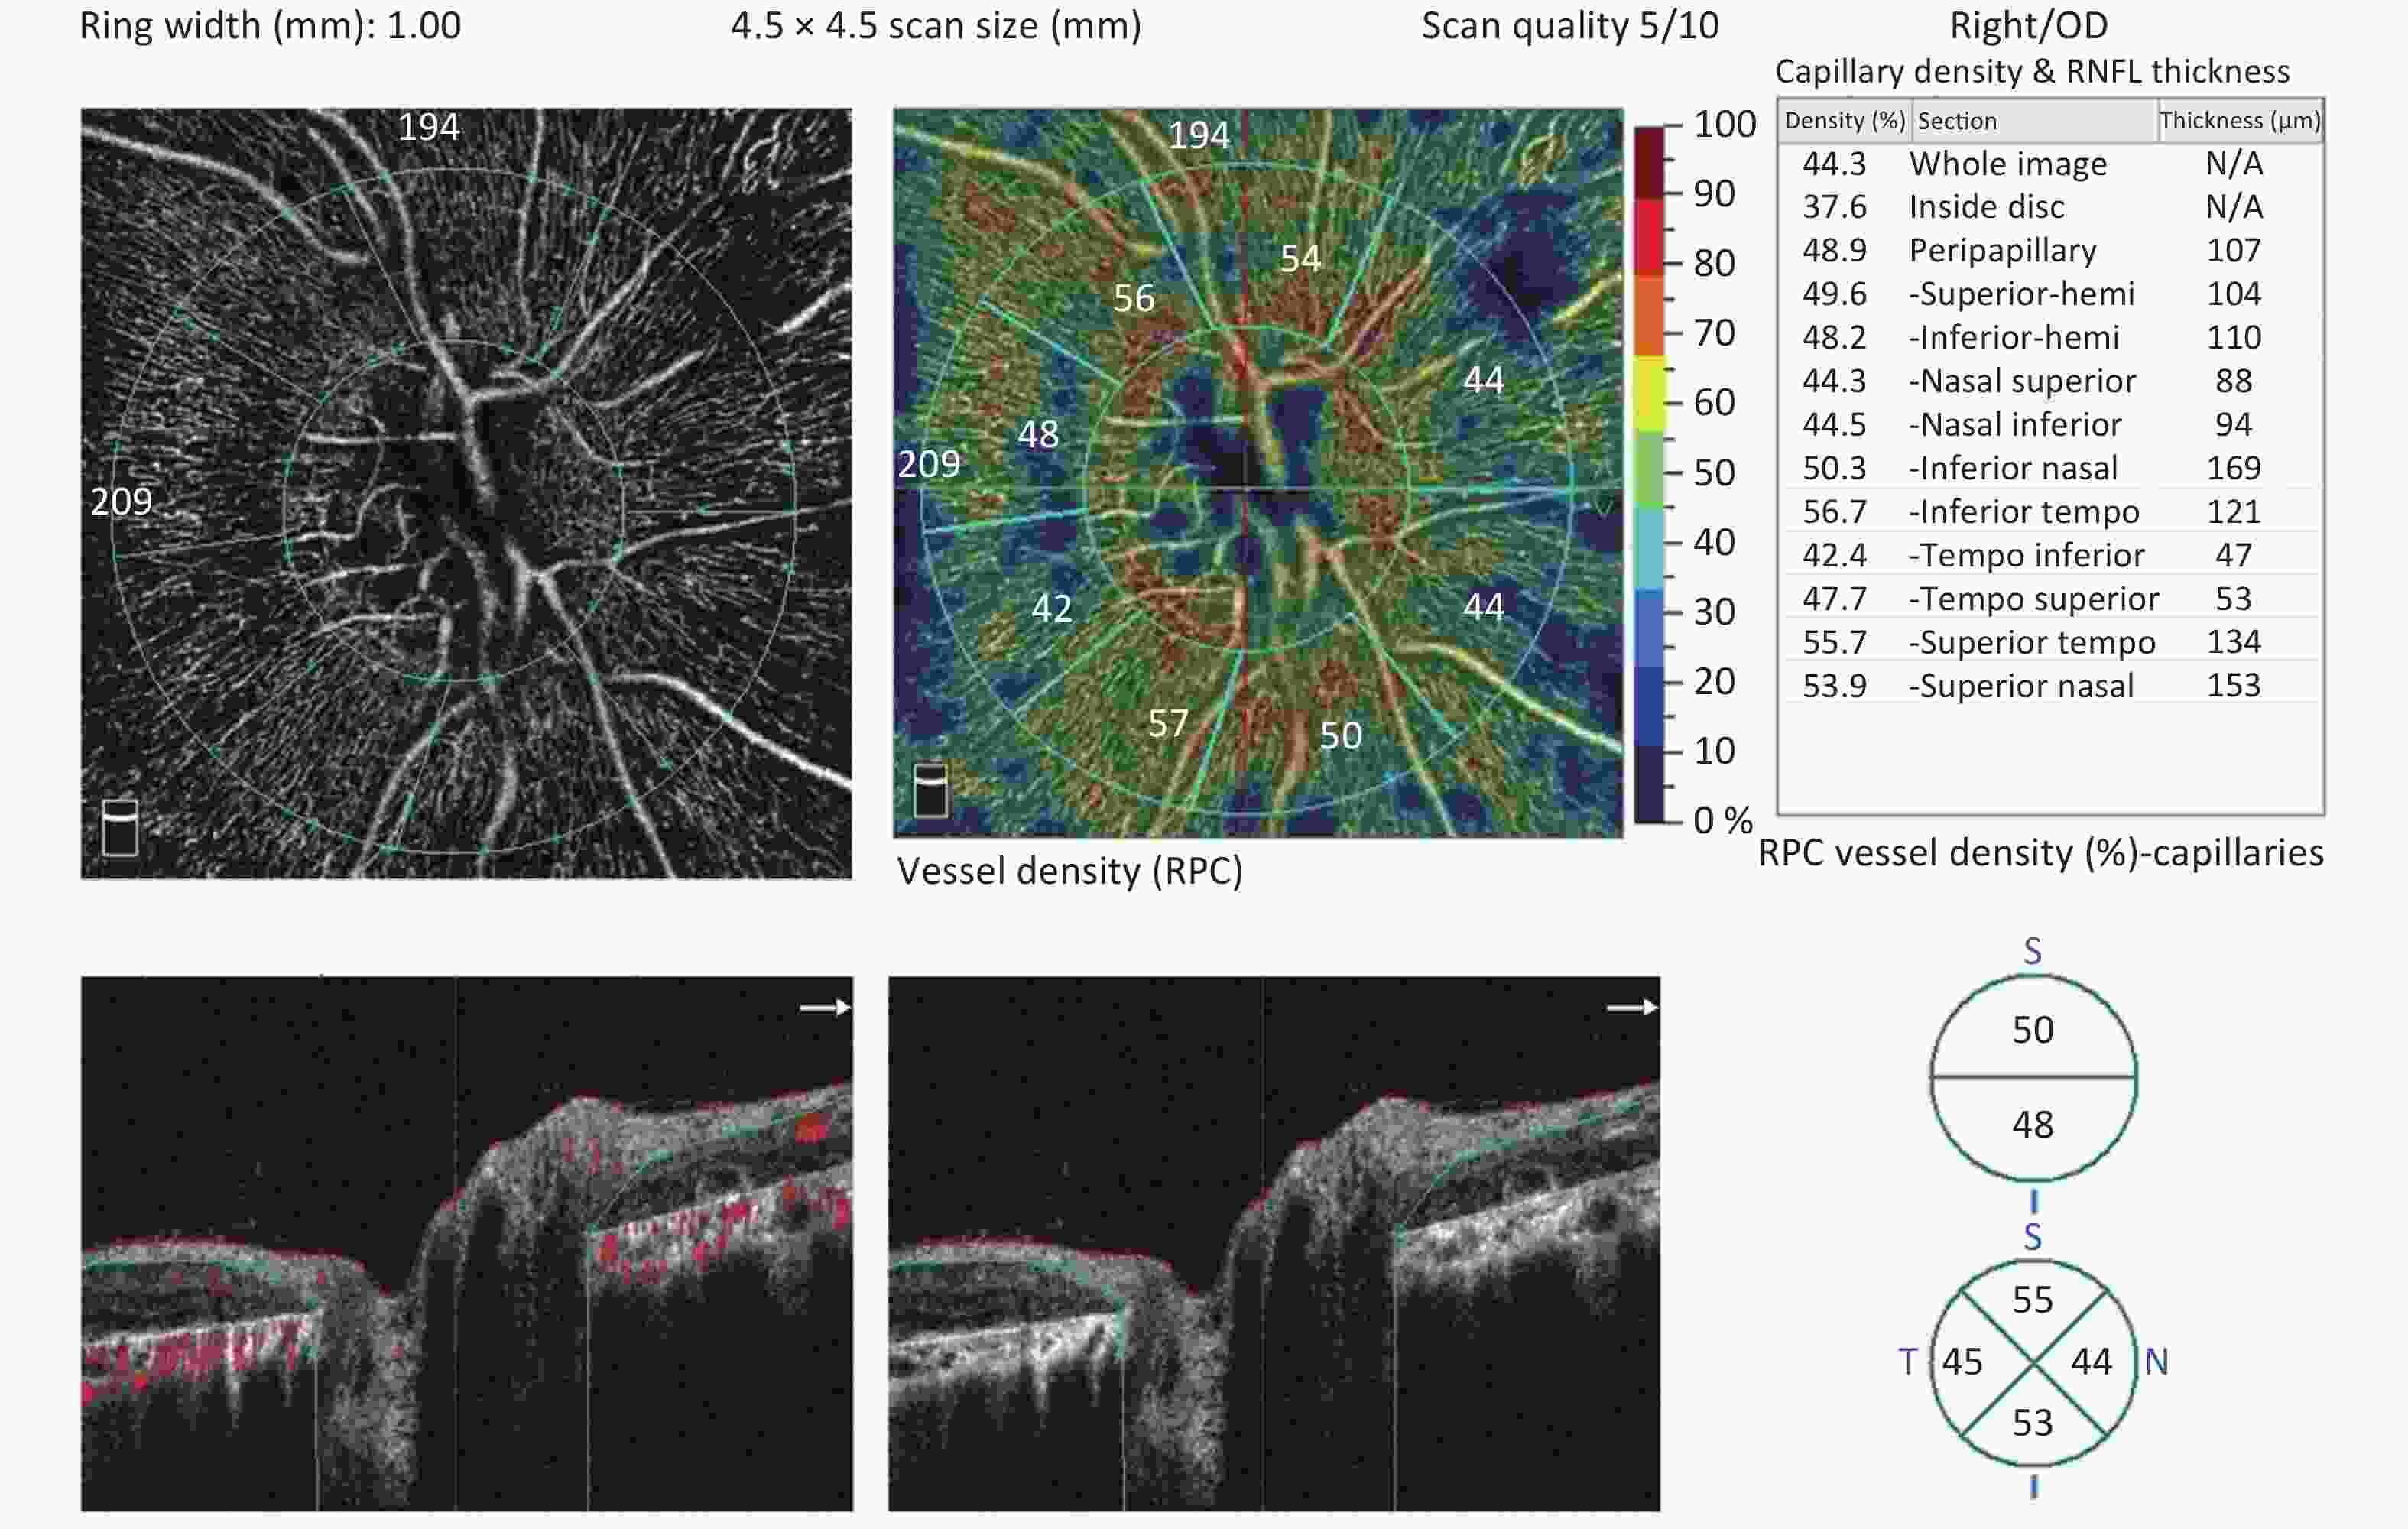
Figure 3. The radial peripapillary capillary (RPC) plexus of a Bietti crystalline dystrophy (BCD) patient in Stage 2. There is a significant decrease in RPC density in the eye with BCD compared with the normal eye.
Fundus severity of patients with BCD was graded following the system proposed by Yuzawa et al.[7] (for convenience, we refer to this as the Yuzawa staging). Stage 1 (none of our patients): RPE atrophy with white crystalline deposits in the macular area. Stage 2 (13 eyes of 7 patients): RPE atrophy extended beyond the posterior pole, and choriocapillaris atrophy appeared markedly at the posterior pole. Stage 3 (24 eyes of 15 patients): RPE-choriocapillaris complex atrophy was observed throughout the fundus. The RPC density differences in RPC density between stage 2 and stage 3 subgroup were compared.
-
Statistical analyses were performed using SPSS (version 21.0; SPSS, Inc., Chicago, IL, USA), wherein the data were presented as mean ± standard deviation. Visual acuity was converted to logMAR for statistical analyses. Student’s t-tests for independent samples were performed to evaluate differences between BCD group and control groups, and the Stage 2 and Stage 3 subgroup. All two-tailed Student’s t-test with P-values < 0.05 were considered statistically significant.
-
A total of 37 eyes from 22 patients with BCD (8 males and 14 females), who were diagnosed by genetic examinations, and 37 eyes from 22 healthy subjects (8 males and 14 females) were included in the analysis. However, 7 eyes from 7 patients had to be excluded due to the inability to obtain sufficient quality scans. The mean age was 40.6 ± 11.2 years (range: 26–66 years) for patients with BCD and 40.8 ± 11.6 years (range: 24–65 years) for healthy subjects (P = 0.958). BCVA was also noted to be 0.6 ± 0.9 and 0.0 ± 0.0 logMAR in the BCD and control groups, respectively (P < 0.001). All subjects were Chinese and did not have glaucoma or systemic disease, with normal intraocular pressure (IOP) levels.
RPC densities of 13 eyes from 7 Stage 2 patients with BCD (2 males and 5 females) and 24 eyes from 15 Stage 3 patients with BCD (6 males and 9 females) were compared. The mean age was 43.571 ± 11.631 years for Stage 2 patients with BCD and 39.267 ± 11.094 years for Stage 3 patients with BCD (P = 0.413).
-
RPC densities of the whole image, inside disk region, peripapillary region, superior-hemi region, inferior-hemi region and the S, N, I, and T quadrants were 45.9% ± 3.6%, 38.8% ± 6.3%, 49.1% ± 4.7%, 49.1% ± 5.3%, 49.2% ± 4.5%, 48.7% ± 6.8%, 51.2% ± 5.7%, 53.1% ± 6.2%, and 44.8% ± 4.4%, respectively, in the BCD group and 50.7% ± 3.0%, 49.2% ± 6.1%, 54.1% ± 3.0%, 54.6% ± 3.0%, 53.6% ± 3.4%, 57.1% ± 3.6%, 57.7% ± 3.3%, 56.5% ± 4.1%, and 47.7% ± 4.7%, respectively, in the control group (P < 0.001, P < 0.001, P < 0.001, P < 0.001, P < 0.001, P < 0.001, P < 0.001, P = 0.006, and P = 0.008, respectively). Meanwhile RPC densities in the NS, NI, IN, IT, TI, TS, ST, and SN sectors of the peripapillary region were 46.0% ± 6.1%, 43.1% ± 4.9%, 48.3% ± 6.4%, 55.0% ± 6.2%, 52.3% ± 6.8%, 53.8% ± 6.3%, 50.3% ± 7.0%, and 47.3% ± 7.6%, respectively, in the BCD group and 49.3% ± 5.0%, 45.8% ± 5.0%, 55.1% ± 3.8%, 60.9% ± 3.8%, 55.2% ± 4.8%, 57.5% ± 4.7%, 59.7% ± 3.5%, and 55.0% ± 4.4%, respectively in the control group (P = 0.012, P = 0.022, P < 0.001, P < 0.001, P = 0.036, P = 0.005, P < 0.001, and P < 0.001, respectively). Overall, the RPC density was significantly lower in the BCD group than in the control group (Table 1).
Variables BCDs (n = 22) Controls (n = 22) P value* Sex (male/female) 8/14 8/14 − Age 40.636 ± 11.176 40.818 ± 11.583 − Eye (right/left) 18/19 18/19 − Signal strength 6.054 ± 1.699 8.405 ± 0.985 < 0.001 RPC vessel density (%) Whole image 45.935 ± 3.609 50.695 ± 2.989 < 0.001 Superior-Hemi 49.054 ± 5.375 54.622 ± 3.076 < 0.001 Inferior-Hemi 49.135 ± 4.492 53.647 ± 3.393 < 0.001 Superior 48.676 ± 6.836 57.081 ± 3.631 < 0.001 Inferior 51.297 ± 5.739 57.703 ± 3.290 < 0.001 Tempo 53.054 ± 6.200 56.514 ± 4.134 0.006 Nasal 44.811 ± 4.427 47.703 ± 4.701 0.008 Inside Disk 38.800 ± 6.281 49.162 ± 6.135 < 0.001 Peripapillary 49.119 ± 4.692 54.149 ± 3.014 < 0.001 Nasal Superior 45.954 ± 6.108 49.292 ± 5.015 0.012 Nasal Inferior 43.146 ± 4.902 45.841 ± 5.006 0.022 Inferior Nasal 48.300 ± 6.372 55.076 ± 3.802 < 0.001 Inferior Tempo 54.997 ± 6.216 60.930 ± 3.822 < 0.001 Tempo Inferior 52.268 ± 6.787 55.208 ± 4.860 0.036 Tempo Superior 53.751 ± 6.339 57.532 ± 4.680 0.005 Superior Tempo 50.278 ± 7.057 59.722 ± 3.482 < 0.001 Superior Nasal 47.311 ± 7.603 55.024 ± 4.376 < 0.001 Note. *Analyzed using Student's t-test. RPC: radial peripapillary capillary; BCD: Bietti crystalline dystrophy. Table 1. Demographic characteristics and the data of RPC density between the BCD and control groups
-
RPC densities of the whole image, inside disk region, peripapillary region, superior-hemi region, inferior-hemi region, and the S, N, I, and T quadrants were 48.5% ± 2.8%, 38.5% ± 7.8%, 53.7% ± 3.0%, 53.5% ± 3.3%, 52.8% ± 3.2%, 55.0% ± 5.1%, 56.3% ± 3.3%, 54.9% ± 4.4%, and 48.1% ± 2.7%, respectively, in the Stage 2 patients with BCD and 44.6% ± 3.3%, 40.0% ± 5.5%, 54.4% ± 3.0%, 46.7% ± 4.7%, 47.1% ± 3.8%, 45.3% ± 5.0%, 48.6% ± 5.0%, 52.0% ± 6.8%, and 43.0% ± 4.2%, respectively, in the Stage 3 patients with BCD (P = 0.001, P =0.817, P = 0.491, P < 0.001, P < 0.001, P < 0.001, P < 0.001, P = 0.181, and P < 0.001). Meanwhile, RPC densities in the NS, NI, IN, IT, TI, TS, ST, and SN sectors of the peripapillary region were 49.6% ± 3.9%, 46.3% ± 4.1%, 53.7% ± 3.3%, 59.9% ± 3.5%, 54.0% ± 5.3%, 55.6% ± 4.0%, 56.1% ± 5.0%, and 54.1% ± 6.1%, respectively, in the Stage 2 patients with BCD and 44.0% ± 6.2%, 41.5% ± 4.5%, 45.4% ± 5.8%, 52.4% ± 5.8%, 51.3% ± 7.4%, 52.7% ± 7.2%, 47.1% ± 6.0%, and 43.6% ± 5.5%, respectively, in the Stage 3 patients with BCD (P = 0.006, P = 0.003, P < 0.001, P < 0.001, P = 0.261, P = 0.186, P < 0.001, and P < 0.001).
There were no significant differences in the RPC density of the tempo, inside Disk, Peripapillary, tempo Inferior, and tempo Superior regions between Stage 2 and Stage 3 subgroup. In contrast, the other areas showed significantly lower RPC densities in the Stage 3 subgroup than in the Stage 2 subgroup (Table 2).
Variables Stage 2 (n = 7) Stage 3 (n = 15) P value* Sex (male/female) 2/5 6/9 − Age 43.571 ± 11.631 39.267 ± 11.094 0.413 Eye (right/left) 7/6 11/13 − Signal strength 6.000 ± 1.581 6.083 ± 1.791 0.889 RPC vessel density (%) Whole image 48.454 ± 2.805 44.571 ± 3.279 0.001 Superior-Hemi 53.462 ± 3.332 46.667 ± 4.743 < 0.001 Inferior-Hemi 52.846 ± 3.158 47.125 ± 3.791 < 0.001 Superior 55.000 ± 5.066 45.250 ± 4.989 < 0.001 Inferior 56.308 ± 3.308 48.583 ± 4.986 < 0.001 Tempo 54.923 ± 4.425 52.042 ± 6.849 0.181 Nasal 48.077 ± 2.660 43.042 ± 4.206 < 0.001 Inside Disk 38.469 ± 7.804 39.979 ± 5.467 0.817 Peripapillary 53.677 ± 3.042 54.404 ± 3.031 0.491 Nasal Superior 49.592 ± 3.936 43.983 ± 6.227 0.006 Nasal Inferior 46.269 ± 4.117 41.454 ± 4.503 0.003 Inferior Nasal 53.715 ± 3.325 45.367 ± 5.677 < 0.001 Inferior Tempo 59.885 ± 3.469 52.350 ± 5.777 < 0.001 Tempo Inferior 53.992 ± 5.291 51.333 ± 7.409 0.261 Tempo Superior 55.639 ± 4.026 52.729 ± 7.165 0.186 Superior Tempo 56.077 ± 4.958 47.138 ± 5.980 < 0.001 Superior Nasal 54.108 ± 6.111 43.629 ± 5.545 < 0.001 Note. *Analyzed using Student's t-test. RPC: radial peripapillary capillary. Table 2. Demographic characteristics and the data of RPC density between the Stage 2 and Stage 3 subgroup
B-scan showed that the signals of the RPE, ellipsoid zone layer, and part of the retinal outer nuclear layer around the optic disk in BCD were lost. Moreover, the outer plexus, inner nuclear, inner plexus, and ganglion cell layers were disordered. As a result, the retina of advanced patients with BCD was atrophied and thinned.
-
In this cross-sectional study, we investigated the RPC density in patients with BCD. In literature, there are very few reports on OCTA imaging findings in patients with BCD, which often showed a choriocapillaris blood flow deficit in these patients [8, 12, 13]. Specifically, imaging findings have shown a significant decrease in capillary densities of the macula region's superficial and deep capillary plexus in patients with BCD [14]. Our study reveals novel quantitative evidence that RPC density is significantly lower in the eyes of patients with BCD than in the eyes of healthy subjects.
The retinal vascular complexes include the superficial vascular (SVC) and deep vascular (DVC) complexes, wherein the SVC arterioles supply DVC arterioles, and the SVC venules receive DVC venules. The SVC is formed by the nerve fiber layer (NFLP) and ganglion cell layer (GCLP) plexuses. The NFLP nourishes the nerve fiber layer and forms a concentrated layer of capillaries in the peripapillary region called the radial peripapillary capillary plexus (RPCP) [15, 16, 17, 18]. Previous studies of OCTA on BCD focused on the choroidal and retinal changes in the macular area, showing decreases in the SVC, DVC, and choriocapillaris [8, 12, 13]. Our study showed a decrease in the RPC density. The RPCP is derived mainly from retinal and ganglion cell layer arterioles in the macular region [5]. Therefore, our results were consistent with those of previous studies.
We considered the following reasons for the decrease of RPCP in patients with BCD: first, the RPE expresses vascular endothelial growth factor (VEGF) [19, 20], which is very important for maintaining the normal retina and choroid. However, the RPE is damaged and lost in BCD [3, 13, 21], and a low VEGF may affect retinal vessel growth, leading to a decrease in the retinal capillary density [22, 23, 24]. Interestingly, choroideremia (CHM) is a degenerative disease similar to BCD with RPE as its primary site, which causes the loss of photoreceptors [25, 26]. CHM studies also showed a decrease in the SVC, DVC, and choriocapillaris, suggesting that VEGF reduction caused by RPE loss played an important role in the decrease of the SVC and DVC [22, 27]. Therefore, the lack of VEGF may be one reason for the decrease in the RPCP in patients with BCD. Second, the loss of photoreceptors and RPE is followed by impairment at the inner retinal neurons, blood vessels, and ONH [28, 29, 30]. Retinal vascularity is related to metabolic needs. One research about the RPC density in the retinitis pigmentosa suggested the reduction of RPC density might be explained by a reduction of metabolic demand and a subsequent reduction in vascular flow [31]. Previous studies have reported thinning of the retina and choroid with increased BCD severity [32]. The atrophy of RPE and ellipsoid zone layers in BCD and RP retinas is similar. The RPE and ellipsoid zone layers were found to be the most metabolically active sites. Thus, the absence of these layers leads to reduced retinal metabolism and a consequent decrease in retinal vessels. Third, the RPC density decrease may be due to direct damage to blood vessels caused by the disordered CYP4V2 gene; however, the exact reasons for this need to be further investigated.
In the patients with BCD of our study, we had no Stage 1 patient since they rarely visited the hospital, given their nearly normal visual acuity. Instead, we performed a comparison between Stage 2 and Stage 3 BCD subgroups in the present study, showing no significant RPC density differences in the tempo quadrant and inside disk regions between the two subgroups. In contrast, the other areas showed significantly lower RPC densities in the Stage 3 subgroup than the Stage 2 subgroup, which may explain why the optic disk color of patients with BCD did not change significantly when the disease progressed. This may be caused by the fact that optic disk metabolism did not decrease significantly in the Stage 3 subgroup compared with the Stage 2 subgroup. The retina and choroid of the macular area were the first affected sites in patients with BCD. The tempo quadrant of the optic disk belongs to the macular area and is affected in Stage 1 BCD. As the disease progresses, the lesion extends beyond the posterior pole, affecting the superior, inferior, and nasal quadrants in Stage 2. Most of the Stage 2 subgroup patients with BCD in our study were found that the macula was severely atrophied, and the superior, inferior, and nasal quadrants were relatively lightly atrophied. This may be why the decrease in RPC density in the tempo region was not significant, while the RPC density decreases in the other regions were significant compared to Stage 2 Stage 3 BCD.
Moreover, our results showed no significant difference in the peripapillary RPC density between Stage 2 and Stage 3 subgroups. We believe that this result was inaccurate since it is inconsistent with the actual BCD dystrophy progression and the regional comparison results between the two subgroups. This inconsistency may be due to the influence of the tempo RPC density data or the limited number of cases.
Despite all our findings, our study has two limitations. First, the number of patients in the BCD group was relatively small; however, considering the rarity of the disease and our review of previous literature, our study was one of the researches that focused on image findings of BCD with the largest number of patients. Furthermore, the present study is novel at it is the first to investigate the RPC density of patients with BCD. Second, the signal strength difference between the BCD and control groups was significant. This indicates that the image quality, which was based on the subjects' eyes, in the BCD group was worse than the control group, causing possible data differences. However, the visual acuity of patients with BCD is usually poor, and a quality image score of 5 is sufficient for patients with the disease.
-
In conclusion, the RPC density of BCD was reduced in the entire area and each region. The RPC density of the inside disc and tempo quadrants showed no significant change in Stage 2 and Stage 3 patients with BCD; however, the RPC density in the superior, inferior, and nasal quadrants was significantly different between the two stages. Thus, knowledge of the RPC condition can provide a better understanding of BCD pathogenesis, development, and progression in the eye, ultimately helping doctors and researchers in monitoring disease progression and the efficacy of new therapeutic approaches.
-
The authors have no conflict of interest to declare.
-
ZSJ, PXY, and WLF designed experiments and wrote the manuscript. XZ, LZQ, XC, and LLN performed the initial clinical database search. LQ identified confirmed cases of BCD, SHJ collected all images as presented. ZSJ and YZZ reviewed all the images and statistical analysis.
Analysis of Radial Peripapillary Capillary Density in Patients with Bietti Crystalline Dystrophy by Optical Coherence Tomography Angiography
doi: 10.3967/bes2022.015
- Received Date: 2021-03-09
- Accepted Date: 2021-09-14
-
Key words:
- Bietti crystalline dystrophy /
- Optical coherence tomography angiography /
- Radial peripapillary capillary
Abstract:
| Citation: | ZHANG Sheng Juan, WANG Li Fei, XIAO Zhe, LIU Zhi Qiang, XING Chen, LI Qian, SUN Hui Jing, YANG Zan Zhang, LYU Li Na, PENG Xiao Yan. Analysis of Radial Peripapillary Capillary Density in Patients with Bietti Crystalline Dystrophy by Optical Coherence Tomography Angiography[J]. Biomedical and Environmental Sciences, 2022, 35(2): 107-114. doi: 10.3967/bes2022.015

|

 Quick Links
 DownLoad: