


-
Cardiovascular diseases (CVD) are major public health conditions that are leading causes of death[1,2] and the identification of predictive cardiovascular event markers is urgently needed. To date, numerous biomarkers have been associated with CVD development and progression, including lipoprotein-associated phospholipase A2 (Lp-PLA2), high-sensitivity C-reactive protein (hs-CRP), interleukin-6, homocysteine, and others[3–6]. Lp-PLA2 is a macrophage derived enzyme and proposed as a pro-inflammatory biomarker with a central role in atherosclerosis progression[7]. Substantial evidence shows that Lp-PLA2 is associated with an increased risk of cardiovascular events[8-10]. Also, ethnic variations in Lp-PLA2 have been identified; levels are higher in Caucasians than other races[11,12].
However, data on Lp-PLA2 to predict cardiovascular events, with long-term follow-up, are limited in Chinese and Asian populations. In addition, the American Association of Clinical Endocrinologists (AACE) proposed Lp-PLA2 standards for predicting the risk of future CVD, however, no studies have yet assessed whether this standard is applicable to a Chinese setting. Therefore, we hypothesized that aberrant increases in Lp-PLA2 levels could be associated with an increased risk of cardiovascular events in a Chinese population. Our remit was to explore the predictive ability of Lp-PLA2 on the occurrence of cardiovascular events, with a long follow-up, in a CVD-free, middle-aged Chinese population. We also explored the feasibility of applying AACE guidelines to the Chinese population.
-
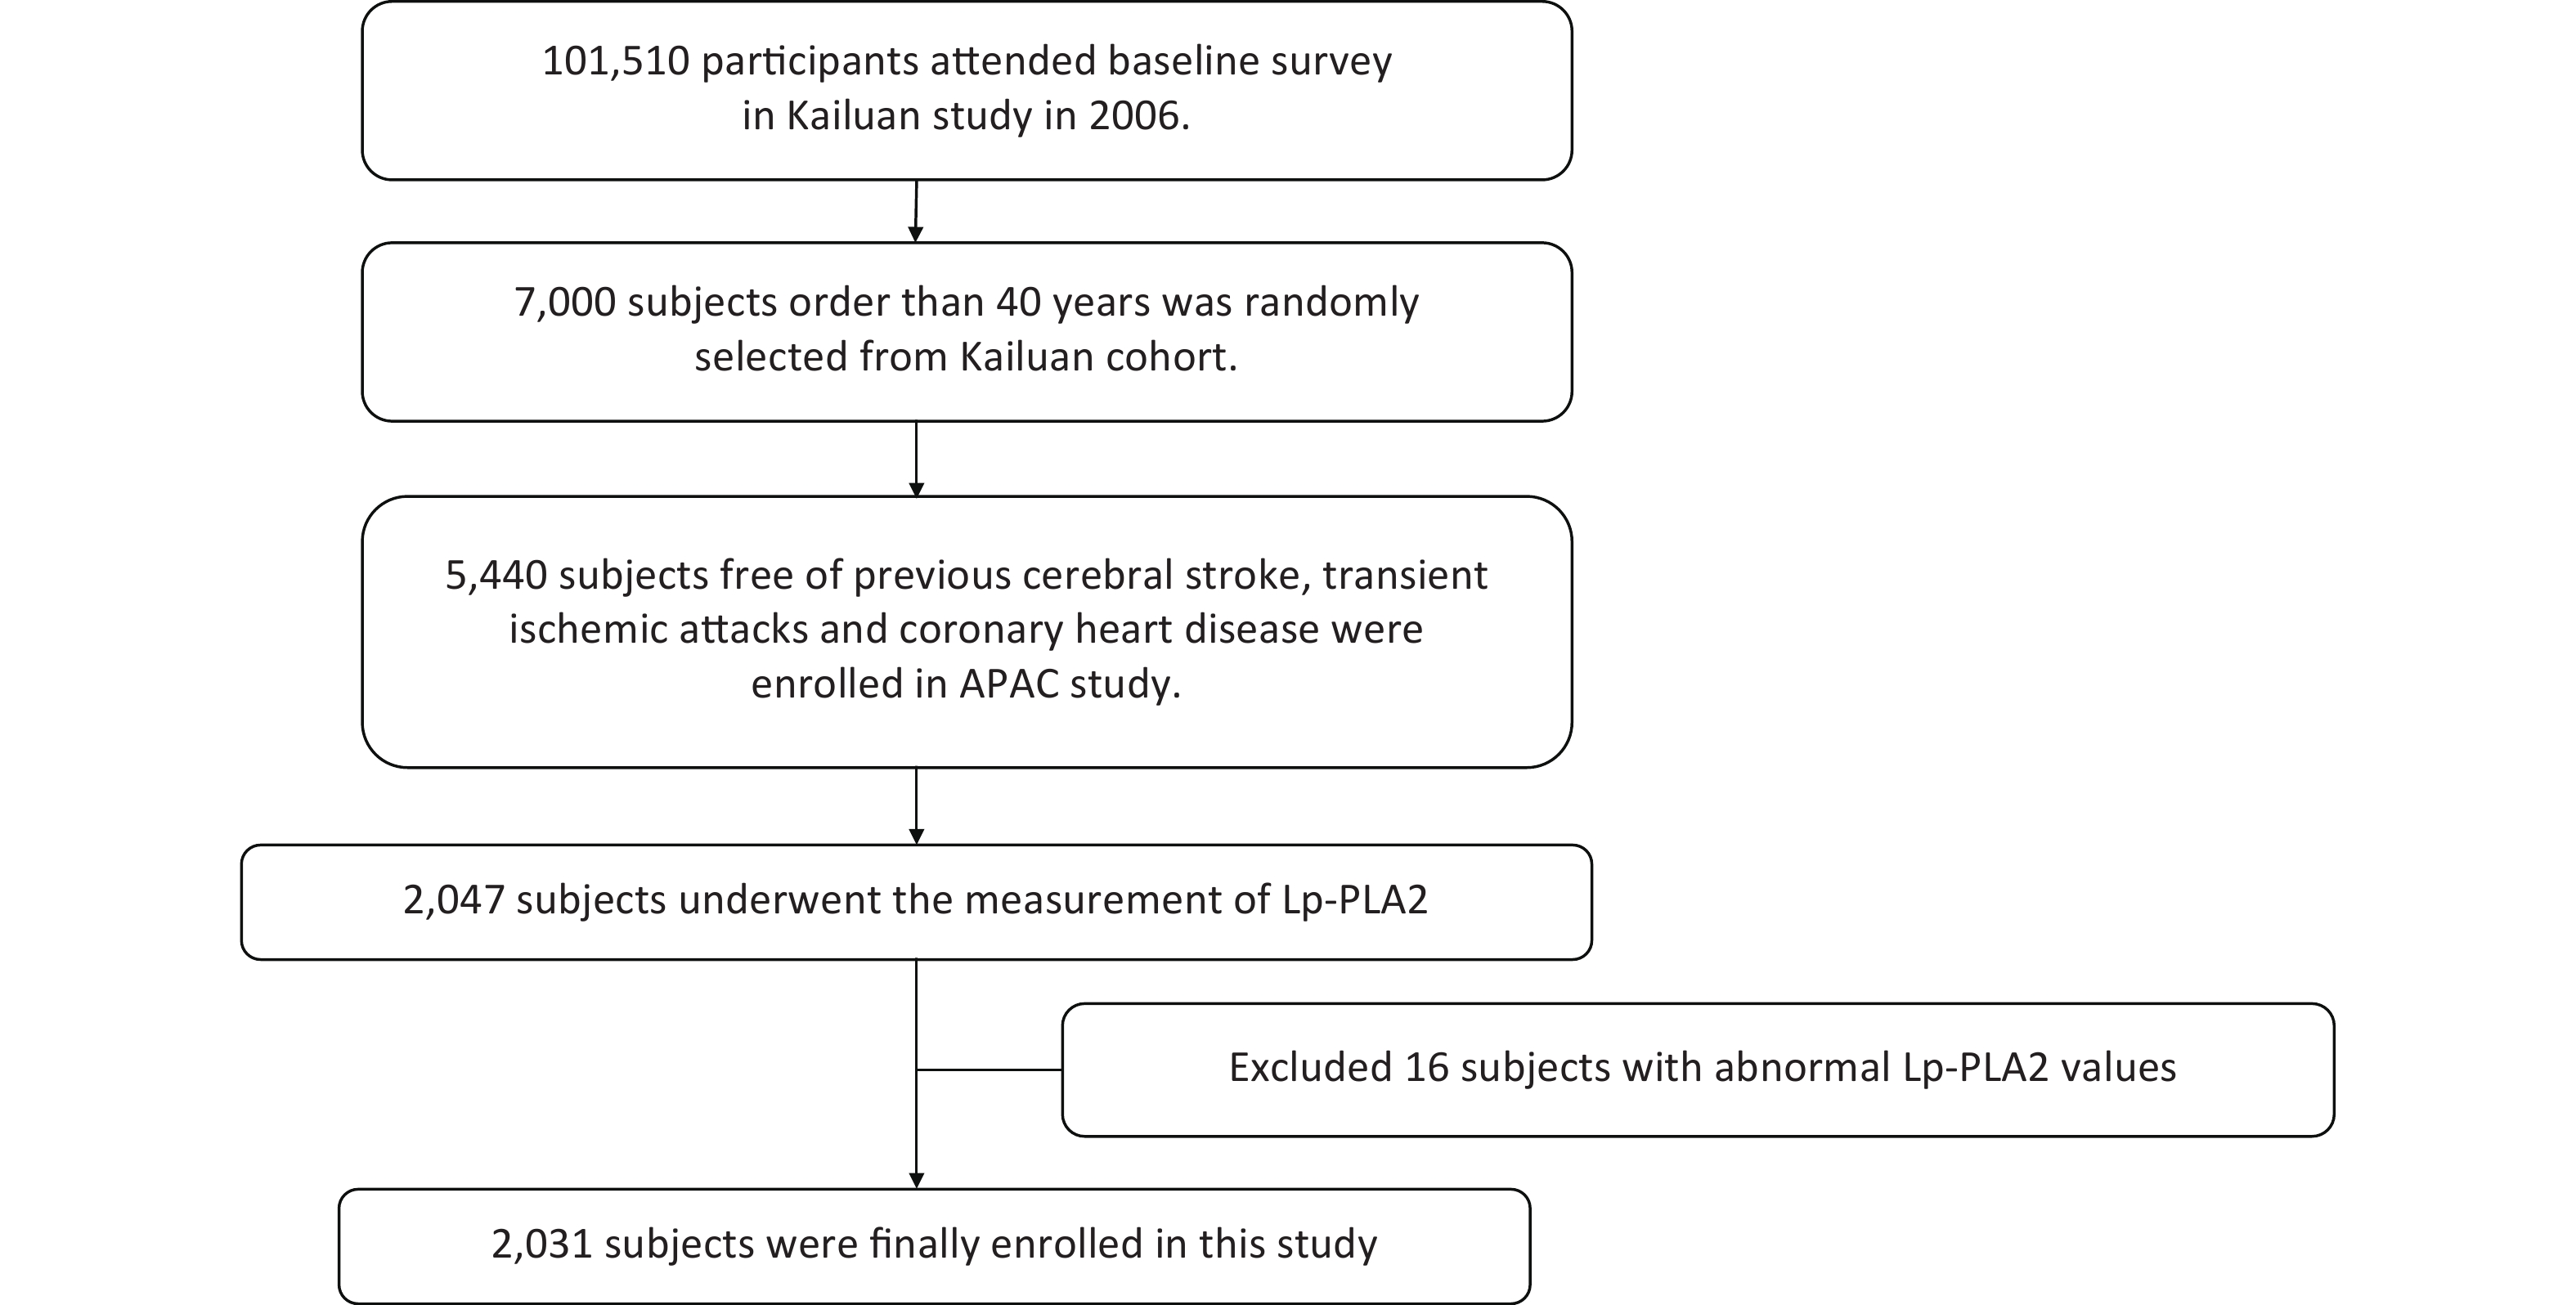
Participants and data came from the Asymptomatic Polyvascular Abnormalities Community study (APAC), a sub-population of the Kailuan study which included 101,510 current employees and retirees at the Kailuan (Group) Co. Ltd, Tangshan city, northern China[13]. From June 2010 to June 2011, 5,440 participants aged > 40 years old and free of stroke, transient ischemic attack, and coronary disease, were eligible and included in the APAC study. The APAC study protocol was previously reported[14]. Among these 5,440 participants, 2,047 participants were undertaken the Lp-PLA2 measurements and were investigated Lp-PLA2 associations with cardiovascular events, from 2010 to 2019. After screening, 2031 participants were included after excluding 16 participants whose Lp-PLA2 values were outside the assay detection range (39–2,500 ng/mL) (Supplementary Figure S1, available in www.besjournal.com). The study was performed according to Helsinki Declaration guidelines and was approved by the Ethics Committee of Kailuan General Hospital and Beijing Tiantan Hospital. Written informed consent was obtained from all participants.
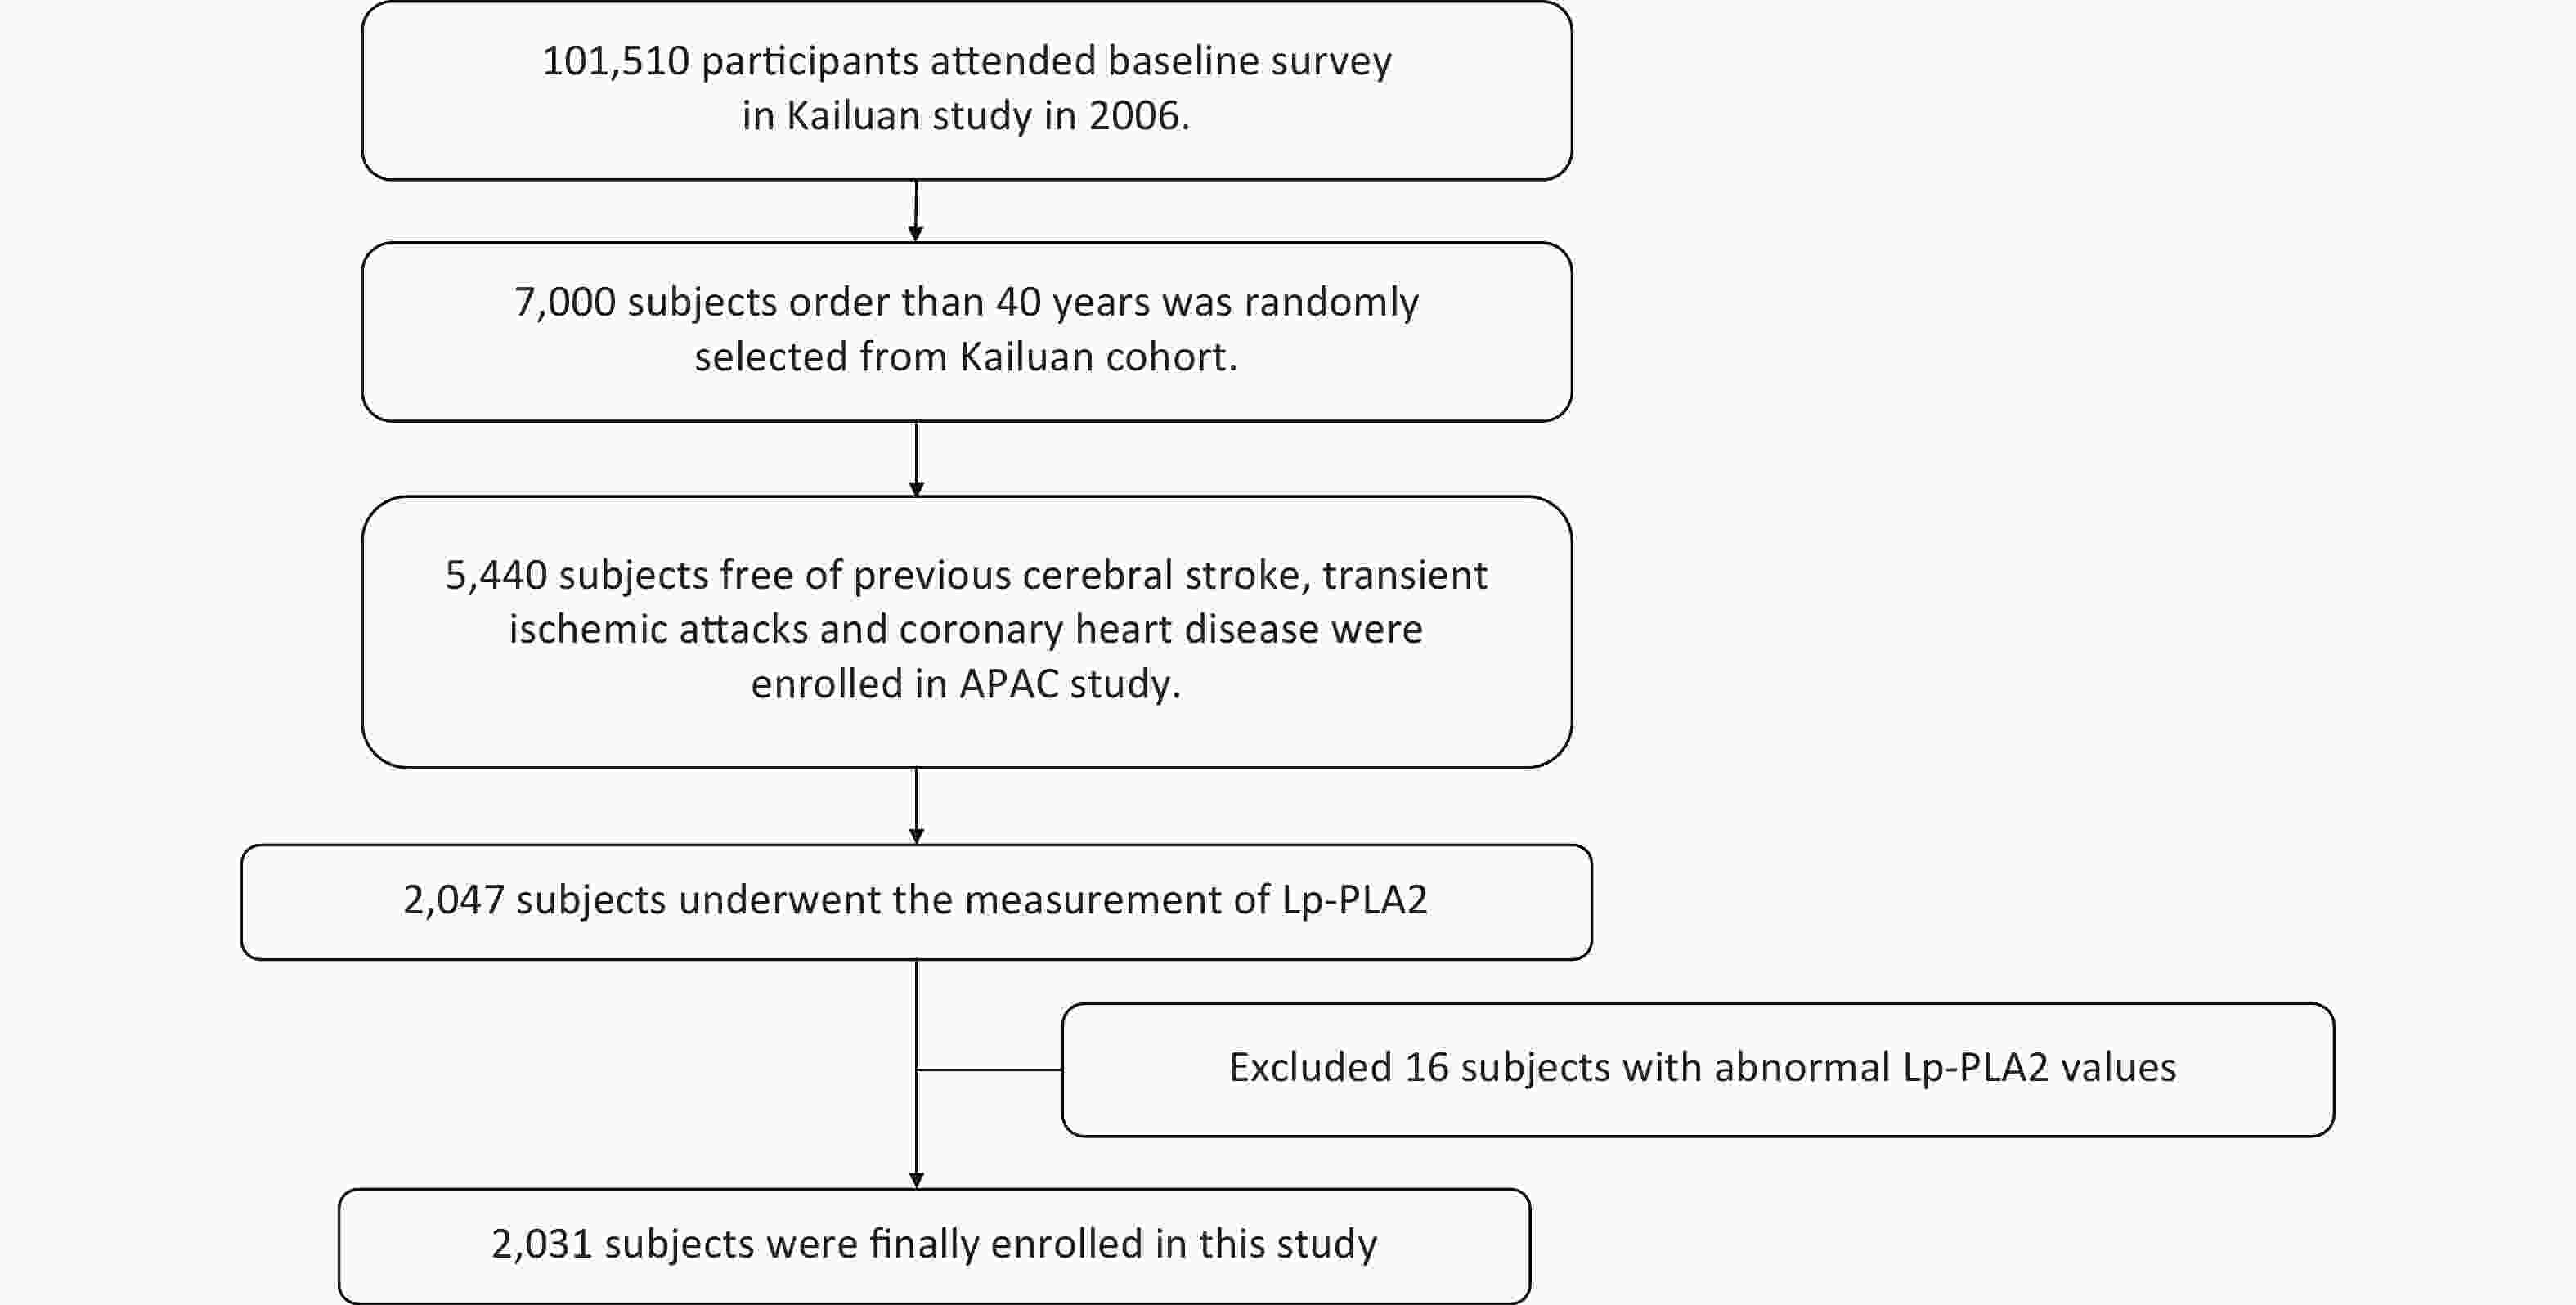
Figure S1. Study flow chart.
-
Baseline data were collected by research coordinators using standardized questionnaires. These data included, participant demographics, lifestyles, medical conditions, and blood biochemical examinations. Medical conditions included, hypertension, diabetes mellitus, and hyperlipidemia, which were defined according to: 1) documented or self-reported history, 2) taking medication for corresponding diseases, or 3) clinical or laboratory examinations (blood pressure ≥ 140/90 mmHg after repeated measures indicating hypertension[15]; fasting blood glucose levels ≥ 7.0 mmol/L for diabetes mellitus; serum total cholesterol ≥ 5.7 mmol/L, triglycerides ≥ 1.7 mmol/L, and low-density lipoprotein cholesterol levels ≥ 4.1 mmol/L for dyslipidemia[16]). Body mass index (BMI) was calculated by dividing weight (kg) by the height squared (m2) and categorized as < 24.0 kg/m2, 24.0–27.9 kg/m2, and > 28.0 kg/m2 which indicated normal, overweight, and obesity, respectively. Physical activity was categorized as inactive, moderately active, and very active. Family monthly income per capita was also classified as: ≤ ¥1,000, ¥1,001–3,000, ¥3,001–5,000, and > ¥5,000[17]. Participants who currently or previously used alcohol were defined as drinkers. Smoking status was categorized as ex-smoker, current smoker, and never smoked. High-sensitivity C-Reactive Protein (hs-CRP) was measured using a high-sensitivity nephelometry assay (Cias Latex CRP-H; Kanto Chemical Co. Inc., Tokyo, Japan) and results were categorized into two groups (< 1.0 mg/dL and ≥ 1.0 mg/dL) according to guidelines[18]. All blood examinations were performed at the central laboratory at Kailuan Hospital.
-
Venous blood samples were collected from fasting participants into serum separator tubes. Samples were centrifuged for 10 min at 3,000 rpm (serum separator tubes were used to clot blood for 2 h at room temperature before centrifugation). Blood samples were labelled with unique numbers and stored at –80 °C until required. Lp-PLA2 levels were measured using an enzyme linked immunosorbent assay (ELISA) kit (CUSABIO Co., Wuhan, China, Human lipoprotein phospholipase A2 (Lp-PLA2) enzyme immunoassay kit, Catalog number; CSB-E08319h). Intra- and inter-assay coefficients of variation were < 8% and < 10%, respectively. To reduce inter-assay and measurement error, all assays were simultaneously conducted by a technician using the ELISA kit (CUSABIO company, Human lipoprotein phospholipase A2 (Lp-PLA2) enzyme immunoassay kit, Catalog number CSB-E08319h) at Beijing Tiantan Hospital, Capital Medical University, Beijing, China, according to manufacturer’s instructions.
-
Participants were followed-up by face-to-face interviews at routine 2-year medical examinations until 31 December 2019, or when an event of interest or death occurred. Physicians blinded to baseline data performed follow-up interviews. For participants who could not complete a face-to-face follow-up, outcome information was obtained by checking medical records at hospitals and/or the patient's medical insurance. Composite endpoints included, the first-ever stroke, myocardial infarction (MI), or all-cause death. Stroke was diagnosed according to World Health Organization criteria combined with brain computed tomography or magnetic resonance confirmation[19], and included three main types: cerebral infarction (CI), intracerebral hemorrhage (CH), and subarachnoid hemorrhage (SAH). MI was defined according to the 2007 universal definition[20]. Participants experiencing any kind of stroke or MI were deemed as having had a major adverse cardiovascular event (MACE). All-cause deaths were confirmed by checking death certificates from provincial statistics offices. All outcomes were checked by the Data Safety Monitoring Board and the Arbitration Committee for Clinical Outcomes.
-
Participants were classified into four groups according to serum Lp-PLA2 level quartiles. The Kolmogorov-Smirnov test was performed to test the normality of continuous variables which were represented as the mean ± standard deviation (SD) or the median together with the interquartile range (IQR). Categorical variables were expressed as counts (percentages). One-way analysis of variance (ANOVA) was performed to compare continuous variables. The chi-square test or the Fisher test was performed to test intergroup differences in categorical variables. Kaplan-Meier estimates were used to generate cumulative risks, and groups were compared using the Log-rank test. Associations between Lp-PLA2 and outcomes were assessed using time-dependent Cox proportional hazards models by calculating hazard ratios (HR) and 95% confidence intervals (CI). For participants with more than one disease, we used the time from the first event occurred in Cox proportional hazards models. We adjusted possible confounders, including age, gender, BMI, drinking and smoking history, history of hypertension, hyperlipidemia, diabetes, and hs-CRP in regression analysis. Lp-PLA2 associations with outcomes were also tested in participants stratified by age, sex, and hs-CRP. A two-sided P < 0.05 value was considered statistically significant. Analyses were performed using SAS software, version 9.4 (SAS Institute Inc., Cary, NC, USA) and SPSS 26 (SPSS Italy Inc., Bologna, Italy).
-
Participant characteristics are summarized (Table 1). The mean age of the 2,031 participants was 60.4 years and 73.6% were male. Mean Lp-PLA2 levels were 168.5 ng/mL. Observed Lp-PLA2 level quartiles were: Quartile 1 (< 131.9 ng/mL), Quartile 2 (131.9–141.0 ng/mL), Quartile 3 (141.0–159.1 ng/mL), and Quartile 4 (≥ 159.1 ng/mL). We observed significant differences in age, income status, smoking status, drinking status, BMI, hs-CRP level, and history of hypertension between Lp-PLA2 quartiles. Lp-PLA2 levels showed an increased trend with age. Also, hs-CRP levels tended to be increased in the higher Lp-PLA2 quartile groups (Q4). In addition, we observed a tendency for more participants with hypertension in higher Lp-PLA2 quartile groups.
Characteristics Total Lp-PLA2 (ng/mL) P value Quartile 1
(< 131.9)Quartile 2
(131.9–141.0)Quartile 3
(141.0–159.1)Quartile 4
(≥ 159.1)n, % 2,031 509 (25.0) 507 (25.0) 508 (25.0) 507 (25.0) Age (years) 60.4 ± 11.7 55.7 ± 8.7 58.0 ± 10.2 61.7 ± 11.6 66.3 ± 13.1 < 0.001 Male (n, %) 1,495 (73.6) 384 (75.4) 379 (74.8) 363 (71.5) 369 (72.8) 0.460 Income, ¥/month (n, %) < 0.001 ≤ 3,000 1,697 (83.6) 459 (90.2) 428 (84.4) 420 (82.7) 390 (76.9) 3,001–5,000 252 (12.4) 44 (8.6) 65 (12.8) 66 (13.0) 77 (15.2) > 5,000 82 (4.0) 6 (1.2) 14 (2.8) 22 (4.3) 40 (7.9) Physical activity (n, %) 0.900 Inactive 749 (36.9) 192 (37.7) 185 (36.5) 181 (35.6) 191 (37.7) Moderately active 463 (22.8) 123 (24.2) 116 (22.9) 112 (22.1) 112 (22.1) Very active 819 (40.3) 194 (38.1) 206 (40.6) 215 (42.3) 204 (40.2) Smoking status (n, %) < 0.001 Never 1,099 (54.1) 246 (48.3) 260 (51.3) 303 (59.7) 290 (57.2) Ex-smoker 157 (7.7) 34 (6.7) 37 (7.3) 32 (6.3) 54 (10.7) Current smoker 775 (38.2) 229 (45.0) 210 (41.4) 173 (34.1) 163 (32.2) Drinker (n, %) 792 (39.0) 210 (41.3) 219 (43.2) 179 (35.2) 184 (36.3) 0.020 BMI (kg/m2) 0.020 < 24.0 796 (39.2) 179 (35.2) 183 (36.1) 206 (40.6) 228 (45.0) 24.0–27.9 923 (45.5) 244 (47.9) 235 (45.4) 230 (45.3) 214 (42.2) > 28.0 312 (15.4) 86 (16.9) 89 (17.6) 72 (14.2) 65 (12.8) Hypertension (n, %) 675 (33.2) 129 (25.3) 150 (29.6) 189 (37.2) 207 (40.8) < 0.001 Diabetes (n, %) 229 (11.3) 47 (9.2) 55 (10.9) 69 (13.6) 58 (11.4) 0.180 Hyperlipidemia (n, %) 245 (12.1) 62 (12.2) 68 (13.4) 63 (12.4) 52 (10.3) 0.480 hs-CRP (mg/dL) 2.5 ± 4.5 2.1 ± 3.3 2.3 ± 4.0 2.3 ± 4.0 3.1 ± 6.3 0.002 hs-CRP, mg/dL (n, %) 0.510 < 1.0 908 (44.7) 231 (45.4) 232 (45.8) 233 (45.9) 212 (41.8) ≥ 1.0 1,123 (55.3) 278 (54.6) 275 (54.2) 275 (54.2) 295 (58.2) Note. Values for categorical variables are represented as number (percentage); values for continuous variables are represented as the mean ± standard deviation. Lp-PLA2 = lipoprotein-associated phospholipase A2; BMI = body mass index; hs-CRP = high-sensitivity C-reactive protein. Table 1. Baseline characteristics of study participants according to serum Lp-PLA2 quartiles
-
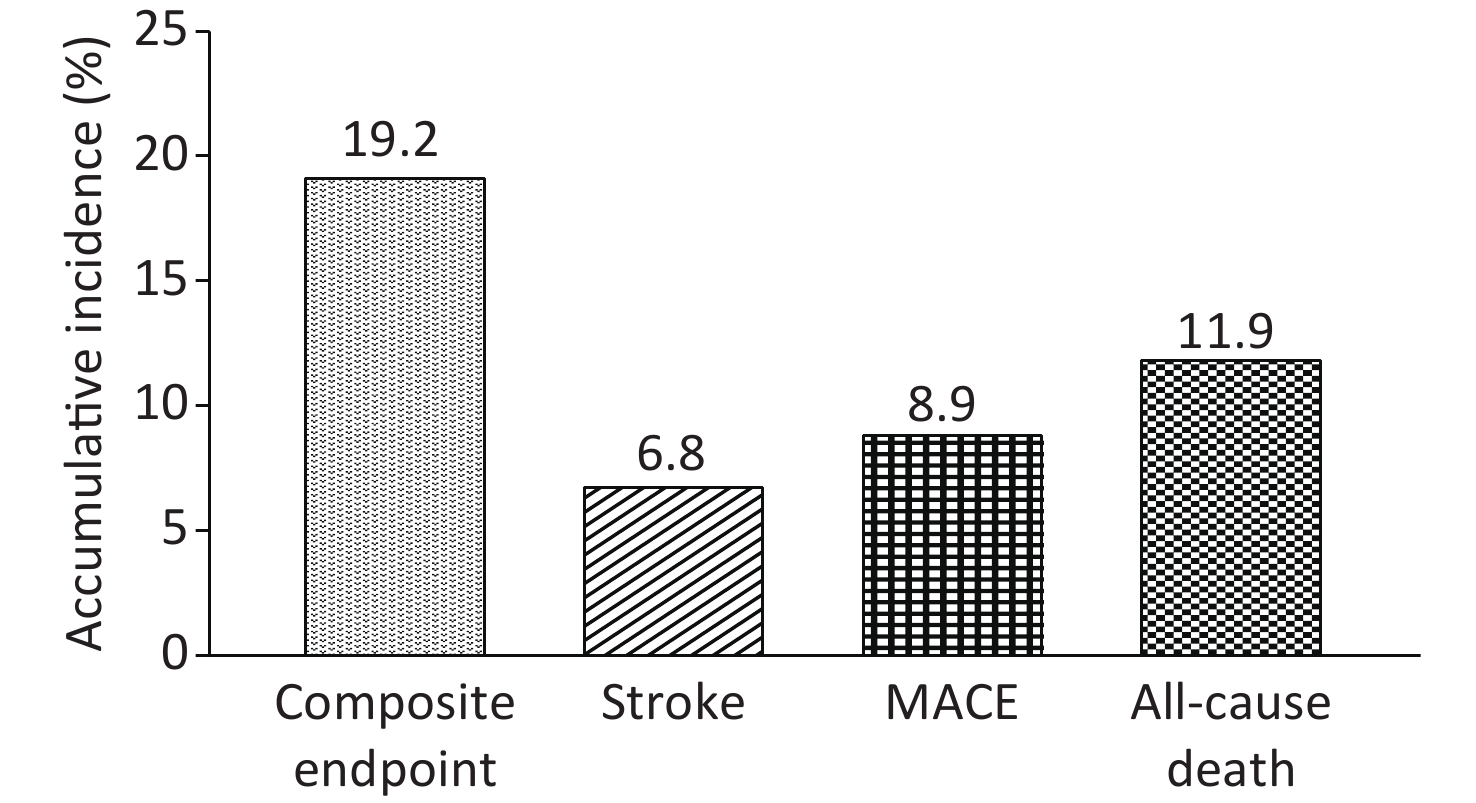
The median follow-up period was 9.1 years (IQR: 8.7–9.3 years). In total, 389 events were identified during the follow-up period, including 137 strokes (6.8%), 43 MIs (2.1%), and 244 all-cause deaths (11.9%). Strokes (137; 6.8%) included, 125 CIs (6.2%), 11 CHs (0.5%), and 3 SAHs (0.1%). With increasing Lp-PLA2 quartiles, the event rate of composite endpoints showed an upward trend. Q4 had the highest composited event rate (28.6%) when compared with Q1 (10.8%), Q2 (14.8%), and Q3 (22.4%). The accumulative incidence of predefined events during the follow-up period is shown (Figure 1).
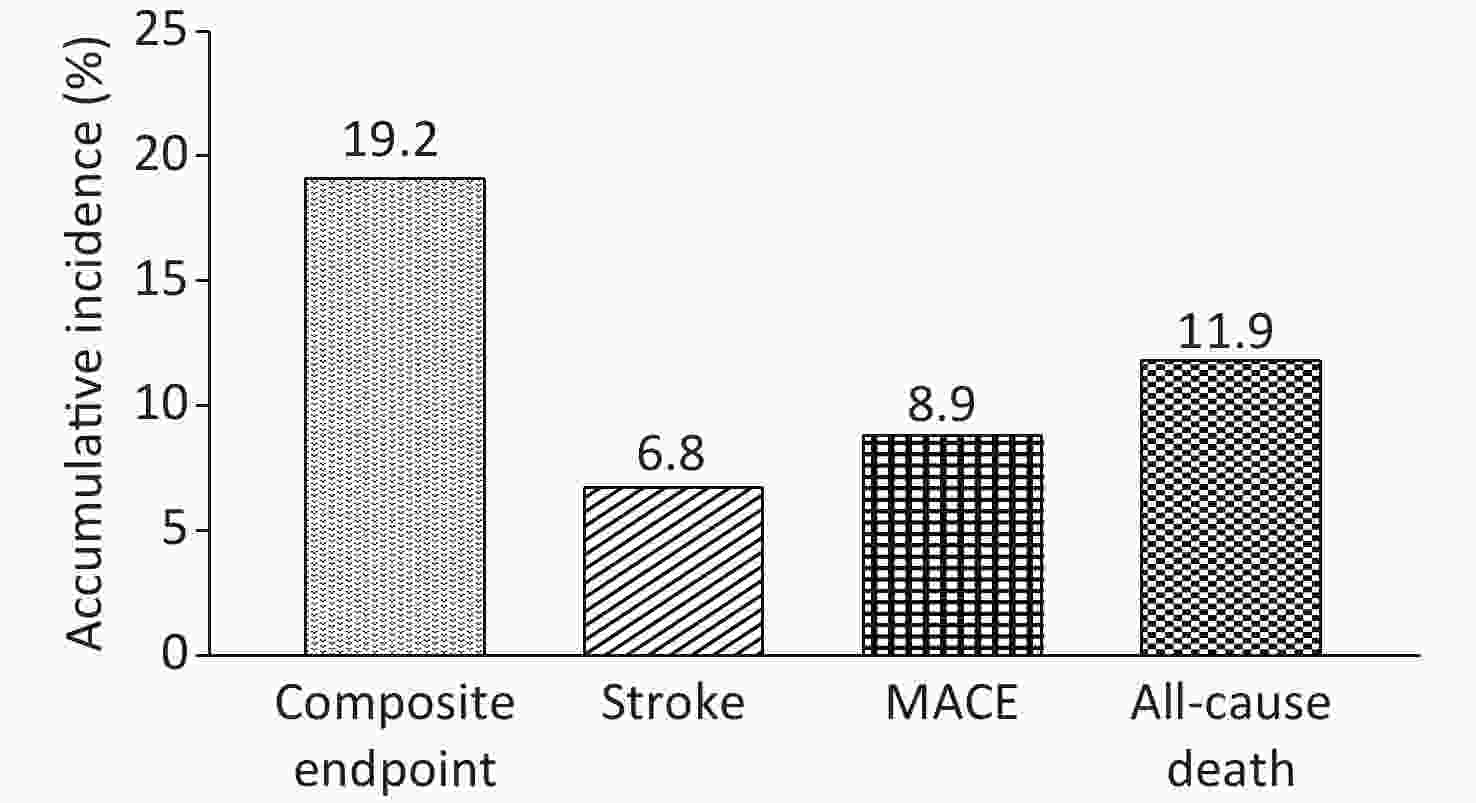
Figure 1. Accumulative incidence of outcomes over a median follow-up of 9.1 years in the study population. MACE = Major adverse cardiovascular events.
-
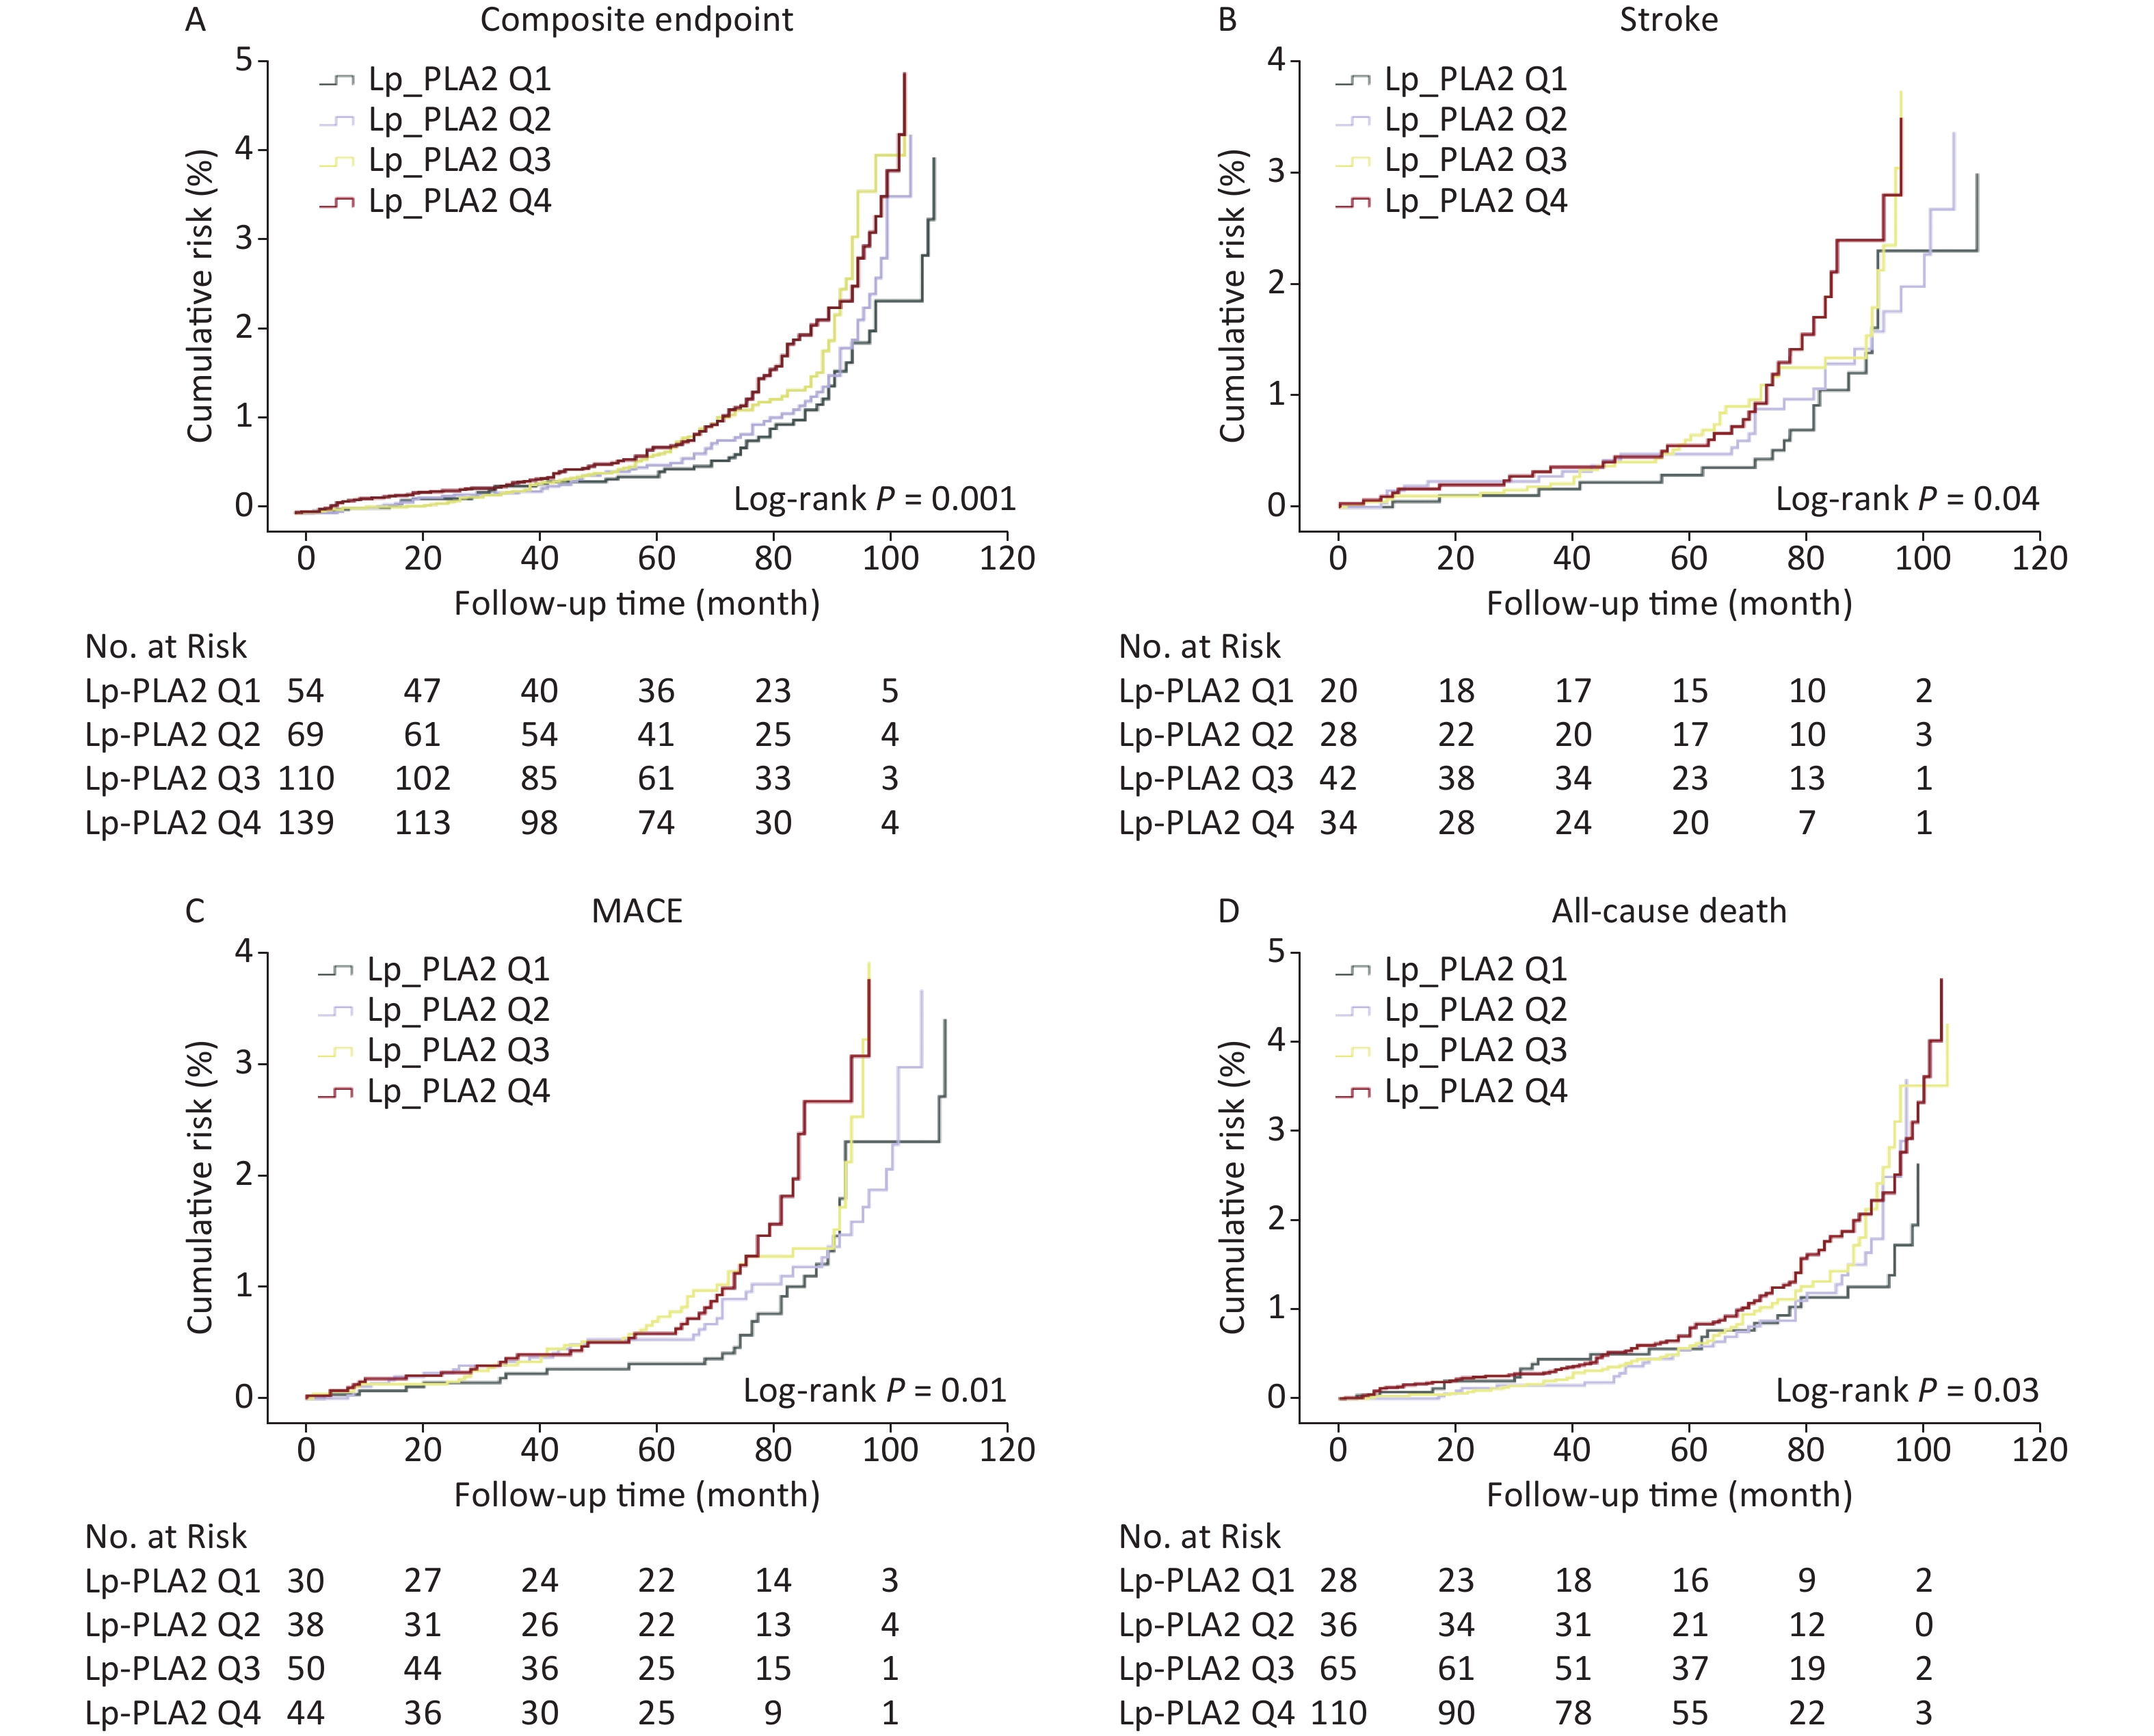
Kaplan-Meier cumulative risk curves for outcomes according to Lp-PLA2 quartiles are shown (Figure 2). Patients in higher Lp-PLA2 groups (Q4) had a significantly higher risk of all four outcome types (all Log-Rank P < 0.05). The HRs with 95% CIs for outcomes according to Lp-PLA2 level quartiles are shown (Table 2). When compared with the lowest Lp-PLA2 quartile, the HR with a 95% CI for developing composite endpoints was 1.77 (1.24–2.54) in the highest quartile. When compared with the lowest quartile, the HR with a 95% CI of the highest quartile (Q4) for developing incident stroke, MACE, and all-cause death was 1.92 (1.03–3.60), 1.69 (1.003–2.84), and 1.94 (1.18–3.18), respectively.
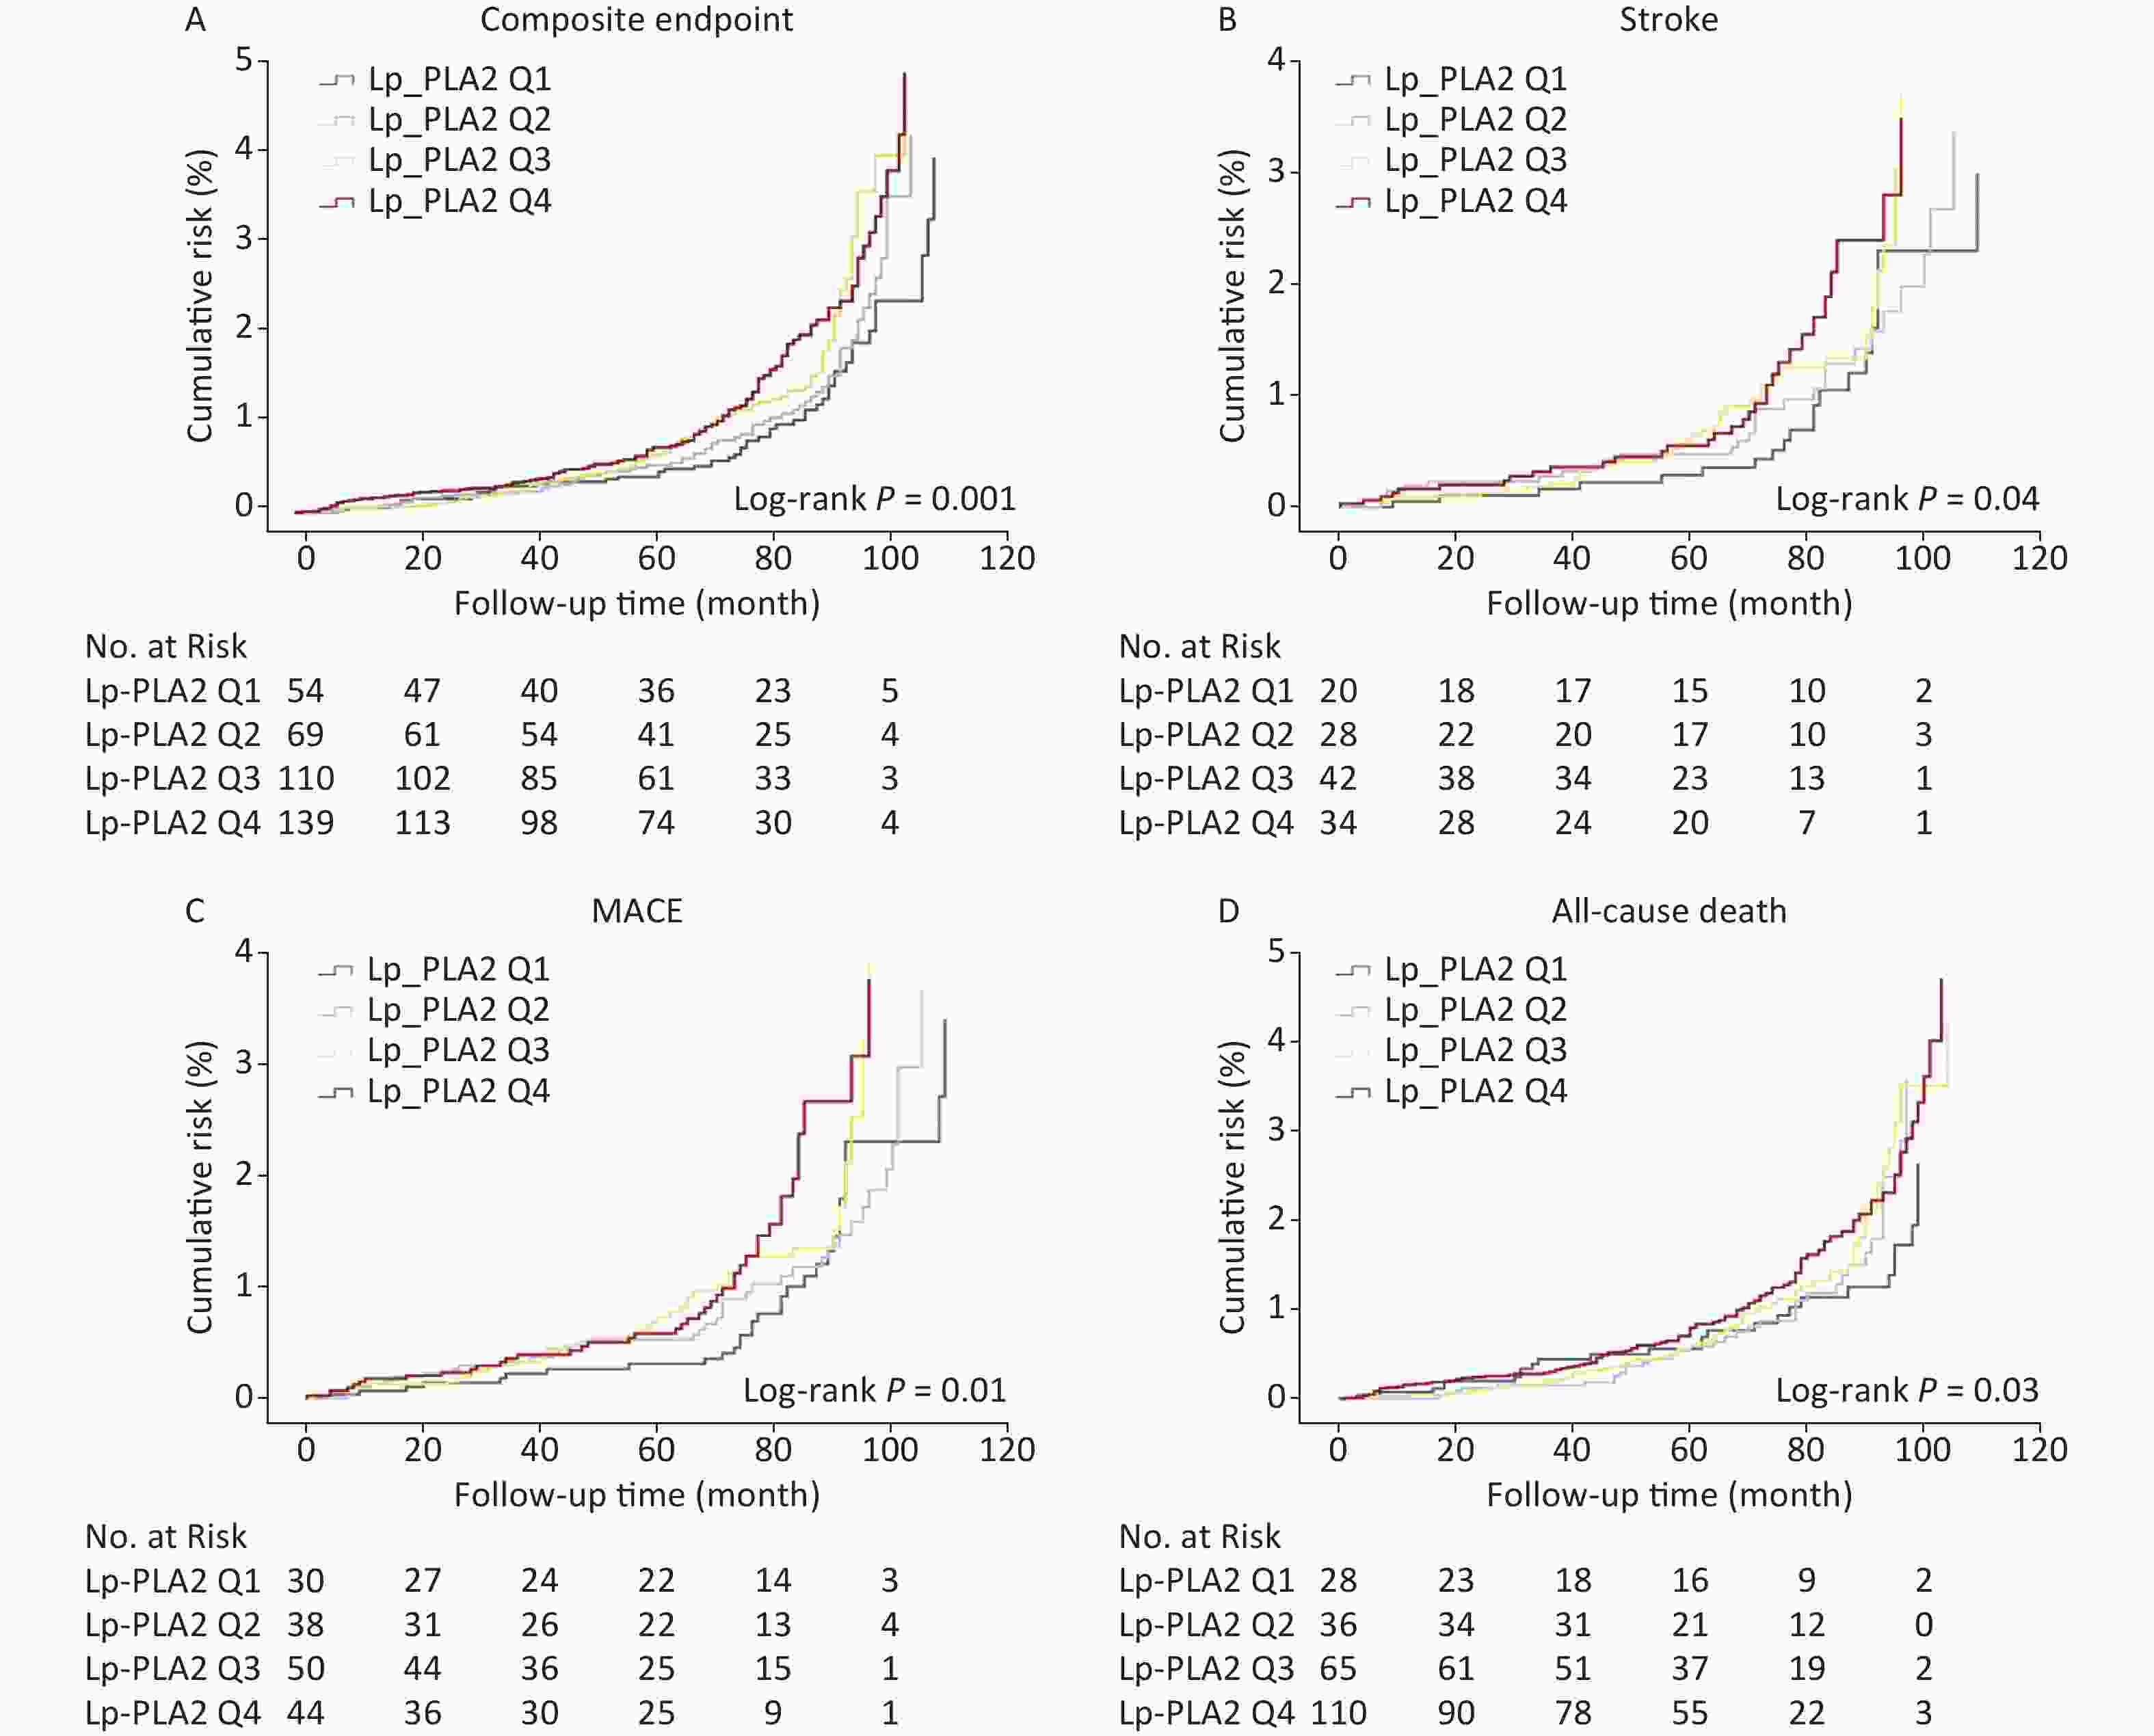
Figure 2. Cumulative risk of outcomes during a median follow-up of 9.1 years in the study population. Kaplan-Meier cumulative risk curves for composite endpoints (A), stroke (B), MACE (C), and all-cause death (D) in participants with different serum Lp-PLA2 levels. Lp-PLA2 Q1(-Q4) = lipoprotein-associated phospholipase A2 Quartile 1 (- Quartile 4); MACE = Major adverse cardiovascular events
Characteristics Events (n, %) Crude model
HR (95% CI)Model 1
HR (95% CI)Model 2
HR (95% CI)Composite endpoint 
Quartile 1 55 (10.8) Reference Reference Reference Quartile 2 75 (14.8) 1.19 (0.83−1.71) 1.22 (0.85−1.75) 1.20 (0.83−1.75) Quartile 3 114 (22.4) 1.36 (0.98−1.89) 1.42 (1.02−1.99) 1.37 (0.96−1.94) Quartile 4 145 (28.6) 1.60 (1.16−2.20) 1.74 (1.23−2.46) 1.77 (1.24−2.54) Stroke Quartile 1 22 (4.3) Reference Reference Reference Quartile 2 30 (5.9) 1.39 (0.77−2.53) 1.38 (0.76−2.52) 1.40 (0.74−2.63) Quartile 3 45 (8.9) 1.51 (0.87−2.64) 1.53 (0.88−2.69) 1.50 (0.82−2.76) Quartile 4 40 (7.9) 1.79 (1.002−3.19) 1.83 (1.01−3.33) 1.92 (1.03−3.60) MACE Quartile 1 31 (6.1) Reference Reference Reference Quartile 2 43 (8.5) 1.16 (0.71−1.91) 1.19 (0.72−1.95) 1.18 (0.71−1.97) Quartile 3 54 (10.6) 1.36 (0.85−2.17) 1.41 (0.88−2.26) 1.36 (0.82−2.26) Quartile 4 52 (10.3) 1.62 (1.004−2.61) 1.73 (1.04−2.87) 1.69 (1.003−2.84) All-cause death Quartile 1 28 (5.5) Reference Reference Reference Quartile 2 37 (7.2) 1.24 (0.75−2.06) 1.32 (0.79−2.20) 1.42 (0.82−2.44) Quartile 3 68 (13.4) 1.30 (0.83−2.04) 1.42 (0.90−2.26) 1.47 (0.89−2.42) Quartile 4 111 (21.8) 1.54 (1.01−2.36) 1.78 (1.13−2.82) 1.94 (1.18−3.18) Note. Model 1: Adjustments made for age and gender. Model 2: Adjustments made for age, gender, body mass index (BMI), drinker status, smoking status, history of hypertension, hyperlipidemia, diabetes, and hs-CRP. Bold HR (95% CI) indicates statistical significance. Lp-PLA2 = lipoprotein-associated phospholipase A2; MACE = Major adverse cardiovascular events; HR = hazard ratio; CI = confidence interval; hs-CRP = high-sensitivity C-reactive protein. Table 2. Association of serum Lp-PLA2 levels with outcomes in participants
-
In subgroup analyses (Table 3), when compared with participants in the lowest Lp-PLA2 quartile, an increased risk of composite outcome in the highest quartile was statistically significant in males [Q4 vs. Q1: HR 1.91 (1.27–2.88)] but not significant in females (Pinteraction = 0.01). In addition, a significant association was also observed in participants aged > 65 years [Q2 vs. Q1: HR 2.05 (1.01–4.13); Q3 vs. Q1: HR 2.68 (1.37–5.22); and Q4 vs. Q1: HR 2.78 (1.43–5.40)], but not significant in participants aged < 65 years (Pinteraction = 0.04). In subgroup analyses based on hs-CRP, a significant association was observed in participants with higher hs-CRP levels [Q3 vs. Q1: HR 1.68 (1.06–2.65); Q4 vs. Q1: HR 1.80 (1.14–2.83)] (Pinteraction = 0.02). Moreover, similar results were observed for all-cause death and MACE, but no significance for stroke outcomes (Supplementary Table S1, available in www.besjournal.com).
Characteristics Quartile 1 Quartile 2 Quartile 3 Quartile 4 P for
interactionn, % HR (95% CI) n, % HR (95% CI) n, % HR (95% CI) n, % HR (95% CI) Gender Males 46 (3.1) Reference 69 (4.6) 1.19 (0.79–1.80) 96 (6.4) 1.46 (0.98–2.17) 116 (7.8) 1.91 (1.27–2.88) 0.01 Females 9 (1.7) Reference 6 (1.1) 2.16 (0.62–7.52) 18 (3.4) 0.98 (0.35–2.74) 29 (5.4) 1.21 (0.46–3.16) Age (years) < 65 37 (2.7) Reference 42 (3.0) 0.99 (0.61–1.62) 46 (3.3) 0.94 (0.58–1.51) 34 (2.5) 1.58 (0.95–2.63) 0.04 ≥ 65 18 (2.8) Reference 33 (5.1) 2.05 (1.01–4.13) 68 (10.5) 2.68 (1.37–5.22) 111 (17.1) 2.78 (1.43–5.40) hs-CRP (mg/dL) < 1.0 20 (2.2) Reference 29 (3.2) 1.29 (0.68–2.45) 42 (4.6) 1.16 (0.63–2.11) 45 (5.0) 1.84 (0.98–1.01) 0.02 ≥ 1.0 35 (3.1) Reference 46 (4.1) 1.34 (0.82–2.17) 72 (6.4) 1.68 (1.06–2.65) 100 (8.9) 1.80 (1.14–2.83) Note. Adjustments made for age, gender, body mass index (BMI), drinker status, smoking status, history of hypertension, hyperlipidemia, diabetes, and hs-CRP. Bold HR (95% CI) and P value indicate statistical significance. Lp-PLA2 = lipoprotein-associated phospholipase A2; HR = hazard ratio; CI = confidence interval; hs-CRP = high-sensitivity C-reactive protein. Table 3. Subgroup analyses of serum Lp-PLA2 associations with composite endpoints based on gender, age, and hs-CRP
Characteristics Quartile 1 Quartile 2 Quartile 3 Quartile 4 P for
interactionn, % HR
(95% CI)n, % HR
(95% CI)n, % HR
(95% CI)n, % HR
(95% CI)Stroke Gender Males 20 (1.3) Reference 26 (1.7) 1.41 (0.70–2.84) 37 (2.5) 1.57 (0.80–3.09) 28 (1.9) 1.98 (0.96–4.08) 0.36 Females 2 (0.4) Reference 4 (0.8) 5.65 (0.59–54.1) 8 (1.5) 2.00 (0.30–13.1) 12 (2.2) 5.68 (0.62–52.5) Age (years) < 65 16 (1.2) Reference 22 (1.6) 1.05 (0.50–2.19) 26 (1.9) 1.05 (0.52–2.13) 16 (1.2) 1.37 (0.58–3.25) 0.06 ≥ 65 6 (0.9) Reference 8 (1.2) 2.02 (0.39–12.6) 19 (2.9) 1.35 (0.20–9.04) 24 (3.7) 2.26 (0.42–12.1) hs-CRP (mg/dL) < 1.0 10 (1.1) Reference 11 (1.2) 2.95 (1.09–8.00) 20 (2.2) 1.42 (0.56–3.59) 15 (1.7) 2.86 (1.03–7.94) 0.07 ≥ 1.0 12 (1.1) Reference 19 (1.7) 2.19 (0.84–5.73) 25 (2.2) 2.19 (0.85–5.68) 25 (2.2) 2.64 (1.03–6.78) MACE Gender Males 27 (1.8) Reference 39 (2.6) 1.21 (0.70–2.09) 46 (3.1) 1.47 (0.85–2.57) 37 (2.5) 1.90 (1.05–3.44) 0.10 Females 4 (0.8) Reference 4 (0.8) 1.32 (0.25–7.01) 8 (1.5) 0.50 (0.11–2.33) 15 (2.8) 0.50 (0.10–2.66) Age (years) < 65 25 (1.8) Reference 33 (2.3) 1.05 (0.58–1.92) 29 (2.1) 0.98 (0.54–1.78) 20 (1.5) 1.16 (0.57–2.36) 0.05 ≥ 65 6 (0.9) Reference 11 (1.7) 2.32 (0.54–9.92) 25 (3.9) 3.19 (0.68–15.0) 32 (4.9) 4.31 (1.01–18.4) hs-CRP (mg/dL) < 1.0 13 (1.4) Reference 16 (1.8) 1.88 (0.79–4.46) 23 (2.5) 1.57 (0.70–3.53) 20 (2.2) 1.54 (0.67–3.54) 0.06 ≥ 1.0 18 (1.6) Reference 27 (2.4) 1.26 (0.62–2.58) 31 (2.8) 1.44 (0.68–3.08) 32 (2.9) 2.08 (0.98–4.40) All-cause death Gender Males 21 (1.4) Reference 35 (2.3) 1.46 (0.80–2.71) 56 (3.8) 1.67 (0.93–2.98) 93 (6.2) 2.26 (1.27–4.03) 0.04 Females 7 (1.3) Reference 2 (0.4) 3.99 (0.45–35.3) 10 (1.9) 1.84 (0.45–7.49) 17 (3.2) 1.78 (0.53–5.98) Age (years) < 65 15 (1.1) Reference 12 (0.9) 1.28 (0.49–3.30) 18 (1.3) 0.92 (0.40–2.15) 17 (1.2) 2.18 (0.88–5.37) 0.30 ≥ 65 13 (2.0) Reference 25 (3.9) 2.09 (0.95–4.60) 48 (7.4) 2.44 (1.15–5.16) 93 (14.4) 2.27 (1.10–4.70) hs-CRP (mg/dL) < 1.0 7 (0.8) Reference 14 (1.5) 1.46 (0.39–5.46) 22 (2.4) 1.09 (0.31–3.86) 30 (3.3) 2.05 (0.57–7.35) 0.08 ≥ 1.0 21 (1.9) Reference 23 (2.1) 1.64 (0.85–3.15) 44 (3.9) 2.02 (1.11–3.65) 80 (7.1) 2.13 (1.20–3.79) Note. Adjustments made for age, gender, body mass index (BMI), drinker status, smoking status, history of hypertension, hyperlipidemia, diabetes, and hs-CRP. Bold HR (95% CI) and P value indicate statistical significance. Table S1. Subgroup analyses of serum Lp-PLA2 associations with stroke, MACE, and all-cause death
-
To the best of our knowledge, ours is the first study to investigate serum Lp-PLA2 associations with a risk of cardiovascular events in a Chinese population, with long-term follow-up. Over a median follow-up period of 9.1 years, composite events including, stroke, MI, and all-cause death occurred in 19.0% of participants. However, approximate 29.0% of participants in the Q4 Lp-PLA2 group experienced composite events. We also determined that higher Lp-PLA2 levels were statistically associated with an increased risk of composite endpoints, and also stroke, MACE, and all-cause death. In addition, Lp-PLA2 associations with composite endpoints were significantly modified by sex, age, and hs-CRP.
Participants with higher Lp-PLA2 levels (e.g., 4th quartile) had a higher cardiovascular event risk. With increasing Lp-PLA2 quartiles, the accumulated risk of cardiovascular events, including composite endpoint, stroke, MACE, and all-cause death, increased significantly during the median follow-up. Participants in the highest Lp-PLA2 quartile had an almost doubled risk of a future composite endpoint, stroke, MACE, and all-cause death when compared with those in the lowest quartile. Our findings agreed with previous studies suggesting that higher Lp-PLA2 levels were associated with an increased risk of cardiovascular events in other ethnicities[21-23]. However, the Multi-Ethnic Study of Atherosclerosis (MESA) study indicated an increased risk across different ethnicities, but not Chinese individuals, which contrasted with our data[24]. The limited number of incident CVD events among Chinese participants in the MESA study may have accounted for this inconsistency. In our study, our cohort was followed-up for a long period and had a relatively high incidence of outcomes. Also, the association of Lp-PLA2 with cardiovascular events was statistically significant. Hence, we suggest a strong association between higher Lp-PLA2 levels and a higher risk of cardiovascular event also exists in our middle-aged Chinese population, similar to other ethnicities. Furthermore, our findings agreed with other studies showing that elevated Lp-PLA2 levels were associated with a high risk of CVD in participants with coronary artery disease, or the high-stroke risk population[10,25].
From subgroup analyses, Lp-PLA2 associated with the risk of cardiovascular events was significantly modified by age and gender in our population. An increased risk of cardiovascular event with elevated serum Lp-PLA2 levels only existed in participants > 65 years. Our findings agreed with our previous study and other studies, including the Cardiovascular Health study and the Rancho Bernardo study[26-28]. In addition, the Lp-PLA2 association was only observed in males and not females. Several studies demonstrated a gender difference in both Lp-PLA2 levels and activity[12,21,22]. The Dallas Heart study reported an association between Lp-PLA2 levels and coronary artery calcification was only observed in men, not women[29]. Thus, combined, these findings suggested a gender difference in Lp-PLA2 associations with CVD and subclinical CVD. Estrogen may be associated with lower serum Lp-PLA2 expression and activity levels[30]. Hence, sex hormone effects may partly explain this gender difference. Nevertheless, limited numbers of incident CVD events in females may also be a potential reason for the lower statistical power in females. Furthermore, we also observed interaction term between hs-CRP and Lp-PLA2 level was statistically significant for composite endpoints. We previously reported a complementary effect of Lp-PLA2 and hs-CRP in carotid atherosclerosis[31]. In addition, previous studies proposed that Lp-PLA2 and hs-CRP may be complementary markers in identifying individuals with high coronary heart disease risk[21]. Hence, combining Lp-PLA2 and hs-CRP levels may provide a more accurate prediction of future cardiovascular events. For patients aged > 65 years with higher Lp-PLA2 levels, especially those combined with higher CRP levels, clinicians should recommend regular check-ups to reduce the risk of cardiovascular events.
AACE recommends 200 ng/mL Lp-PLA2 as a cut-off point to indicate patients with a higher risk of cardiovascular event[32]. In our study, participants with a median Lp-pLA2 level (141.0 ng/mL) or higher, had a higher event risk than the whole population. Ethnicity differences with respect to inflammatory biomarkers, including Lp-PLA2, were previously documented[12,33,34]. In addition, our findings were consistent with a previous Chinese multicenter study which investigated normal Lp-PLA2 reference intervals in a Chinese population aged > 50 years[35]. Similar Lp-PLA2 levels were also observed in a Japanese population[36]. Thus, risk underestimations for future cardiovascular events may occur in Chinese and/or Asian population when using Lp-pLA2 guidelines from European and American populations. However, while we recruited our population from Northern China, it remains to be seen if this group represents baseline levels for the whole Chinese population. Therefore, Lp-PLA2 cut-off values must be identified for cardiovascular event risk for Chinese and/or Asian populations.
This study had several limitations. Firstly, we only accessed all-cause death events rather than classified deaths into cardiovascular or non-cardiovascular, thus we were unable to estimate Lp-PLA2 associations with cardiac mortality. Secondly, we only measured Lp-PLA2 levels at baseline, thus we may have overlooked dynamic changes in Lp-PLA2 levels over time. Finally, most participants were restricted to one community, therefore, our ability to generalize our results to other populations is limited.
Higher Lp-PLA2 levels were significantly associated with an increased risk of cardiovascular events/death in a middle-aged Chinese population. The Lp-PLA2 cut-off point may be lower in Chinese and/or Asian populations for predicting cardiovascular events.
-
The authors thank the survey teams of the study groups for their contribution and also the participants who contributed their time and information.
HTML
Study Design and Population
Baseline Data Collection
Serum Lp-PLA2 Measurements
Outcome Measures
Statistical Analysis
Participant Characteristics
Outcome Measures in Participant Groups of Lp-PLA2 during Follow-up
Association of Lp-PLA2 with Outcomes
Subgroup Analyses
 21315Supplementary Materials.pdf
|

|

 Quick Links
 DownLoad: