


-
Carbon monoxide (CO) is a colorless, odorless, and tasteless gas that is commonly generated from the incomplete combustion of hydrocarbons [1, 2]. Because CO’s affinity toward hemoglobin molecules is nearly 200-fold greater than that of oxygen, carboxyhemoglobin forms through the replacement of bound oxygen by CO [3], even when only small volumes of CO are dissolved in the blood. When the CO/oxygen concentration is 0.4 at 50% saturation of the heme compound, CO readily binds myoglobin [4]. In this process, carbon monoxide poisoning (COP) occurs, together with toxic effects of CO ranging from subtle cardiovascular and respiratory effects to neuropsychiatric presentations and other systemic complications, or even fatality [5]. After acute COP, permanent neurological sequelae and delayed neurological sequelae may occur, and these symptoms frequently contribute to morbidity [6].
Globally, the estimated incidence rate of COP is 137 cases per million people, and the mortality rate is 4.6 deaths per million people. COP remains among the most common types of acute and fatal poisoning in many countries, thus raising substantial concerns [7, 8]. Previous researchers have found that the epidemiological features of COP vary among countries. In the United States, COP is responsible for an estimated 21,000 unintentional nonfire-related emergency department visits, 2,300 hospitalizations, and 500 deaths annually. The country has observed a decreasing COP mortality trend from 1990 to 2017. A similar phenomenon has also been observed in the United Kingdom and other developed countries [2, 9-11]. In contrast, some developing countries, such as Iran, show a stable or an increasing trend [12]. Worldwide, more than half of patients with COP are men, who tend to use CO-emitting equipment more frequently than women [13, 14]. Most deaths occur between the ages of 15 and 49 years [15]. In southern sub-Saharan Africa, the largest proportion of deaths occur among people < 5 and 15–49 years of age [16]. In China, owing to its vast land area spanning multiple time zones, rates of COP vary among regions. In Shenyang city, north-east China, COP was responsible for 11.4% of acute poisoning cases from 2012 to 2016[17]. In the central region of China, such as the representative city of Wuhan, 156 deaths were caused by COP, with an average annual death rate of 0.492 per million people during 2009–2014[18]. Beyond geography and economics, COP also exhibits temporal variations, with a high incidence in winter. For example, it peaks in December in England [19]. These findings have been used to design strategies for COP prevention tailored to many countries, and the measurement has achieved good results.
However, previous studies have focused primarily on western or developed regions. Guangdong province, in southern China, has a different economy, climate, and cultural environment from western areas. Consequently, the aforementioned measures may not be applicable to Guangdong. Therefore, the aim of this study was to analyze the characteristics of hospital admission data for patients with COP in Guangdong province, a typical subtropical region, from 2013 to 2020, and to explore feasible preventive intervention measures.
-
Guangdong province was selected as our study site. Located in southern China, it has an area of approximately 179.8 thousand square kilometers, occupies approximately 1.87% of the country’s land area, and had a population of 115 million people in 2020. The entire territory is located between 20°09'−25°31' north latitude and 109°45'–117°20' east longitude, and the Tropic of Cancer traverses the central part of the province. Guangdong province has a subtropical climate characterized by a uniform temperature and high humidity. Summer is long, and winter is short. The average annual temperature is 21.8 ℃. Guangdong does not receive snow all year round. Except in extreme weather conditions, the temperature in Shaoguan city, the northernmost city of Guangdong, can be below 0 ℃. The economic development of Guangdong province varies; for example, the Pearl River Delta is an economically developed region, whereas northern and western Guangdong are relatively poor.
-
Data on cases of COP were collected from the home page data on hospital records of admissions from January 2013 to December 2020. These data were obtained from the Guangdong Province health statistics network direct reporting system, containing medical institutions at all levels [20, 21]. The average temperature data for the study period were downloaded through the China Meteorological Data Sharing Service System [22].
We defined COP according to the code in the 10th revision of the International Classification of Diseases of T58, which indicates a diagnosis of toxic effects of CO from all sources. If T58 was listed in any diagnosis (e.g., primary diagnosis, secondary, or tertiary) field, we included the hospital admission data in our study. Multiple admissions of the same patient were considered to be cases exposed to the same emission source. Using the encrypted ID number for each patient, we deleted duplicate entries.
Demographic data included sex, age, employment information, treatment outcome, medical payment method, and type of exposure. The employment information was classified as civil servant, professional technology personnel, business manager, worker, farmer, student, self-employed, unemployed, or other. Under the classification rules for inpatient records, the treatment outcome was classified as discharge from hospital with doctors’ orders, referral to another hospital, referral to a community health service organization, leaving against medical advice, death, or other. According to the existing medical payment methods in China, medical payments were divided into the following categories: basic medical insurance for urban employees, basic medical insurance for urban residents, new rural cooperative medical care, poverty relief, commercial medical insurance, full public expense, full fee, other social insurance, or other methods. The types of COP were classified into unintentional, intentional, and unknown types.
We considered the crude rates (CR) for hospital admission rate, expressed as the number of cases per 100,000 people. Because this study used only anonymous inpatient records and did not involve the collection, use, or transmittal of individually identifiable data, Institutional Review Board approval to conduct this study was unnecessary. We calculated age-adjusted and sex-adjusted hospital admission rates with 95% confidence intervals, using the 2020 population of China as the reference.
-
Spatial autocorrelation analysis was conducted to identify the spatial clustering of annual COP hospitalization rates in all 124 counties (including Dongguan city and Zhongshan city). The row standardized first-order contiguity Queen neighbors were used as the criterion for identifying neighbors. Moran’s I, ranging from −1 to +1, was calculated to test the spatial autocorrelation of all counties in Guangdong province. Positive/negative spatial autocorrelation occurred when Moran’s I was close to +1/−1, thus indicating that areas with similar (high-high or low-low)/dissimilar (high-low or low-high) hospital admission rates of COP clustered together. Monte Carlo randomization (9,999 permutations) was used to assess the significance of Moran’s I, with a null hypothesis that the distribution of COP in Guangdong province was completely spatially random. Subsequently, we used local indicators of spatial association (LISA; Local Moran’s I) analysis and a Moran scatter plot to examine the spatial autocorrelation of each county in Guangdong province and to determine the locations of the clusters. Moran’s plot showed high-high and low-low clustering in the upper right and lower left quadrants, respectively. Statistically significant high-high, low-low, and outlier local clusters (high-low and low-high) were visualized with a cluster map with county boundaries.
The spatially stratified heterogeneity of average COP hospitalization rates in four regions of Guangdong from 2013 to 2020 was explored. The division of these four regions in Guangdong Province (eastern Guangdong, western Guangdong, the Pearl River Delta, and northern Guangdong) was based on the official classification of the Guangdong government according to local geographical and human characteristics. Spatially stratified heterogeneity was measured with the GeoDetector q statistic [23], which indicates the level of spatially stratified heterogeneity in a range from 0 to 1, with 0 indicating random distribution and 1 indicating strong heterogeneity between strata.
-
A time series is defined as a set of data ordered by time. Through time series analysis, data ordered by time can reveal a clear description of the features of a series and present the future values of the series [24]. According to time series decomposition theory, we split the time series into three parts: trend changes, periodic changes, and random changes. The simple mathematical relationship of the model is as follows:
$$ {X}_{t}={S}_{t}\times{T}_{t}\times{I}_{t} $$ (1) here, St, Tt, and It represent seasonal information, trend information, and random fluctuation information, respectively [25]. Through decomposition of the time series, the seasonal information was collected to calculate seasonal indices, and a seasonal index distribution chart and radar chart were drawn. Meanwhile, concentration ratios (M) were calculated.
-
The nonlinear exposure-response relationship between the disease and temperature, as well as the delayed effect of that relationship, was calculated via the distributed lag nonlinear model (DLNM), in which relationships between predictors and lags were quantified on a cross-basis [26]. As in previous studies, the DLNM was used to quantify the relationships between daily temperature and the hospital admission ratio of COP [27]. The model was expressed as follows:
$$ Log\left[E\left({Y}_{t}\right)\right]=\alpha +\beta {Temp}_{t,l}+NS\left({Time}_{t},\frac{7}{year}\right)+\gamma {Dow}_{t} $$ (2) where E denotes the mathematical expectation; Yt denotes the hospital admission ratio of COP at day t; α denotes a constant term;
$\beta $ denotes the vector of temperature history in the study period; and Tempt, l denotes the matrix for quantifying the nonlinear lag effects of the mean temperatures, in which l denotes the lag time. Temperature trends were modeled by a natural spline function with a degree of freedom (df) of 7 per year. Day of the week, denoted by the variable DOW, was included to adjust for weekly patterns. Relative risk (RR) values for different temperatures were obtained on the basis of the median daily temperature. To capture the overall temperature effects, l was set to 21 days. The df was determined by Akaike’s information criterion. To assess the robustness of the model, sensitivity analyses were performed by testing different df values. -
A total of 48,854 cases of COP were recorded from January 1, 2013 to December 31, 2020 in Guangdong province, China.
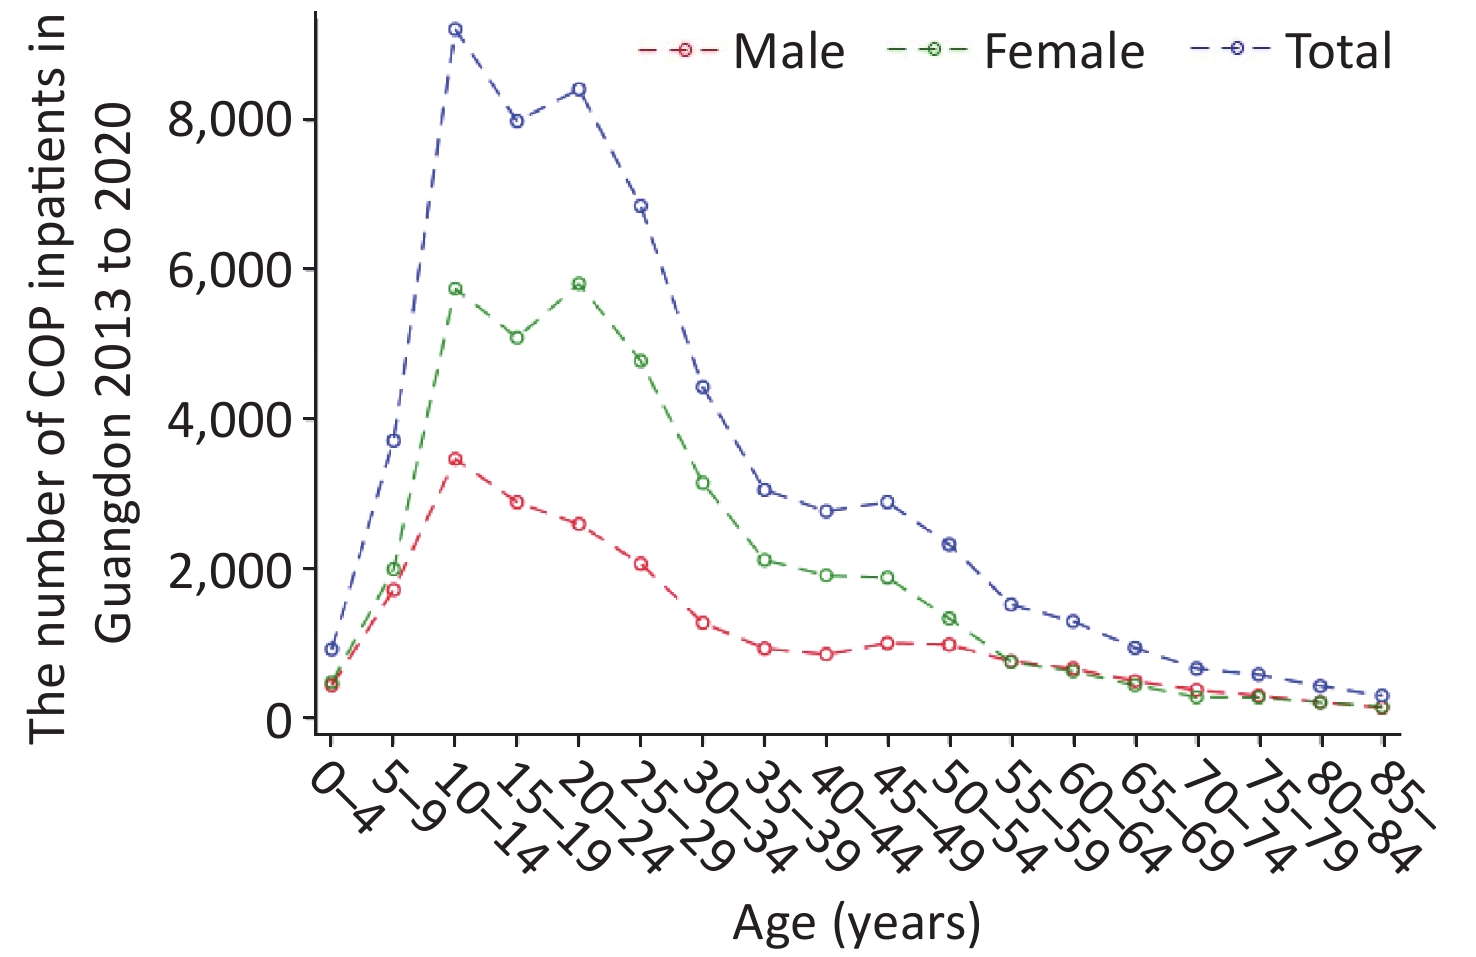
As shown in Table 1, the highest CRs (10.83/105) were found in the age group of 0−14 years of age in 2018, and CRs in the age group of 0−14 years of age were higher than those in the other age groups in 2013−2020. Of these patients, 17,816 (36.47%) were male, and 31,038 (63.53%) were female. The sex ratio (male to female) was 1:1.74. The CRs and standardized rates in females were always higher than those in males in 2013–2020. As shown in Figure 1, patients between 10 and 19 years of age accounted for the largest proportion (approximately 29.42%) of patients with COP, whereas patients 20−29 years of age were the second most populous age group, at approximately 26.18%. With regard to the distribution of age and sex, we observed two peaks of inpatient number in females, at 10−14 years of age and 20−24 years of age. However, the inpatient number in males showed only one peak, in the 10–14 age group.
Category 2013 2014 2015 2016 2017 2018 2019 2020 N CR (per
100,000)SR
(95%
CI)N CR (per
100,000)SR
(95%
CI)N CR (per
100,000)SR
(95%
CI)N CR (per
100,000)SR
(95%
CI)N CR (per
100,000)SR
(95%
CI)N CR (per
100,000)SR
(95%
CI)N CR (per
100,000)SR
(95%
CI)N CR (per
100,000)SR
(95%
CI)All 3,498 — — 5,212 — — 4,682 — — 9,145 — — 6,352 — — 9,224 — — 5,173 — — 5,568 — — Age (years) 0–14 610 3.91 0.70
(0.70; 0.71)835 5.06 0.91
(0.91; 0.91)901 4.78 0.86
(0.85; 0.86)1,750 9.24 1.66
(1.65; 1.66)1,393 7.25 1.3
(1.3; 1.31)2,112 10.83 1.94
(1.94; 1.95)1,252 6.68 1.2
(1.19; 1.2)1,518 6.39 1.15
(1.14; 1.15)15–64 2,752 3.34 2.3
(2.29; 2.3)4,136 5.05 3.46
(3.46; 3.47)3,592 4.47 3.06
(3.06; 3.06)6,977 8.55 5.86
(5.85; 5.86)4,674 5.64 3.87
(3.86; 3.87)6,647 7.9 5.41
(5.41; 5.42)3,614 4.2 2.88
(2.87; 2.88)3,755 4.11 2.81
(2.81; 2.82)65– 136 1.56 0.21
(0.21; 0.21)241 2.72 0.37
(0.36; 0.37)189 2.05 0.28
(0.27; 0.28)418 4.45 0.6
(0.6; 0.6)285 2.96 0.4
(0.4; 0.4)465 4.75 0.64
(0.64; 0.65)307 2.96 0.4
(0.4; 0.4)295 2.73 0.37
(0.37; 0.37)Gender Male 1,335 2.41 1.23
(1.21; 1.26)1,926 3.39 1.74
(1.71; 1.77)1,721 3.03 1.55
(1.53; 1.58)3,384 5.87 3.01
(2.97; 3.05)2303 3.93 2.01
(1.98; 2.05)3,354 5.67 2.9
(2.86; 2.94)1,851 3.07 1.57
(1.55; 1.6)1,942 2.9 1.49
(1.46; 1.52)Female 2,163 4.24 2.07
(2.03; 2.1)3,286 6.51 3.17
(3.13; 3.22)2,961 5.72 2.79
(2.75; 2.83)5,761 11 5.37
(5.31; 5.42)4,049 7.63 3.72
(3.68; 3.77)5,870 10.82 5.28
(5.22; 5.33)3,322 6.04 2.95
(2.91; 2.99)3,626 6.13 2.99
(2.95; 3.03)Note. N, number of inpatients; CR, cruel rate; SR, standard rate; 95% CI, 95% confidence interval; COP, carbon monoxide poisoning. Table 1. Demographic characteristics of COP cases in Guangdong province from 2013 to 2020
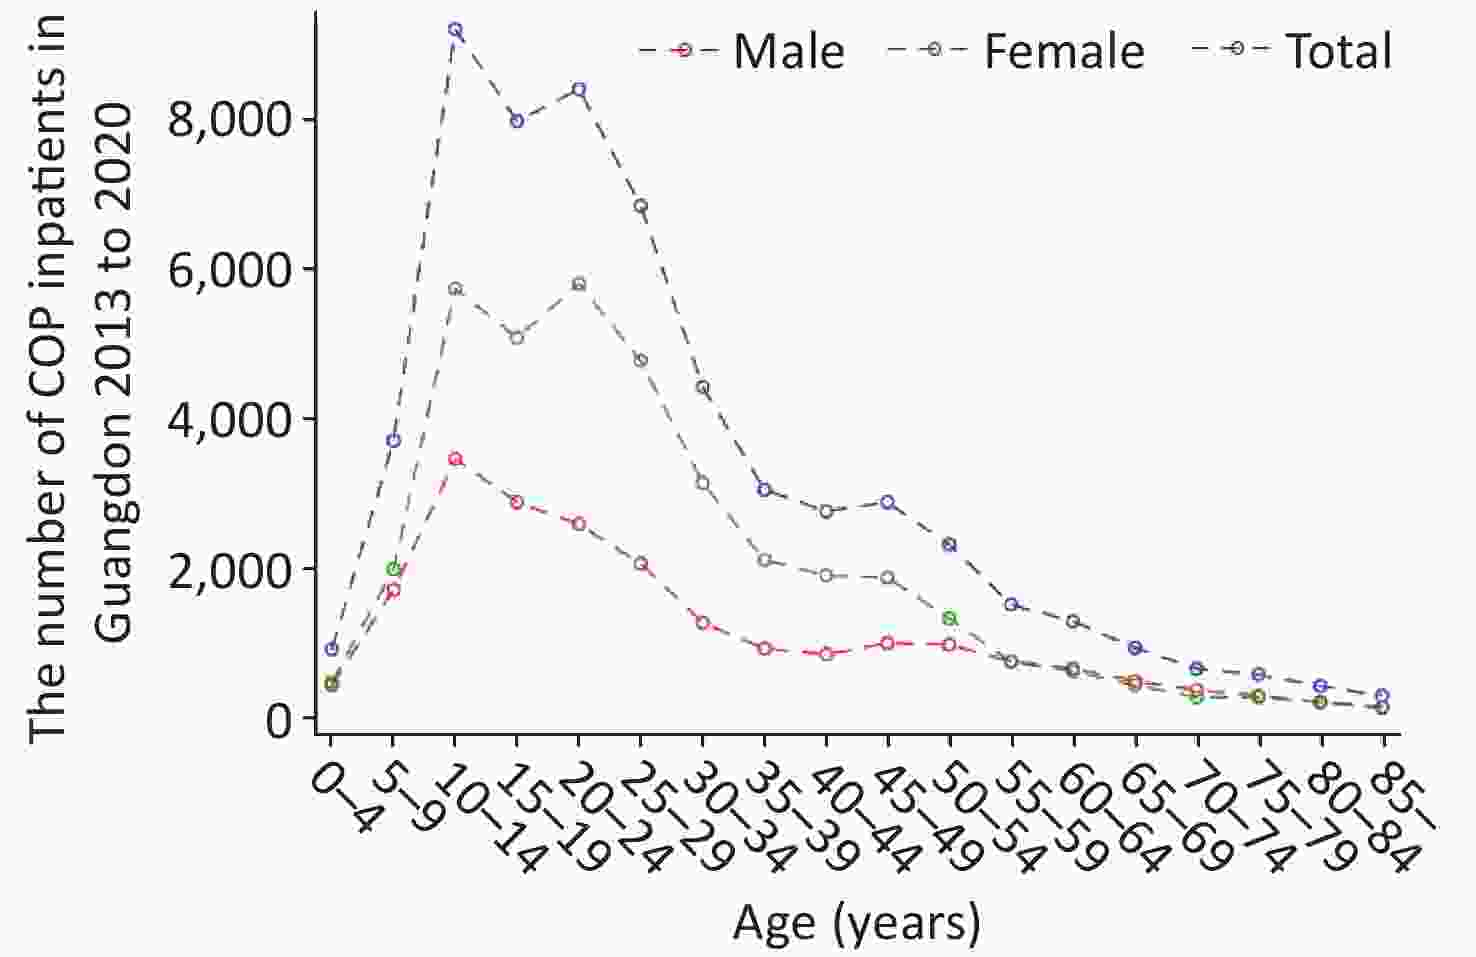
Figure 1. Distribution of carbon monoxide poisoning (COP) among inpatients by age and sex in Guangdong.
Among these COP cases, students (10,981 cases), farmers (9,524 cases), and unemployed people (8,723 cases) were the main populations among patients with COP, accounting for 22.5%, 19.5%, and 17.9%, respectively. The most used medical payment method was payment of full medical fees (approximately 37.6%). Most COP outcomes were discharge from the hospital with doctors’ orders, at 74.4%. Leaving against medical advice was the second most common outcome (11,515 cases, 23.6%). Of note, unintentional COP accounted for the majority of cases (88.1%), and intentional COP and COP due to unknown reasons accounted for 3.2% and 8.6%, respectively.
-
As shown in Figure 2, the high hospital admission rates for COP were concentrated in the northern areas of cities in Guangdong province, such as Shaoguan and Meizhou. Meanwhile, the areas with low hospital admission rates were mainly concentrated in two types of cities: well-developed cities, such as Guangzhou and Shenzhen, and cities in the south of Guangdong, such as Zhanjiang. The three counties with the highest COP annual hospital admission rates were Jiaoling (33.01/105), Wengyuan (32.57/105), and Lianshan (31.57/105). The counties with the lowest COP annual hospital admission rates were Longhua (0.02/105), Pingshan (0.03/105), and Guangming (0.09/105).
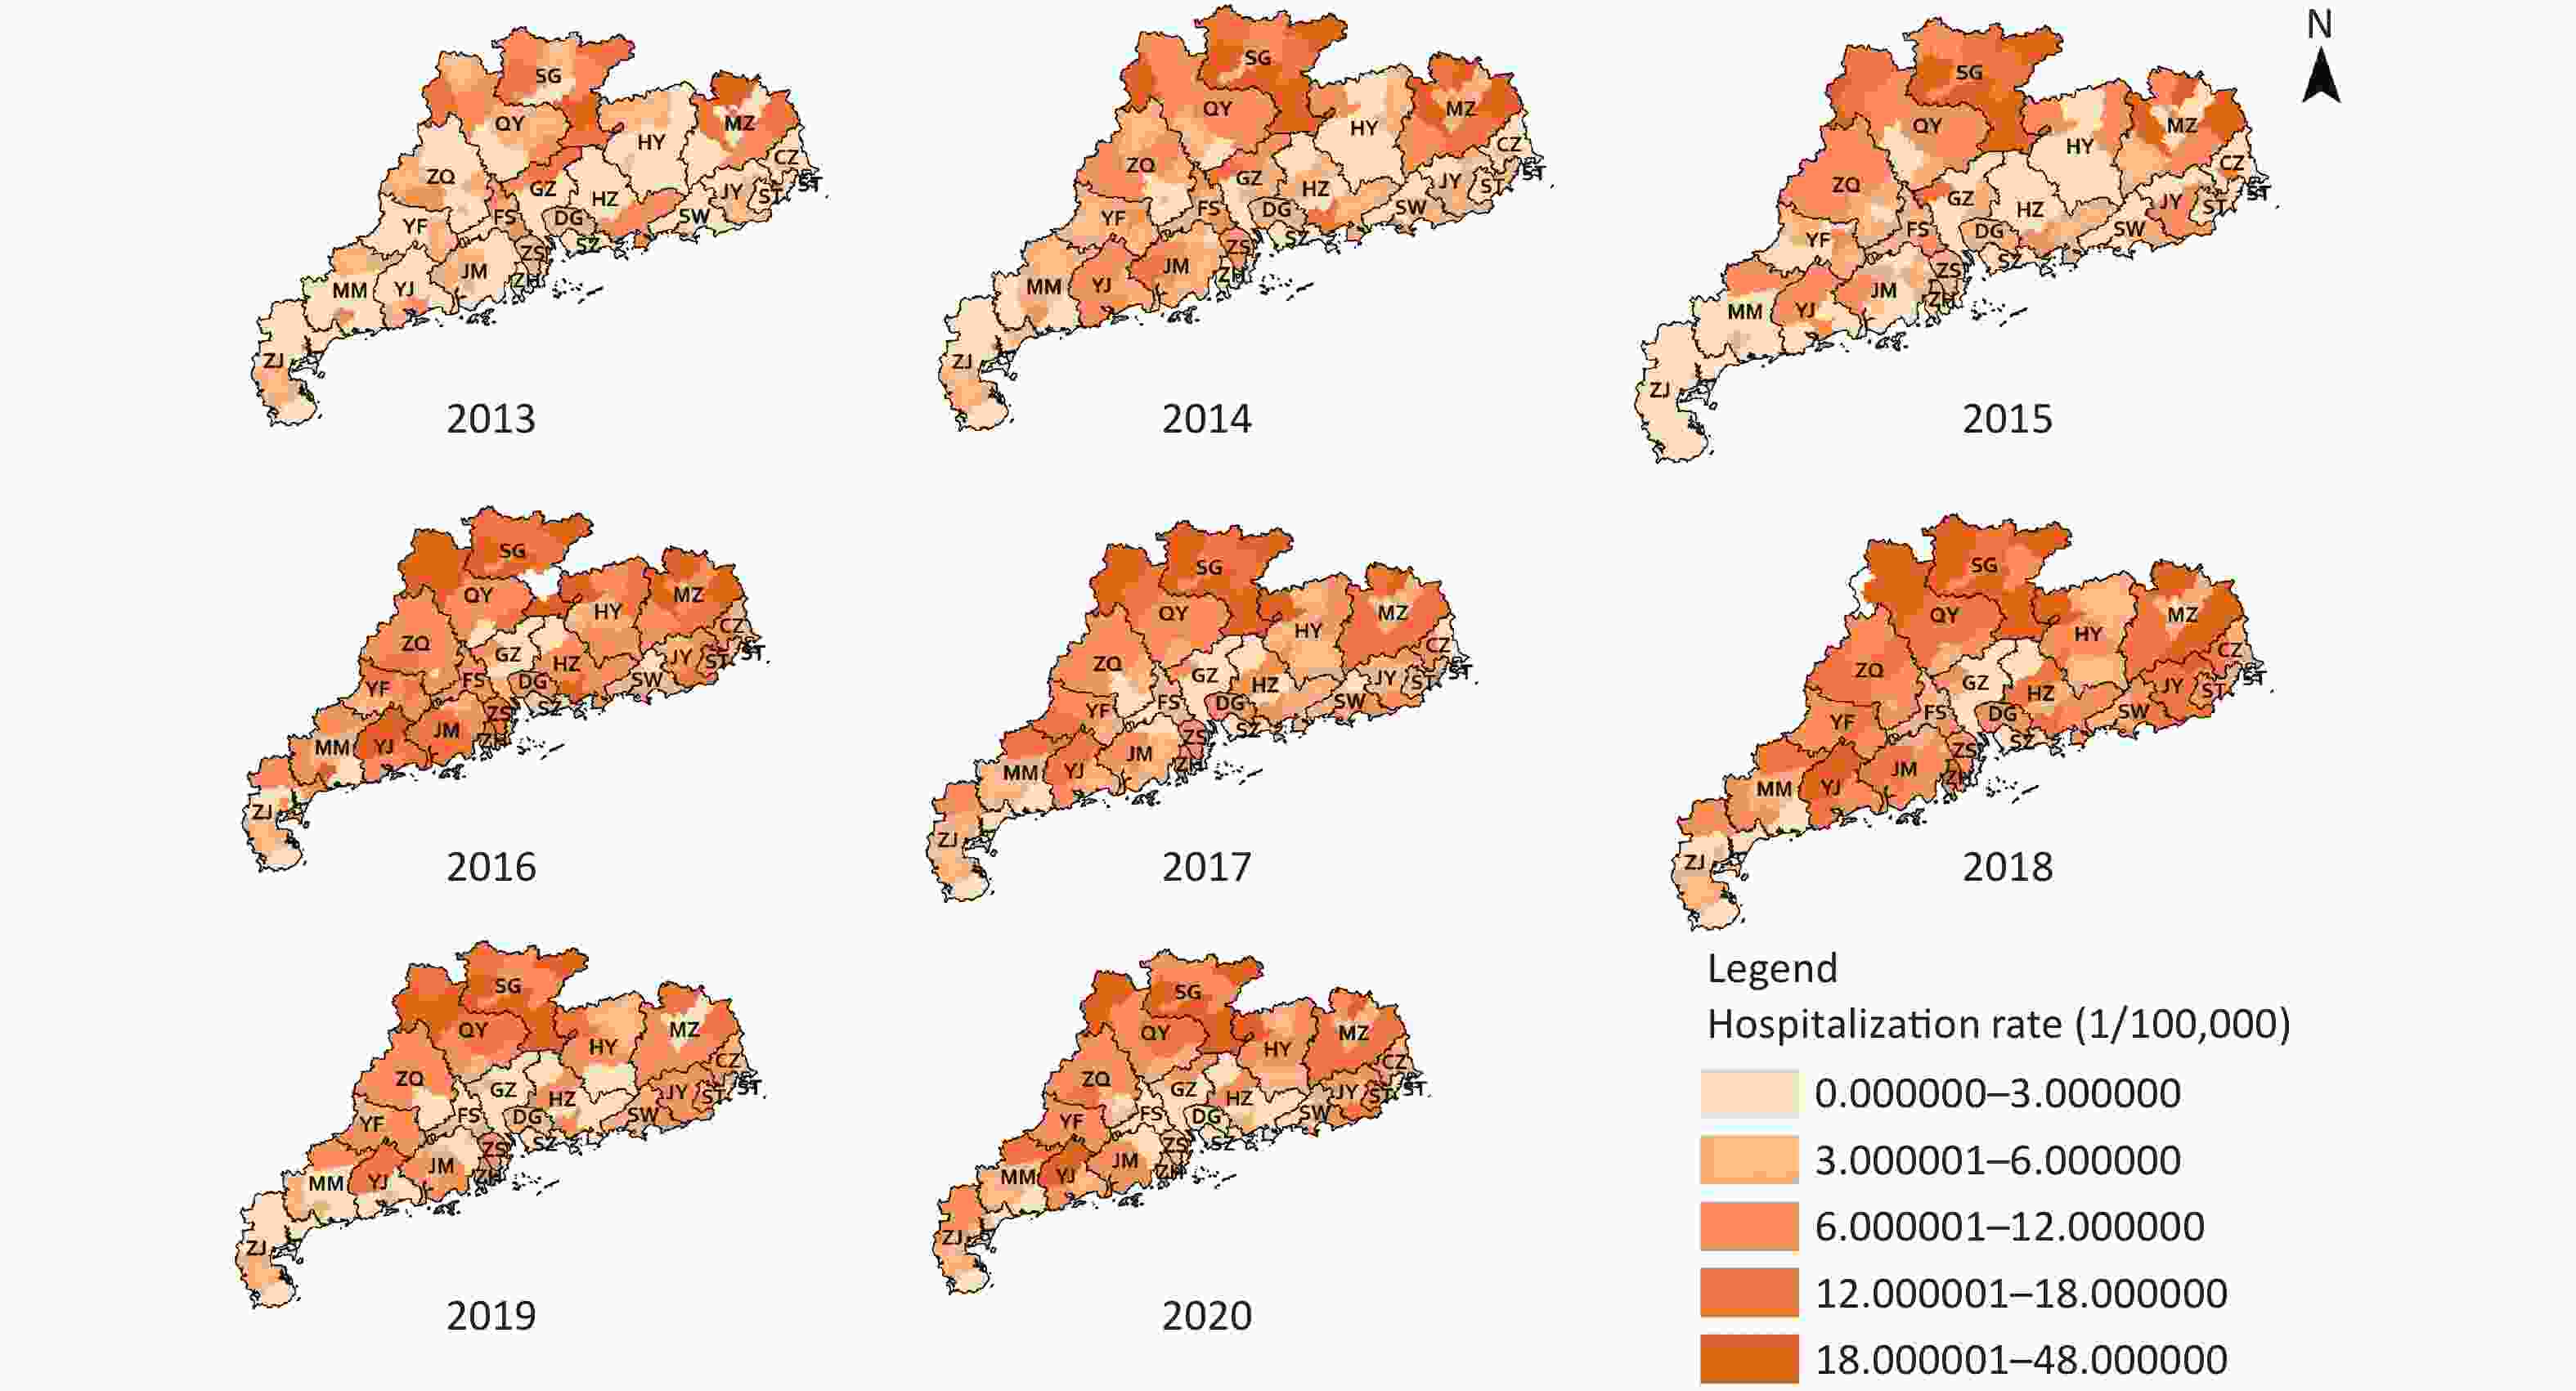
Figure 2. Annual hospital admission rates for carbon monoxide poisoning (COP) in Guangdong. GZ, Guangzhou; SG, Shaoguan; SZ, Shenzhen; ZH, Zhuhai; ST, Shantou; FS, Foshan; JM, Jiangmen; ZJ, Zhanjiang; MM, Maoming; ZQ, Zhaoqin; HZ, Huizhou; SW, Shanwei; HY, Heyuan; YJ, Yangjiang; QY, Qingyuan; DG, Dongguan; ZS, Zhongshan; CZ, Chaozhou; JY, Jieyang; YF, Yunfu.
-
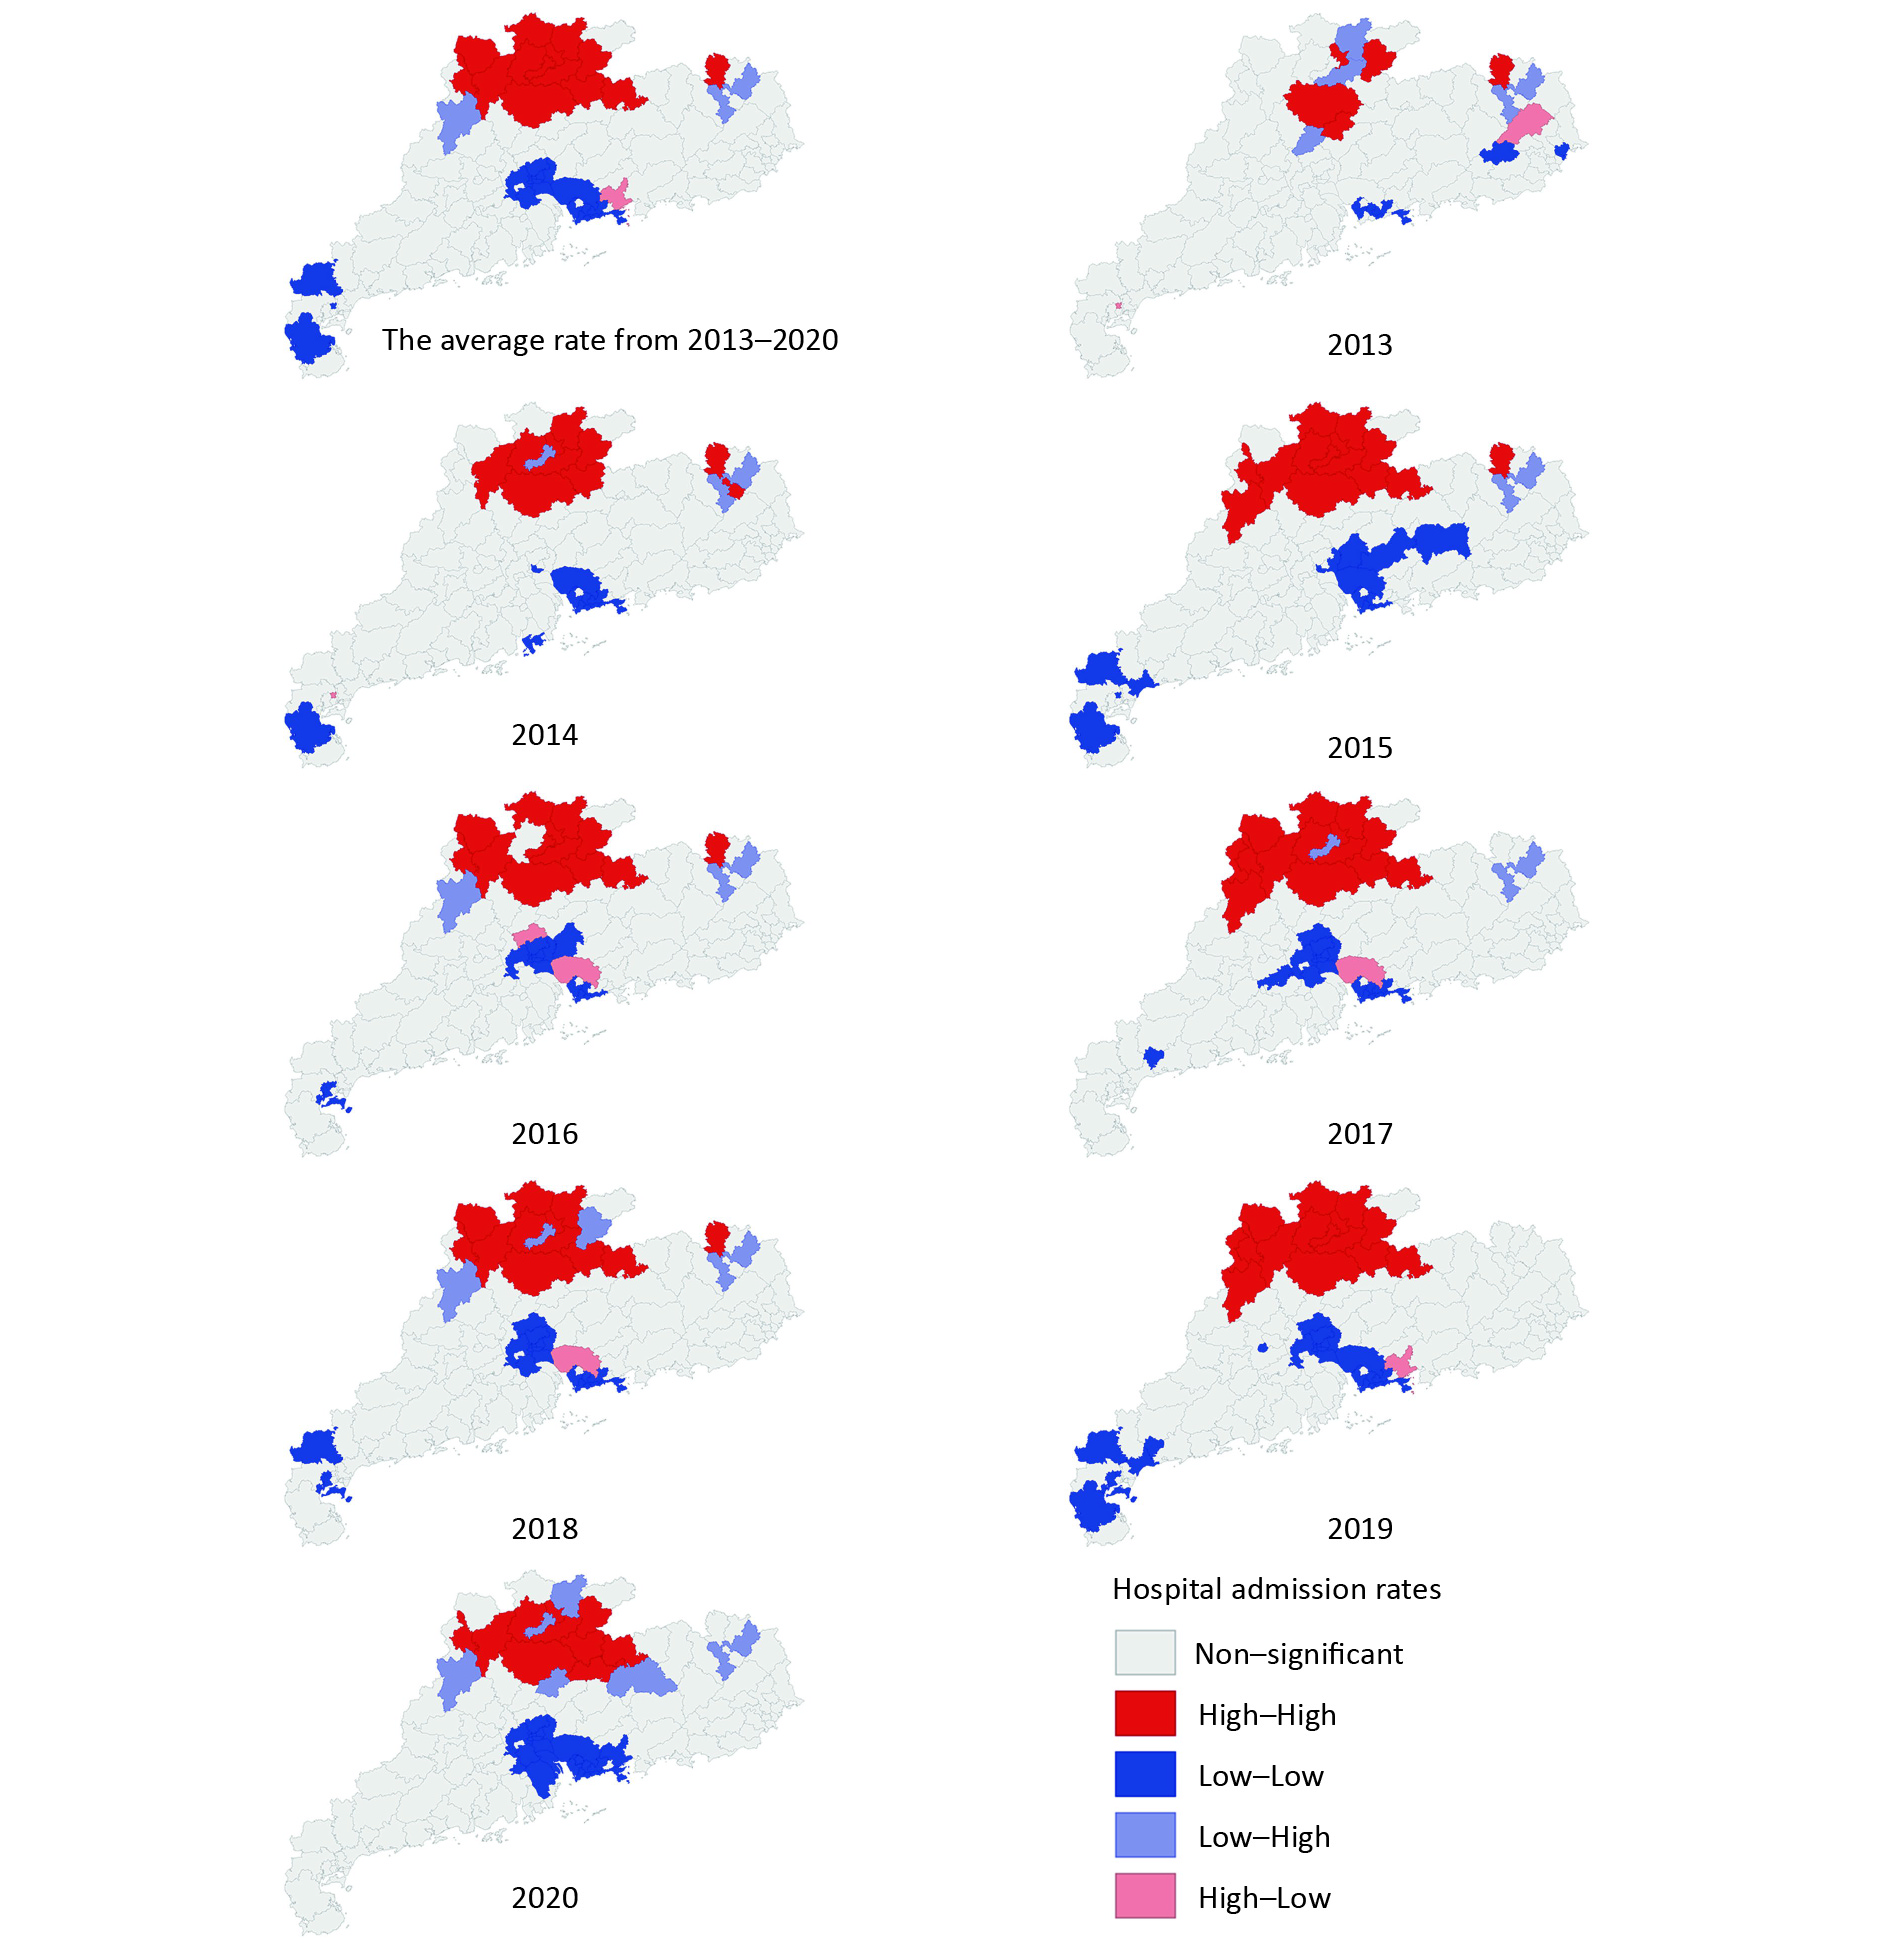
The counties with high COP hospital admission rates tended to be adjacent to districts with high COP hospital admission rates, and the counties with low COP hospital admission rates tended to be adjacent to districts with low COP hospital admission rates, according to global Moran’s I values ranging from 0.23−0.53 (all P-values < 0.05). The global Moran’s I value of average annual hospital admission rates for COP was 0.447. In LISA analysis, 14 counties showed significant high-high spatial clustering, and 20 counties showed significant low-low spatial clustering in the 8-year period. The high-high spatial clustering area was mainly concentrated around the cities of Shaoguan and Qingyuan, with average annual hospital admission rates of 19.65/105 and 14.82/105, respectively. Foshan, Guangzhou, Dongguan, and Shenzhen, around the Pearl River Delta were the areas with low-low spatial clustering, with average annual hospital admission rates of 4.21/105, 2.51/105, 5.18/105, and 0.70/105, respectively (Supplementary Figure S1, available in www.besjournal.com). The overall classification of Guangdong’s COP risk from 2013 to 2020 was non-homogeneous, and the q value was 0.38 according to GeoDetector.

Figure S1. LISA cluster map for annual COP hospital admission rates in Guangdong, China, 2013–2020. COP: carbon monoxide poisoning.
-
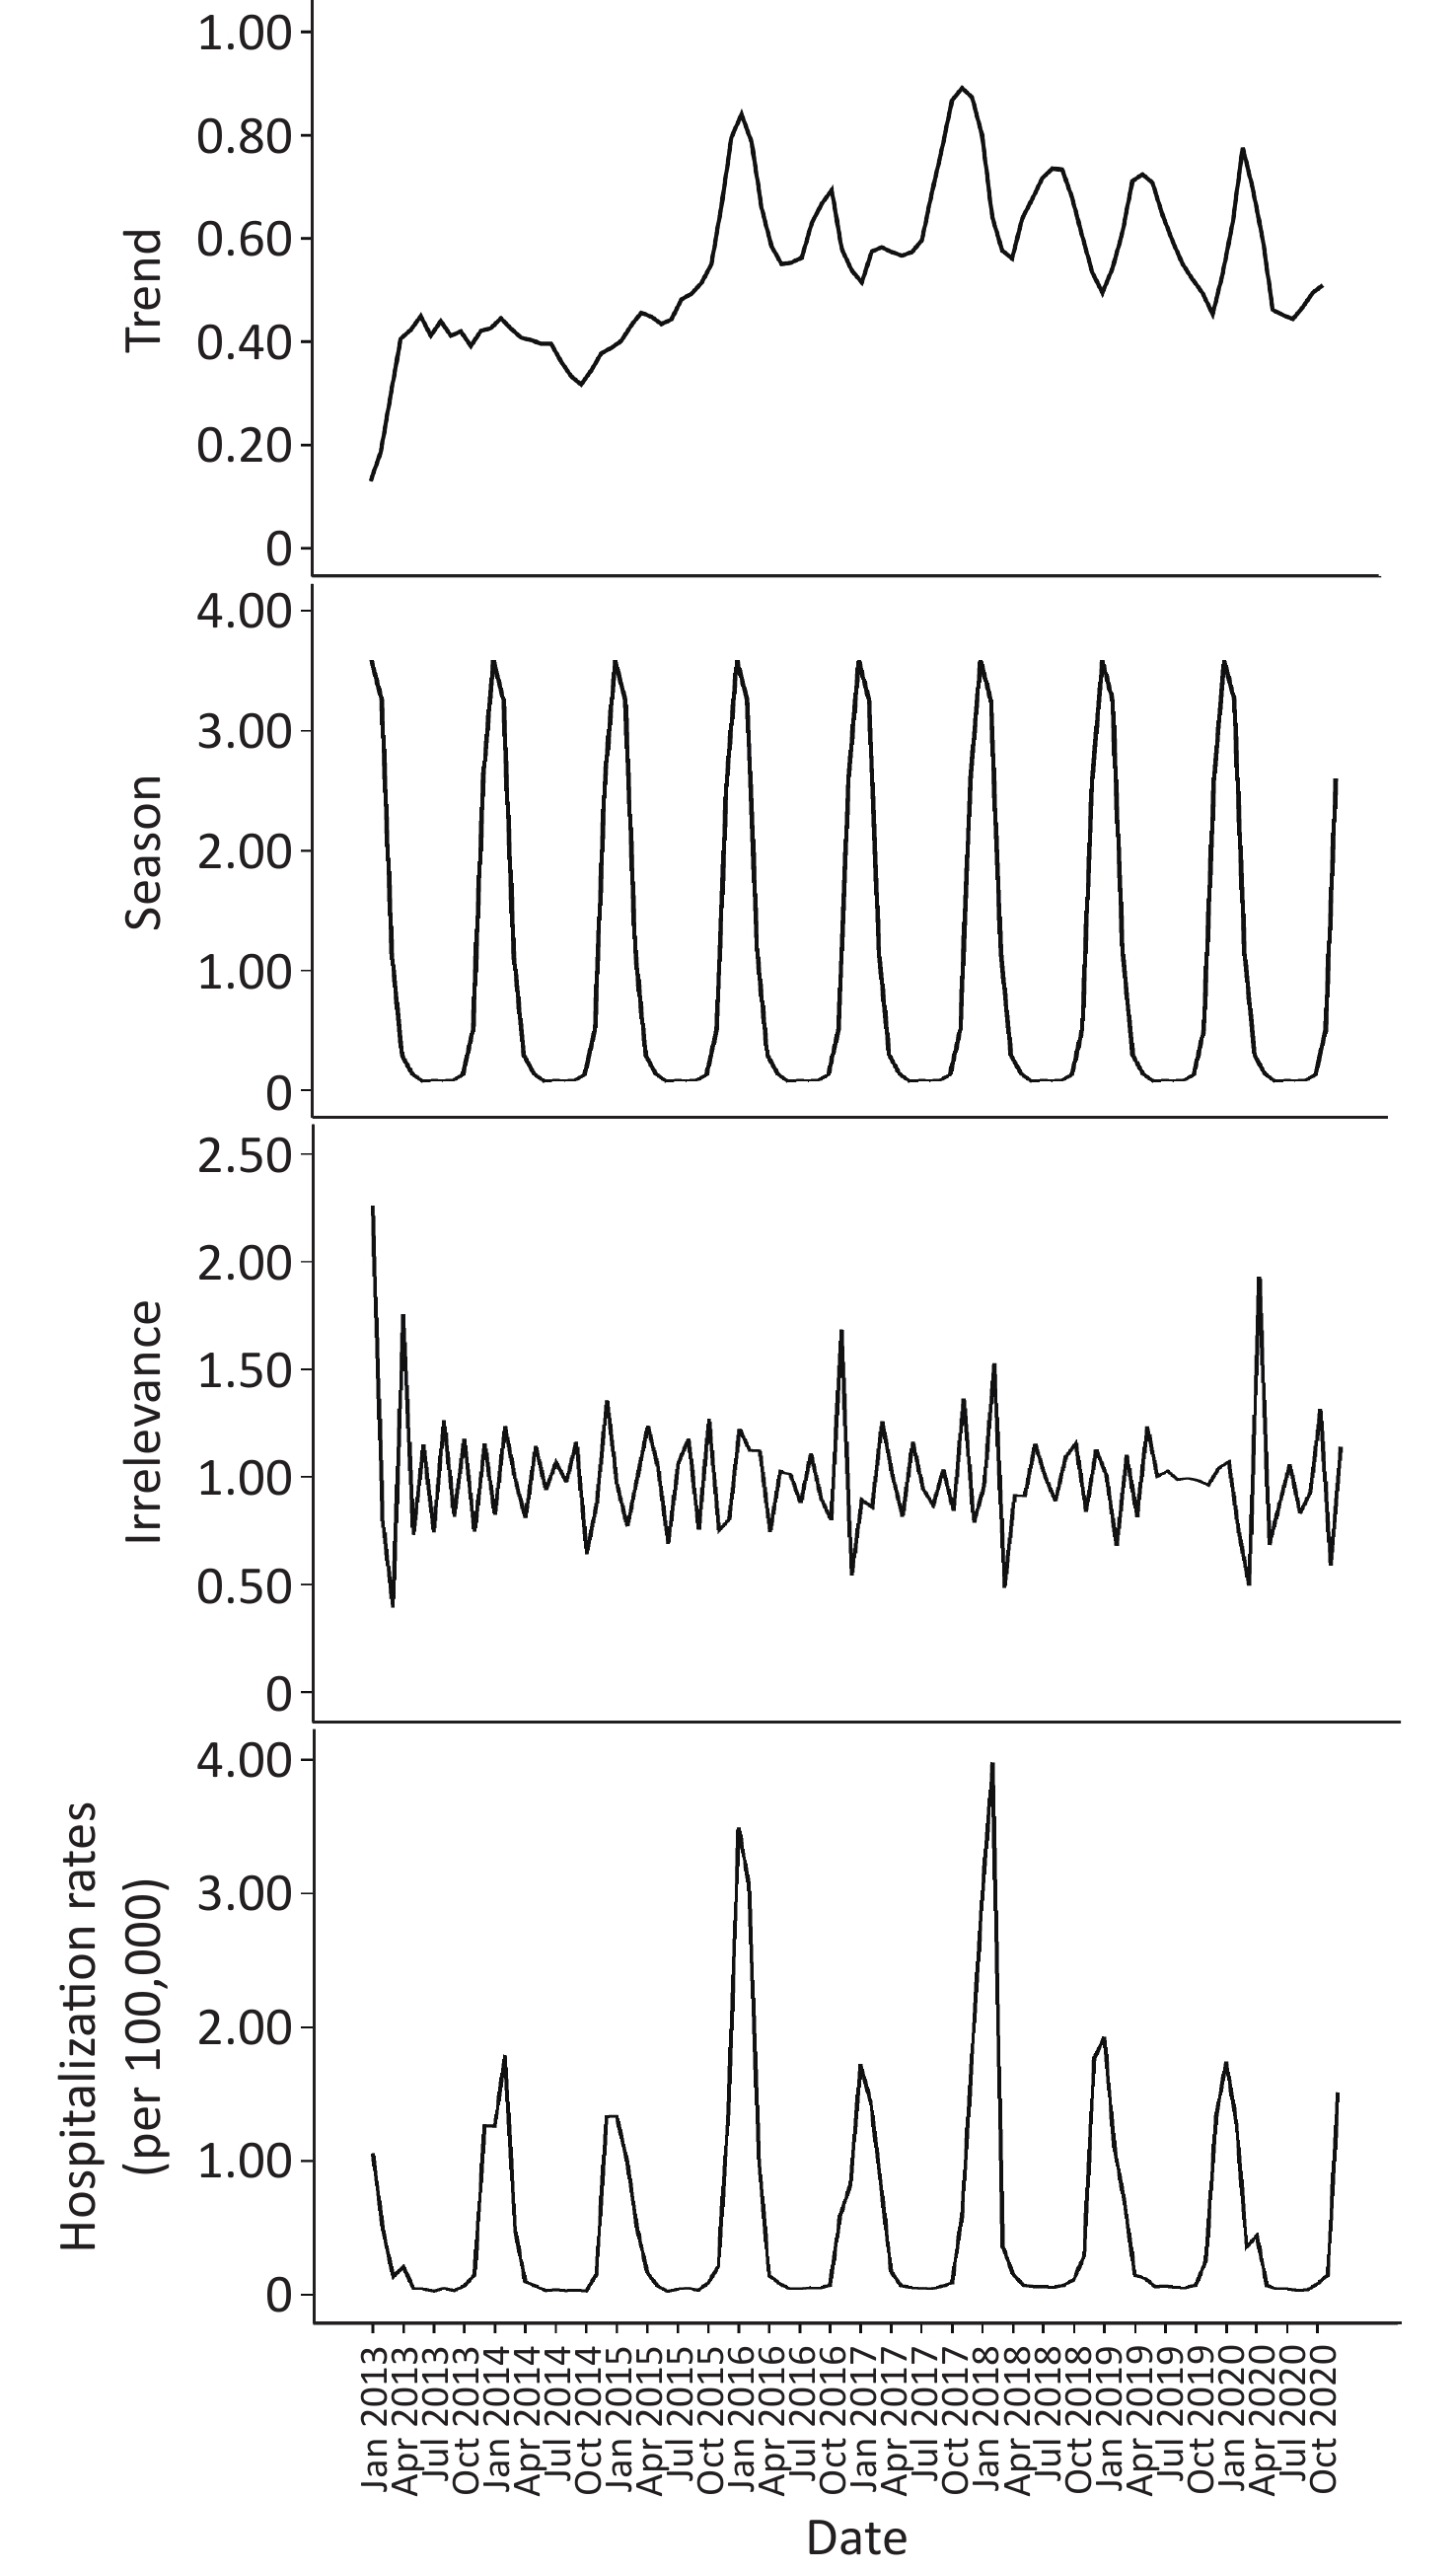
As shown in Figure 3, the trend characteristics of the time series remained stable from 2013 to 2015 and remained steady after a rapid increase in 2016. On the basis of the seasonal information and random fluctuation information of the time series indicated in the chart, the hospital admission rates for COP in Guangdong province showed significant periodicity and white noise in random fluctuation.

Figure 3. Seasonal decomposition of time series in carbon monoxide poisoning (COP) in Guangdong, China, 2013–2020.
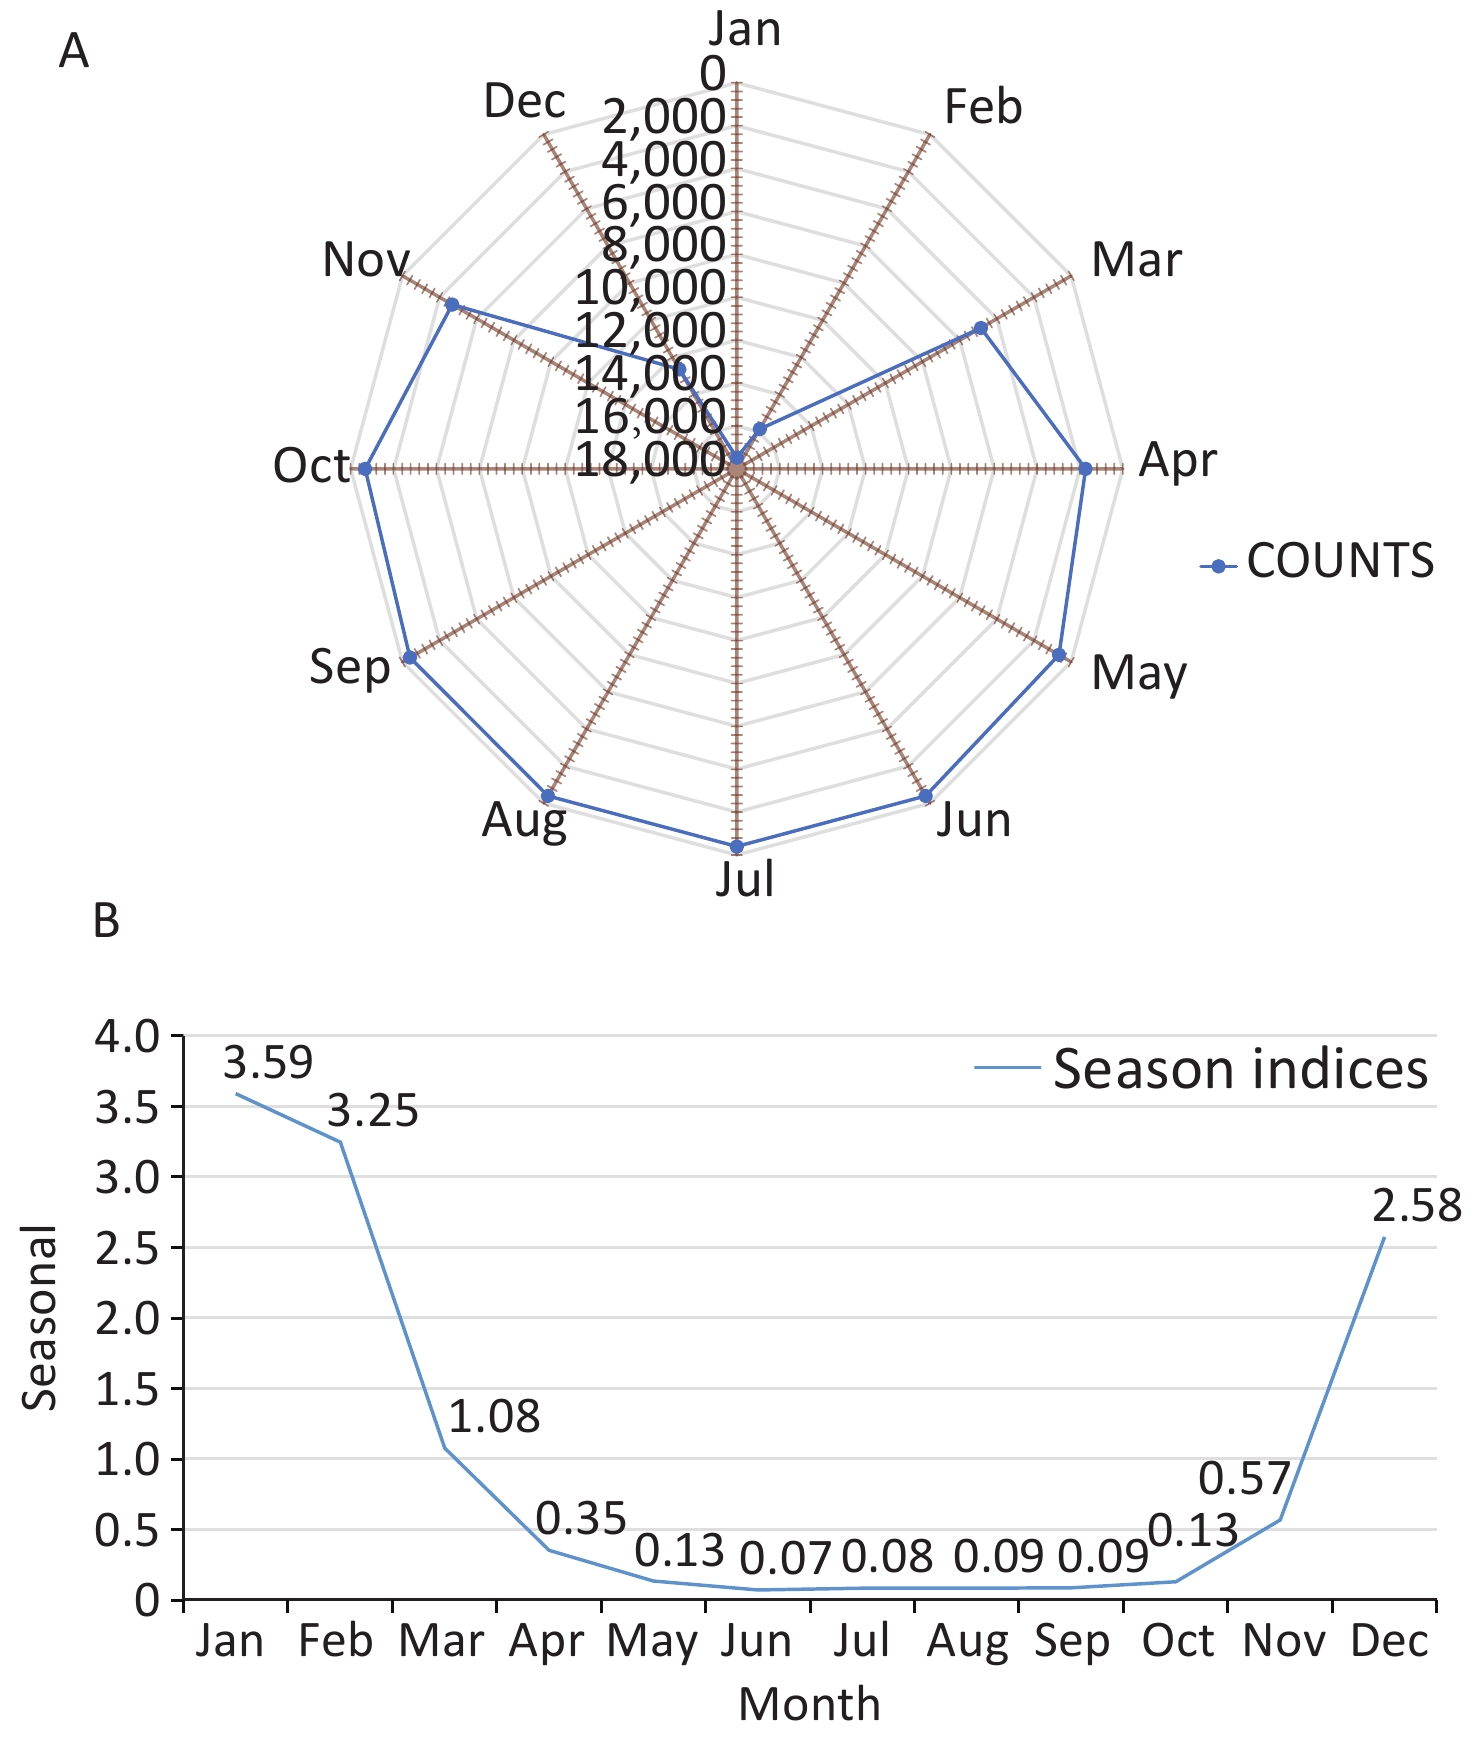
By summarizing the number of COP cases in each year, we drew a season index distribution chart and a radar chart to visualize the monthly changes in the number of COP cases more clearly. As shown in Figure 4, the months with larger seasonal indices were January and February, followed by December; this time period is the peak period of COP. The time period from April to November had a smaller seasonal index, and displayed a trough in COP cases. A single peak was observed in the seasonal distribution for the year, which spanned December to February, with the largest number of cases in January. The concentration ratios (M) ranged from 0.73 to 0.82.
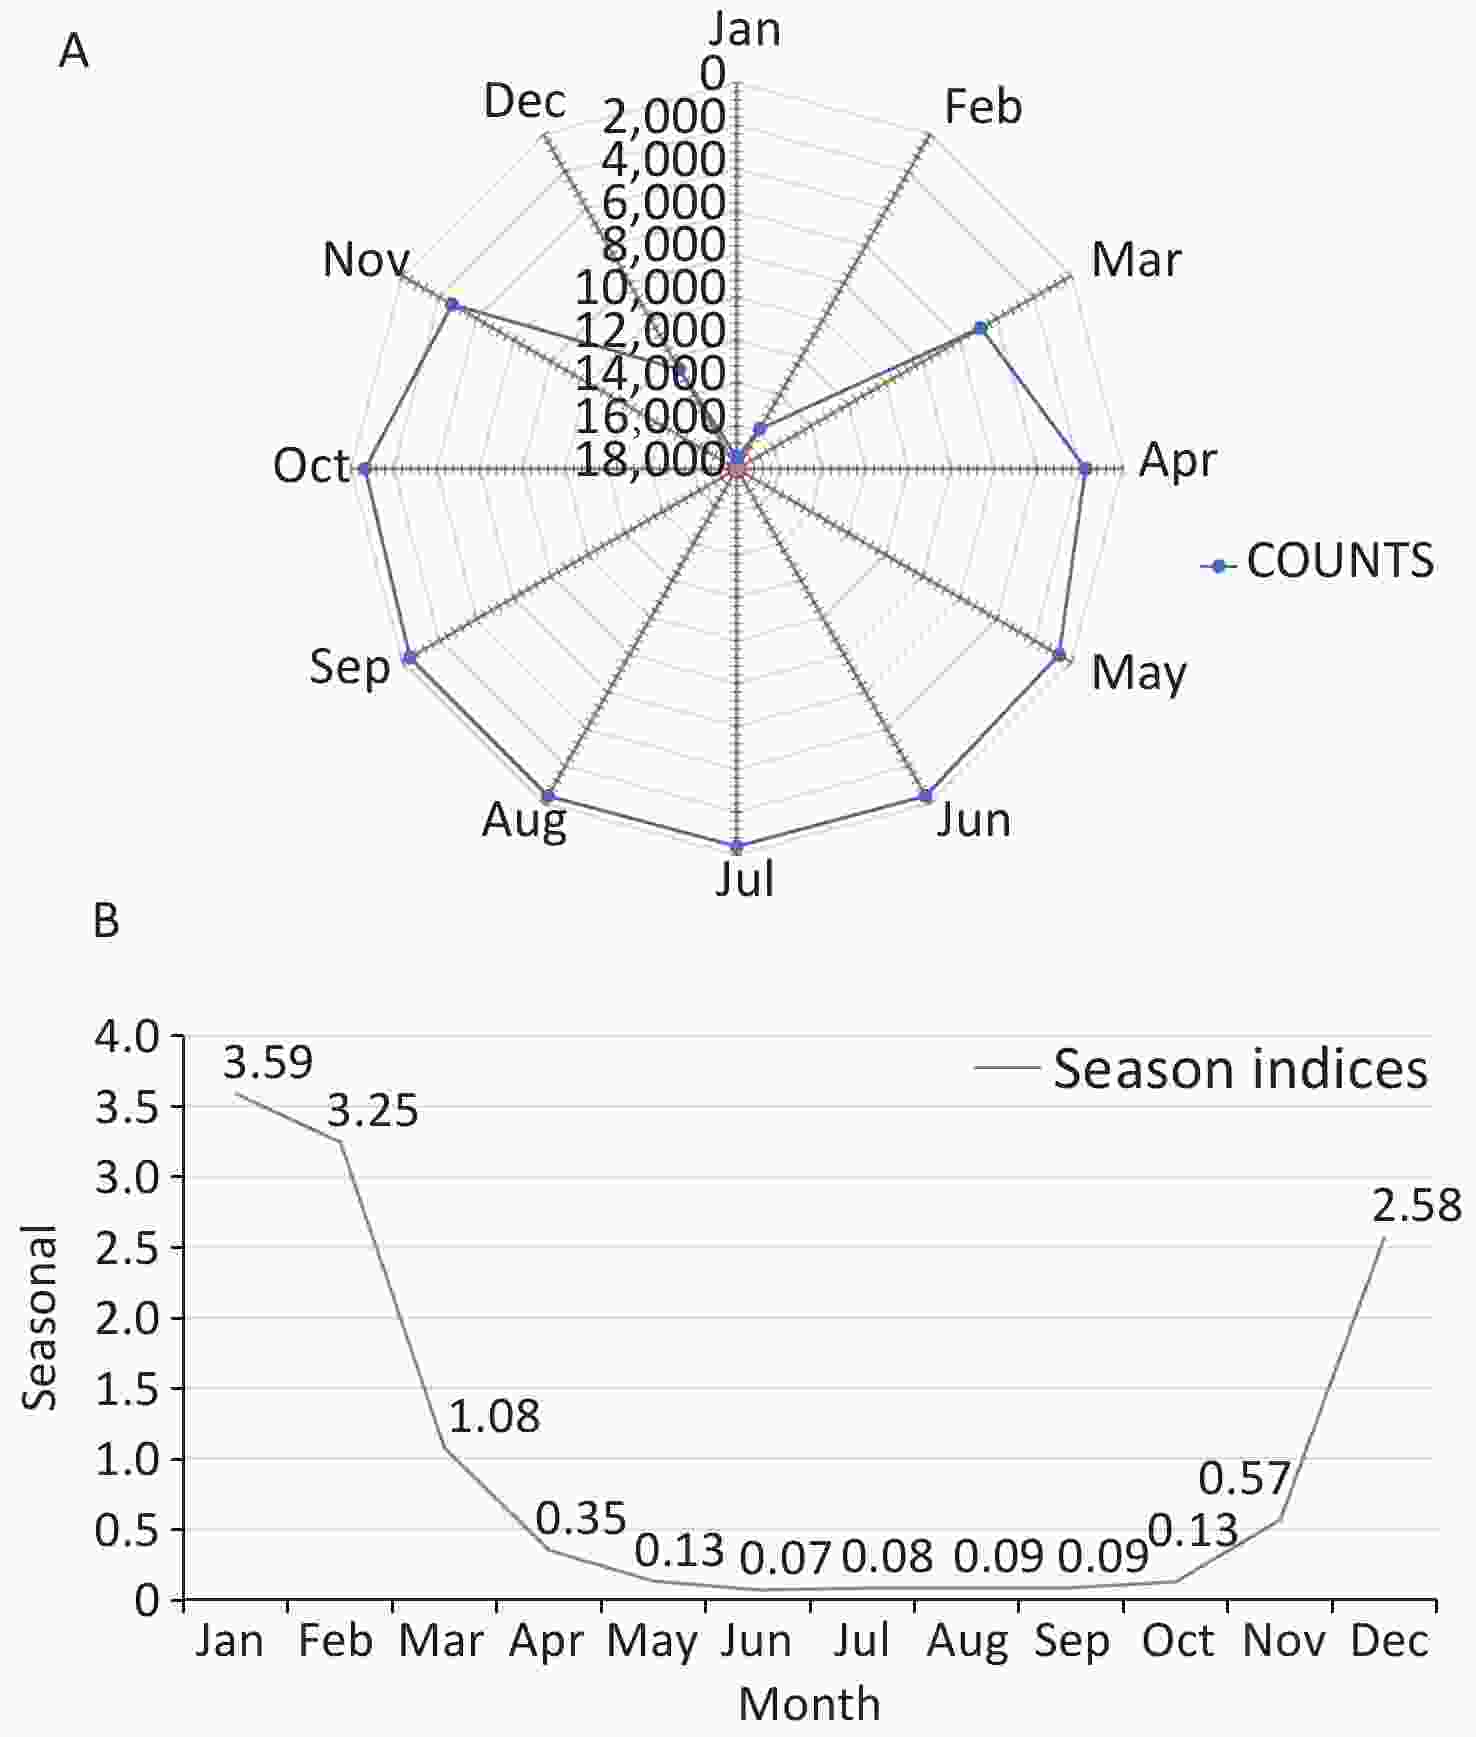
Figure 4. Radar chart of carbon monoxide poisoning (COP) in Guangdong, China (A), and seasonal index distribution chart on COP in Guangdong, China (B).
-
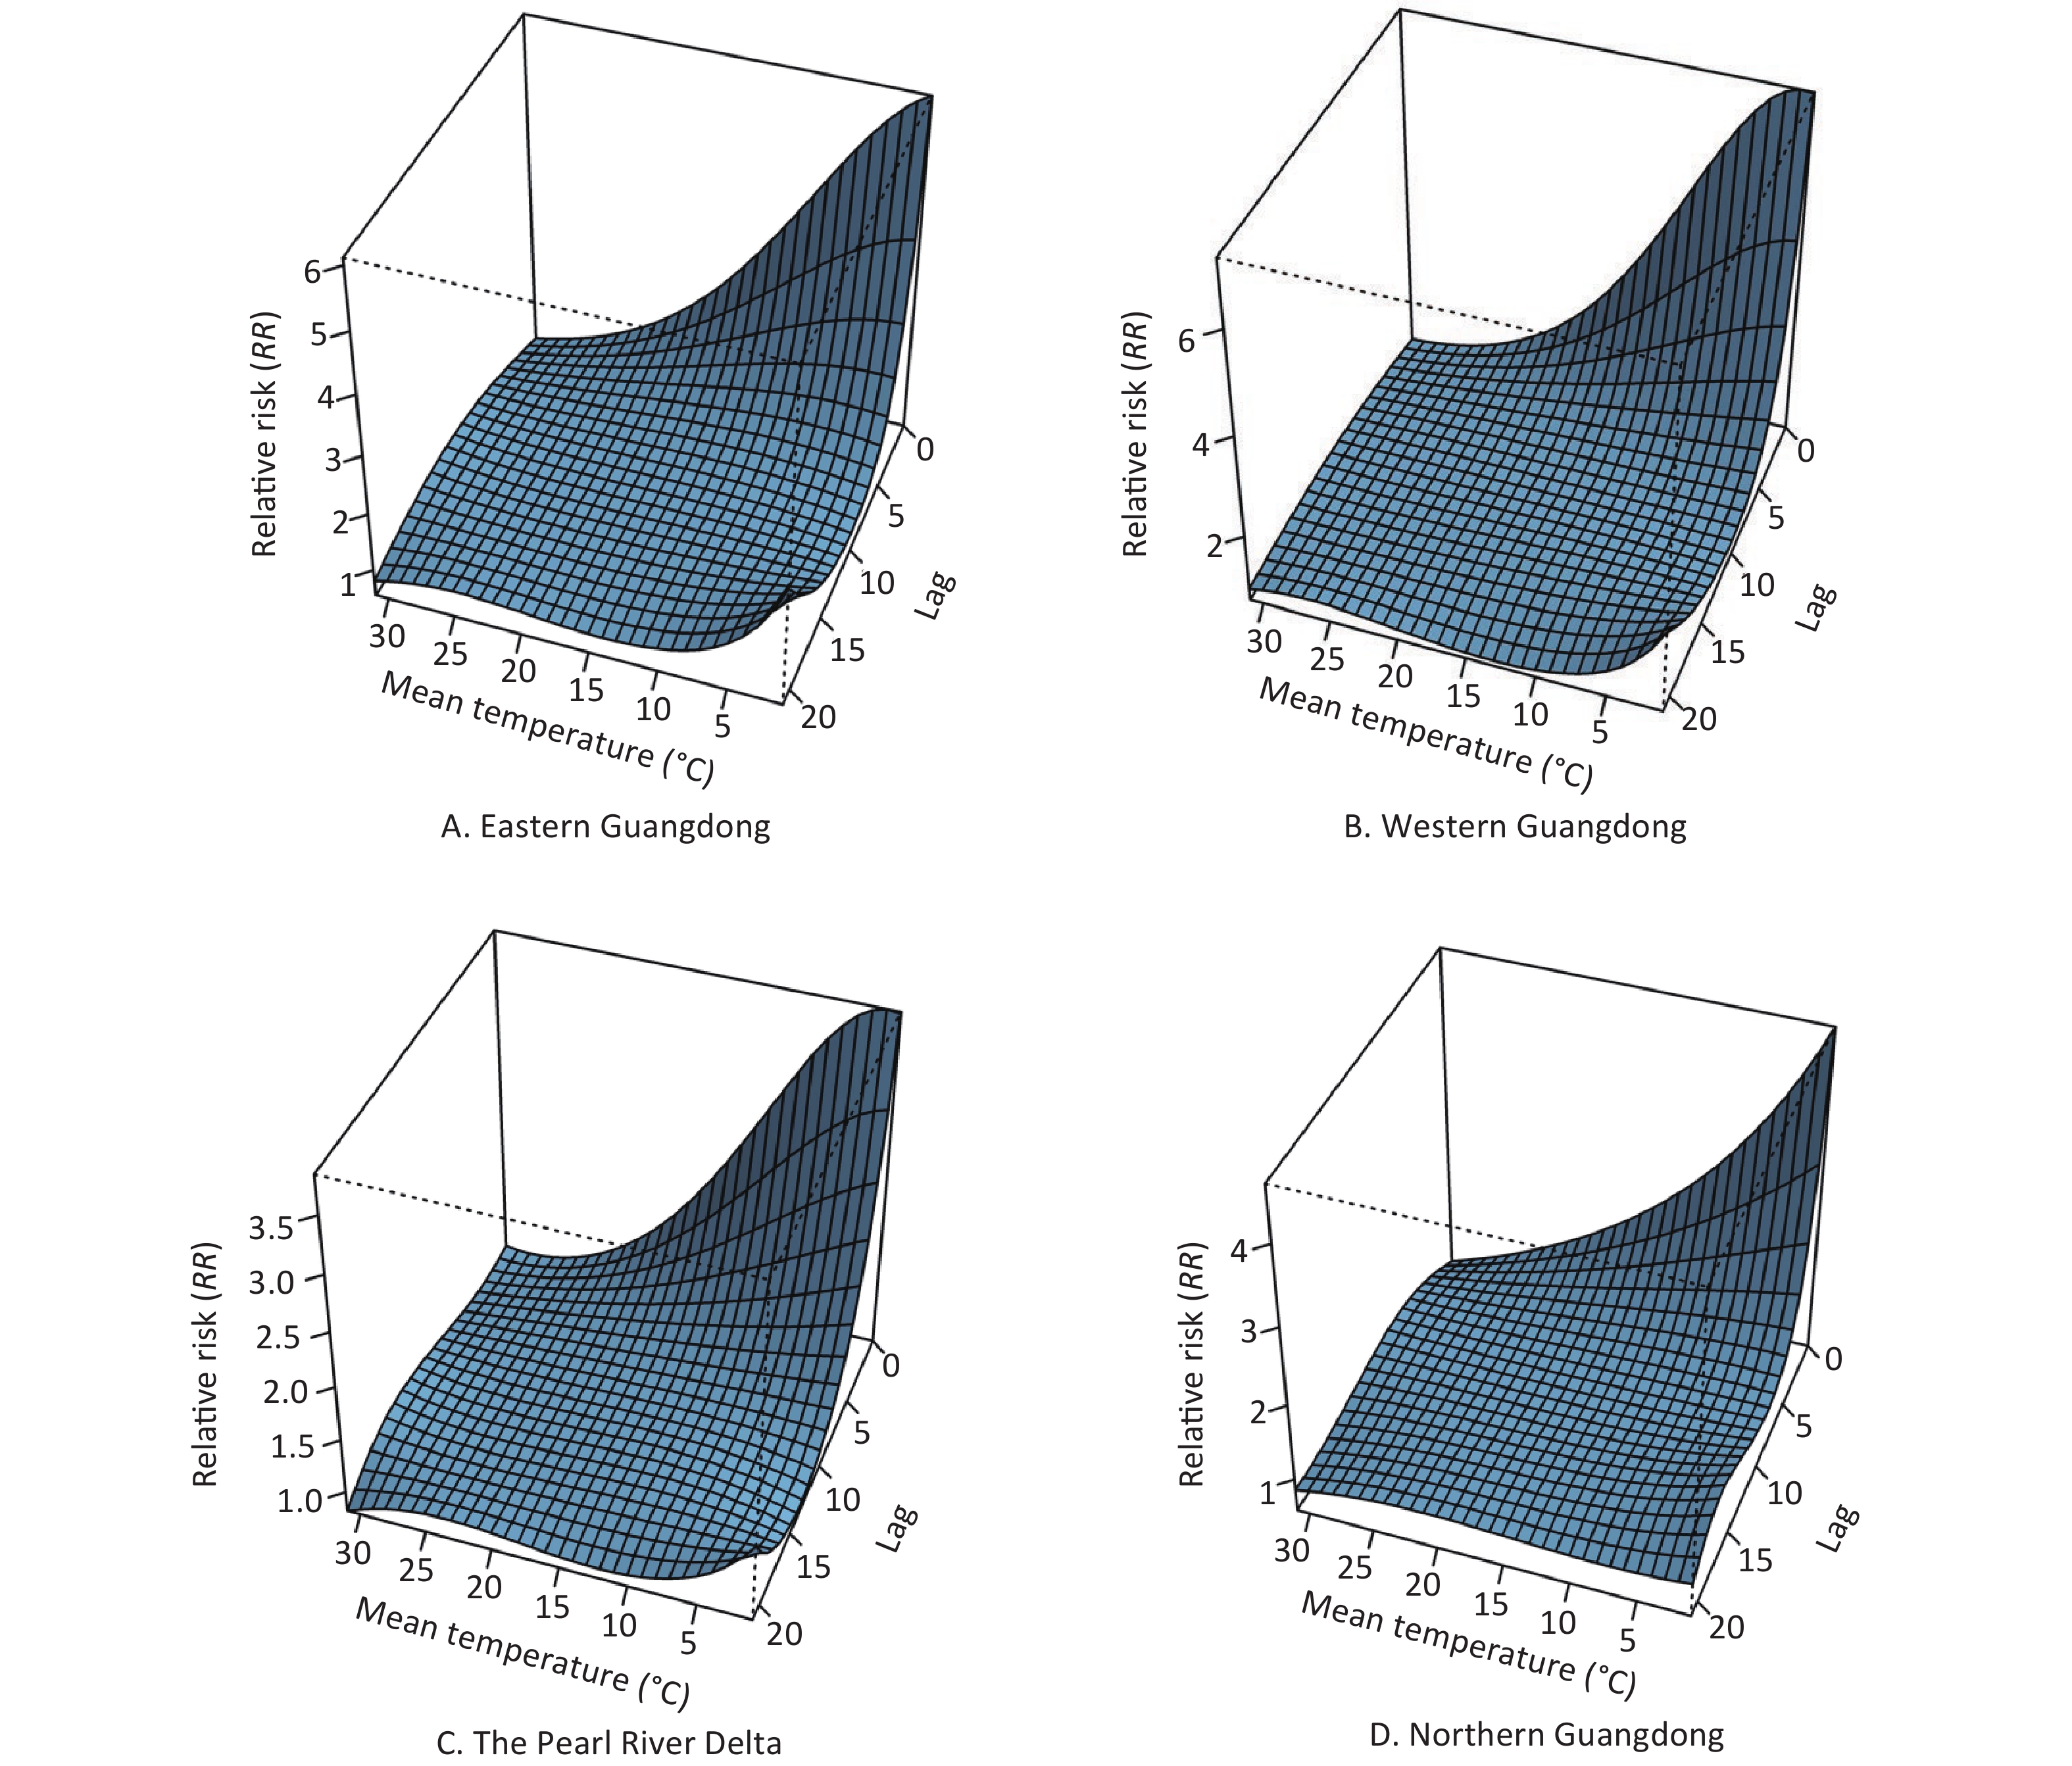
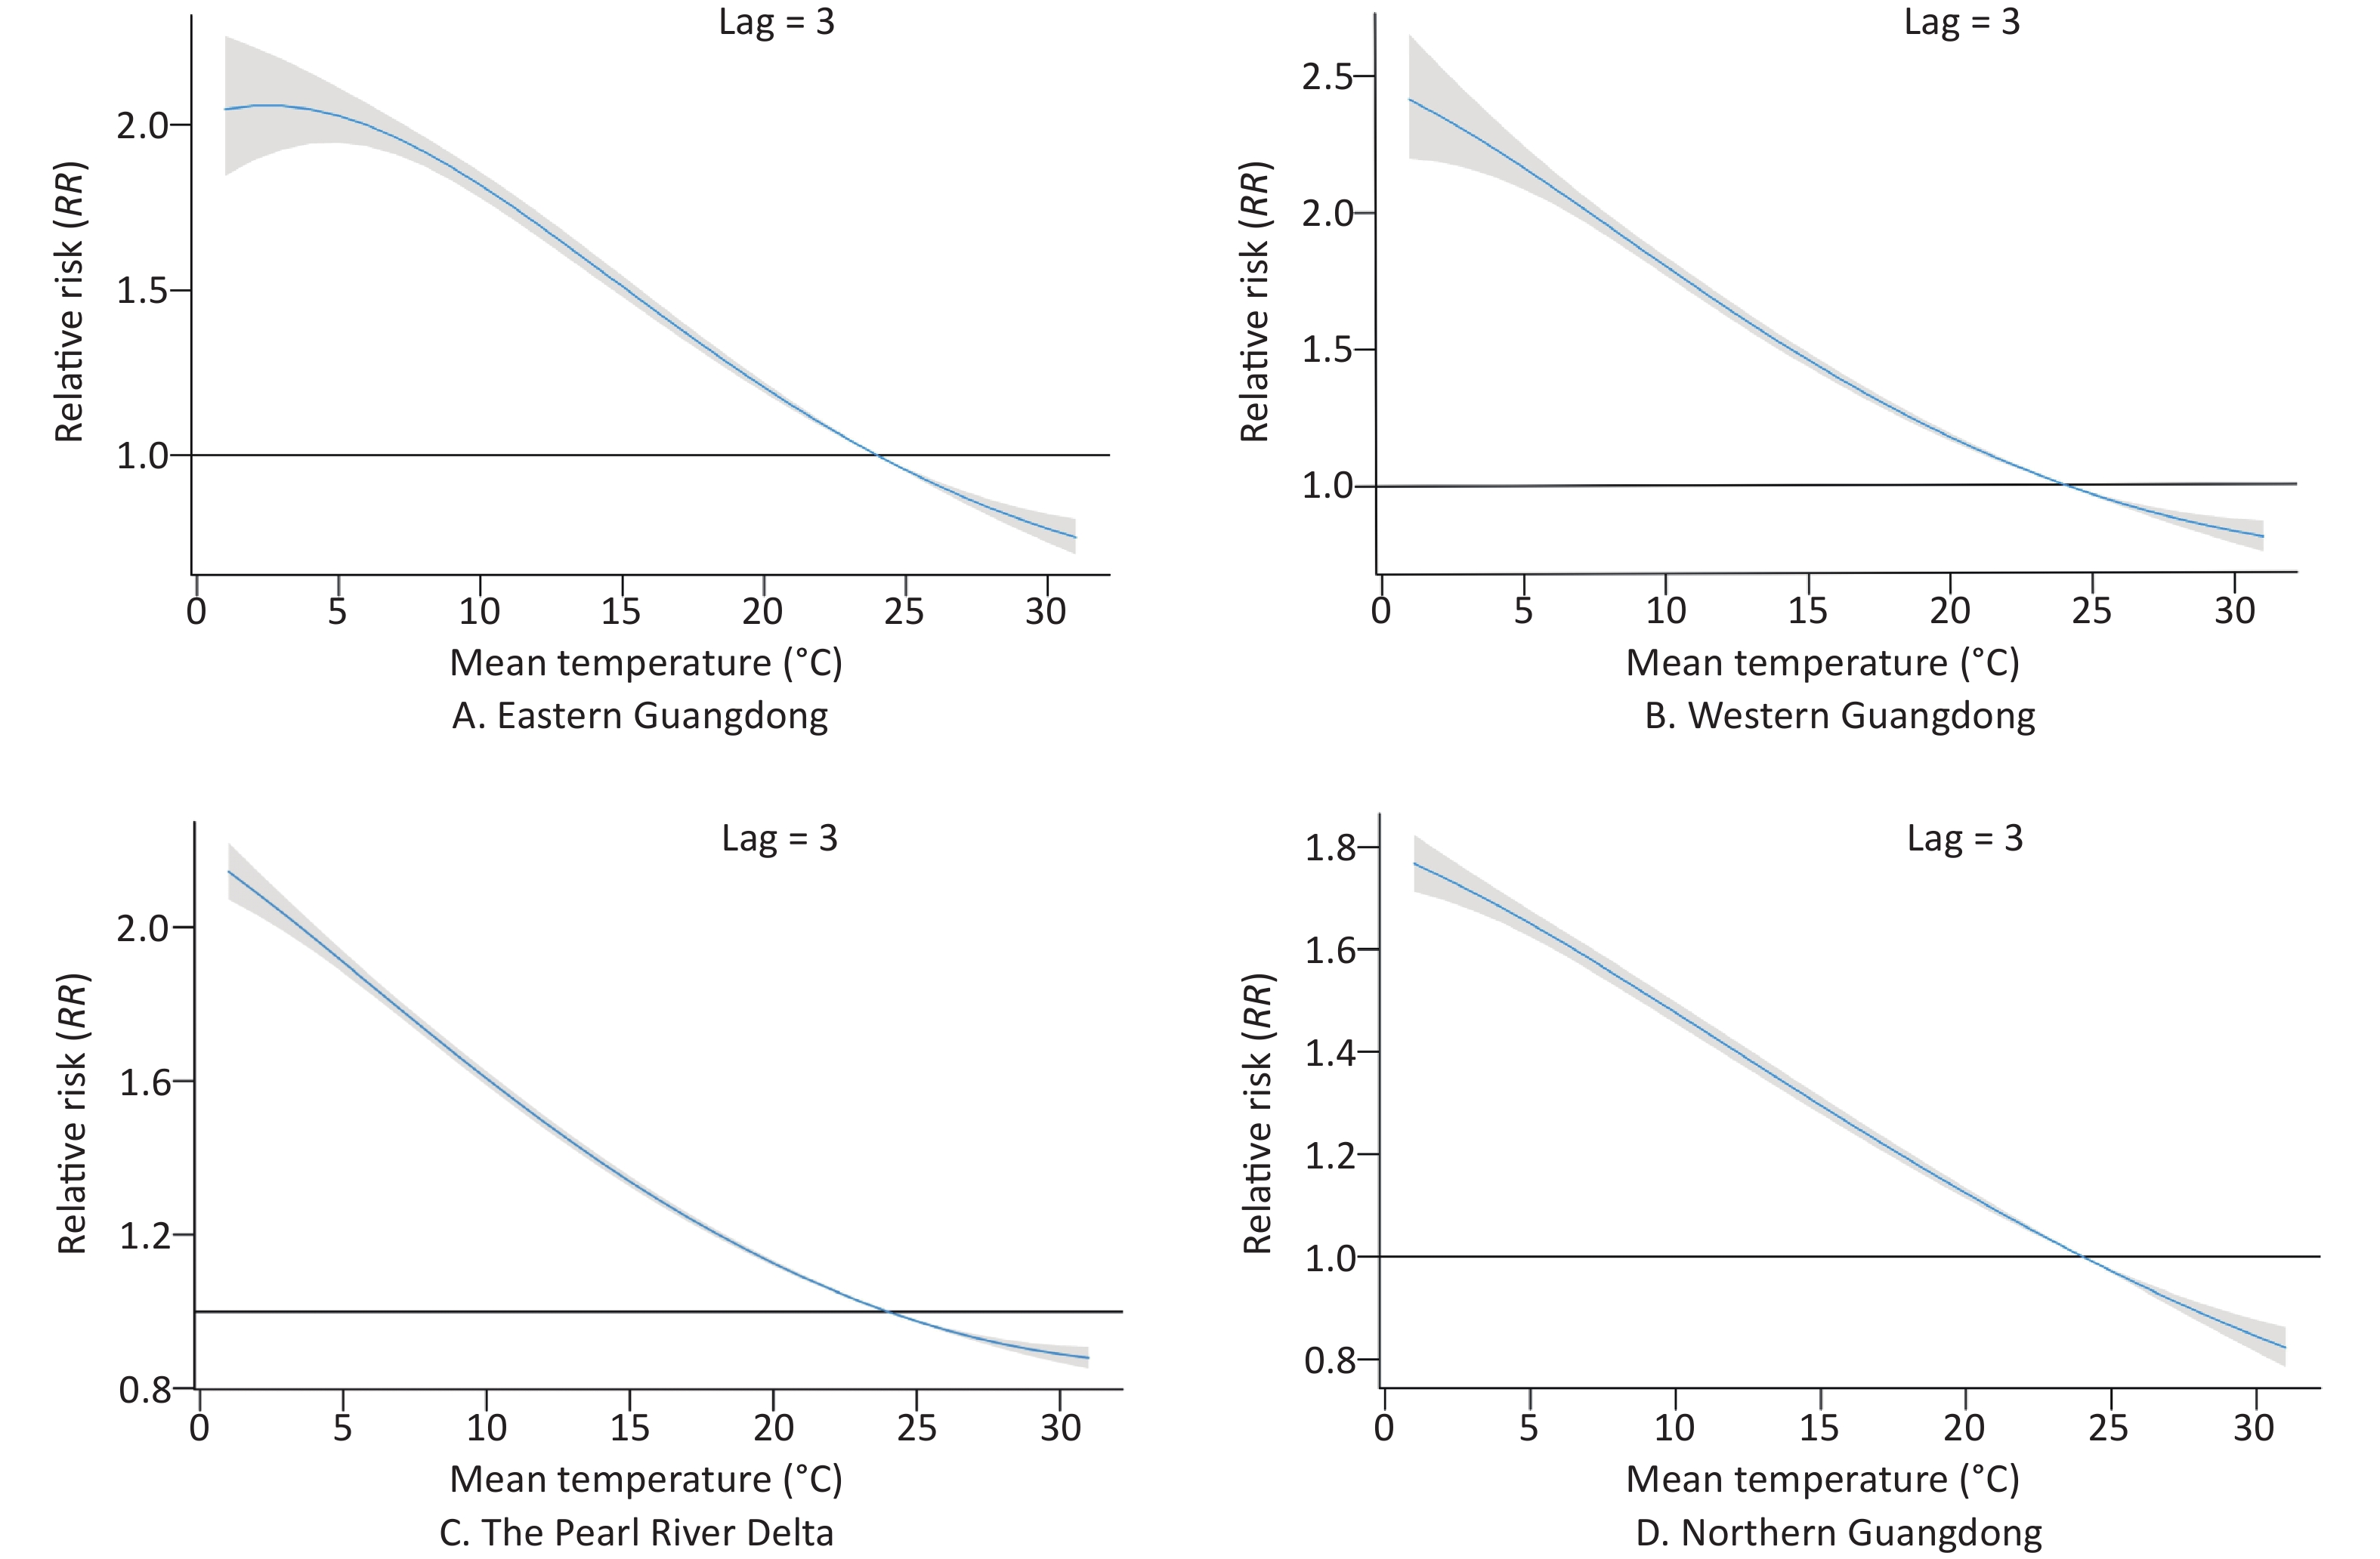
The patterns of four regions in Guangdong province (eastern Guangdong, western Guangdong, the Pearl River Delta, and northern Guangdong) are presented by three-dimensional plots of the RR according to mean temperature (Figure 5). The RRs versus mean temperature effects with a lag of 3 days are shown in Figure 6. Low temperature was associated with high risk of COP, with a lag lasting 7 days.
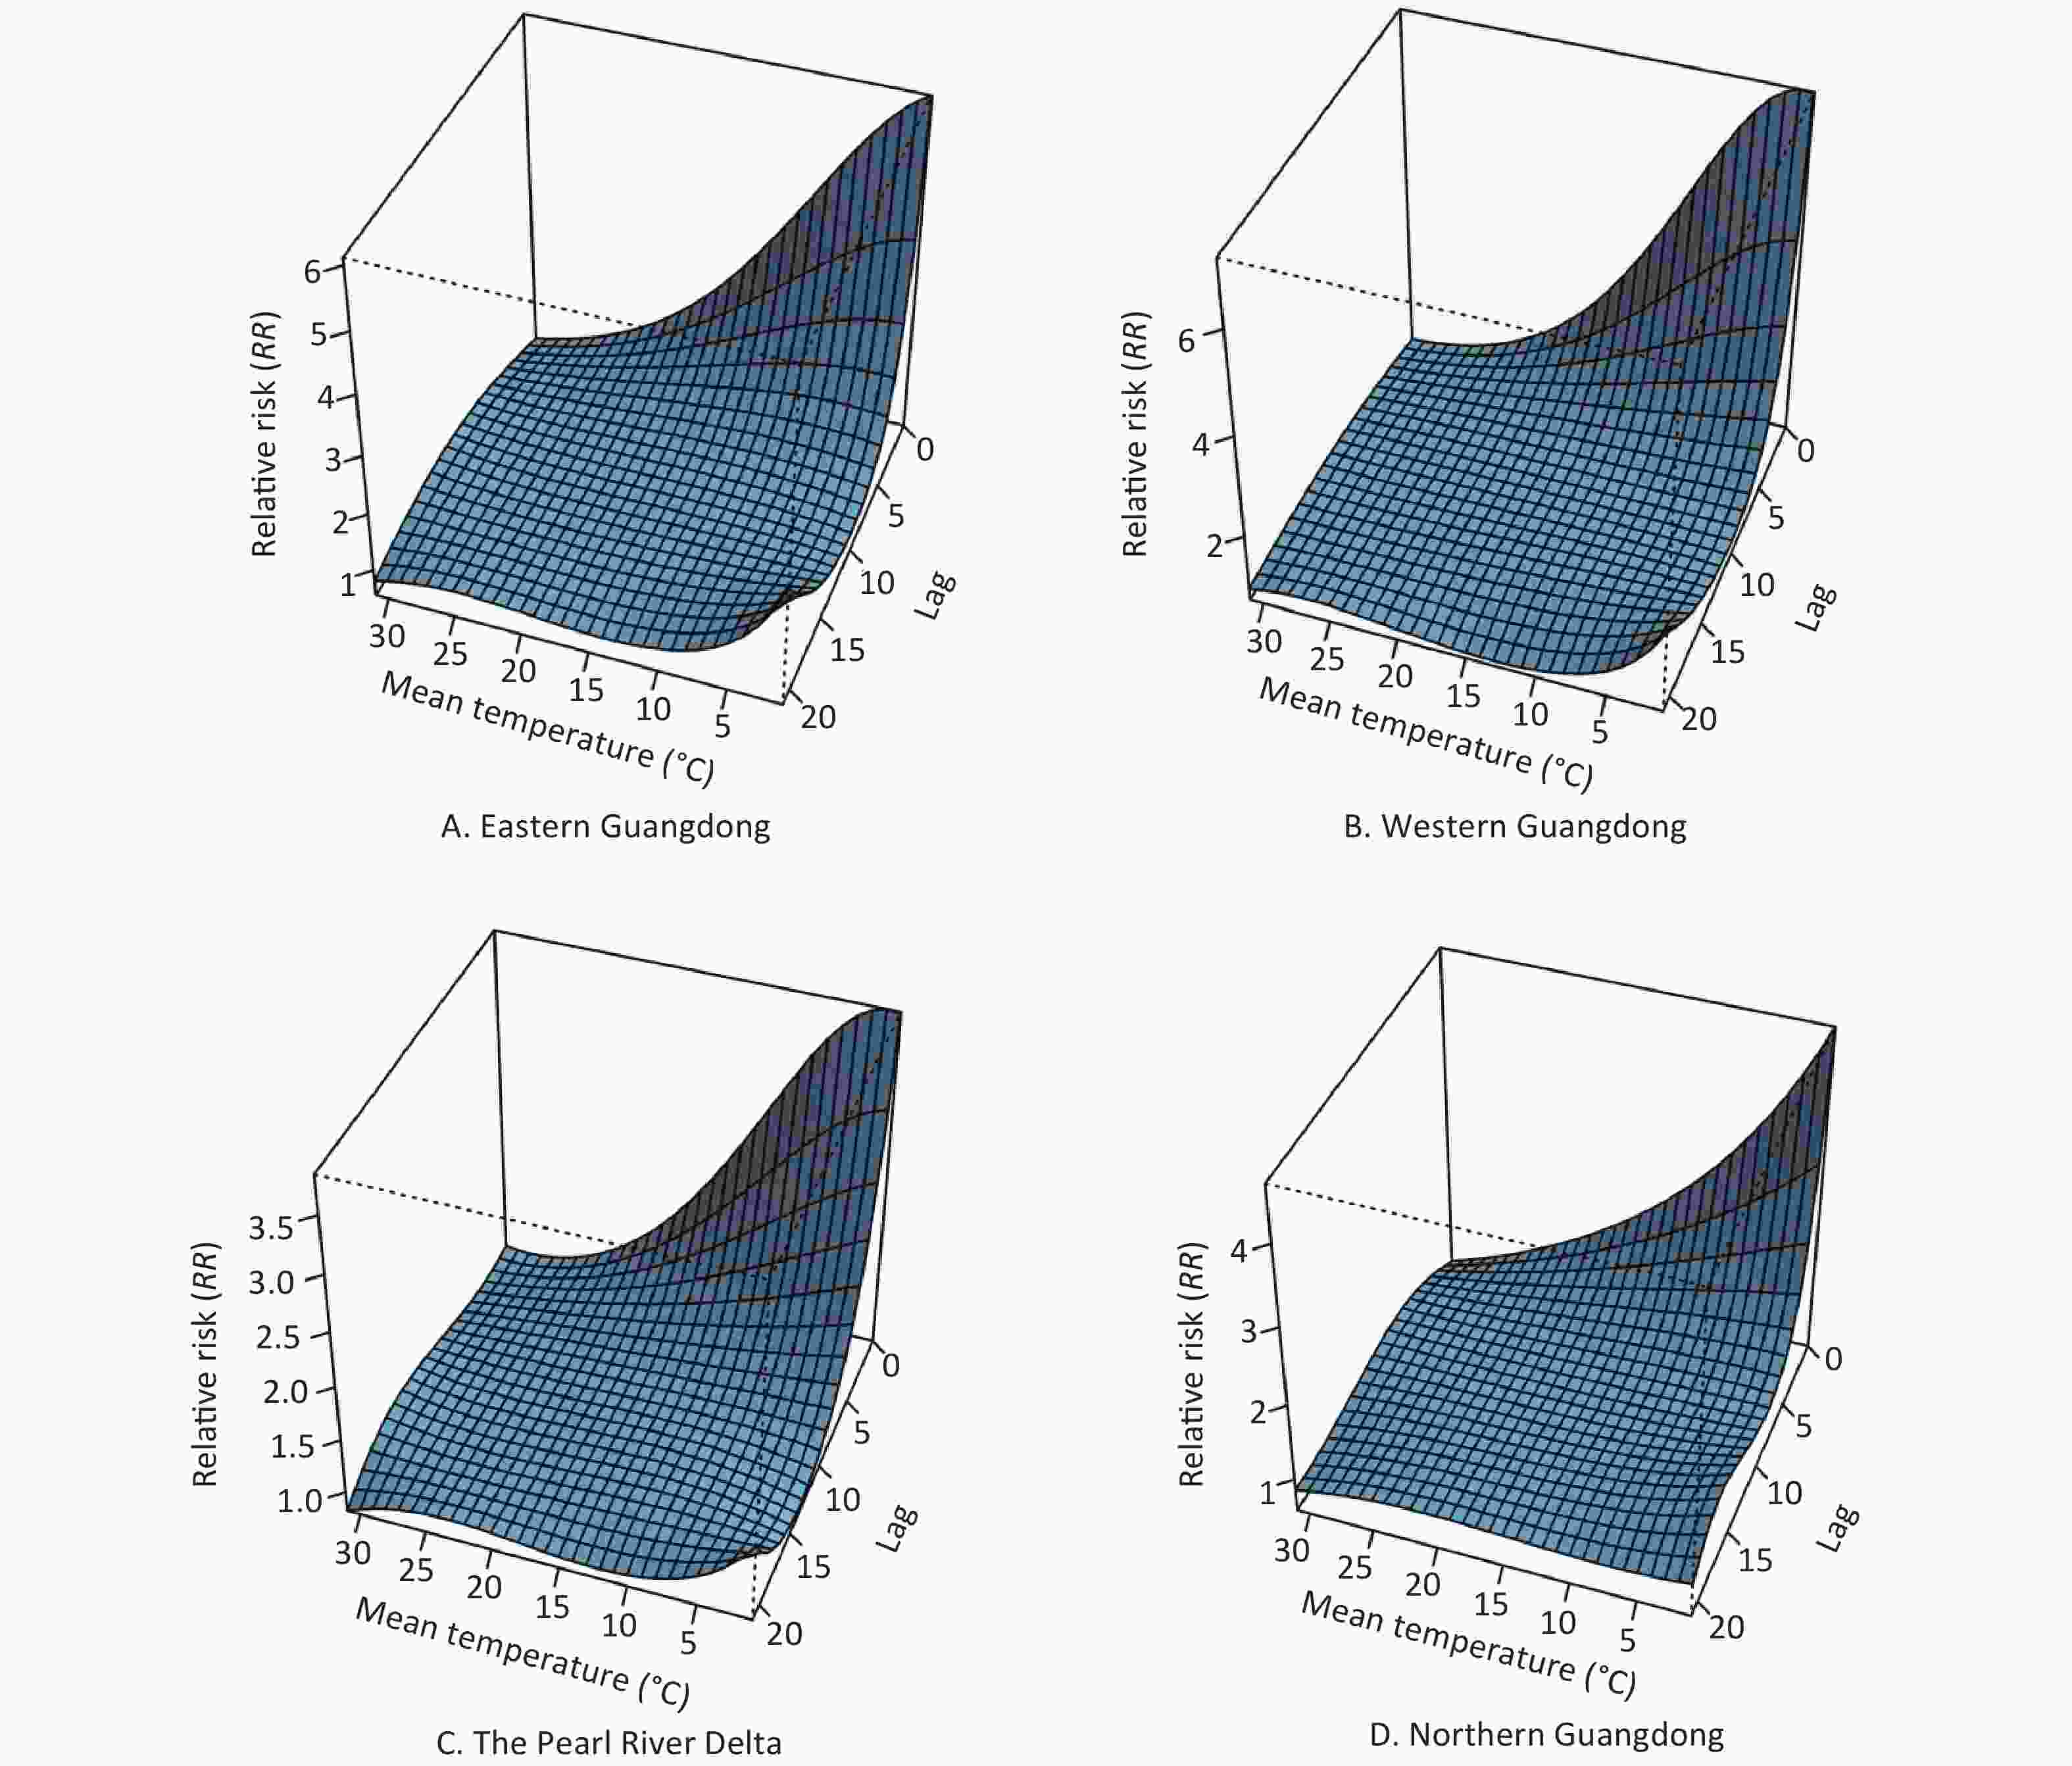
Figure 5. The 3D plot of RRs for daily carbon monoxide poisoning (COP) cases under different temperatures and lag combinations in four regions. The horizontal axis coordinate represents temperature and lag range, and the vertical axis coordinate represents RRs, which were estimated with DLNM by using the daily temperature median as a reference (RR = 1).
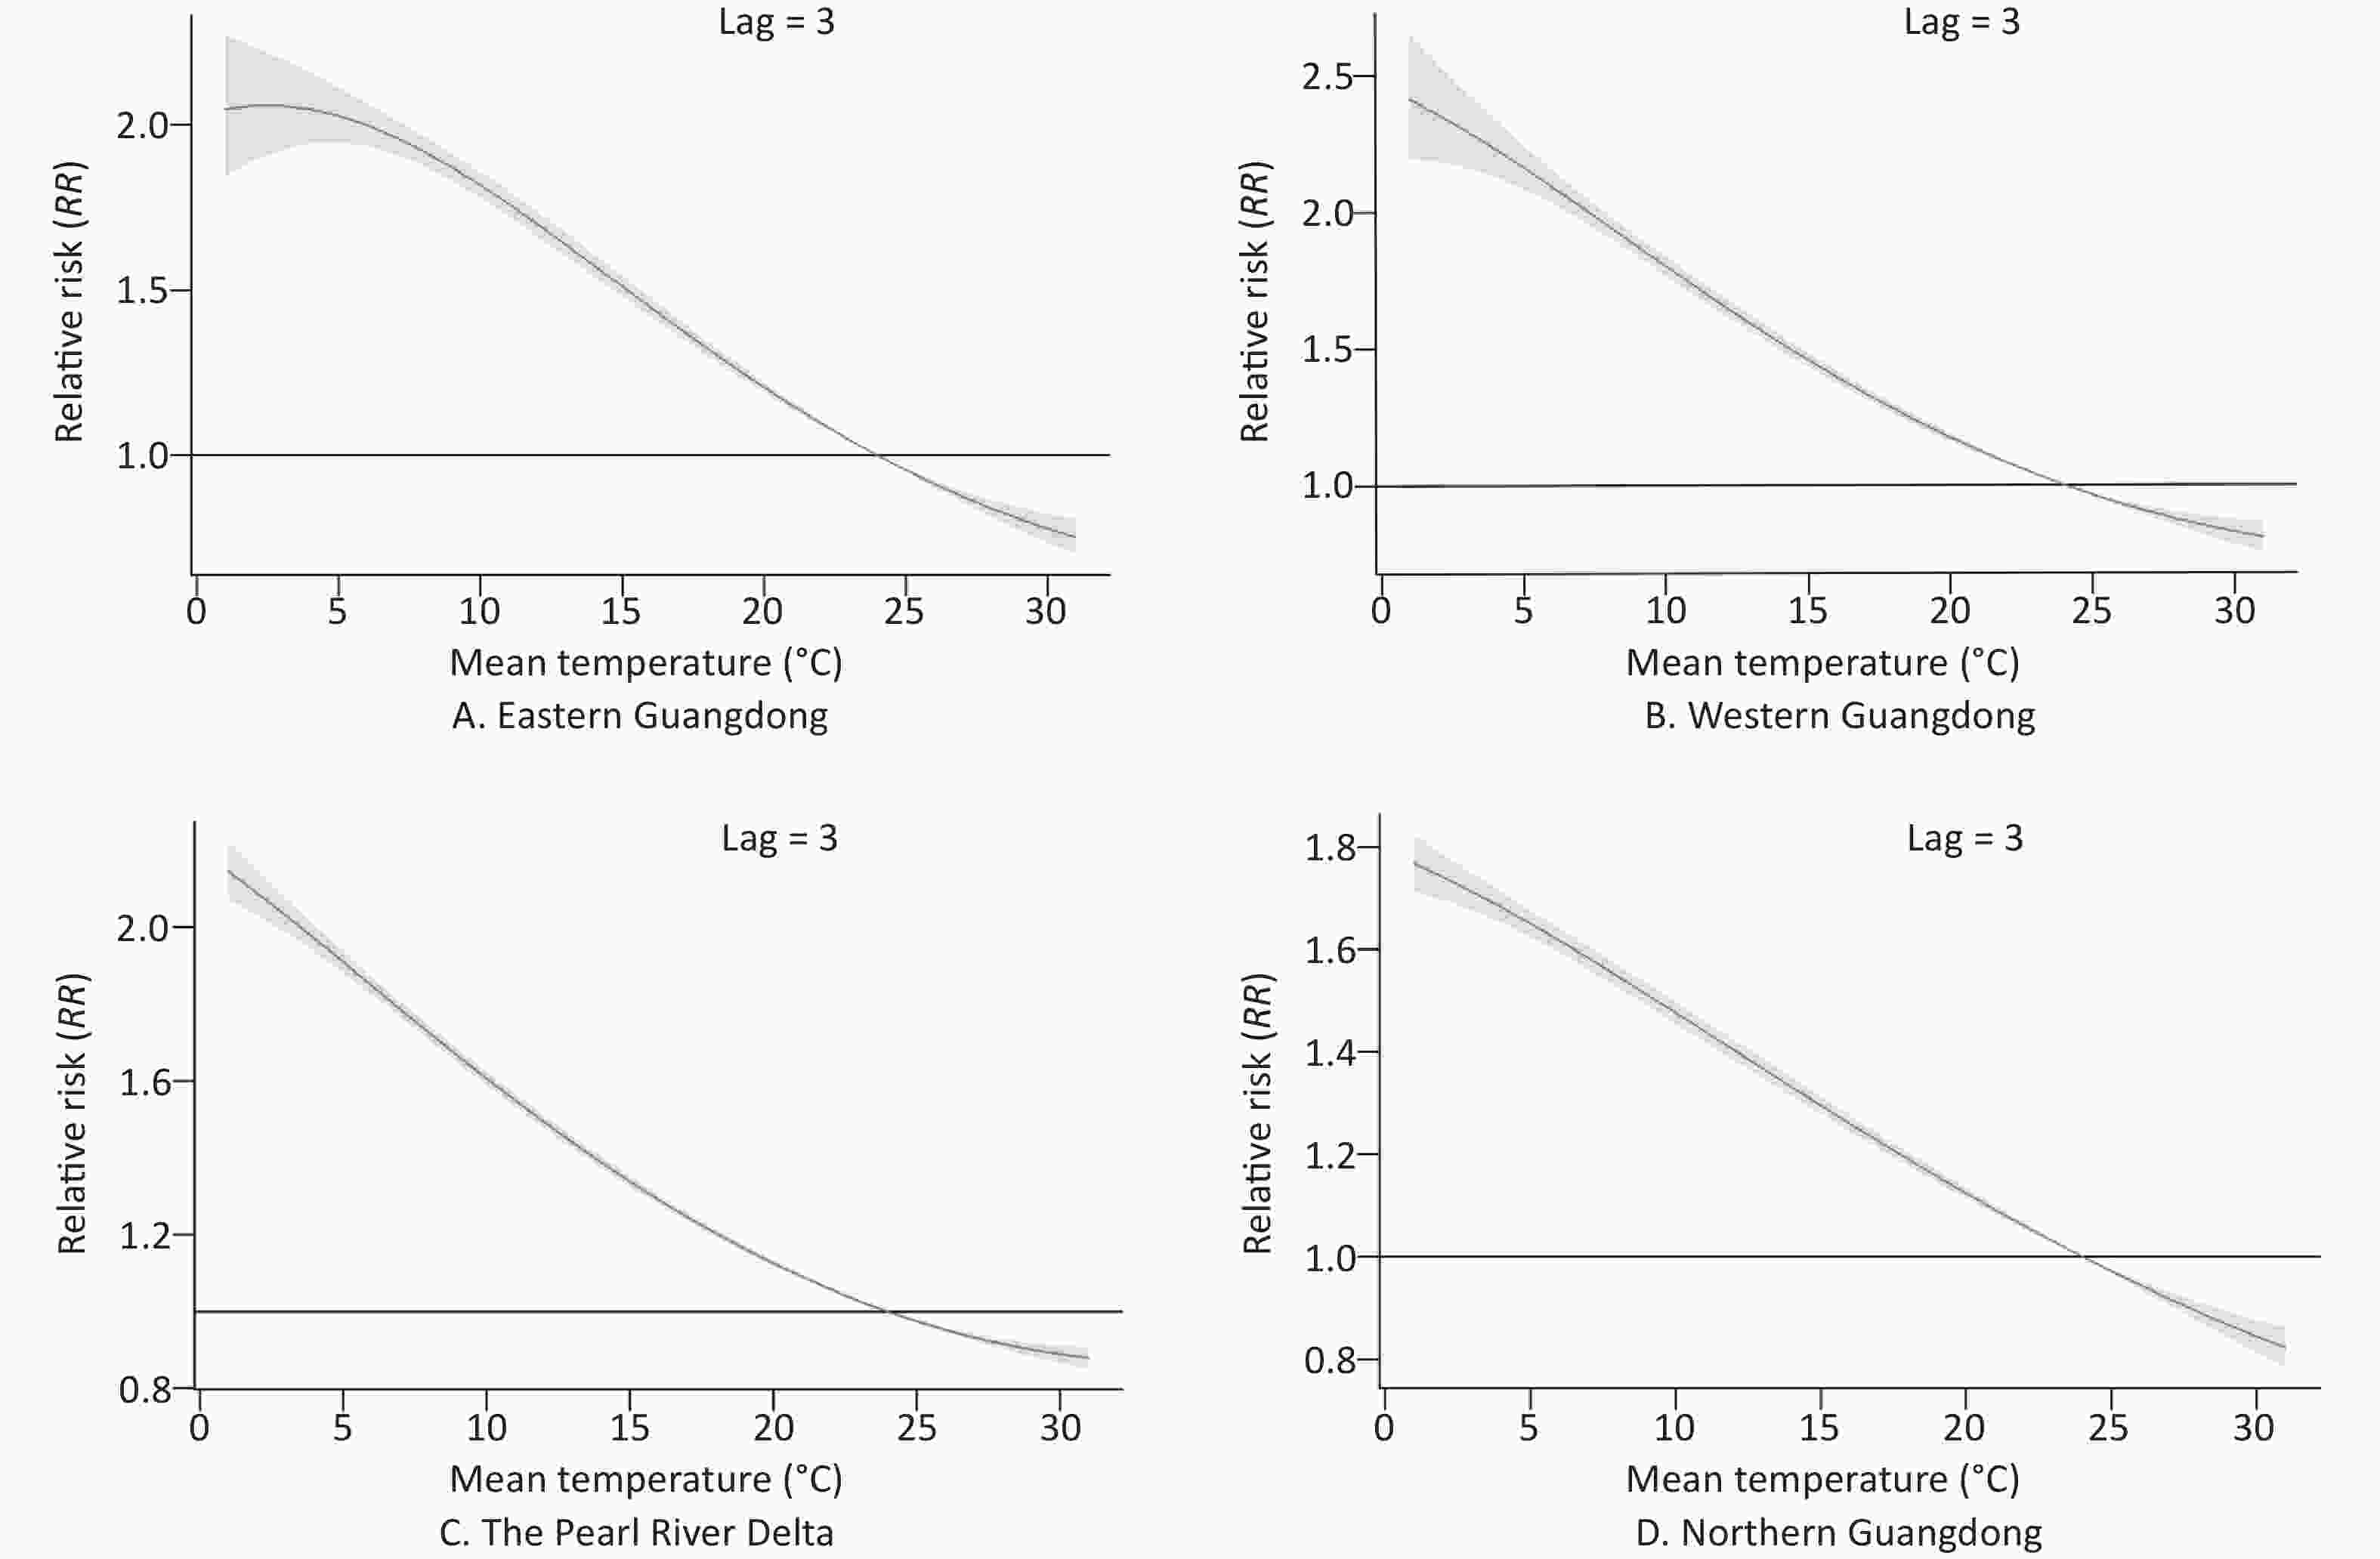
Figure 6. The relative risks of carbon monoxide poisoning (COP) according to daily temperatures at a lag of 3 days and temperatures in four regions. The curve denotes the maximum likelihood estimate of RRs, and the 95% CIs are shown in the gray regions.
The estimated effects of mean temperature on the hospital admission rates for COP were nonlinear, with higher relative risks at colder temperatures. With a lag of 0 days, the effects of low temperatures [extreme minimum (2 °C) and 5th (12 °C)] on COP were 5.98 (95% CI: 4.91–7.30) and 3.26 (95% CI: 3.06–3.47), respectively, as compared with the reference temperature [median (24 °C)] in eastern Guangdong. Similarly, in western Guangdong, the Pearl River Delta and northern Guangdong, the effects of low temperatures [extreme minimum (2 °C)] on COP were 7.26 (95% CI: 6.14–8.57), 3.83 (95% CI: 3.57–4.11), and 4.37 (95% CI: 4.06–4.69), respectively. The effects of low temperatures [5th (12 °C)] on COP were 3.81 (95% CI: 3.61–4.01), 2.4 (95% CI: 2.33–2.48), and 2.24 (95% CI: 2.15–2.34), respectively.
With a lag of 3 days, the effects of low temperatures [extreme minimum (2 °C) and 5th (12 °C)] on COP were 2.06 (95% CI: 1.89–2.24) and 1.7 (95% CI: 1.66–1.74), respectively, in eastern Guangdong, compared with reference temperature. Similarly, in western Guangdong, the Pearl River Delta, and northern Guangdong, the effects of low temperatures [extreme minimum (2 °C)] on COP were 2.36 (95% CI: 2.19–2.54), 2.09 (95% CI: 2.03–2.15), and 1.74 (95% CI: 1.7–1.79), respectively. The effects of low temperatures [5th (12 °C)] on COP were 1.66 (95% CI: 1.63–1.69), 1.49 (95% CI: 1.48–1.51), and 1.40 (95% CI: 1.38–1.42), respectively.
With a lag of 7 days, the effects of low temperatures [extreme minimum (2 °C) and 5th (12 °C)] on COP were 1.01 (95% CI: 0.91–1.11) and 1.11 (95% CI: 1.08–1.13), respectively, in eastern Guangdong as compared with the reference temperature. Similarly, in western Guangdong, the Pearl River Delta, and northern Guangdong, the effects of low temperatures (extreme minimum [2 °C]) on COP were 1.11 (95% CI: 1.02–1.21), 1.22 (95% CI: 1.18–1.26), and 1.07 (95% CI: 1.04–1.11), respectively. The effects of low temperatures (5th [12 °C]) on COP were 1.04 (95% CI: 1.02–1.06), 1.1 (95% CI: 1.09–1.11), and 1.05 (95% CI: 1.04–1.07), respectively.
-
In our study, epidemiological characteristics of COP in Guangdong province from 2013 to 2020 were analyzed. We found that females were more likely to have COP than males, and the largest number of sick people in Guangdong was mainly concentrated in the 10–14 and 20–24 year age groups, thus indicating a low average age for COP. COP also showed significant spatiotemporal heterogeneity, occurring frequently in the cold season, with most cases concentrated in high latitudes with high-high clustering. Low temperatures were associated with a high risk of COP.
From a global perspective, more than half of patients with COP were male. Men are considered more vulnerable to COP [11, 19, 28] because they tend to have a greater rate of use of combustion appliances inappropriately or without appropriate ventilation. In contrast, our study illustrated that the number of COP cases among women was much higher than that among men. Furthermore, COP occurred mainly in the age groups of 0−14 and 20−39 years. Compared with the mean age of patients with COP (approximately 40 years of age) in other countries and regions [29], the age of patients in Guangdong province tended to be younger, with a median of 24 years. This result was similar to those in another report [30]. Young adult women and children were most vulnerable to COP in Guangdong province. The differences may be associated with local lifestyle and sources of CO exposure. Guangdong province is located in southern China, and there is moderate average temperature throughout the year. Unlike temperate zones such as the United States and northern China, people in Guangdong Province seldom burn coal to keep warm when the temperature drops in winter [8, 31]. Gas water heaters have become the major source of exposure to COP [18, 32]. We surmised that women and children are more likely to contract COP from improper use of water heaters, such as through showering for too long or having insufficient ventilation [19, 33]. In addition, among the COP population, nearly 40% of people belonged to impoverished groups such as farmers and unemployed people. Therefore, poverty may be a main cause of COP, in agreement with findings from previous studies [19, 34]. Moreover, COP may increase the burden on poor people and exacerbate poverty among this group, which tends to lack insurance and access to first-aid services [35]. Further studies are needed to confirm these assumptions.
Through the time series, we found that the overall trend of the hospital admission rates of COP was relatively stable, in contrast to the downward trend in developed countries [28, 36]. This finding reflected the significant seasonality and periodicity according to the decomposing time series and season index chart. The concentration ratios ranged from 0.73 to 0.82. COP occurred primarily in the cold season (January, February, and December) in Guangdong, in agreement with reports in other regions [19, 37]. Interestingly, the peak hospital admission rates were observed in 2018, which were accompanied by extreme low temperatures in winter. We speculated that this finding might have been associated with the extremely cold weather in that year, as described in previous studies [38-41]. In cold weather, people may reduce air circulation to maintain the indoor temperature, and poor ventilation might explain why some heaters for washing were used throughout the year, yet accidental poisoning was frequent in the cold season. This study indicated that low temperatures were associated with high hospital admission rates for COP, with a lag lasting 7 days. With a lag of 0 days, the effects of low temperatures [extreme minimum (2 °C) and 5th (12 °C)] on COP were 3.83−7.26 and 2.24−3.81, as compared with the reference temperature [median (24 °C)]. Similar results have also been found in the other regions. For instance, Du has found that temperature is inversely correlated with the incidence of acute COP (R2 = −0.467) in Beijing [30]. Shie has found that the odds ratio for unintentional COP incidence increased 2.15 times, whereas the daily maximum temperature was lower than 18.4 °C, compared to the odds ratio when the temperature exceeded 27.1 °C[40]. Furthermore, a 1 °C temperature increase had been found to result in a 10% decrease in acute COP incidence in Taiwan, China [42]. Interestingly, our study indicated that in the first few days of low temperatures, people at lower latitudes had a higher risk than people at higher latitudes. We surmised that this phenomenon might have been associated with people at high latitudes being better able to adapt to low temperatures [43]; therefore, the population does not rapidly use CO exposure sources after the arrival of extremely cold weather, in contrast to people at low latitudes.
In our study, the hospital admission rates showed a positive correlation within regions through Moran’s I, and the distribution of COP in Guangdong province was not random and showed clear spatial clusters. Northern Guangdong province had high hospital admission rates, and cities such as Shaoguan and Qingyuan displayed high-high spatial clustering. In contrast, the Pearl River Delta and the southernmost part of Guangdong province displayed low-low spatial clustering. In fact, we assumed that latitude contributed to the difference in hospital admission rates between northern and southern Guangdong province. For example, the city of Shaoguan may experience snow because it is at higher latitude than other areas with lower annual temperatures. Latitude was not the only factor affecting rates of COP; the degree of economic development may also be a contributor. For example, the Pearl River Delta which is the most economically developed area in Guangdong Province had low hospitalization rates. Poorer areas, such as Shaoguan and Qingyuan, which have the lowest GDP, were found to have higher hospital admission rates. These findings are similar to those of several studies showing more deaths due to COP in areas with low, low-middle, and middle sociodemographic index scores (SDI), and fewer deaths in areas with high-middle and high SDI scores [15]. Deprivation may be a factor underlying the distribution of COP. Areas with low socioeconomic status, particularly deprived areas, were at higher risk of COP [44]. Weather warnings could be issued to remind the public to be aware of the elevated risk of COP in underdeveloped areas and to take preventive measures.
Our study had several limitations. First, the data source of our study did not provide detailed information about the characteristics of clinical patients. We only analyzed certain demographic variables from a macro perspective, but were unable to perform a more detailed analysis. Second, we could not obtain the specific reasons for the rates of COP; therefore, we could only speculate about possible factors, on the basis of the current epidemiological characteristics.
-
COP in Guangdong province showed significant temporal and spatial heterogeneity. The highest risk occurred in winter. Most cases were concentrated in the northern mountainous areas of Guangdong. Low temperatures were associated with high risk of COP, with a lag lasting 7 days. The study shed light on the precise control of related public health preventive measures for a specific population, season, and geographic region.
-
The authors acknowledge all research staff involved in the current study. The authors thank the anonymous reviewers for their helpful suggestions to improve the article.
-
CYS and JBC were joint corresponding authors who contributed equally to this work. CYS, JBC, JZ, and BX conceived the study design and analytical plan. BX and YMZ performed statistical analysis and prepared the first draft. BX finished the draft on the basis of comments from other authors. BX was responsible for the revision of the draft. BX and WH acquired the data. CYS, JBC, JZ, CDX, WH, and WW provided technical support in data analysis, and aided in interpretation of results and manuscript drafting. All authors reviewed the manuscript and provided critical input during its revision.
-
None declared.
-
No additional data are available.
-
Not required.
HTML
Study Area
Data Collection
Spatial Analysis
Temporal Trend Analysis

Distributed Lag Nonlinear Model


Demographic Characteristics of CO Poisoned Patients
Spatial Distribution Characteristics of COP
Spatial Analysis of COP Hospital Admission Rates
Time Distribution Characteristic Analysis of COP
Association between Temperatures and COP
 22022Supplementary Materials.pdf
|

|

 Quick Links
 DownLoad: