


-
Hepatocellular carcinoma (HCC) is one of the deadliest cancers in the world and the 3rd most common cancer[1]. More than 1 million cases of HCC are diagnosed annually worldwide[2]. The clinical symptoms of early-stage HCC are often atypical or even asymptomatic; 70% of patients with HCC are in advanced stages when diagnosed with HCC in China[3], and surgical treatments such as hepatic resection and liver transplantation are difficult to eradicate and have a poor prognosis[4-5]. Recently, molecular targeted therapy has shown promising effects in the treatment of advanced HCC[6]. Sorafenib and lenvatinib are two first-line systemic targeted drugs for advanced HCC; nevertheless, the improvement in the overall survival rate remains unsatisfactory[7]. To improve the prognosis and reduce cancer‐related death in patients with HCC, it is urgent to study the molecular mechanism of HCC and to search for effective therapeutic targets for HCC treatment.
Protein Phosphatase 2 Regulatory Subunit B"Alpha (PPP2R3A) is the regulatory subunit B of the protein phosphatase 2A (PP2A)[8-9]. PPP2R3A regulates several crucial signalling pathways associated with cancer[10-14] and is involved in the occurrence and development of multiple solid tumours[15]. Our previous studies using cell and animal models found that the overexpression of PPP2R3A can promote malignant biological behaviours of HCC cells, such as proliferation and invasion, while interference with PPP2R3A can inhibit the malignant behaviour of HCC cells[16,17]. Further clinical validation revealed that in 108 HCC tissues, PPP2R3A had 92.6% (100/108) positive expression and high PPP2R3A expression was associated with poor postoperative survival and recurrence of HCC[18]. The above studies suggest that PPP2R3A may be a potential oncogene involved in the development of HCC. Therefore, it is important to clarify the mechanism of PPP2R3A in HCC.
The reprogramming of energy metabolism is considered a general hallmark of malignant tumours[19]. Aerobic glycolysis, is a member of metabolic reprogramming and is closely related to cancer development and progression[20,21]. Quite a few studies have found that the proliferation, metastasis, and invasion of HCC are associated with enhanced aerobic glycolysis of HCC[22]. Studies have found that PP2A can control cellular metabolism by regulating the activity of enzymes involved in glycolysis[8,9]. However, the role of PPP2R3A in tumour metabolism has not been well characterized. In the current study, we found that PPP2R3A regulates the glycolysis in HCC cells by targeting hexokinase 1 (HK1).
-
Huh7 (RRID:CVCL_0336) and HepG2 (RRID:CVCL_0027) cells were maintained in our lab. The cells were cultured in Dulbecco's modified Eagle's medium (DMEM) with 10% foetal bovine serum (FBS, Gibco) at 37 °C in a humidified incubator with 5% CO2 (Thermo Fisher Scientific).
-
The PPP2R3A overexpression vector and its empty vector (PEX-3), as well as siRNA against PPP2R3A (si-PPP2R3A) and its matched negative control (si-NC) were purchased from GenePharma. Cells were seeded in 6-well plates at a density of 1 × 10⁶ and incubated overnight. The transfection reagent and overexpression plasmids or PPP2R3A siRNA were premixed for 15 min before transfection. PPP2R3A-overexpressing plasmids (2.5 µg) were transfected into the cells using 4 µL of Lipo8000 transfection reagent (Beyotime, China) in serum-free medium. PPP2R3A siRNA was transiently transfected into HepG2 and Huh7 cells at concentrations of 20 nmol/L by using 5 µL of Lipo8000 transfection reagent in serum-free medium. SiRNA against HK1 (si-HK1) were purchased from Mijia Biotech. Twenty nmol/L si-HK1 was added to the overexpressing PPP2R3A cell line by using 5 µL of Lipo8000 transfection reagent in serum-free medium. After 12 h, the medium was changed to complete medium.
-
Total RNA from the cultured cells was extracted by TRIzol reagent (Invitrogen, Carlsbad, CA, USA) based on the instructions. Subsequently, the RNA was reverse transcribed into first-strand cDNA with a miScript Reverse Transcription Kit (Qiagen, Hilden, Germany). The expression of PPP2R3A and HK1 was quantified by real-time PCR using the miScript SYBR Green PCR Kit according to the manufacturer’s protocol. HACTB was used as an internal normalized reference. Real-time PCR was carried out in the Bio–Rad IQ5 amplification system (Bio–Rad, USA), and the results were calculated using the delta CT method. The sequences of the PCR primers are shown in Table 1.
Genes Primer Sequence (5′–3′) HACTB Forward CGTGGACATCCGCAAAGA Reverse GAAGGTGGACAGCGAGGC PPP2R3A Forward AGAGAAGACAGGATTTGTGACAGCA Reverse CAGTTGGGCTTTGCTAGAAGACAG HK1 Forward TGCCATGCGGCTCTCTGATG Reverse CTTGACGGAGGCCGTTGGGTT Table 1. The Sequences of the PCR Primers
-
Total RNA from the HepG2 cells was extracted by TRIzol reagent (Invitrogen, Carlsbad, CA, USA) based on the instructions. RNA samples were treated with 20 units of RNase-Free DNase (Ambion, Shanghai, China) to remove residual genomic DNA, according to the manufacturer’s recommendations. The integrity and quantity of RNA samples were confirmed using an Agilent 2100 Bioanalyzer (Agilent Technologies, Santa Clara, CA, USA) and Nanodrop 2000 (Thermo Scientific, Wilmington, DE, USA), respectively. Five micrograms of RNA from each sample were to construct transcriptome libraries using an IlluminaTruSeqTM RNA Sample Preparation Kit (Illumina, San Diego, CA, USA) and sequenced using the IlluminaHiSeqTM 2500, according to the manufactures’ instructions. Raw reads were filtered with Q20 quality trimming, adaptors were removed, and clean reads were aligned to the human genome (GRCh38) using an HISAT2 and GTF annotation data file. Two or fewer mismatches were allowed in the alignment.
-
Total protein from cultured cells was obtained by using radio‐immunoprecipitation assay (RIPA, Beyotime, China):proteinase inhibitor (Beyotime, China):phosphatase inhibitor (Beyotime, China) = 100:1:1. Total protein from cells was subjected to 10% SDS‐PAGE and transferred onto polyvinylidene difluoride (PVDF) membranes (Sigma-Aldrich), followed by blocking with 5% nonfat milk for 1 h. The blots were probed with the primary antibody anti‐HK1 (Abnova Cat# MAB10683, RRID:AB_11188071, 1:1,000 dilution, mouse source) and anti‐PPP2R3A (Sigma-Aldrich Cat# HPA035829, RRID:AB_10696513, 1:1,000 dilution, rabbit source) overnight at 4 °C. After washing, the sections were incubated with secondary antibody (1:5,000 dilution) for 1 h. The chemiluminescent signals were visualized using ECL‐Spray (Santa Cruz) and a chemiluminescence imaging analysis system (GE A1680).
-
A total of 1 × 10⁴ cells were taken from each group for protein extraction and measured with an ELISA kit (Cloud-Clone, China) according to the protocol provided by the supplier.
-
Sterile cover slips were added to 24-well plates. HepG2 and Huh7 cells digestion counts were seeded in 24-well plates (3 × 10⁵) and gently shaken overnight. The supernatant was discarded 72 h after transfection, and the cells were washed three times with PBS. Cells were fixed with freshly prepared 4% paraformaldehyde for 15 min and lysed with 0.1% Triton-X-100-PBS for 15 min. The proteins were probed with the primary antibody anti‐HK1 (Abnova Cat# MAB10683, RRID:AB_11188071, 1:500 dilution, mouse source) overnight at 4 °C. After washing, 1:400 proportion-diluted donkey anti-mouse fluorescent secondary antibody was added. Finally, nuclei were stained with 4,6-diacetyl-acetyl-2-phenylindindex (4,6-diamidino-2-phenylindole, DAPI) in a 1:500 ratio added for 3 min. Analysis was performed after sheet sealing with a fluorescent sealer.
-
Liver cancer tissue samples were obtained from the Department of Organ Transplantation, The Third Medical Center of PLA General Hospital. Briefly, HCC tissues were formalin-fixed, paraffin embedded, and serially sectioned to 4-μm thickness. After 1 h of dewaxing, the sections were repaired with an antigen repair solution of pH = 9 for 20 min. The primary antibodies against PPP2R3A (Sigma-Aldrich Cat# HPA035829, RRID:AB_10696513, 1:500 dilution, rabbit source) and HK1 (Abnova Cat# MAB10683, RRID:AB_11188071, 1:500 dilution, mouse source) were incubated at 4 °C overnight. After washing, the plate was incubated with HRP-conjugated secondary antibodies. Analysis was performed after sheet sealing with a fluorescent sealer.
-
The Glucose Assay Kit (Jiancheng Bioengineering Institute, Nanjing, China) and Lactate Assay Kit (Jiancheng Bioengineering Institute, Nanjing, China) were used according to the manufacturer's protocols to detect glucose uptake and lactate production HCC cells. All values were normalized to cell number (1 × 10⁶ cells).
-
A sterile 8-µm perforated chamber was placed in 6-well plates, 3 mL of DMEM with 10% FBS was added to the lower chamber, and the transfected cells were plated into the upper chamber at a density of 1 × 10⁶ cells/well in 1.5 mL of serum-free medium. Cells were cultured in a 37 °C humidified incubator with 5% CO2 for 48 h. The upper chamber residual cells were wiped off with a wet cotton stick. The cells that migrated through the 8-µm pores and adhered to the lower surface of the membranes were stained with 4% crystal violet dye solution containing paraformaldehyde for 30 min. PBS was used to wash the cells three times, and cell migration was recorded in each group under a light microscope.
-
The Matrigel was diluted with serum-free medium (1:7). A sterile 8-µm perforated chamber was placed in 6-well plates, and 400 µL of diluted Matrigel was added to the upper chamber overnight at 37 °C. The transfected cells were plated into the upper chamber at a density of 1 × 10⁶ cells/well and cultured in a 37 °C humidified incubator with 5% CO2 for 72 h. The upper chamber residual cells were wiped off with a wet cotton stick. The lower surface of the membranes was stained with 4% crystal violet dye solution containing paraformaldehyde for 30 min. PBS was used to wash the cells three times, and cell invasion was recorded in each group under a light microscope.
-
Cell proliferative capacity was determined by the Cell Counting Kit‐8 reagent (CCK‐8, Engreen). Cells were seeded (1 × 10³ cells/well in 100 μL of medium) in 96‐well plates containing DMEM with 10% FBS. The proliferative activity of cells was measured by CCK-8 at 0 h, 24 h, 48 h, 72 h, and 96 h. Briefly, 100 µL of CCK-8 dilution (CCK-8 to complete medium ratio = 1:10) was added, the plates were reacted at 37 °C for 120 min, and an M5 multifunctional microplate reader (Bio‐Rad) was used to detect the absorbance value at 450 nm.
-
Statistical graphs were generated by GraphPad Prism 9 (GraphPad Prism, RRID:SCR_002798). The correlation between PPP2R3A expression and HK1 was determined by Fishers exact test. The statistical significance of differences between two groups was determined by the t test. Measurement data are expressed as the mean ± SE. Significance was assumed at P < 0.05.
-
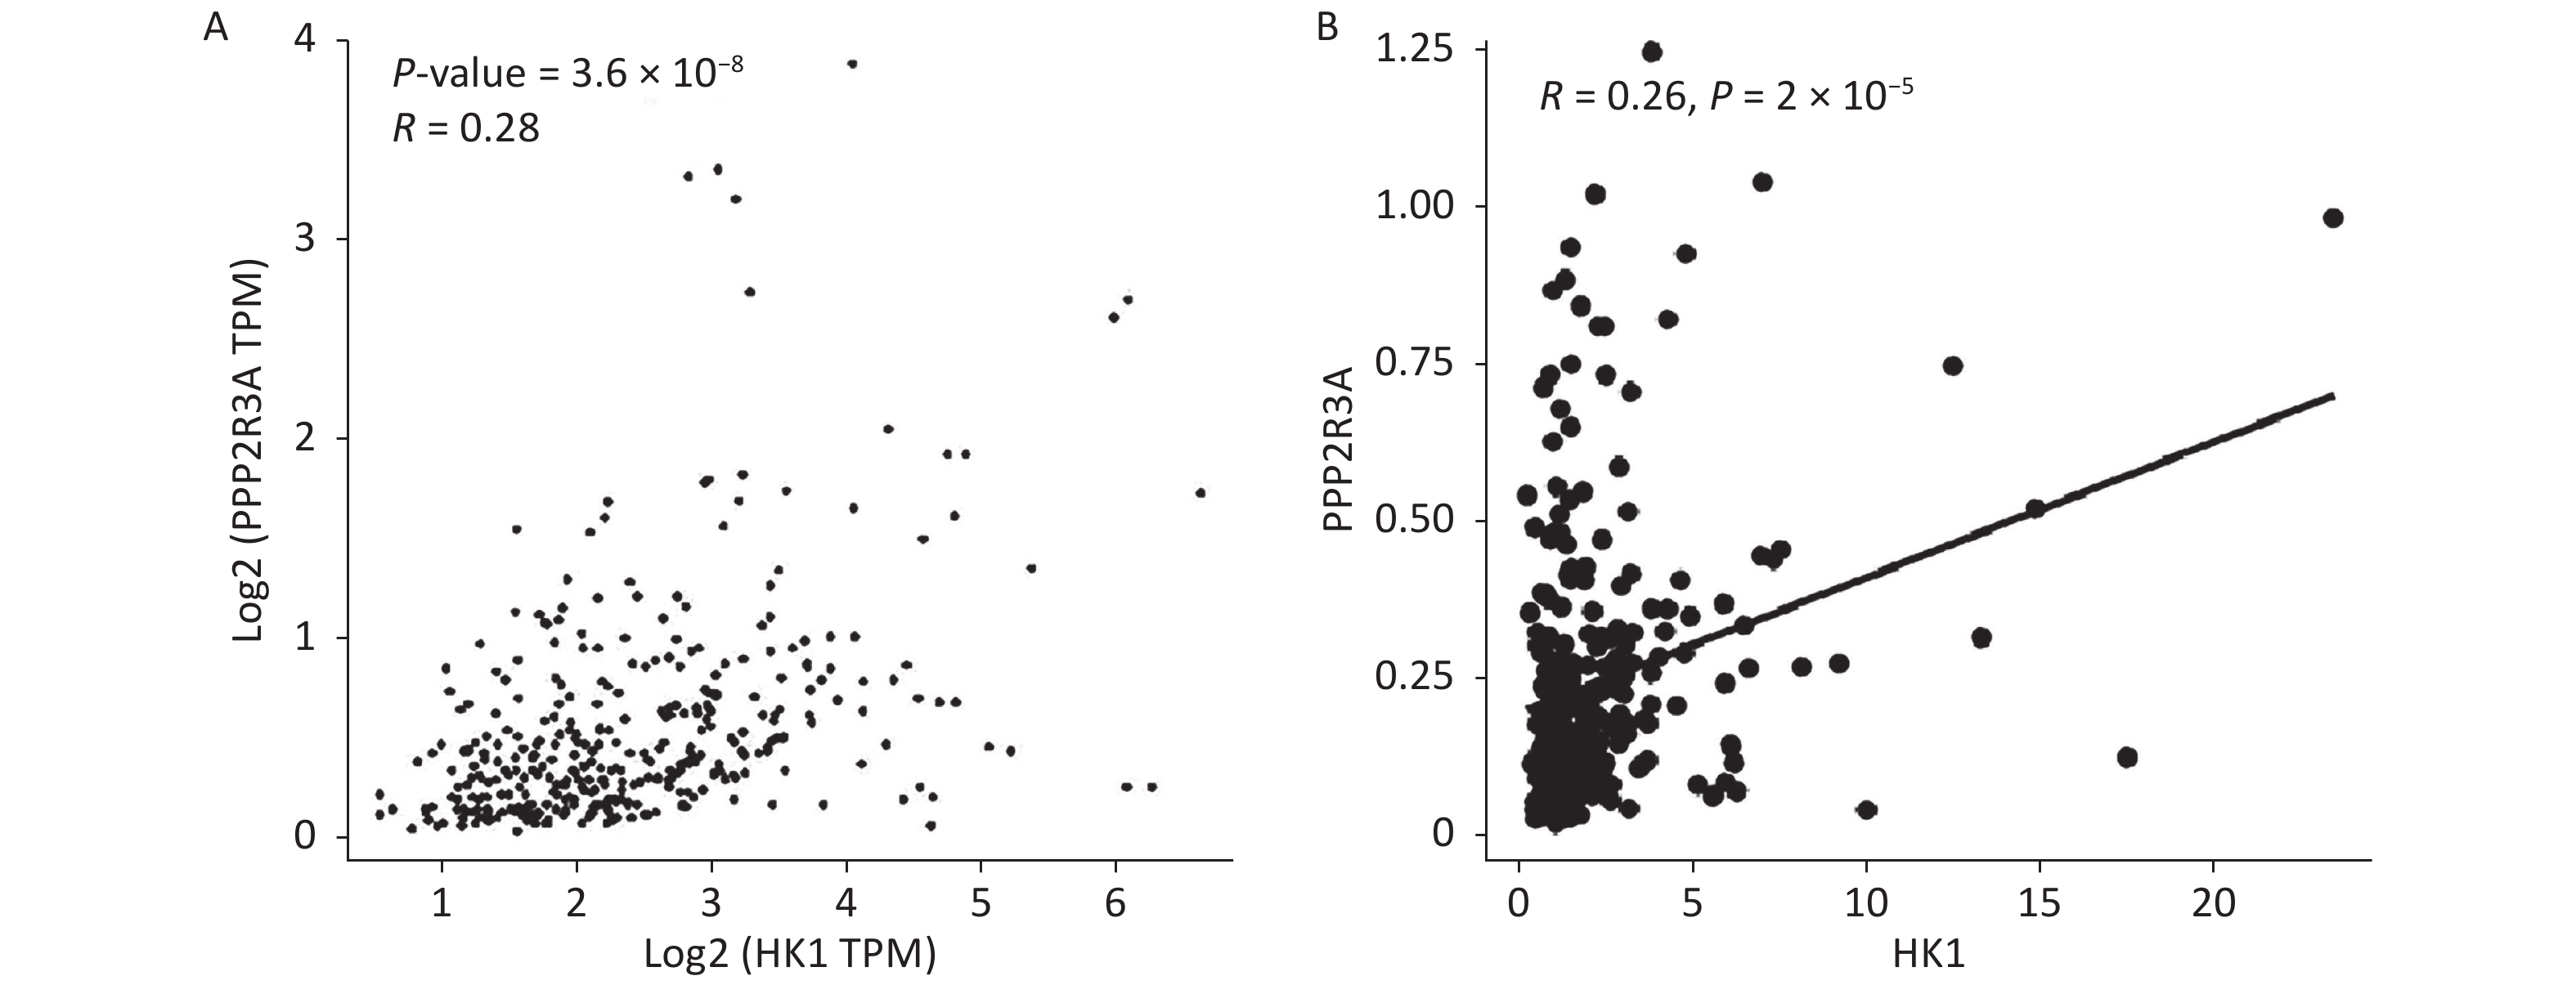
Our previous studies found that high expression of PPP2R3A can promote malignant biological behaviours such as the proliferation and invasion of HCC cells and is associated with the poor prognosis of HCC[16-18]. To further explore the underlying molecular mechanisms by which PPP2R3A promotes the malignant behaviour of liver cancer cells, we performed transcriptome sequencing analysis in the control group and PPP2R3A knockdown group. Differentially expressed genes (DEGs) with a P value < 0.05 and |log2 fold-change (FC)| > 1 were selected. Because aerobic glycolysis plays an important role in the treatment and malignant behaviour of cancer[22], we focused on the glycolytic signalling pathway and obtained the differentially expressed gene HK1 (|log2 FC| = 1.215,604,502; P < 0.001), which is the first rate-limiting enzyme in the glycolytic path way[23]. The GEPIA (
http://gepia.cancer-pku.cn/ ) (r = 0.28, P < 0.05; Figure 1A) and TCGA online (https://xenabrowser.net ) (r = 0.26, P < 0.05; Figure 1B) databases revealed a positive correlation between PPP2R3A and HK1 expression in HCC.
Figure 1. The positive correlation between PPP2R3A and HK1 expression in hepatocellular carcinoma (HCC) was confirmed from the online database. (A) The GEPIA (http://gepia.cancer-pku.cn/) databases revealed a positive correlation between PPP2R3A and HK1 expression in HCC. (B) The TCGA online (https://xenabrowser.net) databases revealed a positive correlation between PPP2R3A and HK1 expression in HCC.
Then, we overexpressed PPP2R3A in HepG2 and Huh7 cells by plasmid transfection and knocked down PPP2R3A by siRNA to observe the changes in HK1 expression. Overexpression of PPP2R3A increased the gene and protein expression levels of HK1 in HepG2 and Huh7 cells (both P < 0.05; Figure 2A, B). In contrast, PPP2R3A knockdown reduced the gene and protein expression levels of HK1 (both P < 0.05; Figure 2C, D). These results indicate that PPP2R3A positively regulates HK1 expression in liver cancer cells.
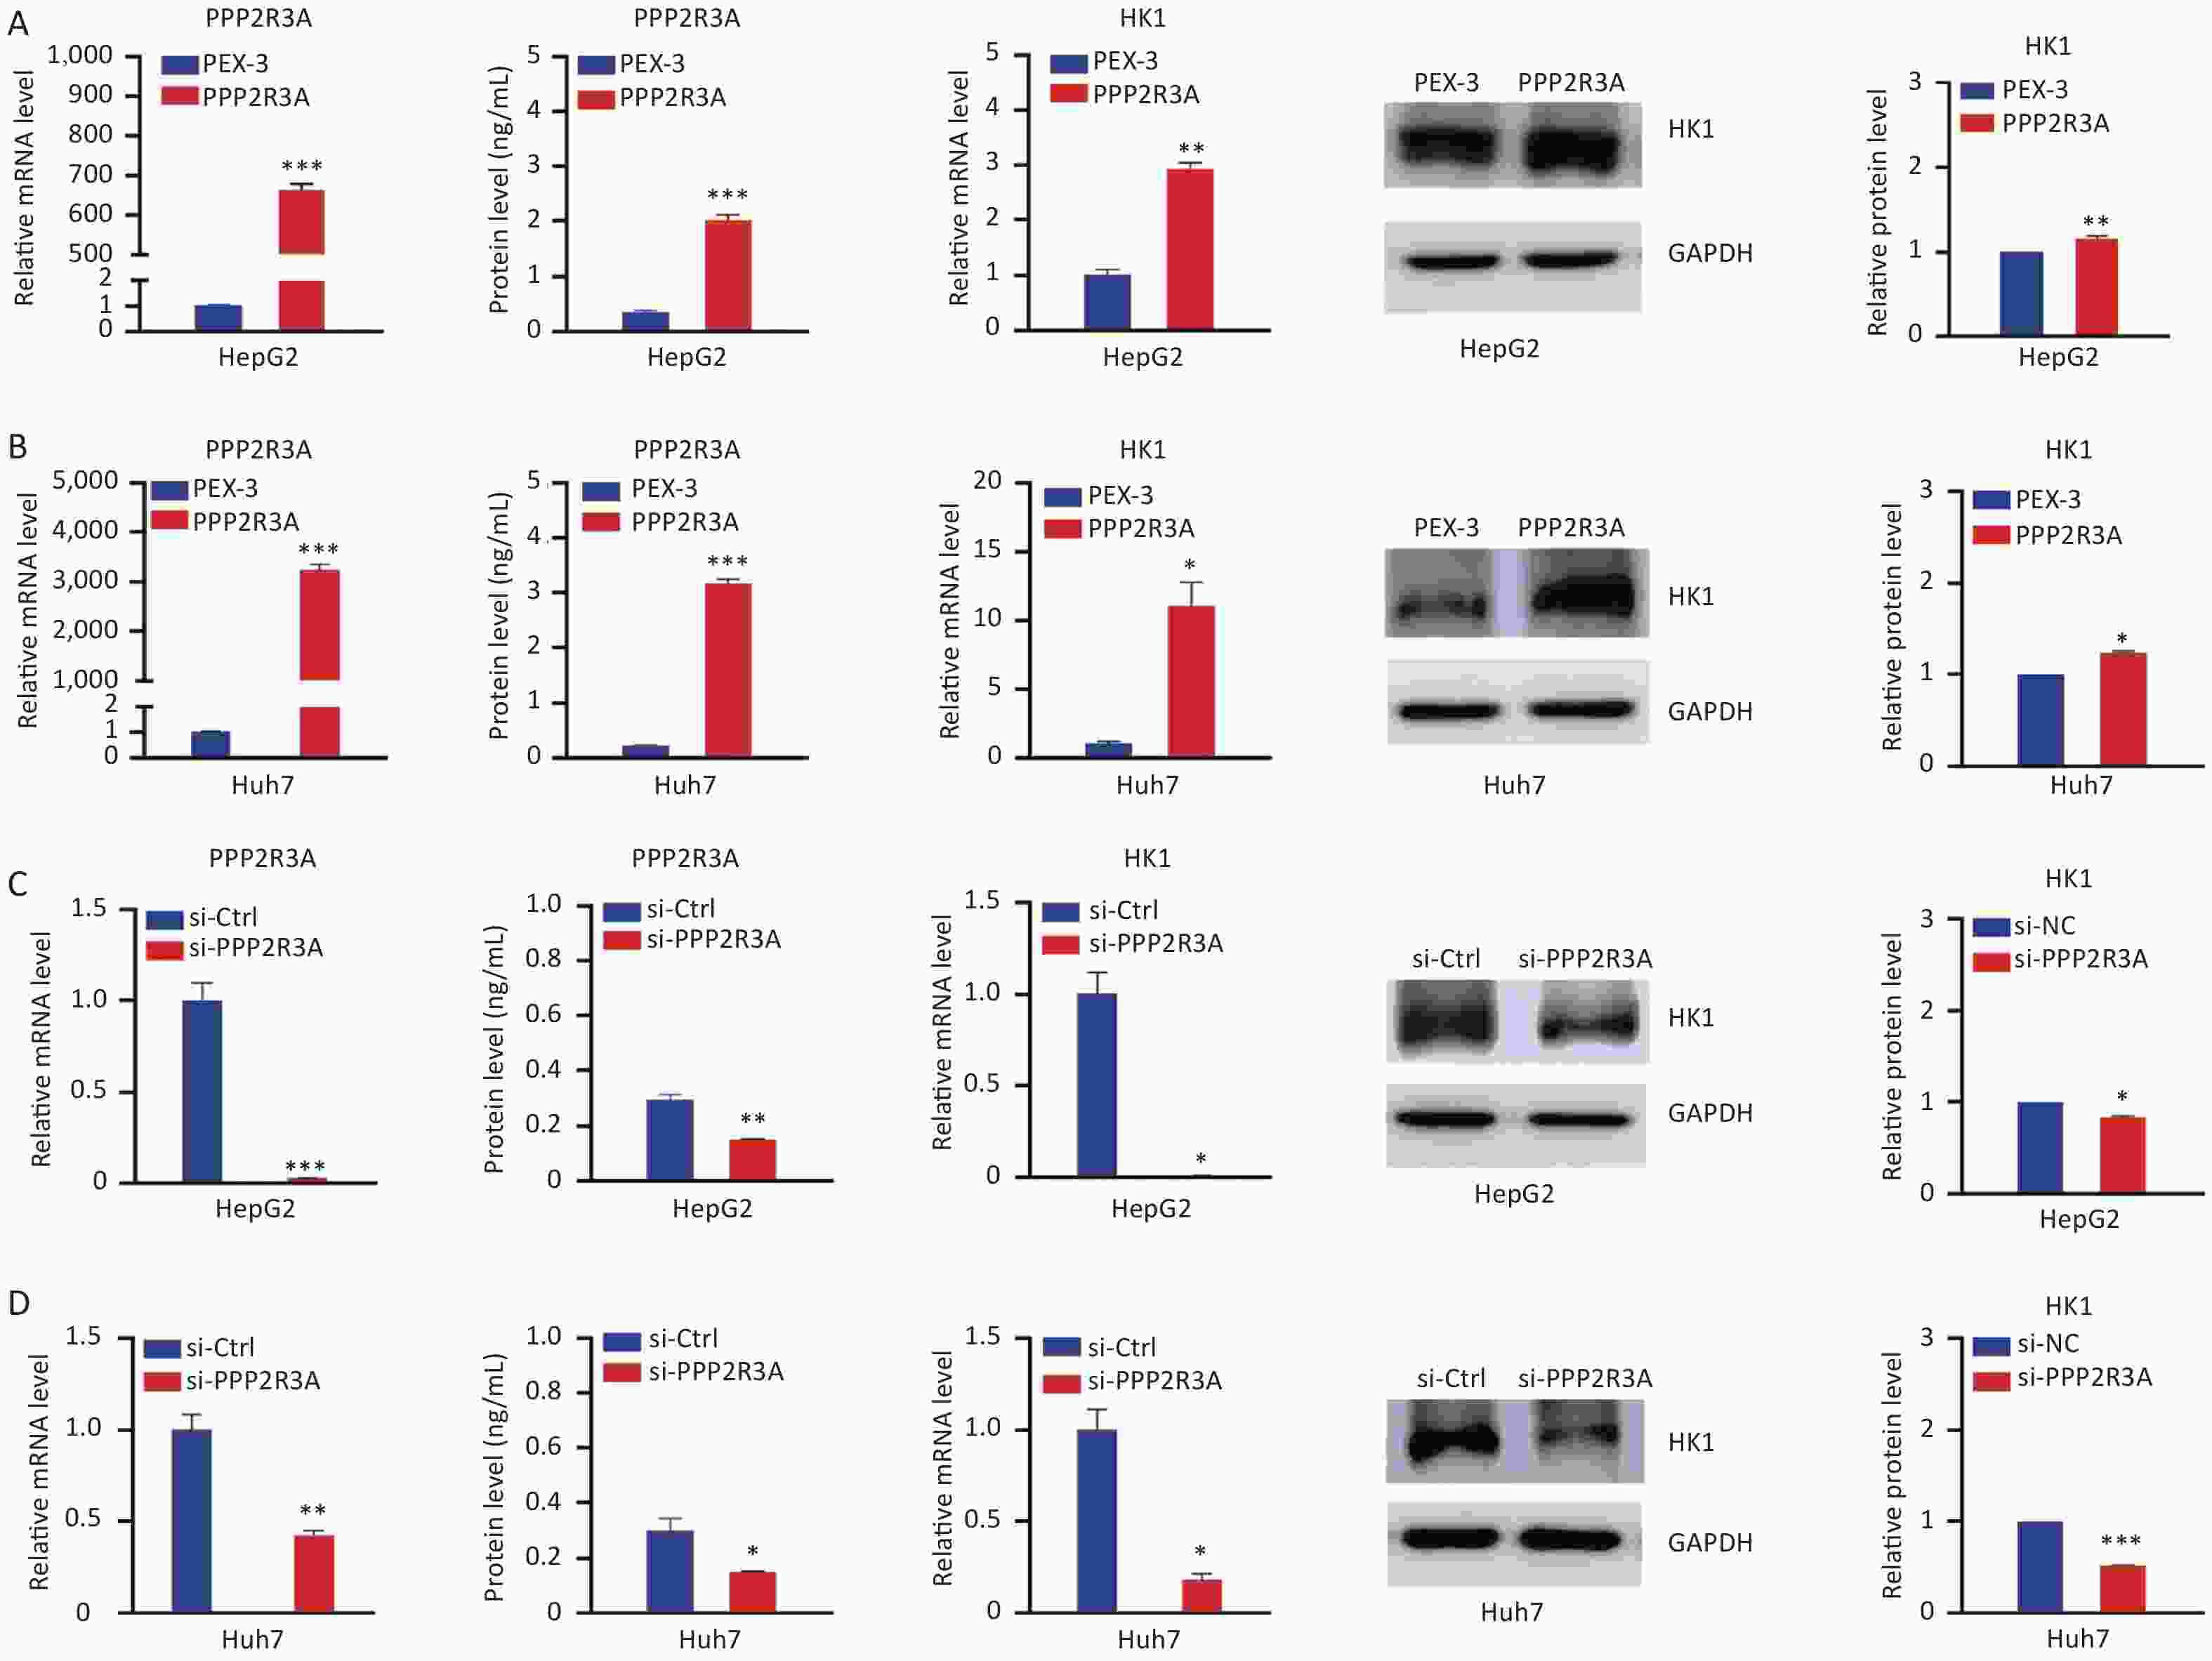
Figure 2. PPP2R3A regulates the expression of the HK1 gene in liver cancer cells. (A) The expression levels of PPP2R3A and HK1 in the control group and PPP2R3A overexpression group of HepG2 cells. (B) The expression levels of PP2R3A and HK1 in the control group and PPP2R3A overexpression group of Huh7 cells. (C) The expression levels of PPP2R3A and HK1 in the control group and PPP2R3A knockdown group of HepG2 cells. (D) The expression levels of PPP2R3A and HK1 in the control group and PPP2R3A knockdown group of Huh7 cells. Data are presented as mean ± SEM (n = 3); *P < 0.05, **P < 0.01, ***P < 0.001.
-
PPP2R3A positively regulates HK1 at the protein level in 9 primary HCC samples (r = 0.906, P = 0.001; Figure 3A), and representative colocalized dual immunofluorescence staining images are shown in Figure 3B. The red fluorescence represents the PPP2R3A protein (the secondary antibody is rabbit), and green fluorescence represents the HK1 protein (the secondary antibody is mouse). The results showed that both PPP2R3A and HK1 were expressed in the cytoplasm and showed significant yellow overlap, indicating that the PPP2R3A and HK1 protein colocalized in the cytoplasm in liver cancer. This finding further confirmed the close correlation of the two proteins in HCC.

Figure 3. PPP2R3A positively correlates with HK1 in HCC samples. (A) Scatter plot showing the correlation between PPP2R3A and HK1 at the protein level in primary HCC samples (n = 9), assessed by dual immunofluorescence staining. r = 0.906, P = 0.001. (B) Representative pictures of dual immunofluorescence staining of PPP2R3A and HK1 in primary HCC samples. Bars = 200 µm.
-
Considering that HK1 is a key protein that regulates glycolysis, we further explored the effects of the PPP2R3A overexpression vector group, empty vector (PEX-3) group, PPP2R3A knockdown group and matched negative control (si-NC) group on glycolysis in liver cancer cells. As shown in Figure 4A the PPP2R3A overexpression vector increased glucose uptake and lactate production in HepG2 and Huh7 cells (both P < 0.05). In contrast, PPP2R3A knockdown decreased glucose uptake and lactate production in HepG2 and Huh7 cells (both P < 0.05; Figure 4B). Taken together, these findings indicate that PPP2R3A regulates glycolysis in liver cancer cells.

Figure 4. PPP2R3A regulates the level of glycolysis in liver cancer cells. (A) The glucose uptake and lactate production in the PEX-3 group and PPP2R3A-overexpressing group in HepG2 and Huh7 cells. (B) The glucose uptake and lactate production in the si-NC and PPP2R3A knockdown group in HepG2 and Huh7 cells. Data are presented as mean ± SEM (n = 3); *P < 0.05, **P < 0.01, ***P < 0.001.
-
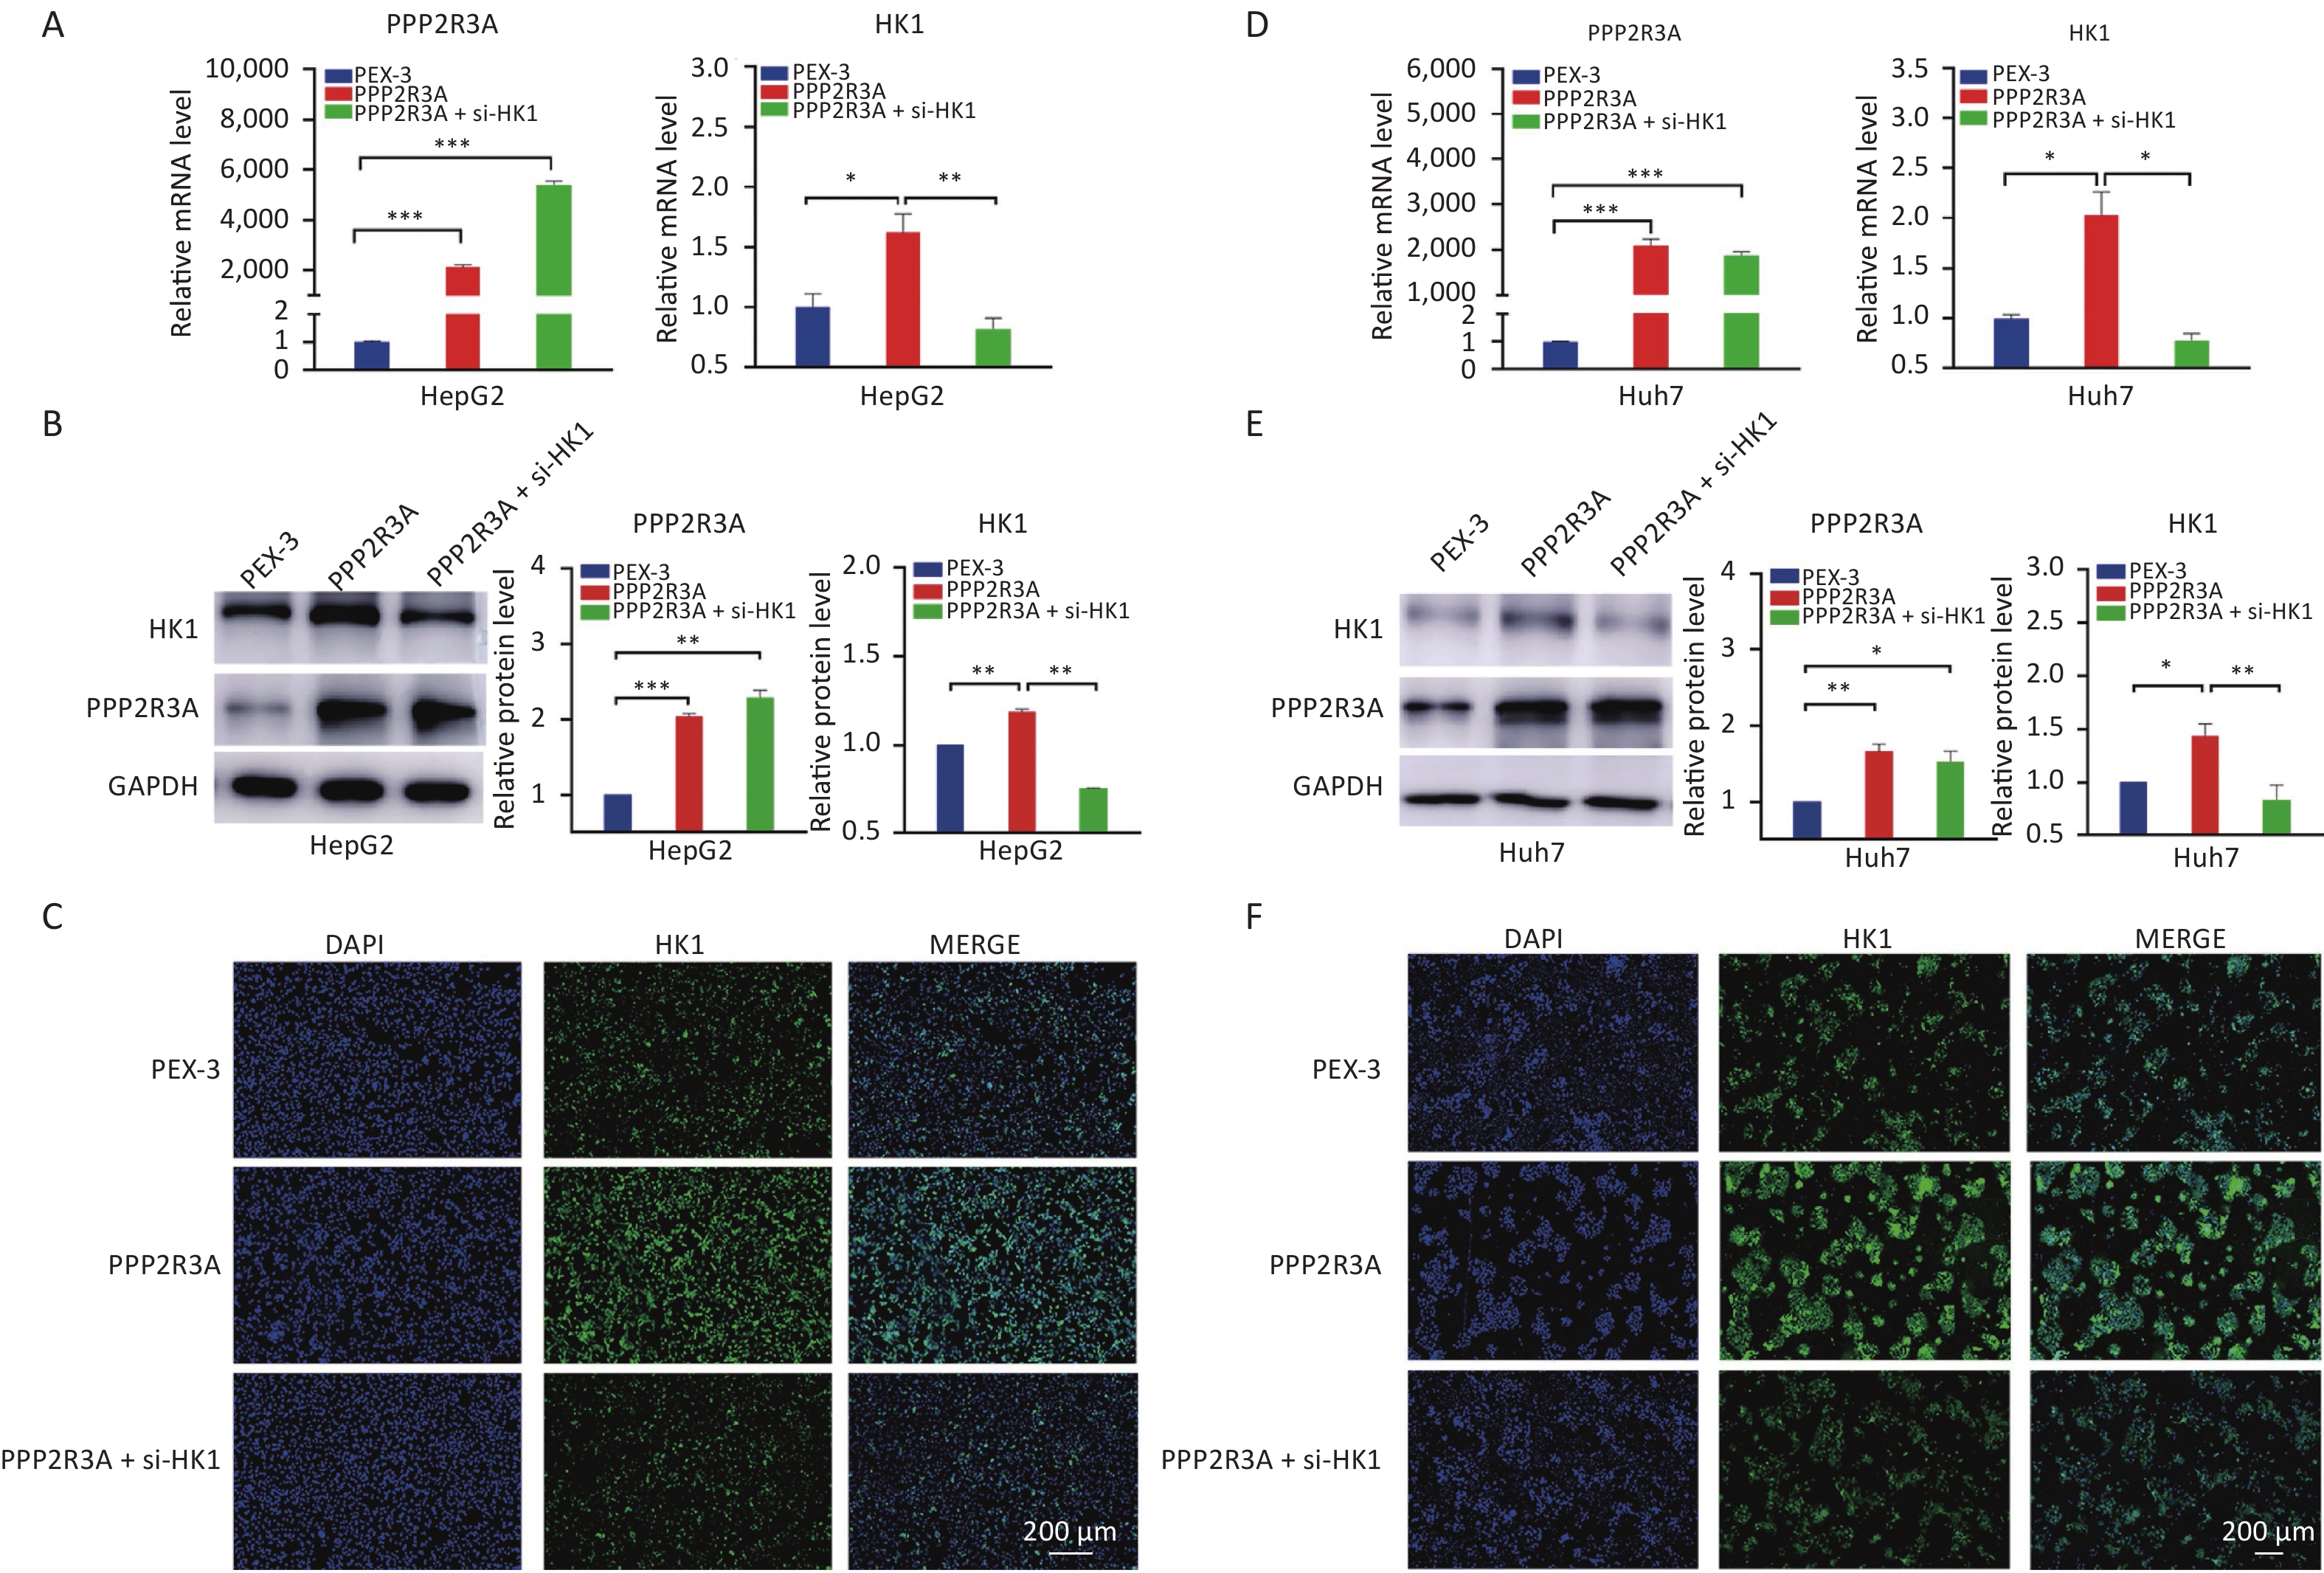
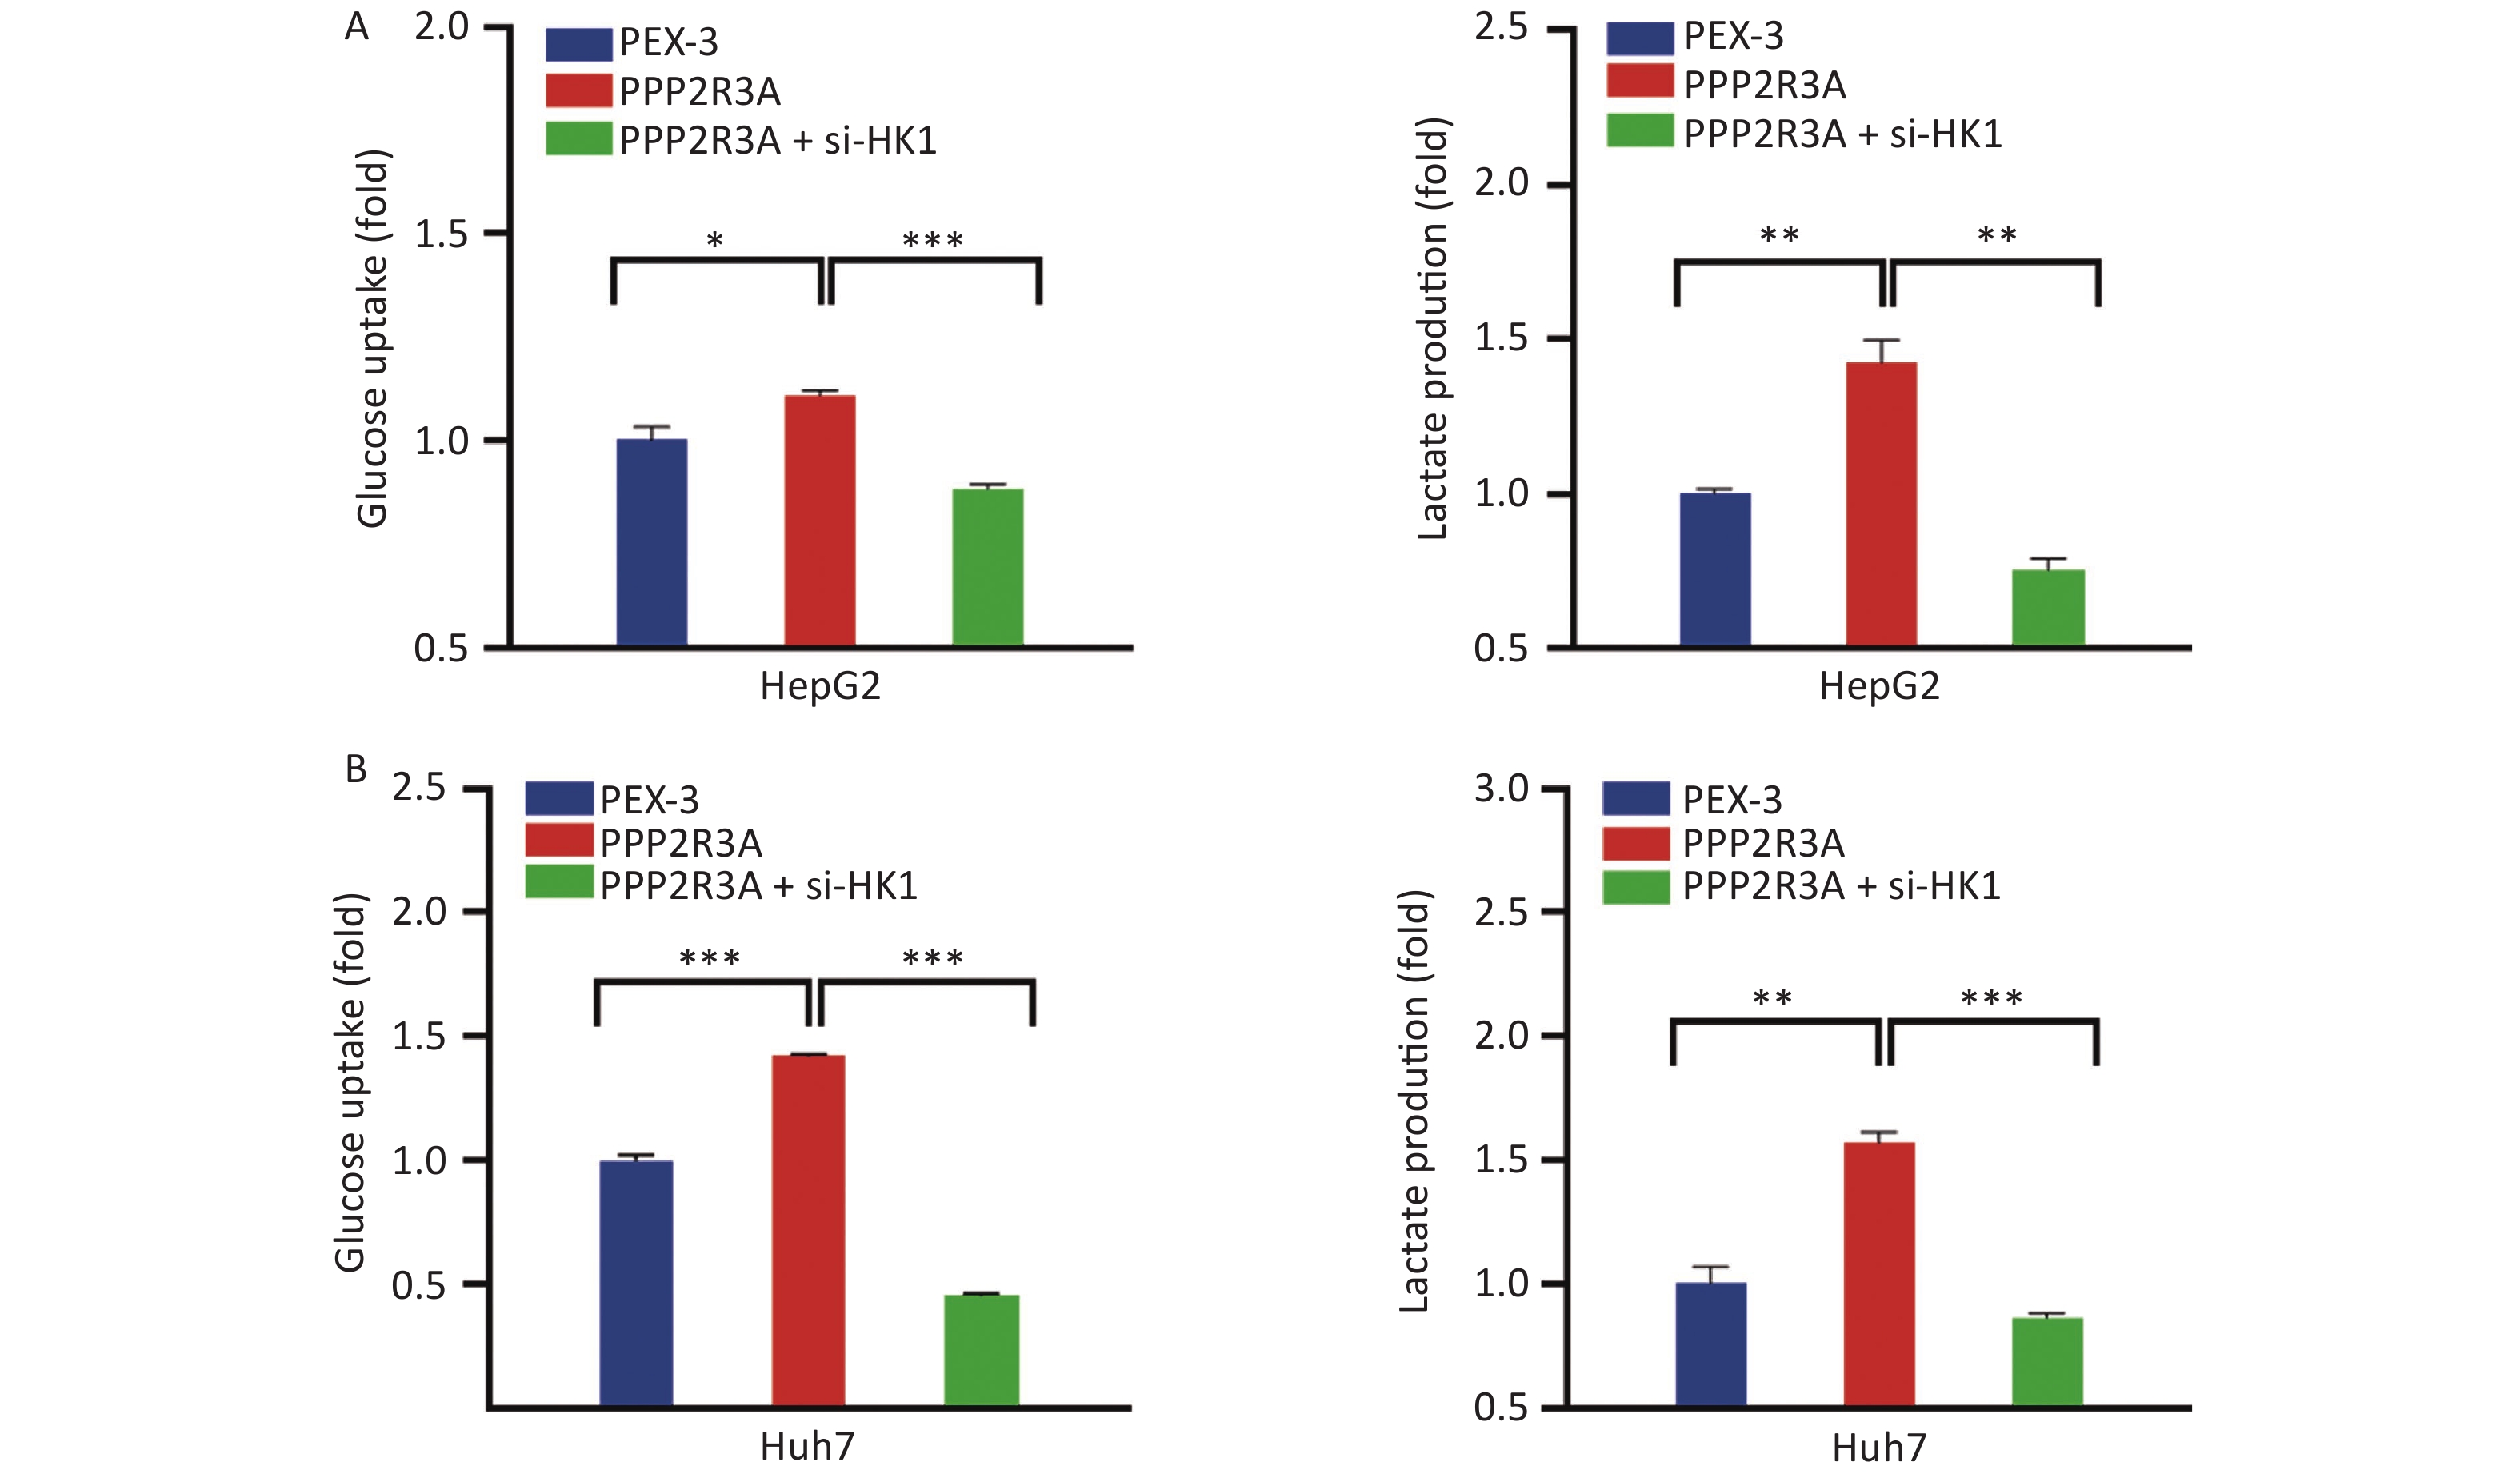
To further confirm that PPP2R3A-regulated HK1 affects glycolysis in HCC, we added the si-HK1 to the overexpression of PPP2R3A to observe the changes in glycolysis. After si-HK1 addition, the gene and protein expression of HK1 was decreased compared with that in the PPP2R3A-overexpressing group (Figure 5). When PPP2R3A was overexpressed, glucose uptake and lactate production were increased, and based on the addition of the si-HK1, glucose uptake and lactate production were decreased compared with the PPP2R3A overexpression group alone (Figure 6A, B). This result illustrates that the upregulation of glycolysis by PPP2R3A was reversed by si-HK1. These results showed that HK1 inhibition abolished the promoting effect of PPP2R3A on glycolysis in liver cancer cells.
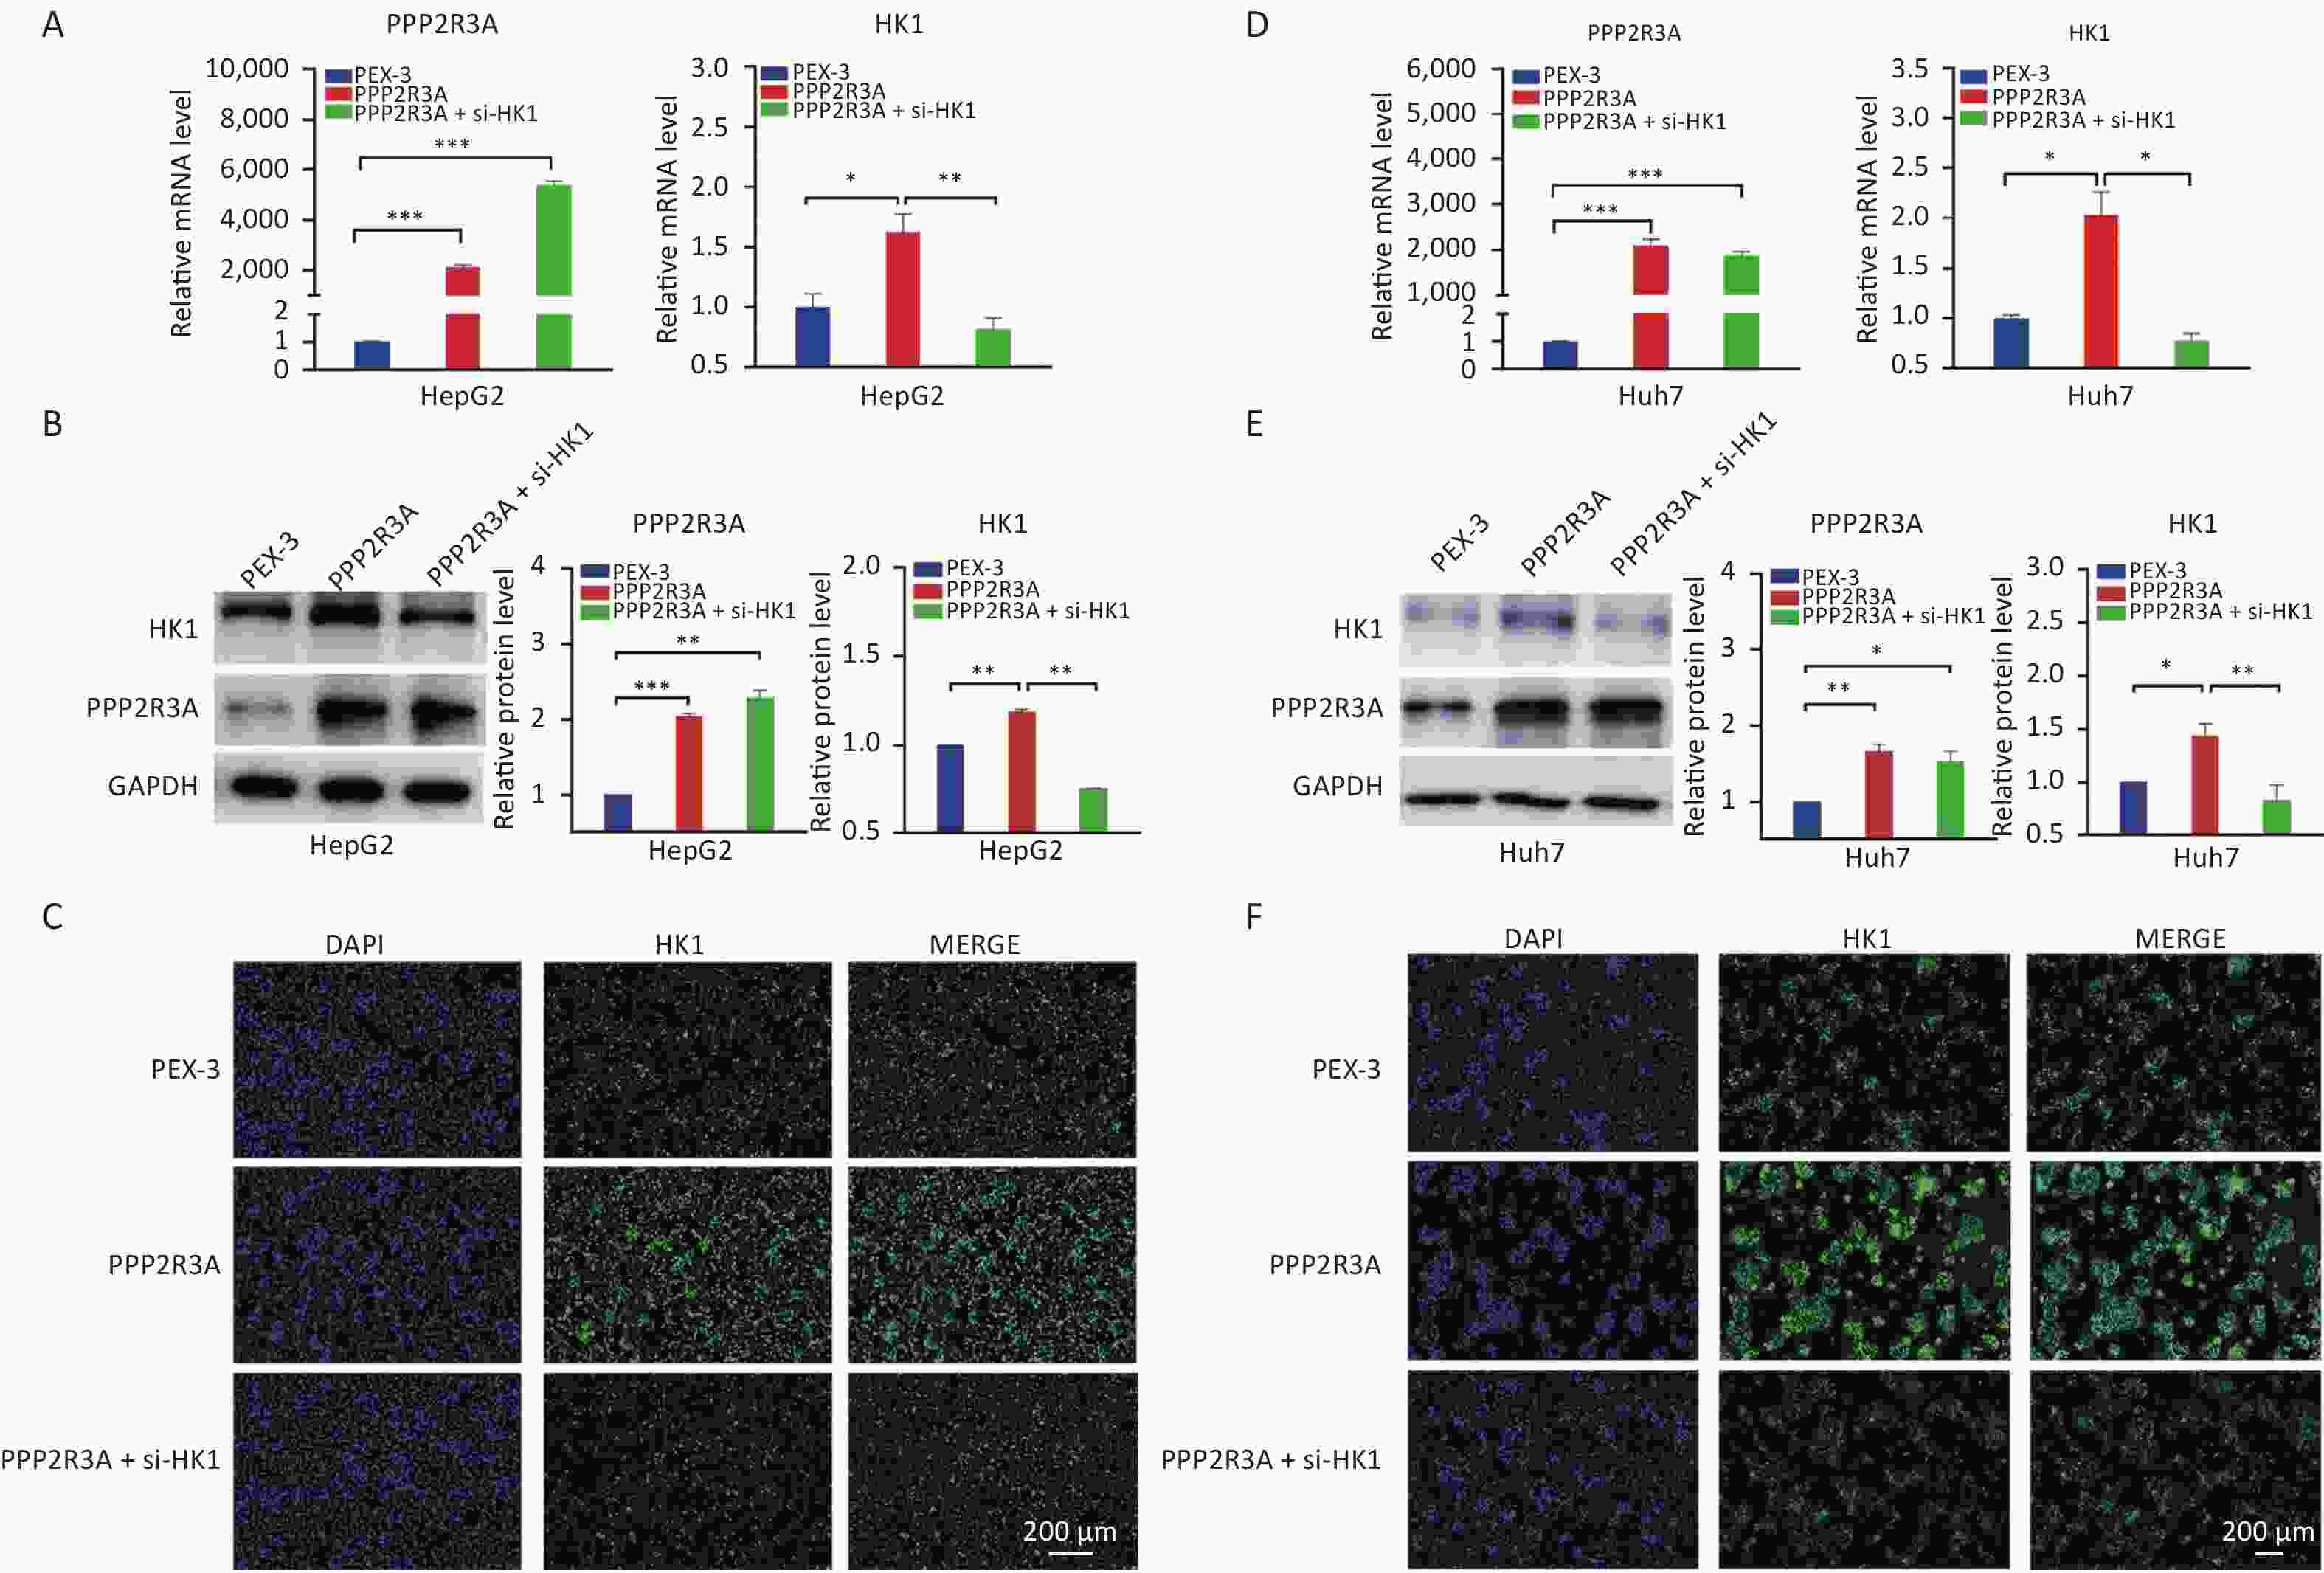
Figure 5. The expression levels of HK1 in PPP2R3A-overexpressing cells with or without si-HK1. (A) The gene expression levels of HK1 in PPP2R3A-overexpressing HepG2 cells with or without si-HK1 by RT-PCR. (B) The protein expression levels of HK1 in PPP2R3A-overexpressing HepG2 cells with or without si-HK1 by western blotting analysis. (C) The protein expression levels of HK1 in PPP2R3A-overexpressing HepG2 cells with or without si-HK1 by immunofluorescence assay. (D) The gene expression levels of HK1 in PPP2R3A-overexpressing Huh7 cells with or without si-HK1 by RT-PCR. (E) The protein expression levels of HK1 in PPP2R3A-overexpressing Huh7 cells with or without si-HK1 by western blotting analysis. (F) The protein expression levels of HK1 in PPP2R3A-overexpressing Huh7 cells with or without si-HK1 by immunofluorescence assay. Data are presented as mean ± SEM (n = 3); *P < 0.05, **P < 0.01, ***P < 0.001. Bars = 200 µm.
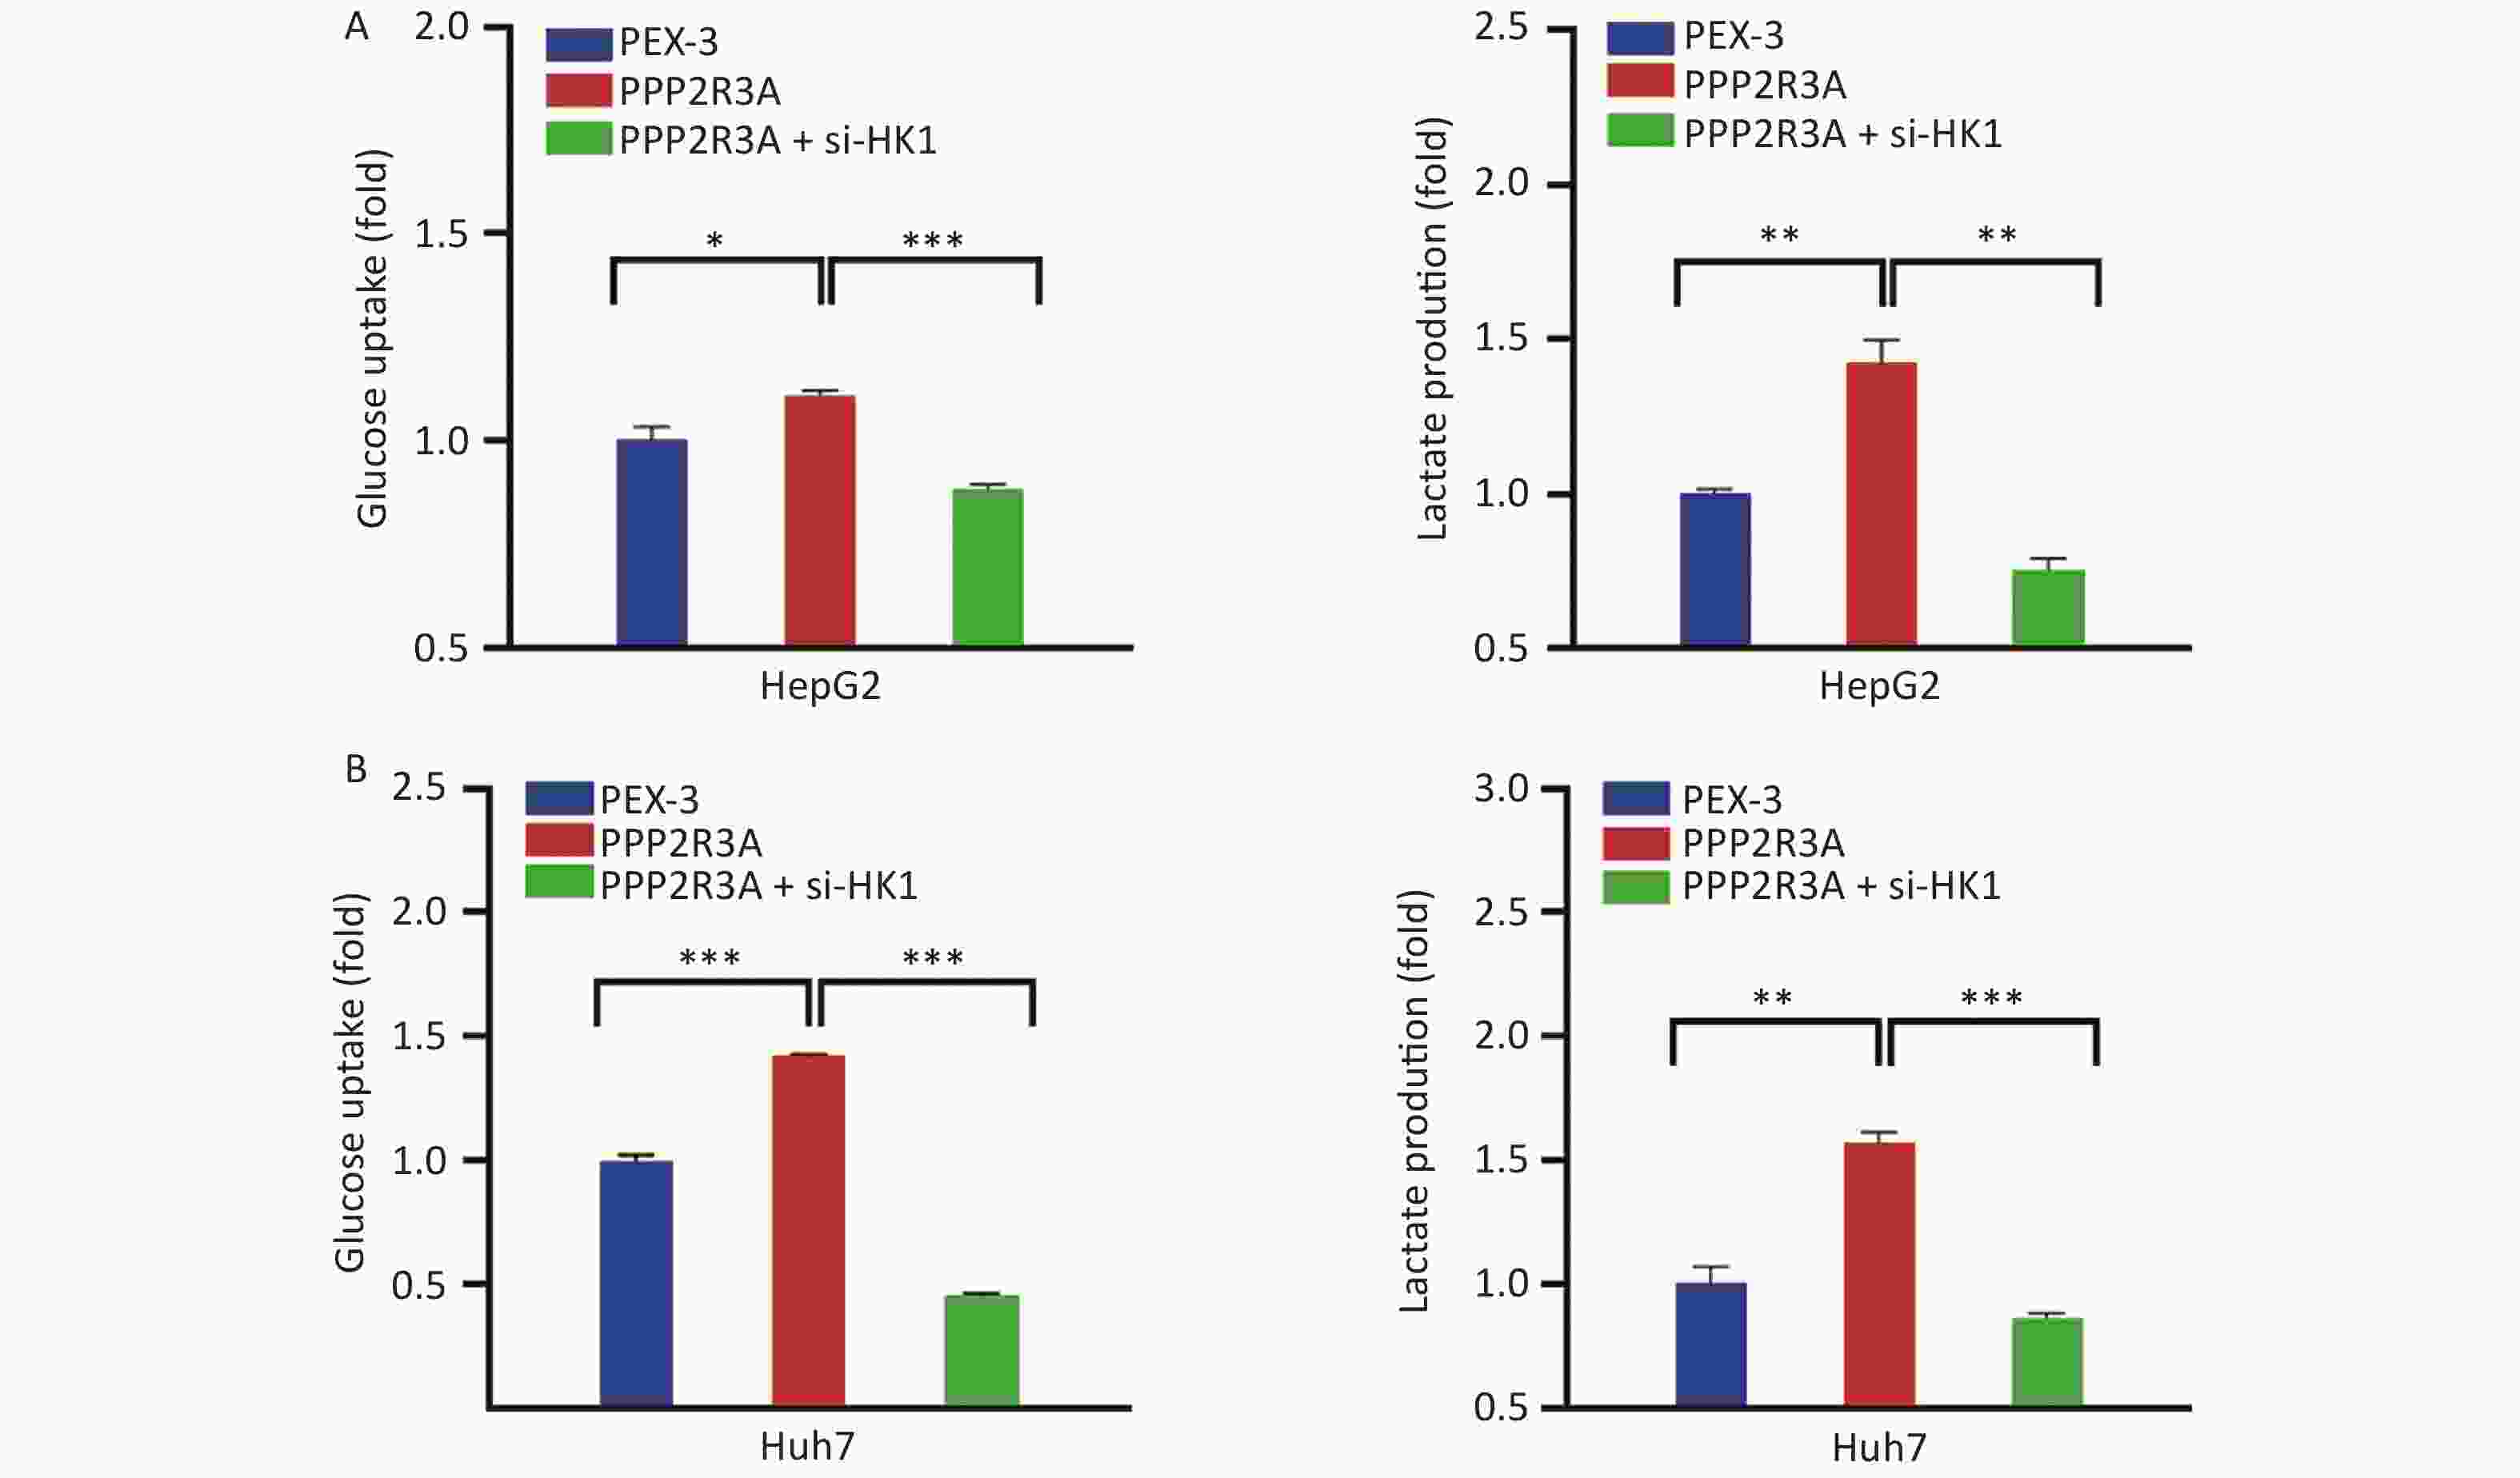
Figure 6. HK1 inhibition attenuated the induction of glycolysis by PPP2R3A overexpression in liver cancer cells. (A) Glucose uptake an lactate production in PPP2R3A-overexpressing HepG2 cells with or without si-HK1. (B) Glucose uptake and lactate production in PPP2R3A-overexpressing Huh7 cells with or without si-HK1. Data are presented as mean ± SEM (n = 3); *P < 0.05, **P < 0.01, ***P < 0.001.
-
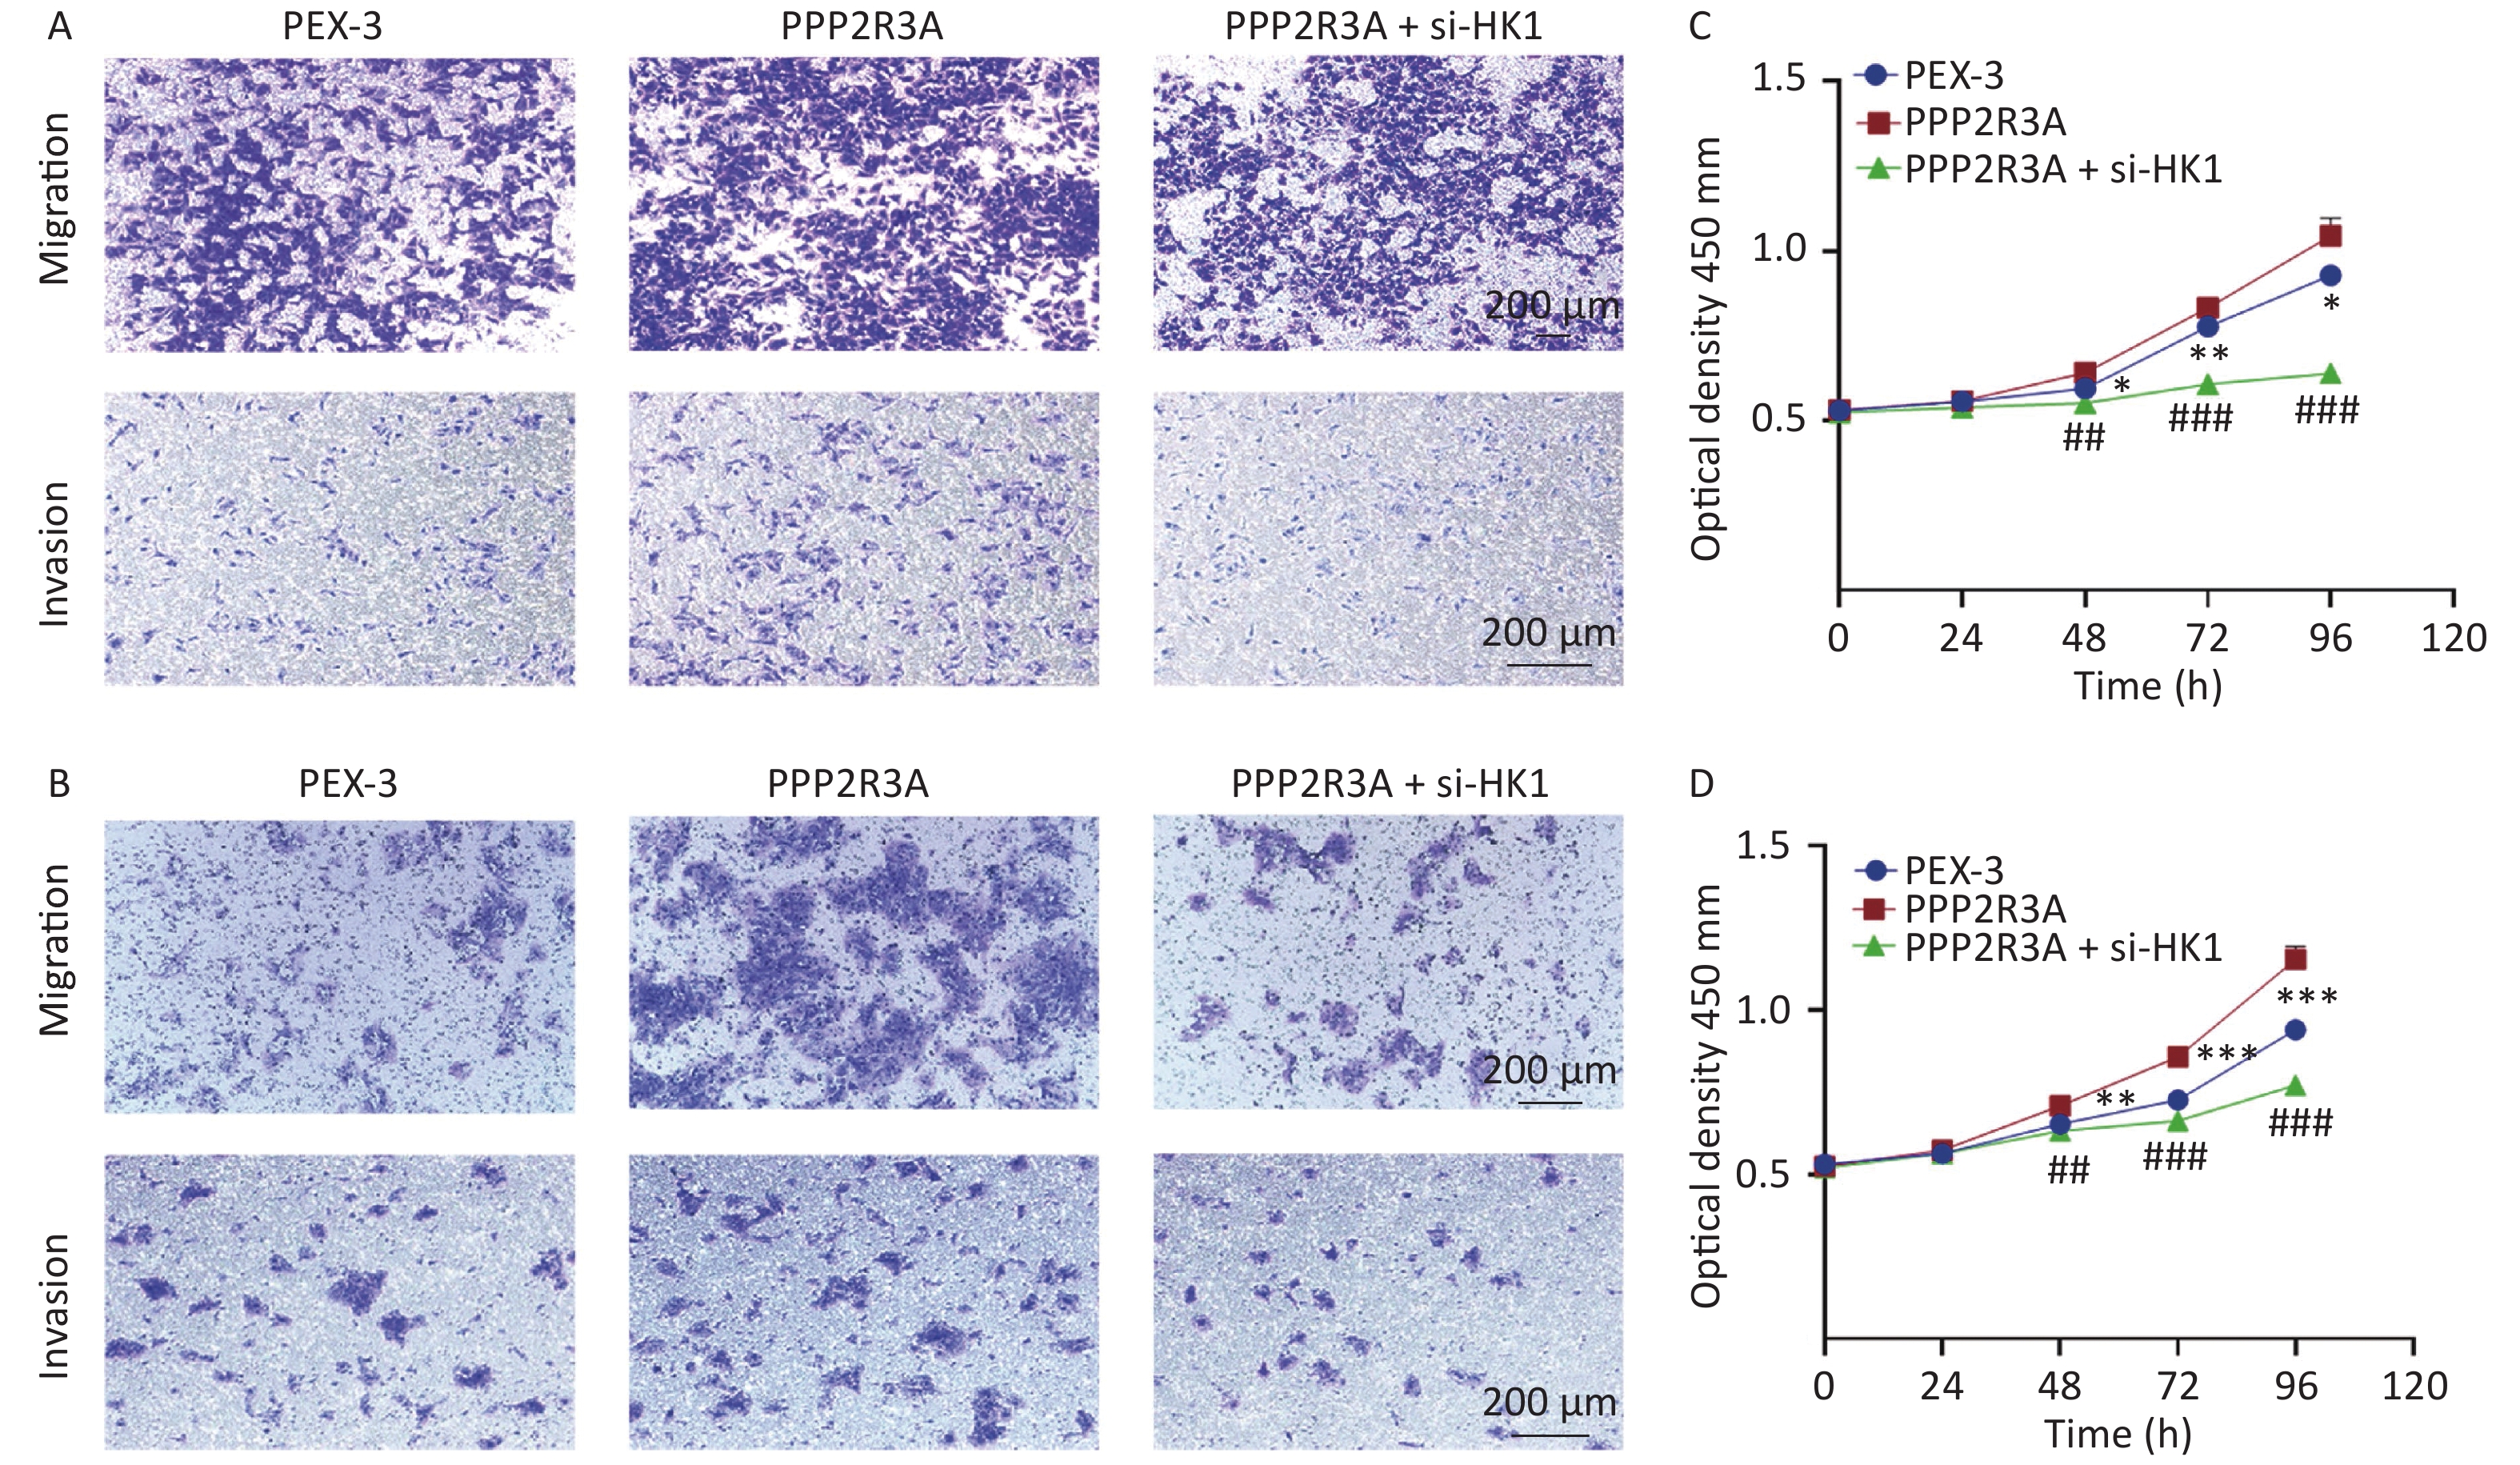
Our previous studies found that the overexpression of PPP2R3A can promote malignant biological behaviours such as the proliferation and invasion of HCC cells. Therefore, we wanted to determine whether HK1 is related to the malignant behaviour of PPP2R3A. We overexpressed PPP2R3A in the presence or absence of si-HK1. We found that overexpression of PPP2R3A enhanced the proliferation, migration and invasion of liver cancer cells, which was attenuated upon inhibition of HK1 expression (Figure 7A, B, C, D).
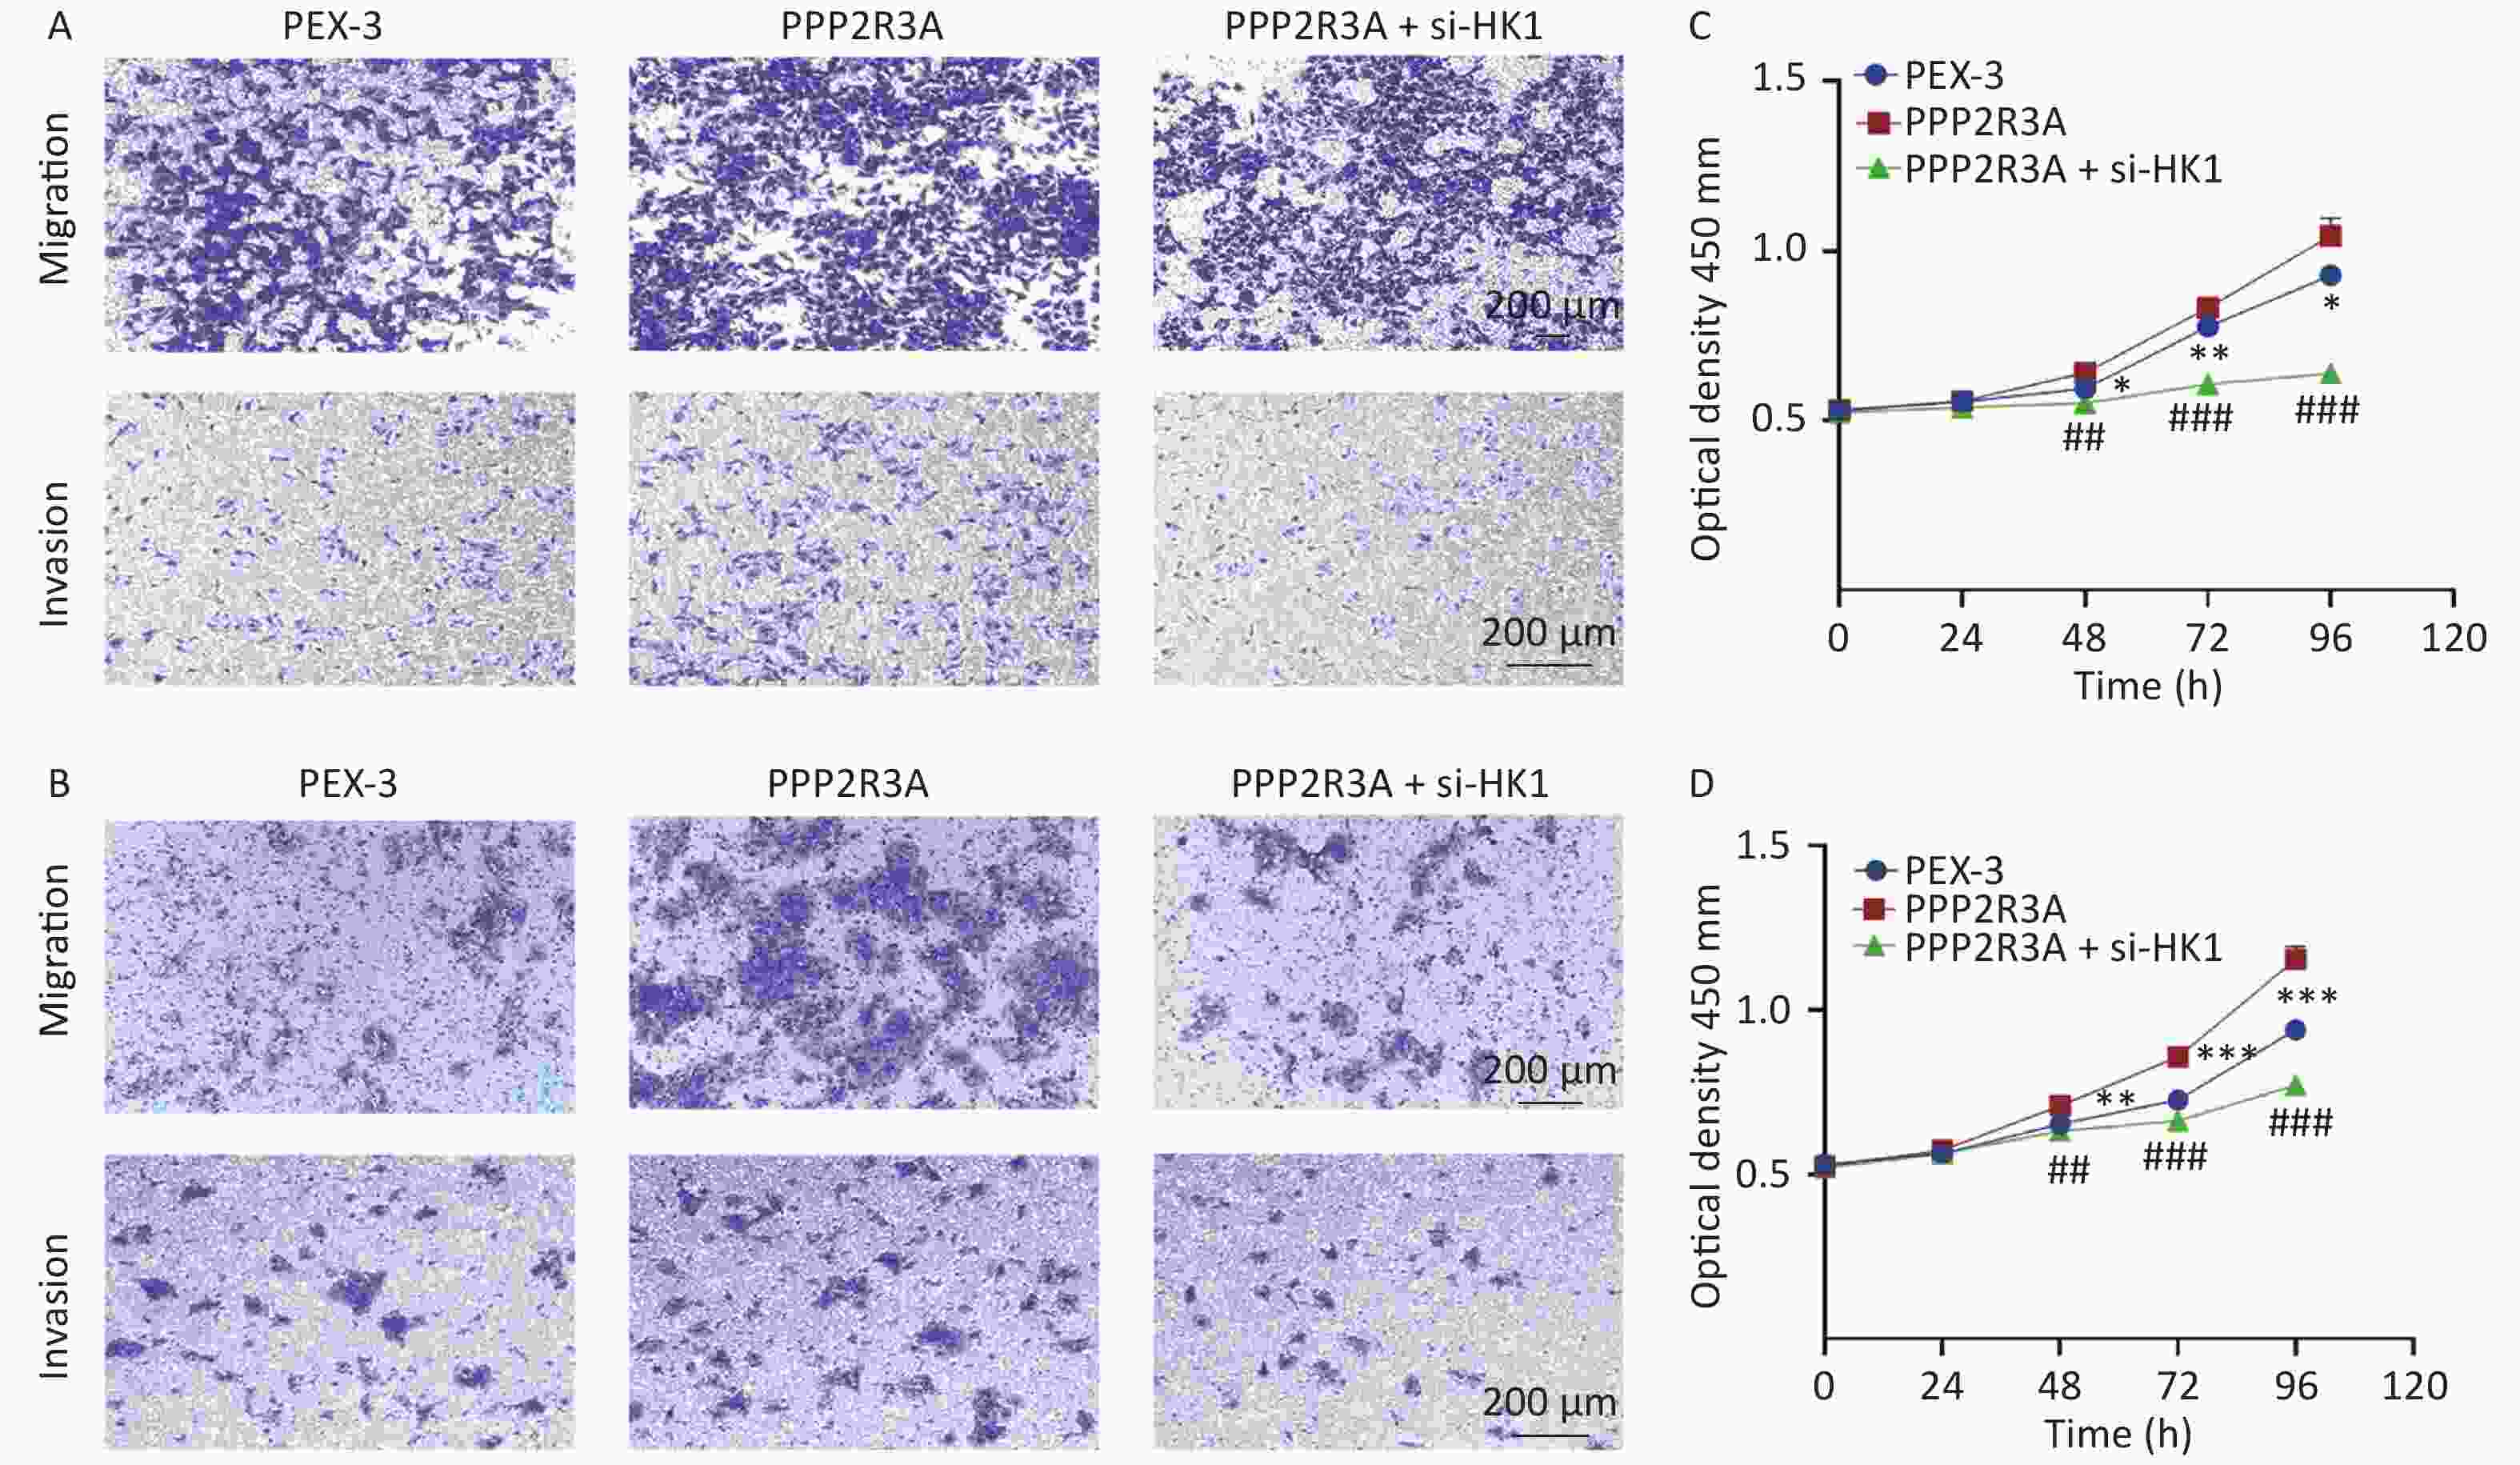
Figure 7. HK1 inhibition attenuates the promotion of liver cancer cell proliferation, migration and invasion by PPP2R3A overexpression. (A) Cell migration and invasion assays of PPP2R3A-overexpressing HepG2 cells with or without si-HK1. (B) Cell migration and invasion assays of PPP2R3A-overexpressing Huh7 cells with or without si-HK1. (C) Cell proliferation of PPP2R3A-overexpressing HepG2 cells with or without si-HK1. (D) Cell proliferation of PPP2R3A-overexpressing Huh7 cells with or without si-HK1. Data are presented as mean ± SE (n = 3); *P < 0.05, **P < 0.01, ***P < 0.001; #P < 0.05, ##P < 0.01, ###P < 0.001.
-
Our previous studies showed that PPP2R3A promotes proliferation and invasion in HCC[16-18], but the molecular mechanism by which PPP2R3A affects HCC progression is still unclear. In the present study, we found that PPP2R3A positively regulates the expression levels of HK1 in HCC and that PPP2R3A and HK1 colocalize in the cytoplasm. Further studies found that PPP2R3A promoted the glycolysis in liver cancer cells by affecting the expression of HK1 and that the PPP2R3A/HK1 axis may be related to HCC proliferation, invasion and migration, which have seldom been discussed before.
HK1 is an isoform of hexosekinase. Hexokinase enzymes have five isoforms, namely, HK1, HK2, HK3, HK4 and hexokinase domain containing 1, in mammals[24-25]. In contrast to normal tissues, many tumours express both HK1 and HK2[26]. The role of HK2 in liver cancer has been fully described; high HK2 expression promotes the malignant biological behaviour of HCC and is associated with poor prognosis of HCC[27-29], but there are few studies on HK1 in HCC. Competitive assays suggest that HK1 and HK2 bind to the same site on the mitochondria but that HK1 binds with greater affinity[30]. Tumour growth was unaffected after knockdown of HK2 in HK1+HK2+ tumour cells, indicating that HK1 may be sufficient to maintain cancer cell proliferation and tumour growth and that the clinical efficacy of targeting HK2 may be limited to HK1-deficient cancers[26]. Recent studies have found that HK1 plays a pro-cancer role in solid tumours such as liver cancer, colorectal adenocarcinoma, gastric cancer, ovarian cancer, lung cancer, breast cancer, and pancreatic cancer and has become a metabolic marker for poor prognosis in ovarian cancer and gastric cancer[31-36]. Inhibition of HK1 inhibited the viability and proliferation ability of HCC, as well as tumorigenesis[31]. Therefore, the role of HK1 in HCC tumours cannot be ignored. In this study, we confirmed that PPP2R3A positively regulates HK1 gene expression by in vitro experiments and in clinical specimens of HCC, with the presence of colocalization in the cytoplasm. Moreover, we found that the expression levels of PPP2R3A and HK1 varied in different parts of liver cancer tissue, which can be explained by the high heterogeneity of HCC[37].
The first step in the glycolysis is catalysed by HK[23]. Aerobic glycolysis was first identified in rat liver cancer and became a marker of liver cancer[22]. Therefore, it is particularly important to explore whether PPP2R3A affects glycolysis in HCC by regulating HK1. Aerobic glycolysis means that tumour cells tend to convert glucose to lactate even under sufficient oxygen conditions[30], allowing cancer cells to consume more glucose and produce more lactate than normal cells[38]. Hence, we represent changes in glycolysis levels by the amount of glucose consumption and lactate production. As a result, glucose consumption and lactate production in HCC increased with PPP2R3A upregulation. Then, we suppressed HK1 expression by si-HK1 on the basis of PPP2R3A overexpression. The results showed that inhibition of HK1 reversed the pro-glycolysis effects of PPP2R3A. The above results suggested that PPP2R3A regulates glycolysis in liver cancer cells via HK1.
In tumour cells, glycolysis is enhanced, and its increased metabolic intermediates can be used for the biosynthesis of nucleotides, lipids and proteins to meet the needs of rapid tumour growth and to promote cancer cell proliferation[39,40]. In addition, lactate produced by glycolysis can lead to acidification of the extracellular environment, degrade the extracellular matrix and inhibit the function of immunosuppressive cells, making it easy for cancer cells to metastasize and invade[41-43]. Therefore, we hypothesized that PPP2R3A may affect the malignant biological behaviour of HCC by regulating HK1 which plays a crucial role in glycolysis. The results showed that inhibiting HK1 could reverse the prometastatic, proproliferative, and proinvasive effects of PPP2R3A in vitro, which is consistent with our hypothesis. Our preliminary findings suggested that PPP2R3A may affect the proliferation, metastasis and invasion of HCC by affecting HK1 expression, but further experimental validation in vivo is required.
The regulation of HK1 by PPP2R3A is only an element of the complex regulatory network where the malignant behaviour of PPP2R3A affects HCC, and it remains to be investigated whether there are other genes involved in the regulation of both PPP2R3A and HK1.
In summary, our study identified a novel PPP2R3A/HK1 axis in the regulation of the liver cancer cell glycolysis that may be related to the proliferation, invasion, and migration of HCC, which provides a new research direction for the treatment of HCC. PPP2R3A may be a promising drug target for the treatment of HCC.
-
We thank Stem Cell and Regenerative Medicine Lab of Institute of Health Service for providing the experimental platform and technical support. We thank GenePharma provided the technical support.
-
The authors declare that they have no conflict of interest.
-
This study was performed in compliance with the principles of the Declaration of Helsinki. The protocol was approved by the Ethics Committee of the Third Medical Center of Chinese PLA General Hospital.
-
Written informed consent was provided from each participant.
-
All authors contributed to the study conception and design. JIAO Ning contributed to the design of the work, the implementation of the experiment, and the writing of the manuscript; JI Wan Sheng contributed to the acquisition, analysis and interpretation of data; ZHANG Biao contributed to revised it critically for important intellectual content; SHANG Yu Kui, ZHANG Yu Chen, YU Wei Qun, JIN Hai Long, LI Chao, ZHANG Cheng Ying, and YAN Cheng were involved in the implementation of the experiment. All authors read and approved the final manuscript.
Funds:
This study was supported by National Natural Science Foundation of China [81372595]
&These authors contributed equally to this work.
 Quick Links
 DownLoad: