


-
Iron is an essential nutrient for human health, and iron deficiency is well described in children. Children are a special risk group because of their rapid mental and physical development [1]. Iron deficiency anemia can severely hamper cognitive development in children, which might result in lower educational achievements and directly impair economic development [2].
The global prevalence of anemia in 2010 was 32.9%; this led to 68.36 million years lived with disability, accounting for 8.8% of all conditions, half of which were caused by iron deficiency anemia [3]. The 2012 China National Nutrition and Health Survey revealed an anemia rate in children of nearly 5% to 8% [4], and Li et al. [5] suggested that iron deficiency anemia in children may be responsible for the high rate of intellectual disability observed in some areas of China.
The Chinese government has realized the importance of iron to children’s health, and it has taken various measures to correct iron deficiency in children. However, iron deficiency anemia in children persists, especially among children under 6 years of age and those in early adolescence. The main causes of this problem are a lack of iron intake. An accurate estimate, or reasonable agreement among multiple estimates, of physiological requirements is of critical importance for our understanding of human iron nutrition and homeostasis. However, because of the lack of data in children, the current recommended nutrient intake is not estimated from children but from adults.
-
Previous studies have suggested that the ratio of iron in the blood to total iron in the body, known as the iron circulation rate, remains roughly constant over a short observation period[6]. Therefore, we assumed that the variation in isotope abundance in the blood is consistent with that throughout the body. A previous study showed that the percentage of erythrocyte iron-57 (57Fe) incorporation in children increases starting 14 days after oral administration, reaching a peak on day 60[7]. Diluted by the body’s natural iron isotope, this percentage slowly declines and eventually reaches a relative steady state. The stationary transition of abundance is known as the “steady period” [8] marking the point when the 57Fe is fully integrated into the entire body. Studies have shown that after reaching a steady state, the total amount of iron usually remains constant [9-10], and the physiological requirement in individuals with no significant change in weight is equal to iron loss[6,11]. In the present study, we monitored the isotopic abundance for 2 years to ensure that it had reached the steady state, calculated the iron loss by accurately measuring the change in the abundance of 57Fe, and measured the iron circulation rate. In this way, the physiological requirement for iron was obtained.
Fifty-seven healthy children (30 boys and 27 girls) aged 10 to 12 years from Beijing were randomly recruited to participate in this study. Those who meet the following criteria will be excluded: 1) Menarche or secondary sexual characteristics have appeared; 2) Anemia or other iron metabolic diseases; 3) Unable to complete the required contents of the study; 4) Those who have recently transferred to another school or are unable to stay in school continuously for other reasons; 5) Unwilling to participate in the study. The trial was registered at the Chinese Clinical Trial Registry (No. ChiCTR-OCH-14004302) and approved by the Ethical Committee of the National Institute for Nutrition and Health, Chinese Center for Disease Control and Prevention. Informed consent was provided by at least one parent of each participant.
The study flow chart is shown in Figure 1. During the first 2 weeks of the trial, all children stayed in arranged accommodations and were fed a low-iron diet. Diet, stool, and blood samples were collected to determine the iron absorption rate and iron circulation rate, and these results were previously published [7, 12]. In total, 30 mg of 57Fe was administered over a 5-day period. The preparation of stable iron and the specific course of administration were also described in the above-mentioned report[7,12].
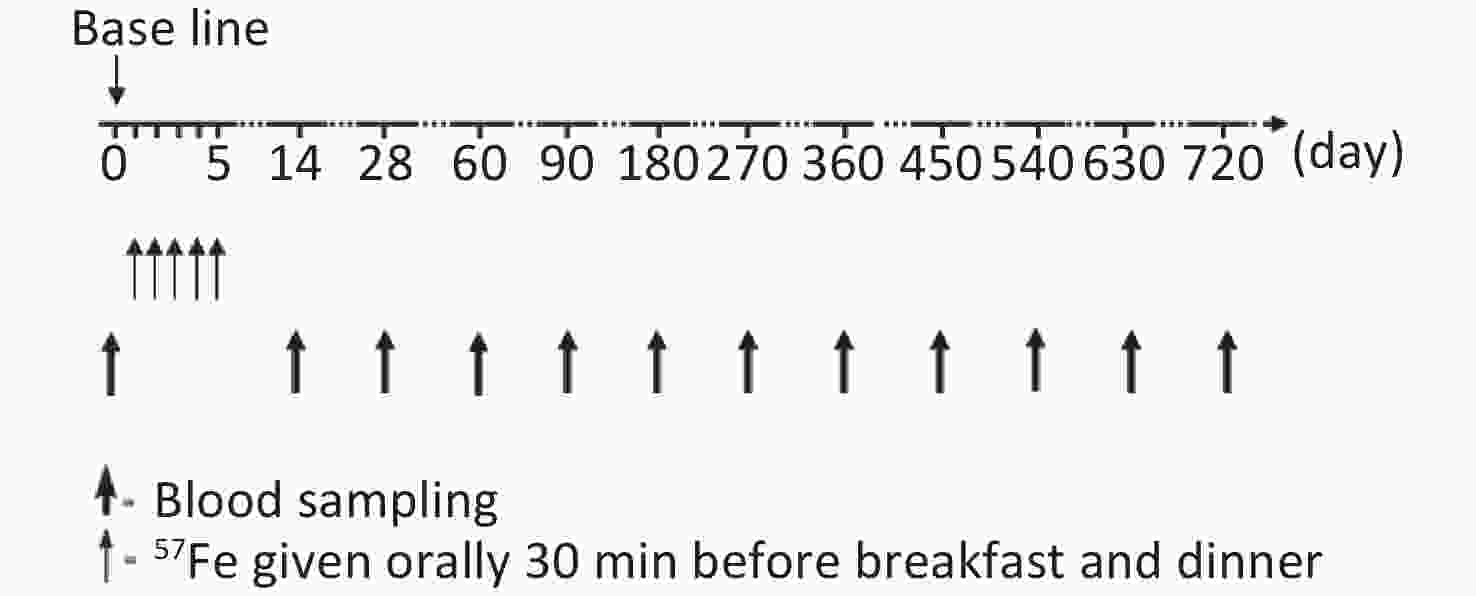
Figure 1. Time schedule of stable isotope given and blood sampling.
Venous blood samples (10 mL) were collected from each child to measure the change in the total iron concentration and 57Fe abundance at day 0, 14, 28, 60, 90, 180, and 360 after the start of the trial and every 90 days thereafter. During follow-up, the children’s health was closely monitored to ensure that they did not exhibit symptoms associated with blood loss or abnormal iron metabolism.
-
Blood samples were acid-digested with 70% nitric acid solution using a microwave digestion system. The total iron concentration was quantitatively determined by atomic absorption spectrometry, and the abundance of 57Fe was analyzed by inductively coupled multicollector plasma mass spectrometry. The specific operation method was described by Cai in 2020[13].
-
Previous studies have shown that after the 57Fe absorbed during the trial has been completely mixed with the iron of the study subjects and reaches a stable state, the daily iron loss can be calculated by the change in the abundance of 57Fe over a period of time (assuming day i to day i+t)[6]. The formula, which was derived from our previously published work [14], was as follows:
$$ {{R}}={{T}}\;\times\;{{V}}\;\times\;({{P}}_{{i}}-{{P}}_{{{i}}+{{t}}}) \div {{t}}\div [({{P}}_{{i}}-{{P}}_{{{i}}+{{t}}})/2-{\rm{N}}{\rm{A}}] \div {{C}} $$ (1) where R is the daily loss or intake of iron (mg), T is the total iron concentration in the blood (mg/L), Pi is the isotopic abundance on day i, NA is the natural abundance of 57Fe, t is the total study period (days), and V is the blood volume (L), which was estimated by the sex and body weight as described by Etcheverry in 2007[15]:
$$ {\rm{boys}}: {{V}}=0.0753\;\times\;{\rm{BW}}\; ({\rm{kg}})\;-0.05$$ (2) $$ {\rm{girls}}: {{V}}=0.0753\;\times\; {\rm{BW}}\;({\rm{kg}})+0.01\;$$ (3) where C is the iron circulation rate (ratio of iron in the blood to total iron in the body), the results were published in our previous works [16]. Each time venous blood was collected, the individual’s body weight was measured.
-
The normality of the data was assessed using the Kolmogorov-Smirnoff test. Variables that conformed to a normal distribution are presented as mean ± standard deviation (SD). Repeated-measures analysis of variance was used for comparisons between groups. All of the statistical analyses were performed using SPSS Version 13.0 software (SPSS Inc., Chicago, IL, USA), and significance was set at the α = 0.05 error rate.
-
Both groups had comparable characteristics at baseline (Table 1). The mean age of boys at enrollment was 10.6 ± 0.2 years, and that of girls was 10.4 ± 0.2 years. Boys and girls had mean hemoglobin levels of 133.1 ± 4.9 g/L and 130.8 ± 6.1 g/L, respectively. The mean log-transformed serum ferritin concentration in boys and girls was 15.0 ± 5.1 ng/mL and 14.4 ± 4.8 ng/mL, respectively, and the amount of 57Fe given orally was 27.5 ± 0.3 mg and 27.3 ± 0.2 mg, respectively.
Gender n Age
(years)BMI
(kg/cm2)Hb
(g/L)SF
(ng/mL)57Fe given orally
(mg)Boys 30 10.6 ± 0.2 19.2 ± 4.4 133.1 ± 4.9 15.0 ± 5.1 27.5 ± 0.3 Girls 27 10.4 ± 0.2 17.9 ± 2.6 130.8 ± 6.1 14.4 ± 4.8 27.3 ± 0.2 Note. BMI: stands for body mass index; Hb: stands for hemoglobin; SF: stands for serum transferrin. Table 1. Baseline characteristics of the subjects
-
The iron circulation rate was calculated and published in our previous work [16]. The abundance of isotopes in the circulation peaked on day 60 in all subjects; therefore, the iron circulation rate was calculated using the data at the peak. The mean iron circulation rate for boys and girls was 81.2% ± 2.6% and 82.7% ± 2.9%, respectively, with a significant difference between the sexes (P < 0.05).
-
Repeated-measures analysis of variance was used to determine that continuous and complete data were required for the steady period. Thirty-seven subjects (20 boys and 17 girls) with complete blood samples were selected from all subjects at each time point.
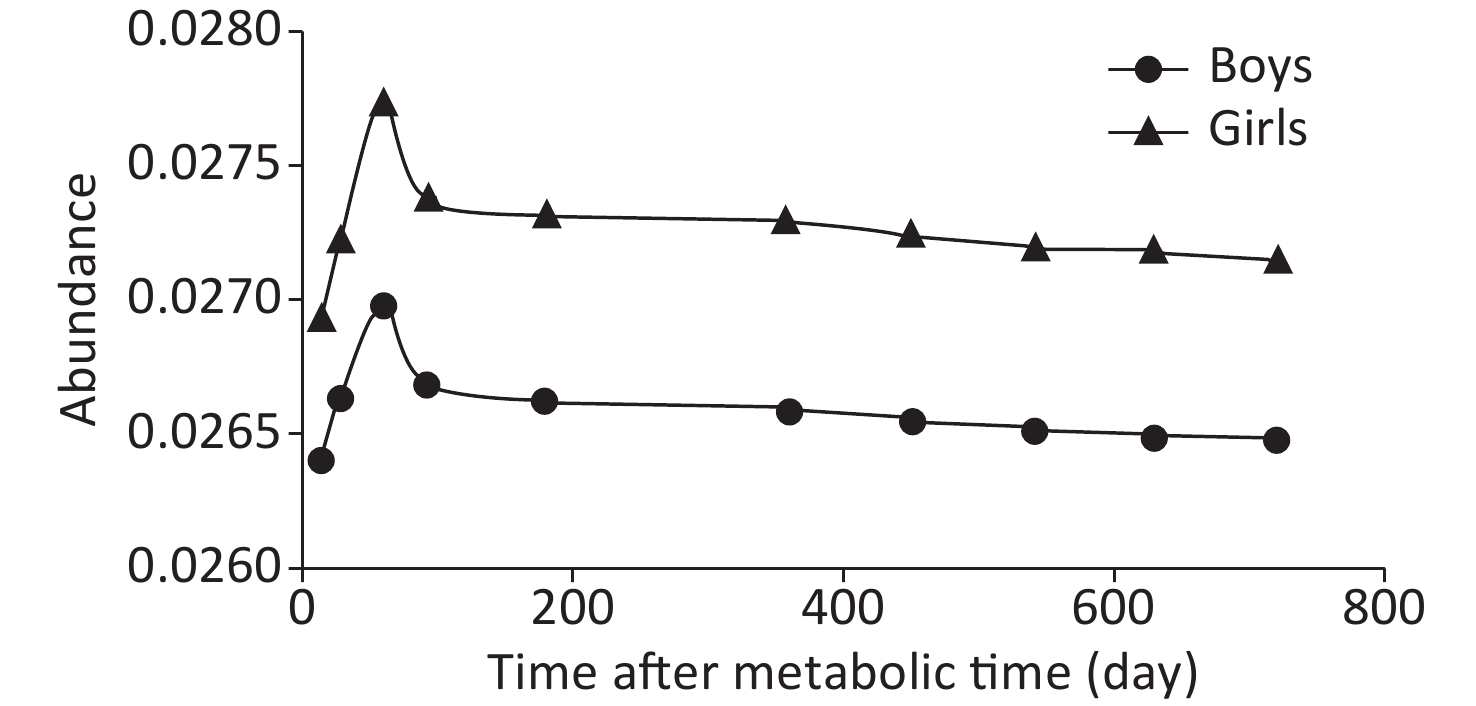
The trend of the change in 57Fe abundance over time was basically the same between boys and girls, but the abundance in boys was lower than that in girls at all time points. At about 450 days, the change in 57Fe abundance in the blood had gradually stabilized, as shown in Figure 2. The isotopic abundance data of all subjects at any time from 14 to 720 days were statistically analyzed after natural logarithmic conversion. The results showed a linear trend (Table 2). After 360 days, the quadratic term began to gradually decrease, and after 450 days, it plateaued; this was considered the steady period.
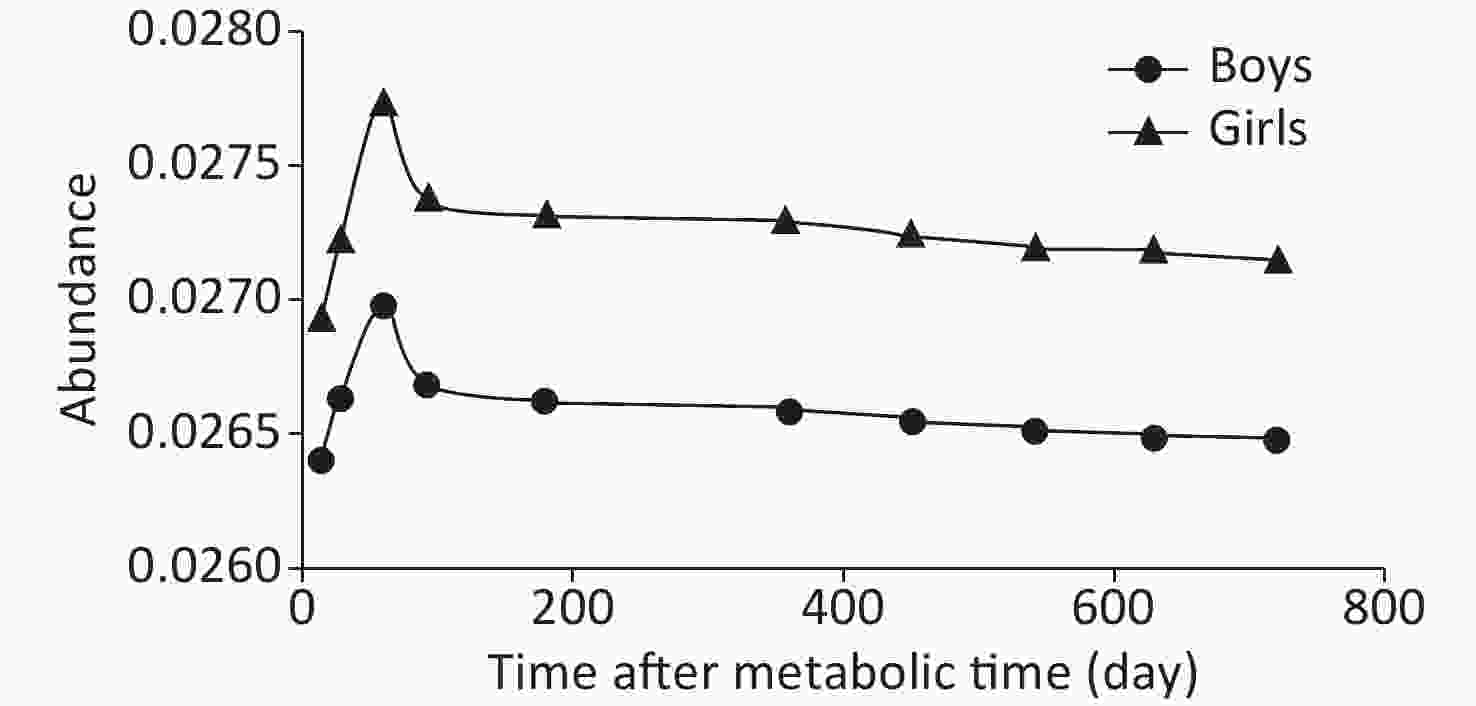
Figure 2. The abundance of 57Fe in circulation.
Ln (57Fe) Time_1 Time_2 Start (day) 14 < 0.0001 0.0089 End (day) 720 Start (day) 60 < 0.0001 0.0238 End (day) 720 Start (day) 90 < 0.0001 0.0387 End (day) 720 Start (day) 180 0.0066 0.0440 End (day) 720 Start (day) 360 0.0289 0.0506 End (day) 720 Start (day) 450 0.0723 0.1980 End (day) 720 Start (day) 540 0.115 0.3720 End (day) 720 Note. Time_N represents the nth degree polynomial contrast for time. Table 2. P values of polynomial contrast by repeated measure analysis
-
Factorial modeling and the iron balance are used to determine the physiological requirements for iron. According to the “factor model” method, the physiological need for iron can be divided into three aspects according to function: basal losses, menstrual losses, and accretion. Because the subjects in this study were children who had not yet reached menstruation, menstrual losses could be ignored; only basal losses and accretion were considered. When calculating accretion, children’s growth and development needs for iron should be fully taken into account, especially the influence of the increase in blood volume.
We found that the blood volume and iron content of all children gradually increased over time (Table 3). However, neither the blood volume nor iron content significantly increased from day 450 to 540, day 540 to 630, or day 630 to 720 in either sex. Therefore, the influence of accretion on the iron requirement can be largely ignored in the calculation process. It can be concluded that in the steady period, the physiological requirement for iron is basically equal to basal losses.
Days Boys (n = 20) Girls (n = 17) BV (mL) Fecirc (g) BV (mL) Fecirc (g) 14 3.19 ± 0.41 2.01 ± 0.12 3.15 ± 0.29 1.89 ± 0.15 28 3.19 ± 0.38 2.00 ± 0.15 3.15 ± 0.33 1.89 ± 0.15 60 3.19 ± 0.45 2.01 ± 0.15 3.15 ± 0.33 1.89 ± 0.14 90 3.18 ± 0.57 2.01 ± 0.13 3.15 ± 0.40 1.90 ± 0.15 180 3.19 ± 0.34 2.02 ± 0.17 3.15 ± 0.31 1.90 ± 0.13 360 3.19 ± 0.45 2.01 ± 0.15 3.16 ± 0.35 1.90 ± 0.18 450 3.20 ± 0.44 2.02 ± 0.15 3.16 ± 0.36 1.90 ± 0.15 540 3.20 ± 0.41 2.02 ± 0.11 3.16 ± 0.32 1.91 ± 0.17 630 3.20 ± 0.53 2.03 ± 0.16 3.16 ± 0.30 1.91 ± 0.16 720 3.20 ± 0.46 2.03 ± 0.14 3.16 ± 0.34 1.91 ± 0.13 Table 3. The blood volume and iron content from day 14 to 720
Day 450 to 540, day 540 to 630, and day 630 to 720 were selected as observation time points, and the subjects’ data were included in the linear regression formula to calculate the mean daily basal loss of iron (i.e., physiological requirement). The mean physiological requirement for iron was 16.88 ± 7.12 μg/kg per day in boys and 18.40 ± 8.81 μg/kg per day in girls, calculated from day 450 to 720. The physiological requirement for iron was significantly lower in boys than in girls (P < 0.01) (Table 4). Based on the mean weight of 20 boys (42.8 ± 6.9 kg) and 17 girls (38.5 ± 7.0 kg) measured from day 450 to 720, the physiological requirement for iron in boys and girls was calculated as 722.46 ± 8.43 and 708.40 ± 7.55 μg/day, respectively.
Gender n Day 450 to 540 Day 540 to 630 Day 630 to 720 Day 450 to 720 Boys 20 16.75 ± 6.72 17.14 ± 6.20 16.95 ± 6.94 16.88 ± 7.12 Girls 17 18.11 ± 7.05 18.46 ± 8.07 18.50 ± 6.85 18.40 ± 8.81 t 2.993 2.465 3.017 2.894 P < 0.01 < 0.01 < 0.01 < 0.01 Table 4. Physiologic requirement for iron calculated by different time points (μg/kg per day)
According to the mean physiological requirements for iron, we also determined the estimated average requirement, which was calculated using the standard weight (35.5 kg for boys and 34 kg for girls) and the iron absorption rate (about 10%) for a 10-year-old child. This value was 6.0 mg/day for boys and 6.2 mg/day for girls.
-
Children are a particularly challenging group in which to perform nutritional research, not only because of their rapid growth but also because of the difficulties inherent in dietary regulation and sample collection in children. As detailed in the literature, much has been discovered about iron requirements for toddlers, adults, and pregnant women [6,13-14,8,17]. However, the key aspects of iron requirements in children remain poorly understood. Several intervention trials have used the oral stable isotope technique in infants and children, although almost all of these trials were performed to evaluate the utilization rate [18-20], but the feasibility of using stable isotope technology in the study of children's iron requirements was verified. The present study is the first large intervention trial to evaluate the physiological requirement for iron in children by the single stable isotope technique.
The majority of total body iron is present in hemoglobin within circulating erythrocytes [21]; hence, the recycling rate of obtained iron is critical to the calculation of physiological requirements. However, a consensus has not been reached on its actual proportion. Initial radioisotope studies showed that nearly 80% of the label can be found in the circulation after dosing. The mean red cell utilization of absorbed 59Fe was 92.9% in adults as reported by Larsen in 1975[22]. Studies by our group showed that the 58Fe incorporation rate in adults was 85.0% in men and 82.8% in women[14], and the 57Fe circulation rate was 81.2% in boys and 82.7% in girls[16].
Because of the lack of existing methods to evaluate the physiological requirements for iron in children, we adopted the method used in adults and pregnant women. Previous studies have shown that the key point of using isotope technology to study the physiological requirements of mineral elements lies in how to accurately define the plateau [6,23-24]. While mainly by observing the variation curves of isotope abundance, it is often impossible to find an obvious turning point [6,13-14]. Therefore, in our study, observing the changes in the curves combined with the linear regression method [25] allowed us to obtain a more accurate judgment of the plateau. The timing of the plateau differs among studies. Our previous study showed that when the regression coefficient was > 0.9, the reliability of the results could be guaranteed [14]. This suggests that the plateau might reached at 376 days in men and 425 days in pregnant women after stable isotopes are given orally, as found by Lu et al. [14] and Cai et al. [16]. In the present study, we found that from day 450, the variation curves gradually slowed down; combining this finding with the statistical results and previous research results, we considered that the steady period had begun at this time point.
Evidence shows that the iron balance of the human body is dependent on the changes in absorption and excretion [9]. The physiological requirements for iron in adults who have no significant change in weight is usually regarded as equal to iron loss [11], whereas in children, not only body weight but also blood volume should be considered. Generally speaking, the body’s greatest need for iron is for incorporation into hemoglobin [10,26]. In the present study, changes in two factors from day 450 to 720 were also considered, and no significant change was observed between the two sexes. Therefore, we assumed that in a relatively short period, iron loss in children can also be considered equal to physiological requirements.
Basal losses of iron were measured in three small groups of men in the 1960s using radioisotopes, with reported mean values ranging from 0.90 to 1.02 mg/day. Based on these data, basal iron losses were calculated by a factorial approach. Using the same technique, a more recent study measured basal iron losses of 1.07 mg/day in men, 1.69 to 1.89 mg/day in premenopausal women [3], and 1.29 mg/day in women of reproductive age [14]. In our study, the basal iron losses in three time intervals (days 450–540, 540–630, and 630–720) were calculated and compared with the means obtained for days 450 to 720; no significant difference was found. We found that the mean daily basal loss of iron in children, which is equal to the physiological requirement, was 16.88 μg/kg per day for boys and 18.40 μg/kg per day for girls. The estimated average requirement was 6.0 mg/day for boys and 6.2 mg/day for girls. Compared with the dietary reference intakes established by the Chinese Nutrition Society in 2013[27], intake in both boys and girls is lower than the recommended values as calculated by a factorial method, although the consistent trend is that it is higher in girls than in boys. The difference in these results might be related to the different technical routes and calculation methods, and a similar phenomenon has been found in other related studies by our group [6,14,16].
During the 2-year follow-up, some children dropped out of the study because of illness or other reasons, and blood samples were not collected at some time points; this may have affected the accuracy and credibility of the results.
-
Despite some limitations, our findings still represent a significant step forward, especially for the data generated, which might be helpful for modification of dietary reference intakes of iron in children.
-
We would like to thank National Institute of Metrology for their excellent technical assistance and advice during this study.
-
The authors declare that they have no conflict of interest.
Funds:
This work was supported by the National Natural Science Foundation of China [grant number 81330066]

 Quick Links
 DownLoad: