


-
Prion disease is a group of transmissible neurodegenerative disorders affecting a species of animals and humans [1]. The etiological agent is a prion, a unique pathogen without nucleic acid. Besides the neuropathological hallmarks of prion disease, such as prion deposits (PrPSc), neuron loss, and gliosis, numerous abnormalities of biological pathways in the central nervous system (CNS) have been identified, e.g., increased inflammatory reactions, activated autophagy, and evident apoptosis [2-5], which result from the aberrant alterations of the transcriptions and expressions of a large number of proteins and enzymes in the brain, as verified by the assays of transcriptomics and proteomics [6-9]. Moreover, abnormal changes in post-translational modifications for brain proteins have been repeatedly described in the CNS tissues of various neurodegenerative diseases, involving phosphorylation, S-nitrosylation, ubiquitylation, O-GlcNAcylation, acetylation, etc. [10-13].
Protein acetylation, which is regulated by acetylase and deacetylase, is a kind of important reversible protein modification in cells after the translation process [14, 15]. This kind of post-translational modification participates actively in the regulation of protein functions, chromosome structure, and gene expressions. The developments and advances in mass spectrometry (MS) enable the localization of most acetylation sites in all proteomics at high resolution. Studies have proposed nearly 3,600 acetylation sites in about 1,750 proteins, suggesting that acetylation modification is one of the most abundant chemical modifications in nature [16-18]. Acetylation may affect various physiological processes of proteins, including chromatin remodeling, cell cycle, splicing, nuclear transport, mitochondrial biology, and actin nucleation. In biology, acetylation plays an important role in immunity, circadian rhythm, and memory formation. Protein acetylation is also a favorite target for the design of new drugs for various diseases.
The changes in acetylation for some proteins have also been reported in the brains of prion diseases. Previously, we have described that the levels and activities of Sirt1, a class III histone deacetylase, remarkably decreased in the brains of different scrapie-infected rodent models and in a prion-infected cell line SMB-S15, resulting in increases in the acetylating forms of some Sirt1 target proteins, such as P53, peroxisome proliferator-activated receptor γ coactivator(PGC)-1, and signal transducer and activator of transcription factor 3 [19]. We have also confirmed the declined levels of Sirt3 in the brain tissues of several scrapie-infected mice and SMB-S15 cells, leading to increases in acetylating forms of superoxide dismutase (SOD) 2 and ATP5β, which subsequently induced the increase in intracellular reactive oxygen species and reduction of ATP, respectively [20]. Aberrant alterations in acetylation modifications for other proteins have also been found in the brain tissues or in vitro models of several neurodegenerative diseases, e.g., tau, microtubules and SOD1 [21-23]. However, the global change in protein acetylation in the brain tissues of prion diseases remains unsettled. In this study, we systematically analyzed the changes in global profiles of brain acetylated proteins during prion infection based on two scrapie agent-infected mouse models.
-
All procedures involving live animals were approved by the Ethics Committee of the National Institute for Viral Disease Control and Prevention. All protocols were designed to minimize animal discomfort. The approval identifications for this study are found in animal use document 2013031.
-
The brain samples of cortex regions from scrapie agent (139A- and ME7)-infected mice collected at 80, 120, and 180 dpi were enrolled in this study. Each group consisted of tissues from three individual mice. The animal bioassays and confirmations of the experimental scrapie in the inoculated mice were described previously [24]. The brain samples of three age-matched normal mice from each group were used as the control.
-
Brain tissues were homogenized in lysis buffer (100 mmol/L NaCl, 10 mmol/L ethylenediaminetetraacetic acid, 0.5% NP-40, 0.5% sodium deoxycholate, 10 mmol/L Tris, and pH 7.4) containing protease inhibitor cocktail set III. The homogenates were centrifuged at 2,000 ×g for 10 min, and the supernatant fractions were collected. Aliquots of brain homogenate were separated by 12% sodium dodecyl sulfate-polyacrylamide gel electrophoresis (SDS-PAGE) and electroblotted onto nylon membranes. The membranes were blocked with Tris-Hcl buffer saline (TBS) containing 5% skimmed milk at room temperature (RT) for 2 h and incubated with various primary antibodies at 4 °C overnight, such as anti-PrP mAb (6D11, sc-58581; Santa Cruz Biotechnology), anti-glial fibrillary acidic protein (GFAP) (#3670; Cell Signaling), anti-Iba1 (sc32725; Santa Cruz Biotechnology), anti-β-actin antibody (1:5,000, Huaxingbio, HX1827). After washing with TBS containing 0.1% Tween 20, the membranes were incubated with horseradish peroxidase-conjugated secondary antibodies (Jackson ImmunoResearch Labs, 115-035-003 and 111-035-003) at RT for 1 h. The blots were developed using an enhanced chemiluminescence system (PerkinElmer, NEL103E001EA) and visualized on autoradiography films (General Electrics). Images were captured by ChemiDoc TM XRS + Imager and quantified by Image J software.
To detect the presence of proteinase K-resistant PrPSc, we digested the brain homogenates or cell lysates with a final concentration of 50 µg/mL proteinase K at 37 °C for 1 h prior to Western blots.
-
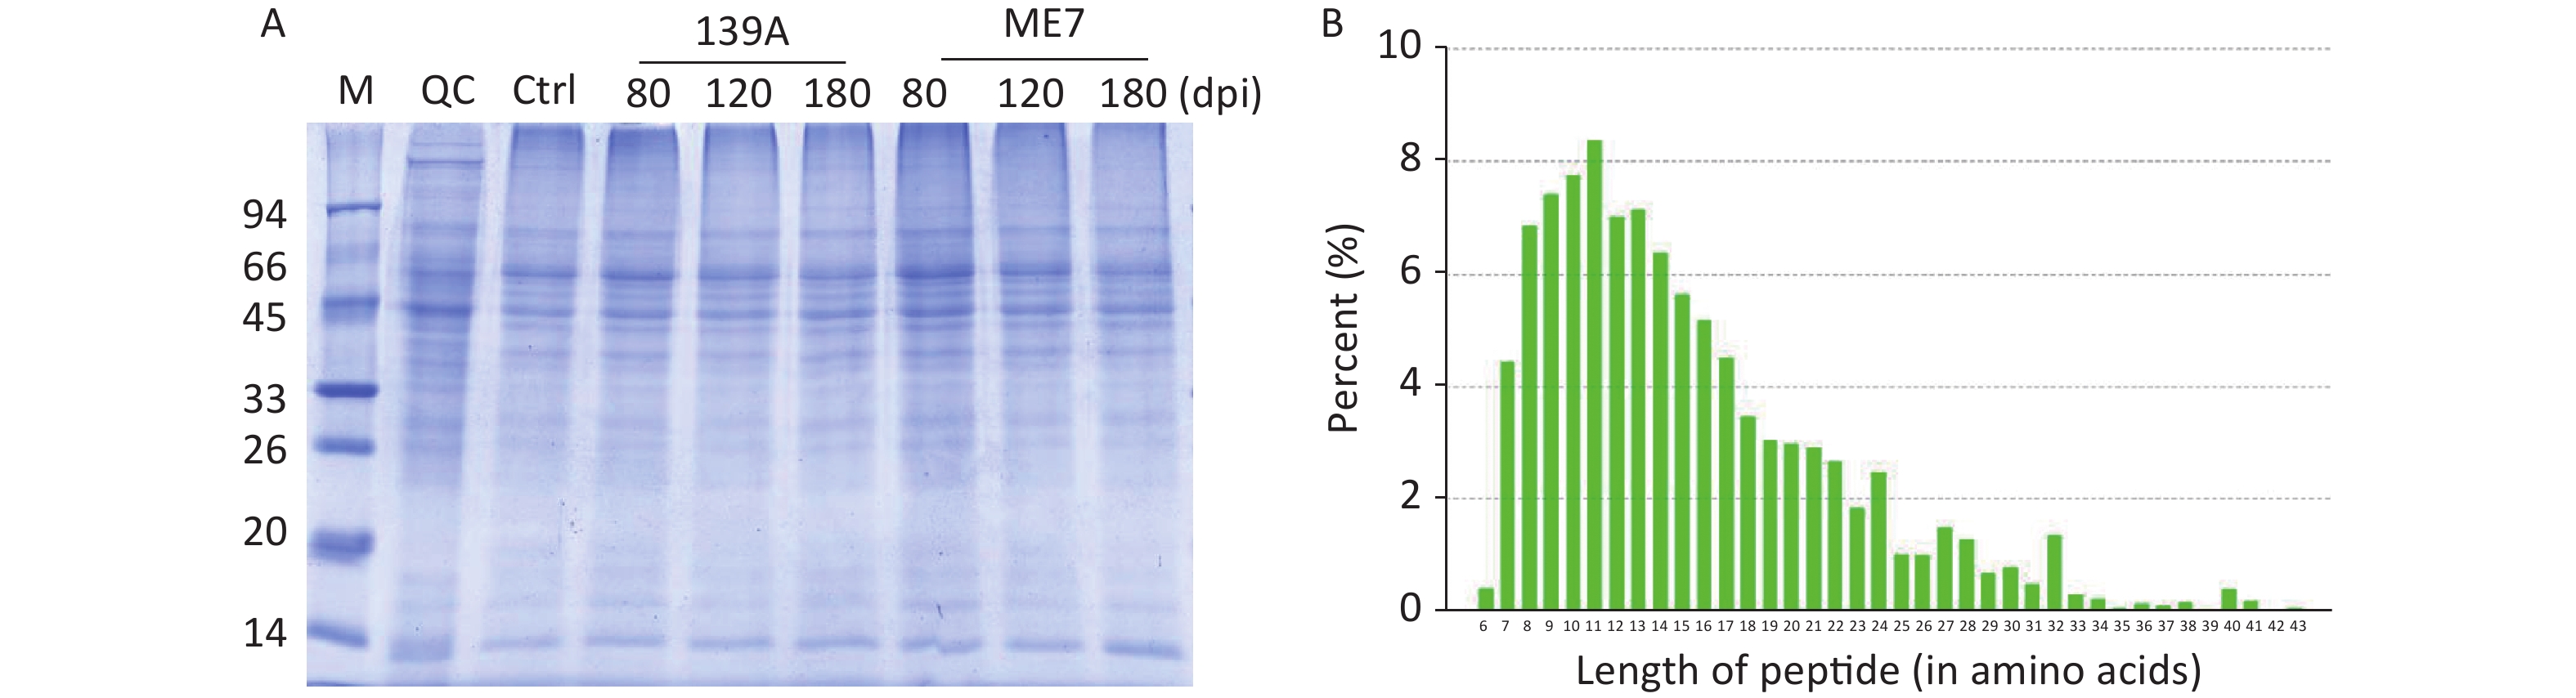
About 500 mg of brain samples were homogenated by an automatic grinding machine in the lysis buffer (8 mmol/L urea, 30 mmol/L HEPES, 1 mmol/L Na3VO4, 2.5 mmol/L NA3PO4, and 5 mmol/L C4H7NaO2). The lysates were mixed with 10% tricarboxylic acid (TCA)—acetone and precipitated at −20 °C overnight. The precipitates were collected by centrifugation at 20,000 rpm for 30 min and washed thrice with acetone. After the addition of the lysis buffer, the preparations were exposed to ultrasonic (pulse on: 2 s, pulse off: 3 s, and power: 180 W) for 5 min. After centrifugation at 20,000 rpm for 30 min, the supernatants were collected and incubated with 10 mmol/L dithiothreitol final concentration at 56 °C for 1 h. The products were immediately mixed with 55 mmol/L IAM final concentration and stored in the dark for 1 h. The protein concentrations in the products were measured with a Bradford protein assay. The quality of the extracted proteins was evaluated by SDS-PAGE, which showed clear bands (Supplementary Figrue S1A available in www.besjournal.com). The protein quantitative standard curve showed an R2 value of 0.9932, which fulfilled the requirement of the standard operating procedures (SOP) of the experiment.
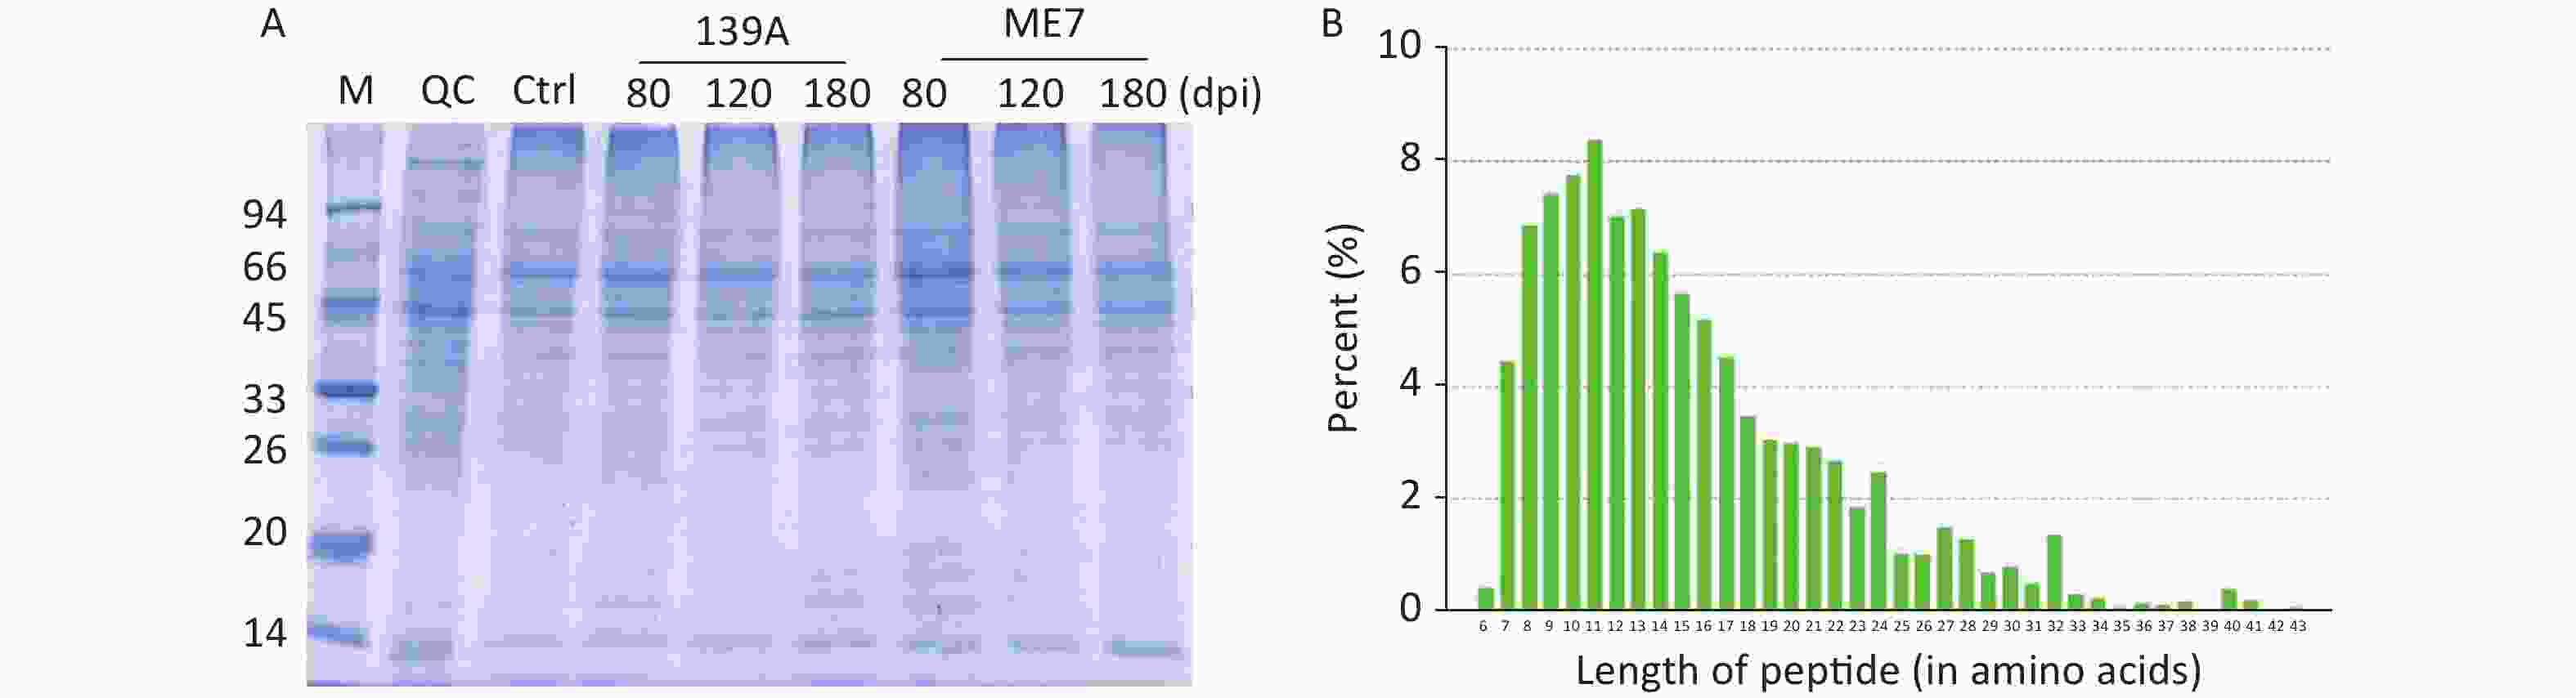
Figure S1. Quality control and determination of the prepared samples for proteomic assays. (A) Analysis of the proteins in each sample with 12% SDS-PAGE with Coomassie blue staining. (B) Distribution of digested peptides in the length of an amino acid after searching the Swiss-Prot database. The peptides length in an amino acid is shown on the X-axis and the frequency of peptides on the Y-axis.
-
Aliquots of 10 mg proteins from each preparation were transferred to a 10 K ultrafilter and centrifuged at 4,000 rpm at 4 °C for 40 min. After discarding the waste liquid, 5 mL 5 mmol/L triethylbenzylammoniumchloride (TEBA) was added to the filters and centrifuged at 4,000 rpm at 4 °C for 40 min. The above procedures were repeated. The protein digestion was performed with 1 µg/µL trypsin at 37 °C for 24 h. The purification of peptides was conducted with a C18 reversed-phase column to remove salts and dried by vacuum. Measurement of the digested peptides showed that the lengths of the majority were less than 30 amino acids (Supplementary Figure S1B).
-
The dried samples were solved in IAP buffer containing 50 mmol/L MOPS (pH 7.2), 10 mmol/L Na3PO4, and 50 mmol/L NaCl, and pellets were discarded by centrifuged at 10,000 rpm at 4 °C for 5 min. The enrichment of acetylated peptides was conducted with a commercial kit in accordance with the manufacturer’s instructions (ICP0388, ImmuneChem Pharmaceuticals). After washing the acetylated antibody-conjugated beads with phosphate-buffered saline, 2% acetic acid, and IAP buffer, the samples were added and incubated overnight rotatably. The beads were collected by low-speed centrifuge and washed with IPA buffer and double-distilled water.
-
The enriched acetylated peptides were mixed with 41 µL acetonitrile, vortexed for 1 min, and pelleted after a short centrifuge. Different isotopes were added to the tested peptide preparations, maintained at RT for 1 h, mixed with 8 µL hydroxylamine, and maintained for 15 min. The labeled products were further dried by vacuum.
Desalted peptide mixtures were loaded onto an Acclaim PePmap C18-reversed-phase column (75 µm × 2 cm, 3 µm, and 100 Ǻ; Thermo Scientific) and separated with a reversed-phase C18 column (75 µm × 10 cm, 5 µm, and 300 Ǻ; Agela Technologies) mounted on a Dionex ultimate 3,000 nano LC system. The peptides were eluted using a gradient of 5%–80% (v/v) acetonitrile in 0.1% formic acid over 45 min at a flow rate of 300 nL/min combined with a Q-Exactive mass spectrometer (Thermo Fisher Scientific, MA, USA).
The eluates were directly entered to the Q-Exactive mass spectrometer (Thermo Fisher Scientific, Waltham, MA, USA), which was set in positive ion mode and data-dependent manner with full MS scan in the range of 350–2,000 m/z, full scan resolution at 70,000, MS/MS scan resolution at 35,000, MS/MS scan with a minimum signal threshold of 1 × 10⁵, and isolation width at 2 Da. To evaluate the performance of this MS in the samples, two MS/MS acquisition modes with a higher collision energy dissociation (HCD) were employed. To optimize the MS/MS acquisition efficiency of HCD, we systemically examined normalized collision energy 30 times with a step of 20%.
-
Quantitative analysis of immunoblot images was carried out using the software Image J, and the gray values of each target blot were evaluated. Quantitative evaluations of fluorescent intensity in immunofluorescence assays were automatically performed with the Columbus software in Operetta. SPSS18.0 (International Business Machines Corporation, The United States) statistical software was used for statistical work. All data analyses were presented as mean ± standard deviation, and statistical analysis was performed using the t test.
-
The clinical, neuropathological, and pathogenic features of scrapie agents 139A- and ME7-infected C57 mice were thoroughly described previously. The mean incubation times of the mice infected with agents 139A and ME7 were 183.9 ± 23.1 (154–226) and 184.2 ± 11.8 (165–193) days, respectively [24]. To test the changes in the main hallmarks of prion disease in the brain samples of scrapie-infected mice collected at the mid-early, mid-late, and terminal stages, which were employed in further proteomic assays, we evaluated the levels of PrPSc, GFAP, and Iba1 by individual-specific Western blots. PK-resistant PrP signals (PrPres or PrPSc) were detected in all brain samples of scrapie-infected mice, showing three bands ranging from 20 kD to 30 kD (Figure 1A). A quantitative assay of the signal intensities showed that the PrPSc in the samples at the mid-early stage was weak and became considerably stronger at the mid-late and late stages (Figure 1A). The signals of GFAP (Figure 1B) and Iba1 (Figure 1C) in the brain samples of the scrapie-infected mice displayed a time-dependent increase and had more changes than the brain tissues of normal mice at the same time point (Supplementary Figure S2 available in www.besjournal.com).
Figure 1. Western blot evaluations of PrPSc, GFAP, and Iba1 in the brain tissues of 139A- and ME7-infected mice collected at mid-early, mid-late, and terminal stages. The brain homogenates from three individual infected mice collected at different time points were pooled and used as the representative samples. (A) PK-digested Western blot. (B) GFAP-specific Western blot. (C) Iba1-specific Western blot. Quantitative assays of the average intensities of the target bands are shown at the bottom of individual representative images. The relative intensities of GFAP and Ibal were normalized with the data of individual actin.
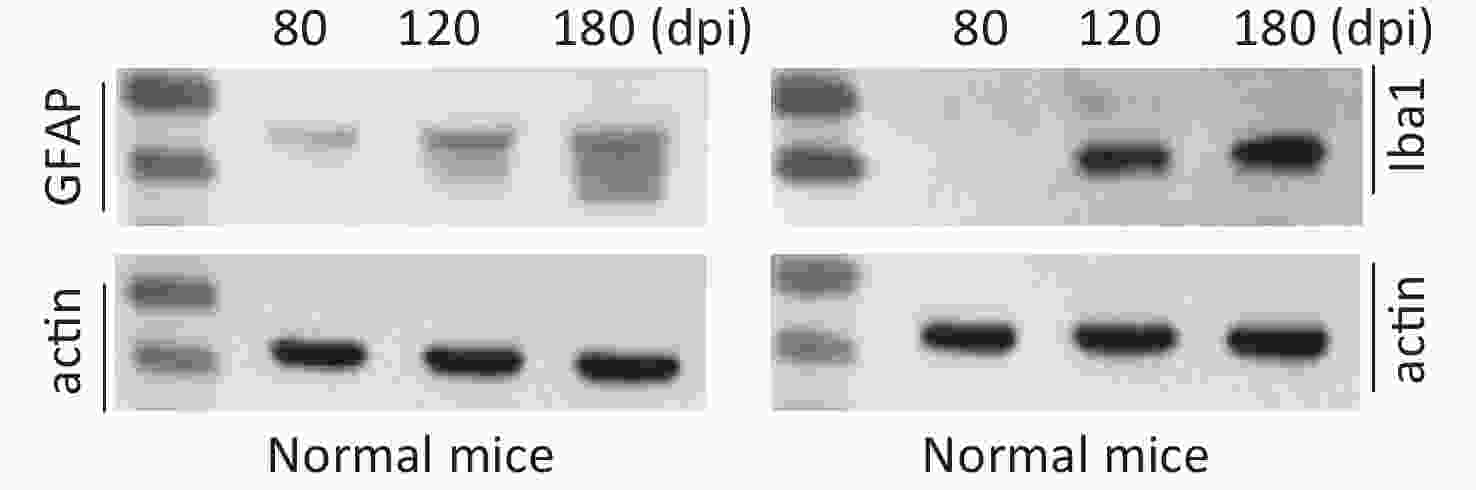
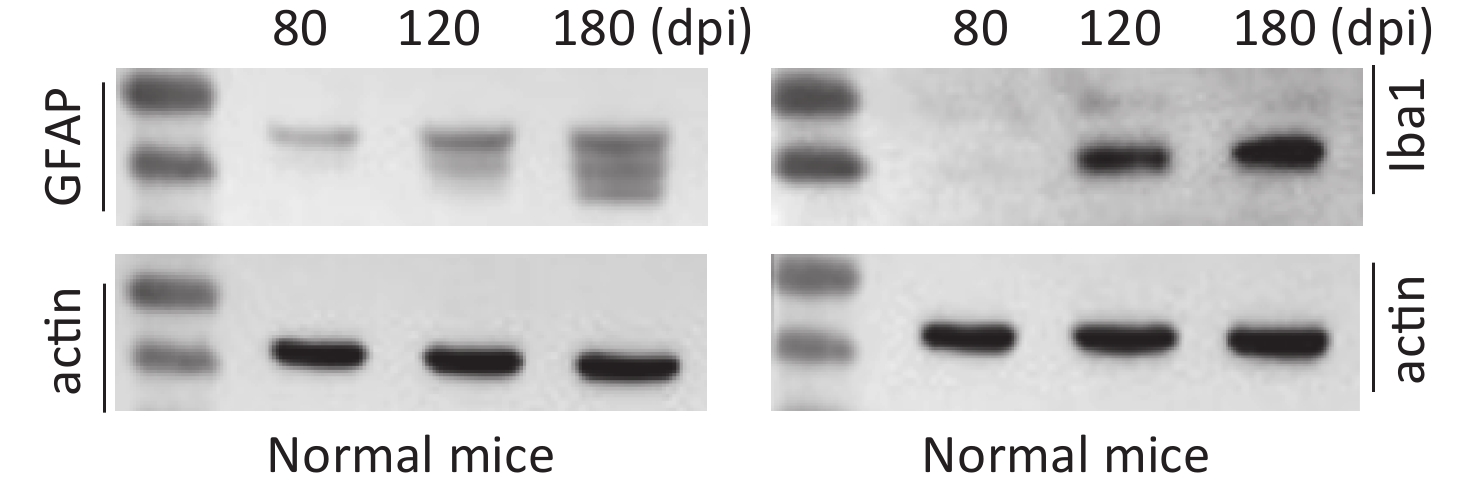
Figure S2. Western blot evaluations of GFAP and Iba1 in the brain tissues of normal mice collected at mid-early, mid-late, and terminal stages corresponding to the infected mice. The brain homogenates from three individual infected mice collected at different time points were pooled and used as representative samples.
-
The homogenates of cortex regions of three individual mice infected with scrapie agents 139A and ME7 collected at mid-early, mid-late, and final stages were pooled as the samples of 139A-80, 139A-120, and 139A-180 dpi and ME7-80, ME7-120, and ME7-180 dpi. Meanwhile, the homogenates of cortex regions of three age-matched individual normal mice were pooled as the normal control. The quality of extracted proteins, quantitative accuracy of proteins, trypsin hydrolysis efficiency, mass spectral mass deviation, MS acquisition intensity, and data volume fulfilled the requirements of the quality control for proteomic assays. A total of 271,383 MS/MS spectra were achieved, and 63,365 of them were matched spectra. Meanwhile, 2,250 proteins elicited from 7,831 unique peptides were identified with a 95% confidence interval by the PeptideProphet Algorithm. A total of 1,485 acetylated peptides were identified.
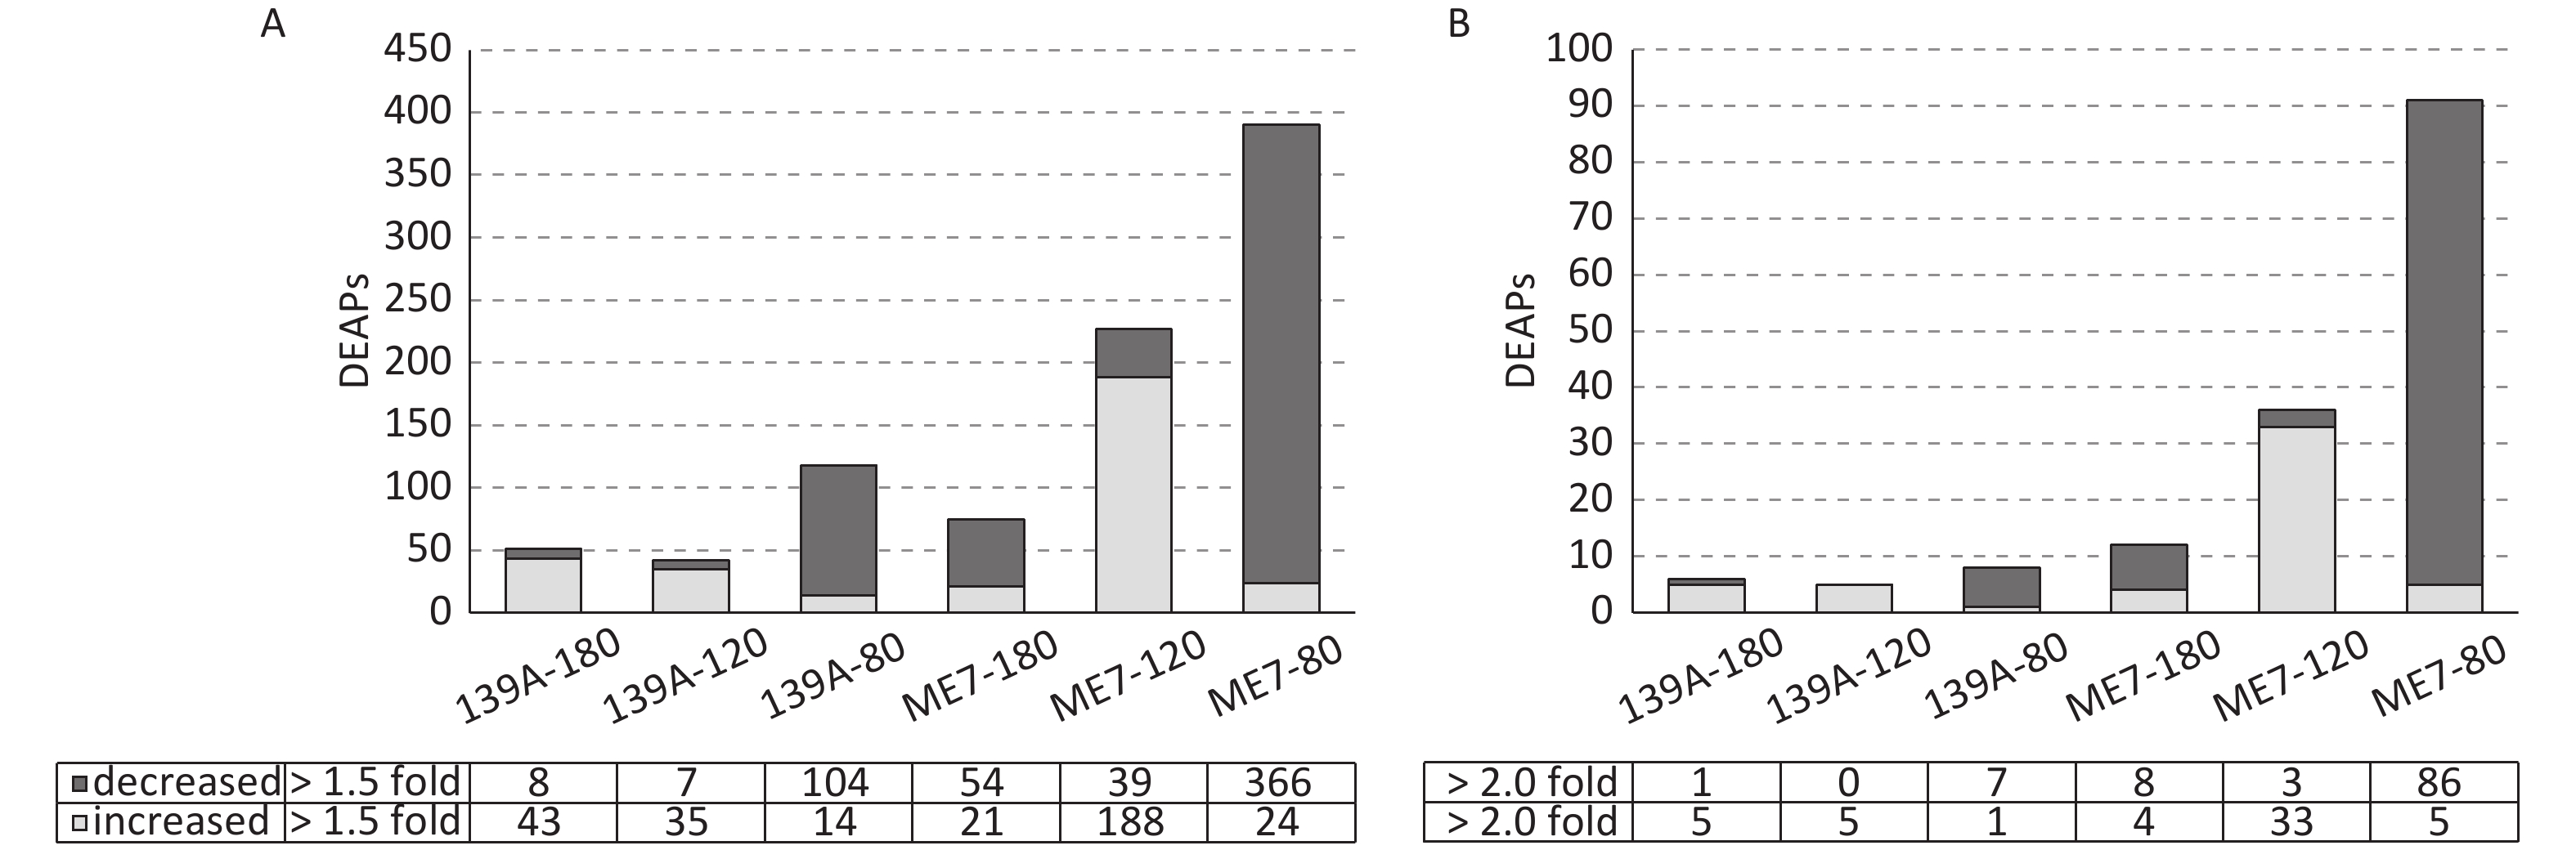
The differentially expressed acetylated peptides (DEAPs) in the brains of scrapie-infected and normal mice were calculated based on the SOP for TMT proteomics in Beijing Institute of Genomics, Chinese Academy of Science, and other published data [6, 25]. Out of 1,485 acetylated peptides, the DEAPs (change > 1.5-fold) in the brains of 139A-80, 139A-120, and 139A-180 dpi were 118 (7.9%), 42 (2.8%), and 51 (3.4%), respectively. Meanwhile those in the brains of ME7-80, ME7-120, and ME7-180 dpi were 390 (26.3%), 227 (15.3%), and 75 (5.1%), respectively (Figure 2A). The DEAPs (change > 2.0-fold) in the brains of 139A-80, 139A-120, and 139A-180 dpi were 8 (0.54%), 5 (0.34%) and 6 (0.4%), and those in the brains of ME7-80, ME7-120, and ME7-180 dpi were 91 (6.1%), 36 (2.4%), and 12 (0.81%) respectively (Figure 2B). Notably, considerably more decreased DEAPs were observed in the brain samples of the early stage, and more increased DEAPs were identified in the mid-late and late stages of 139A- and ME7-infected mouse groups with > 1.5- and > 2.0-fold (Figure 2). Additionally, more DEAPs were found in the brains of ME7-infected mice at every time point than those of 139A-infected mice. To explore the potential changes in proteomic profiles among the different brain samples maximally, we used the peptides that were > 1.5-fold increased or decreased as DEAPs in this study.
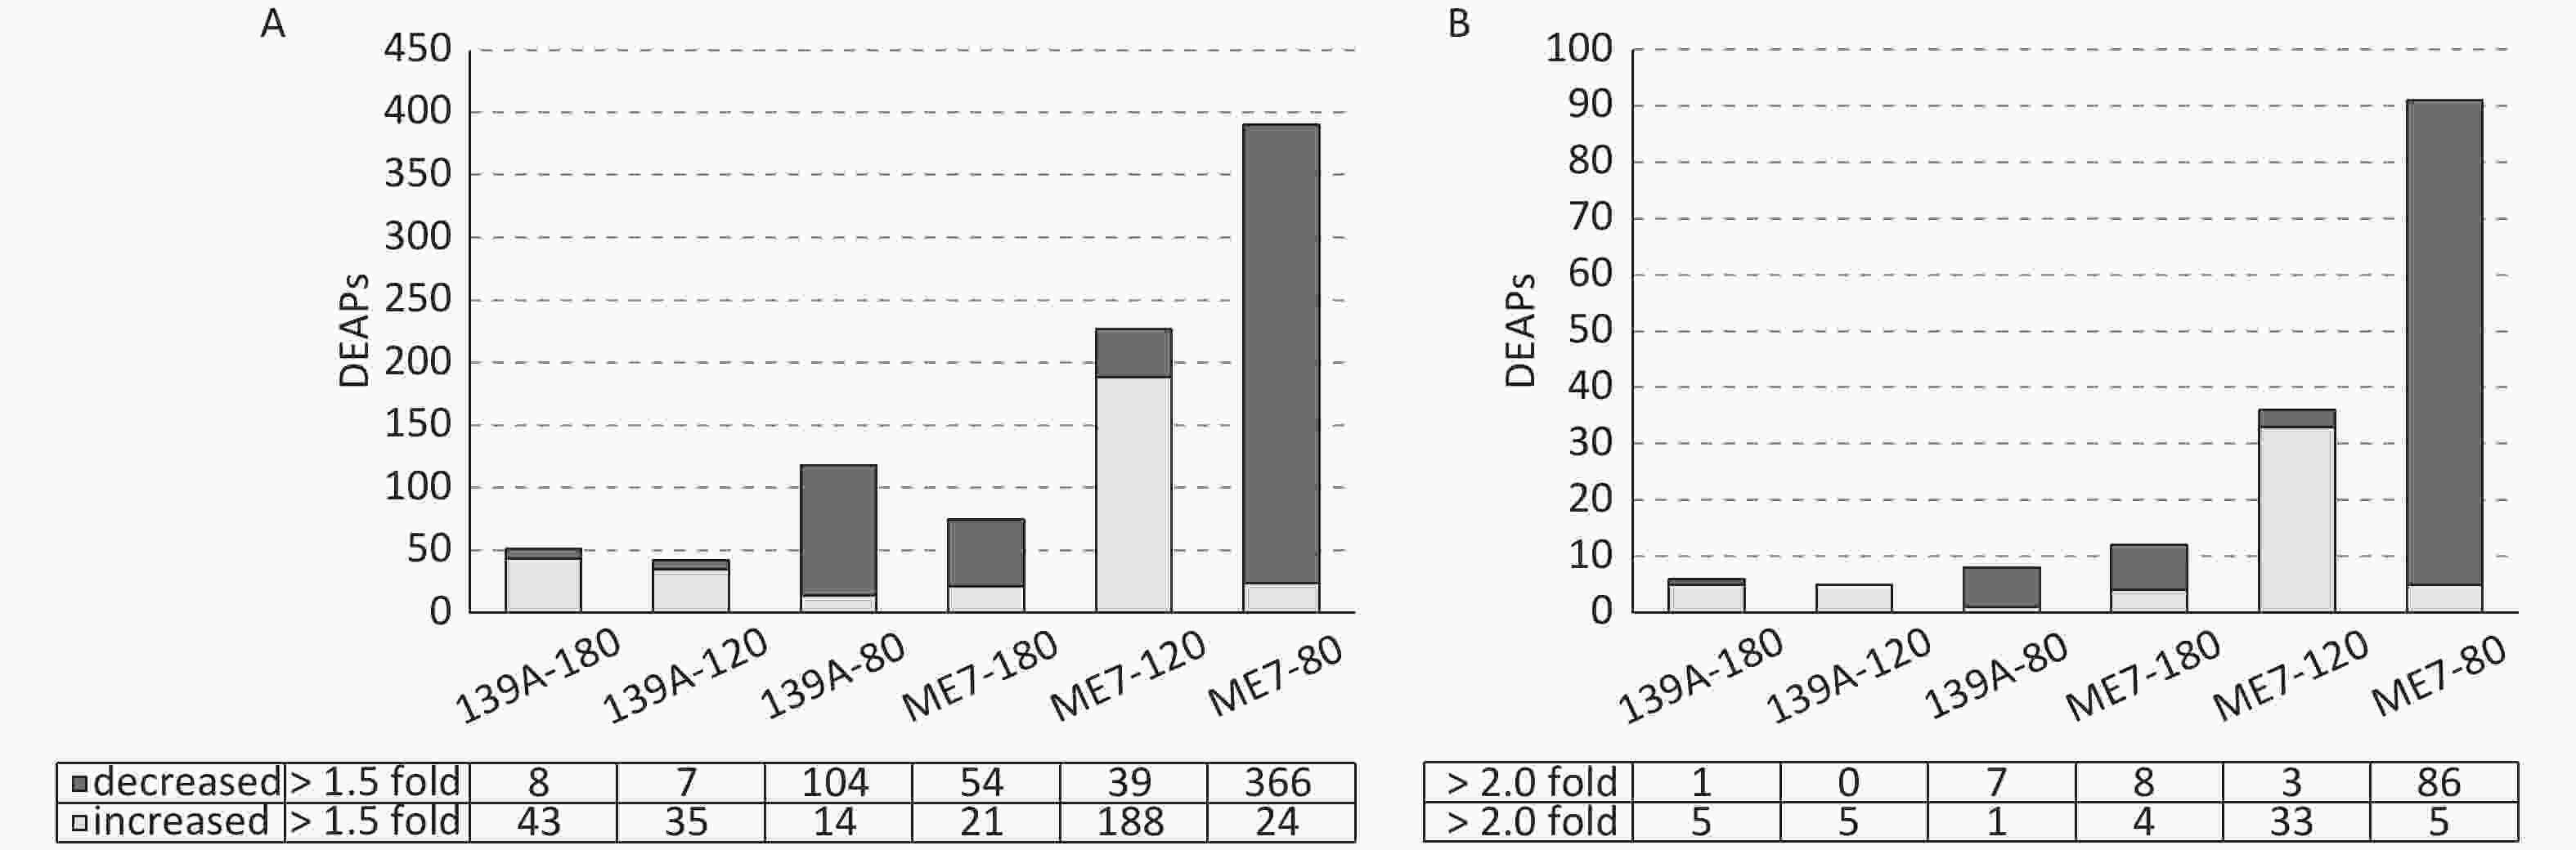
Figure 2. Numbers of DEAP in the brains of 139A- and ME7-infected mice collected at mid-early, mid-late, and terminal stages. (A) Based on a 1.5-fold change. (B) Based on a 2.0-fold change. The numbers of increased and decreased DEAPs in each sample are shown at the bottom.
-
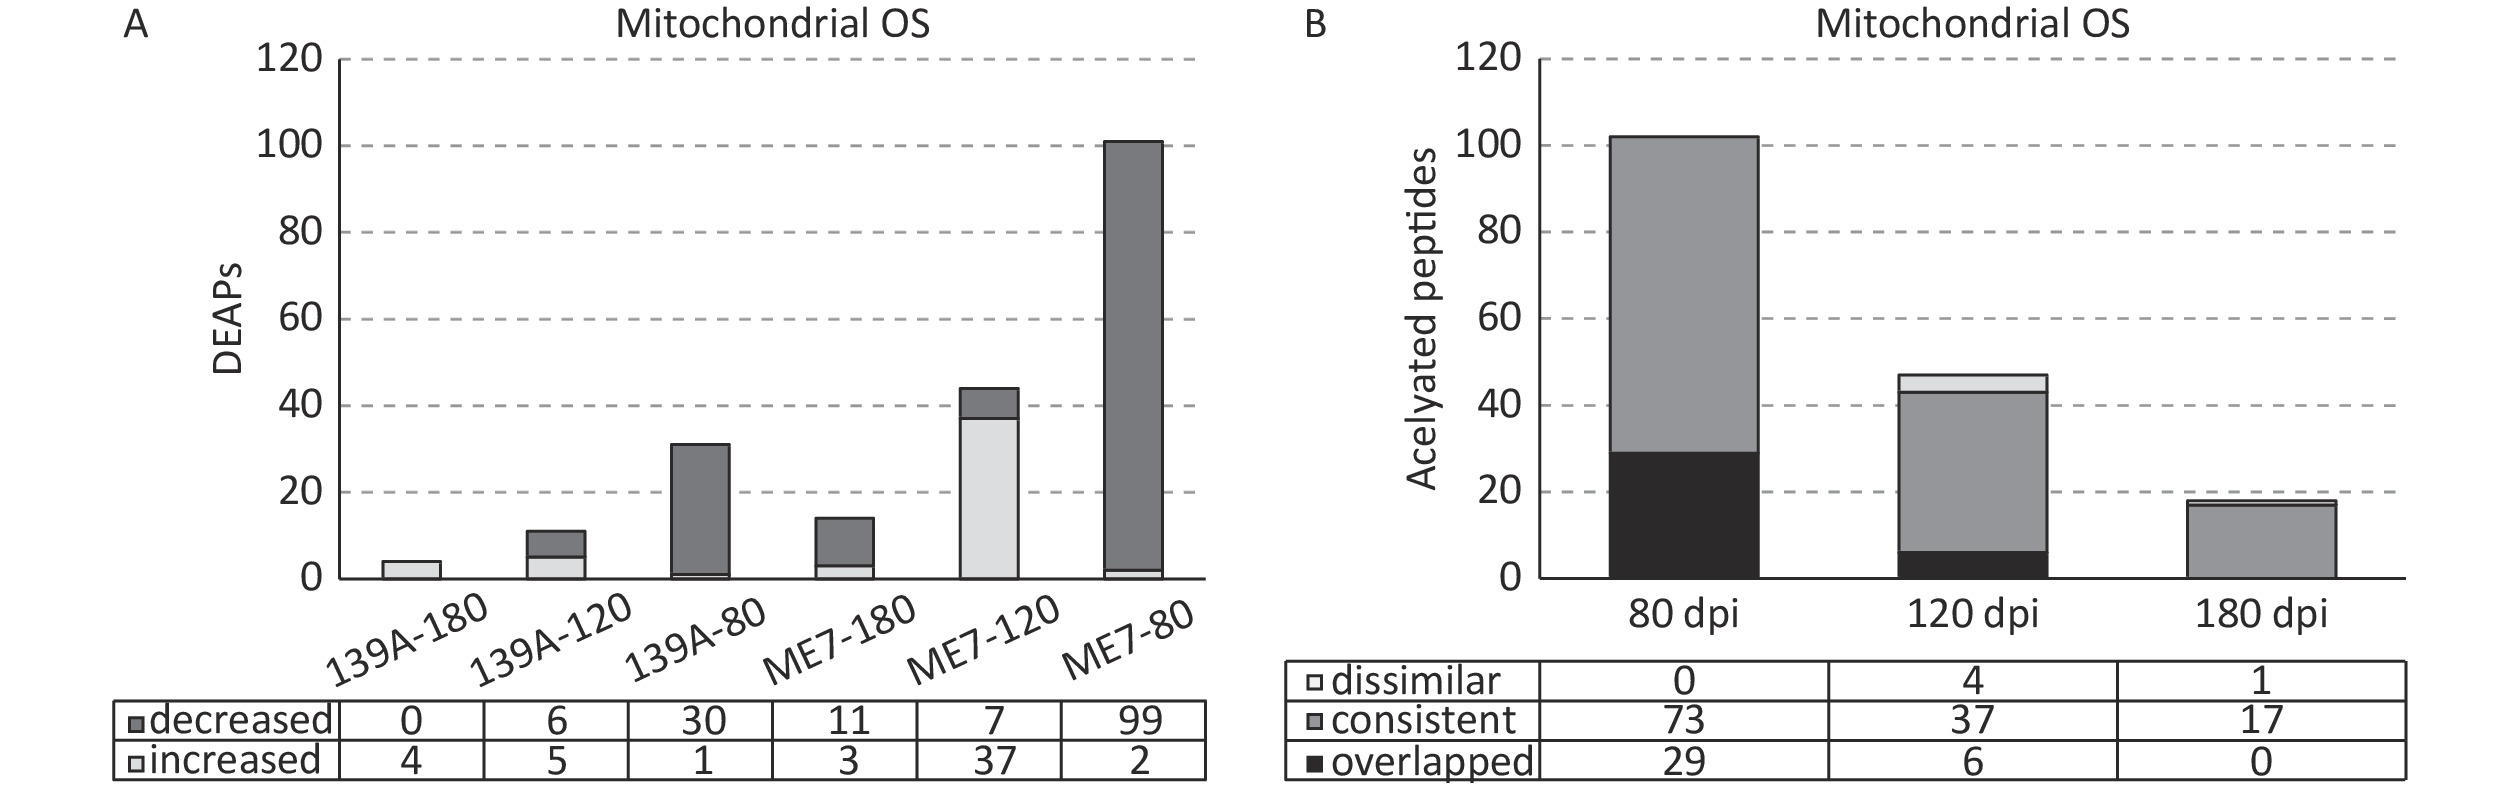
Out of 1,485 identified acetylated peptides, 328 peptides were marked as mitochondrial organism (OS), which accounted for 22.1% of total acetylated peptides. A total of 135 acetylated peptides (41.1%) showed differential expression (> 1.5-fold increased and/or < 0.666-fold decreased) in one or more tested samples of scrapie-infected mice. Figure 3A illustrates the numbers of DEAPs in the samples at each time point of the two scrapie-infected mice. Similar to the global profile of DEAPs, the numbers of DEAPs in the brain samples of mid-early stages of scrapie-infected mice were substantially more than those of mid-late and terminal stages. More DEAPs were observed in the samples of ME7- than 139A-infected mice. In the 80 dpi samples, 99 (98%) out of 101 DEAPs in ME7 and 30 (96.8%) out of 31 DEAPs in 139A were down-regulated. In the 120 dpi samples, the decreased DEAPs were reduced to 15.9% (7/44) in ME7 and 54.5% (6/11) in 139A. In the late stage samples (180 dpi), all four DEAPs in 139A increased, whereas 3 (21%) out of 14 DEAPs in ME7 showed increases.
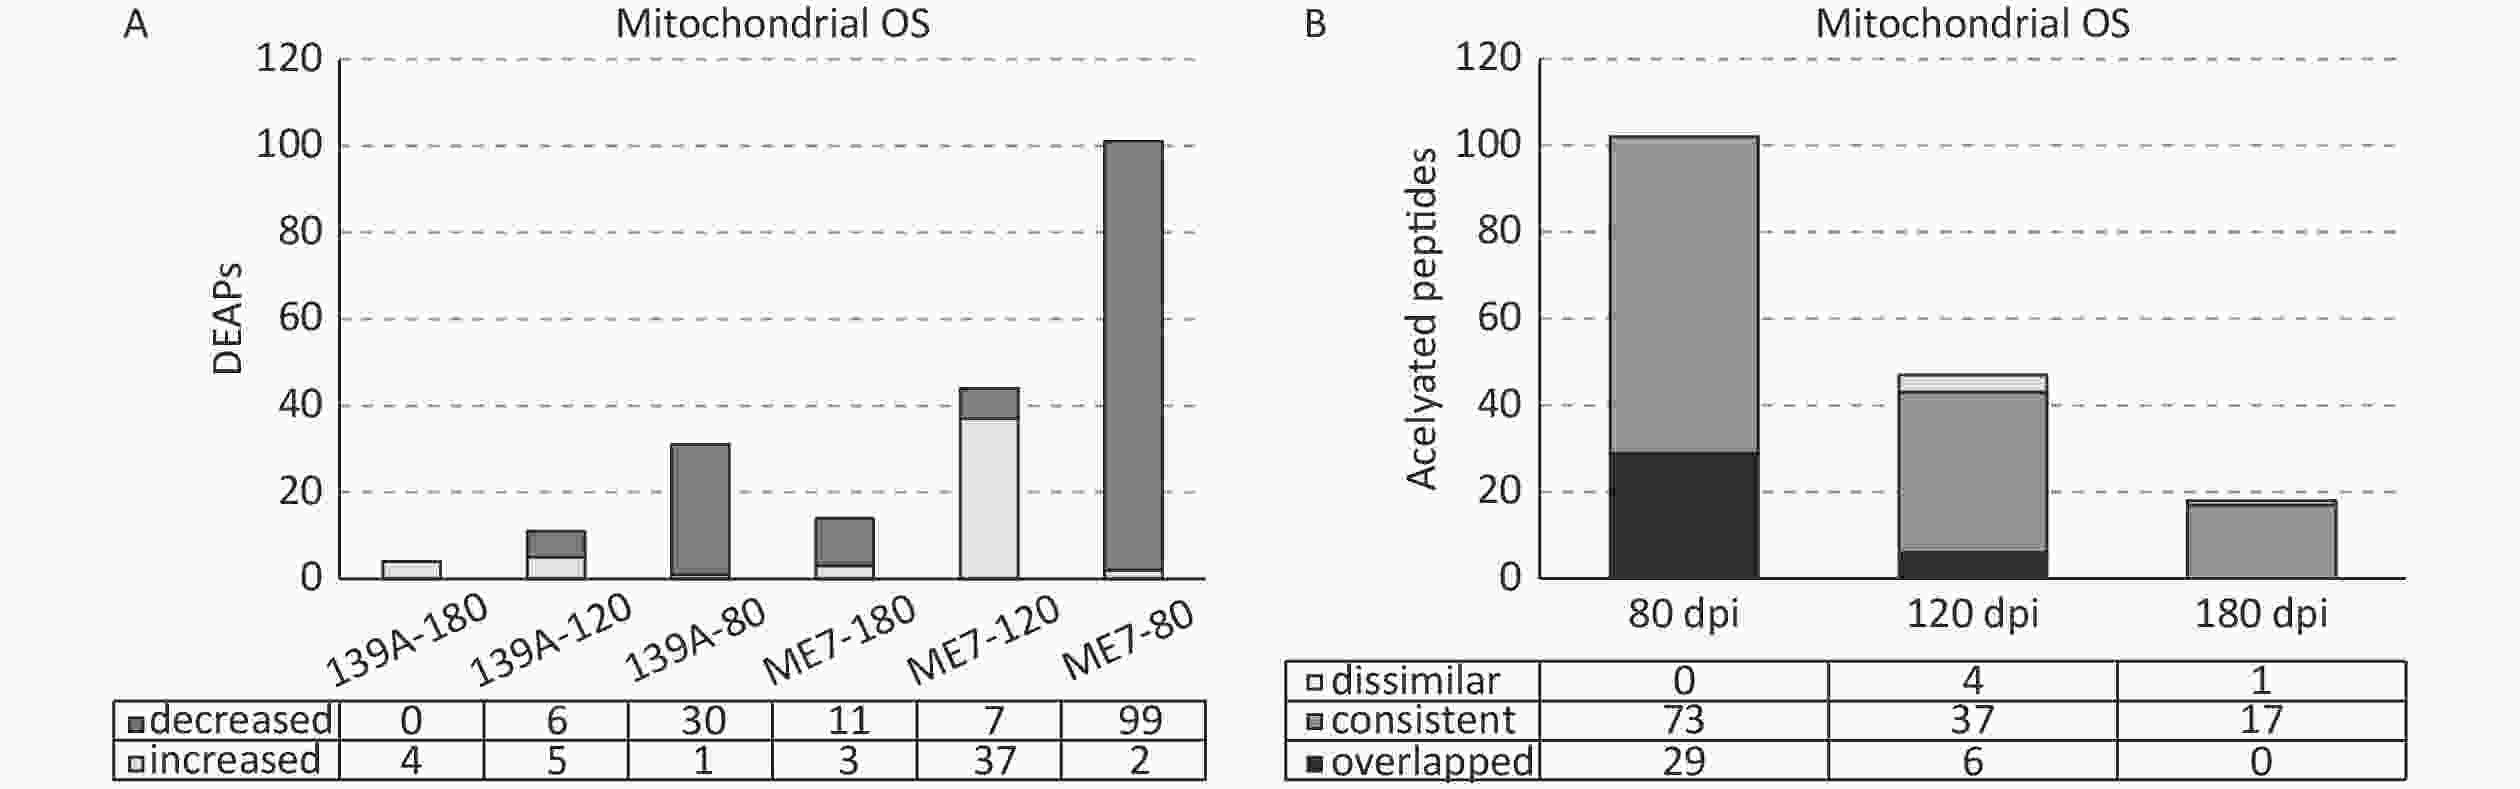
Figure 3. Mitochondrial associated DEAPs in the brains of 139A- and ME7-infected mice collected at mid-early, mid-late, and terminal stages. (A) Numbers of DEAPs based on 1.5-fold change. The numbers of increased and decreased DEAPs in each sample are shown at the bottom. (B) Change trends of DEAPs. The numbers of overlapping, similar, and dissimilar DEAPs in each sample are shown at the bottom.
Further, the consistency and dissimilarity of the mitochondrial associated DEAPs at each time point between two scrapie-infected mice were analyzed. The acetylated peptides showing differential expression in two scrapie experimental mice were considered overlapping. The acetylated peptides showing differential expression in one infected model but not differentially expressed while expressed at the same tendency (> 1.5 and < 1.0 for the increased ones and > 1.0 and < 0.666 for the decreased ones) in another model were considered as consistent ones. The acetylated peptides showing differential expression in one infected model but were expressed at the opposite tendency were considered dissimilar ones. As shown in Figure 3B, in the mid-early stage samples, 29 acetylated peptides overlapped, 73 were consistent, and none were dissimilar between 139A- and ME7-infected mice. In the samples for the mid-late stage, 6 were overlapped, 37 were consistent, and 4 were dissimilar. In the late stage samples, no acetylated peptides overlapped, but 17 were consistent, and 1 was dissimilar. This finding indicates that the predominantly majority of the identified acetylated mitochondrial associated peptides were consistently expressed in the brains of the two kinds of scrapie-infected mice at three time points during infection, although the samples of ME7-infected mice contained notably more DEAPs than 139A-infected ones.
The bioinformatic assay revealed that 328 identified acetylated mitochondrial associated peptides belonged to 74 different proteins, with 44 (59.5%) proteins showing differential expression in at least one tested time point. The names of these 44 proteins, the numbers of the identified peptides, the numbers of DEAPs, the acetylated positions of the individual differentially expressed proteins (DEPs), and the DEAPs in the tested samples were summarized in (Supplementary Table S1 available in www.besjournal.com). A total of 9 (20.5%) out of 44 proteins contained 10 or more than 10 identified peptides, including aconitate hydratase (with 6 DEAPs), aspartate aminotransferase (with 14 DEAPs), ATP synthase subunit alpha (with 8 DEAPs), ATP synthase subunit beta (with 5 DEAPs), dihydrolipoyl dehydrogenase (with 6 DEAPs), glutamate dehydrogenase 1 (with 12 DEAPs), isocitrate dehydrogenase [NADP] (with 2 DEAPs), malate dehydrogenase (with 8 DEAPs), and pyruvate dehydrogenase E1 component subunit alpha (with 8 DEAPs). In addition, 24 (54.5%) differentially changed proteins contained 2–9 identified peptides, and 11 (25%) proteins contained one identified peptide.
Protein No. of
identified
peptideNo. of DEAP Acetylated
position (down)Changed in sample
(No. of DEAP)Acetylated position (up) Changed in sample
(No. of DEAP)1 28S ribosomal protein S9 1 1 aa. 28 ME7 80 dpi (1) / / 2 4-aminobutyrate aminotransferase 4 1 aa. 400 ME7 80 dpi (1) / / 3 60 kD heat shock protein 2 1 aa. 130 ME7 80 dpi (1), 139A 80 dpi (1), ME7 180 dpi (1) / / 4 Aconitate hydratase 20 6 aa. 50, 168, 517, 736, 743 ME7 80 dpi (6), 139A 80 dpi (1) / / 5 Acyl-coenzyme A thioesterase 2 1 1 aa. 83 ME7 80 dpi (1) aa. 83 ME7 120 dpi (1), 139A 120 dpi (1) 6 Acyl-coenzyme A thioesterase 9 4 3 aa. 102, 155 ME7 80 dpi (3), 139A 80 dpi (1) aa. 102 ME7 120 dpi (1) 7 Aspartate aminotransferase 29 14 aa. 73, 82, 94, 122, 159, 363, 404 ME7 80 dpi (11), 139A 80 dpi (5), ME7 120 dpi (1), 139A 120 dpi (3), ME7 180 dpi (3) aa. 73,404 ME7 120 dpi (4) 8 ATP synthase F(0) complex subunit B1 9 3 aa. 162, 225, 233 ME7 80 dpi (3), 139A 80 dpi (1), ME7 120 dpi (1), 139A 120 dpi (1), ME7 180 dpi (2) / / 9 ATP synthase subunit alpha 20 8 aa. 126, 261, 498, 539 ME7 80 dpi (4), 139A 80 dpi (1) aa. 194, 230, 498, 541 ME7 80 dpi (2), 139A 80 dpi (1), ME7 120 dpi (2), ME7 180 (1) 10 ATP synthase subunit beta 11 5 aa. 212 ME7 120 dpi (2) aa. 426, 259 ME7 (3) 11 ATP synthase subunit d 7 2 aa. 73, 117 ME7 80 dpi (2) / / 12 Calcium uniporter protein 2 1 aa. 331 ME7 80 dpi (1) / / 13 Citrate synthase 5 4 aa. 237, 366, 370 ME7 80 dpi (4), 139A 80 dpi (2) / / 14 Cytochrome b-c1 complex subunit 2 3 2 aa. 92, 250 ME7 80 dpi (2), 139A 80 dpi (1), ME7 180 dpi (1) / / 15 Cytochrome c1 1 1 / ME7 80 dpi (1) / / 16 Dihydrolipoyl dehydrogenase 14 6 aa. 122, 401 ME7 80 dpi (5), 139A 80 dpi (1) aa. 122, 420 ME7 120 dpi (2) 17 Dihydrolipoyllysine-residue succinyltransferase component of 2-oxoglutarate dehydrogenase complex 3 3 aa. 268, 274 ME7 80 dpi (2), 139A 80 dpi (1), ME7 120 dpi (1) aa. 268 ME7 120 dpi (1), 139A 120 dpi (1) 18 Electron transfer flavoprotein subunit alpha 5 2 aa. 69 ME7 80 dpi (2) / / 19 ES1 protein homolog 3 1 aa. 231 ME7 80 dpi (1), 139A 80 dpi (1), ME7 180 dpi (1) / / 20 Fumarate hydratase 8 4 aa. 77 ME 80 dpi (1) aa. 63, 227 ME7 120 dpi (2), ME7 180 (1), 139A 180 dpi (1) 21 Glutamate dehydrogenase 1 12 4 aa. 84, 90, 527 ME7 80 dpi (3), 139A 80 dpi (2) aa. 527 ME7 120 dpi (1) 22 Glutaminase kidney isoform 1 1 aa. 668 ME7 80 dpi (1) / / 23 Hydroxyacyl-coenzyme A dehydrogenase 3 1 aa. 157 ME7 80 dpi (1), 139A 80 dpi (1) / / 24 Isocitrate dehydrogenase [NAD] subunit alpha 9 8 aa. 200, 214, 326 ME7 80 dpi (5), 139A 80 dpi (1) aa. 200, 214 ME7 120 dpi (5) 25 Isocitrate dehydrogenase [NAD] subunit 1 1 aa. 157 ME7 80 dpi (1) / / 26 Isocitrate dehydrogenase [NADP] 10 2 aa. 106,180 ME7 80 dpi (2) / / 27 Isovaleryl-CoA dehydrogenase 2 1 aa. 76 ME7 80 dpi (1) / / 28 Long-chain-specific acyl-CoA dehydrogenase 1 1 aa. 92 ME7 80 dpi (1) / / 29 Malate dehydrogenase 15 8 aa. 97, 297, 301, 307, 324, 338 ME7 80 dpi (8), 139A 80 dpi (1), ME7 180 dpi (1) / / 30 Methylglutaconyl-CoA hydratase 5 1 / / aa. 80 ME7 120 dpi (1) 31 Mitochondrial ATP synthase epsilon subunit 2 2 aa. 17, 26 ME7 80 dpi (2), ME7 180 (1) / / 32 Peptidyl-prolyl cis-trans isomerase F 1 1 / / aa. 85 ME7 120 dpi (1) 33 Persulfide dioxygenase ETHE1 1 1 aa. 66 ME7 80 dpi (1), 139A 80 dpi (1) / / 34 Presequence protease 4 2 / / aa. 305, 707 ME7 120 dpi (2), 139A 180 dpi (1) 35 Pyruvate dehydrogenase E1 component subunit alpha 10 8 aa. 85, 244, 313, 321 ME7 80 dpi (4), 139A 80 dpi (1) aa. 63, 85, 244, 267, 313 ME7 120 dpi (6), 139A 120 dpi (1) 36 Pyruvate dehydrogenase E1 component subunit beta 2 1 aa. 354 ME7 80 dpi (1) / / 37 Pyruvate dehydrogenase protein X component 1 1 aa. 194 ME7 80 dpi (1) / / 38 Stress-70 protein 5 3 aa. 288, 612, 625 ME7 80 dpi (3), 139A 80 dpi (2) / / 39 Succinate dehydrogenase [ubiquinone] flavoprotein subunit 7 5 aa. 498, 550 ME7 80 dpi (4) aa. 608 ME7 120 dpi (1), ME7 180 dpi (1) 40 Succinate--CoA ligase [ADP-forming] subunit beta 1 1 aa. 88 ME7 80 dpi (1) aa. 88 ME7 120 dpi (1) 41 Succinate-semialdehyde dehydrogenase 2 1 aa. 128 ME7 80 dpi (1) / / 42 Superoxide dismutase [Mn] 9 6 aa. 68, 122 ME7 80 dpi (2), 139A 80 dpi (2), ME7 120 dpi (2), 130A 120 dpi (2), ME7 180 dpi (1) aa. 68 ME7 120 dpi (1), 139A 120 dpi (2), 139A 180 dpi (1) 43 Trifunctional enzyme subunit alpha 8 4 aa. 60, 129, 353 ME7 80 dpi (3), 139A 80 dpi (1) aa. 60 ME7 120 dpi (1), 139A 180 dpi (1) 44 Trifunctional enzyme subunit beta 1 1 / / aa. 333 ME7 120 dpi (1) Table S1. The differentially changed mitochondrial associated proteins in in the brain samples of 139A- and ME7-infected mice collected at mid-early (80 dpi), mid-late (120 dpi) and terminal (180 dpi) stages
Three up-regulated DEAPs were identified in the mid-early stage samples, two in ME7-infected and one in 139A-infected mice. All three up-regulated DEAPs belonged to ATP synthase subunit alpha, and the acetylated sites were at aa.194 (for ME7 and 139A) and aa.541 (for ME7). Further analysis revealed that the level of the acetylated peptide at aa.541 in the 139A-80 dpi sample exhibited a 1.4675-fold increase. The two acetylated peptides returned to normal ranges in the 120 and 180 dpi samples of ME7- and 139A-infected mice. Seven down-regulated DEAPs in the 80 dpi samples were significantly up-regulated in the 120 dpi samples. These DEAPs were acyl-coenzyme A thioesterase 2 acetylated at aa.83, acyl-coenzyme A thioesterase 9 acetylated at aa.102, dihydrolipoyl dehydrogenase acetylated at aa.122, dihydrolipoyllysine-residue succinyltransferase component of 2-oxoglutarate dehydrogenase complex acetylated at aa.268, isocitrate dehydrogenase [NAD] subunit alpha acetylated at aa.200 and aa.214, peptidyl-prolyl cis-trans isomerase F acetylated at aa.85, pyruvate dehydrogenase E1 component subunit alpha acetylated at aa.244 and 313, and succinate--CoA ligase [ADP-forming] subunit beta acetylated at aa.88. In parallel, 79 down-regulated DEAPs in the 80 dpi samples were normal ranges in 120 and 180 dpi samples, with the majority showing increasing trends in 120 dpi and decreasing slightly in 180 dpi. Twelve down-regulated DEAPs in the 80 dpi samples remained significantly down-regulated in the subsequent samples. In the 120 dpi samples, 26 DEAPs were up-regulated only at this time point, 7 up-regulated ones were down-regulated significantly in 80 dpi samples, and 6 up-regulated ones maintained their increased status in 180 dpi samples. In addition, all 11 down-regulated and 7 up-regulated DEAPs in the 180 dpi samples were identified as DEAPs in 80 and/or 120 dpi samples. These data indicated that during scrapie infection, the acetylation of the mitochondrial related proteins in the whole brain tissues is markedly down-regulated in the mid-early stage, becomes active in the mid-late stage, and turns relatively silent in the terminal stage.
-
To analyze the possible involved biological pathway of the DEAPs, the Kyoto Encyclopedia of Genes and Genomes (KEGG) pathway analysis was conducted using the KOBAS2.0 software. As shown in Figure 4A, 55, 25, and 18; and 39, 13, and 10 biological pathways were significantly changed (P < 0.05) in the 80, 120, and 180 dpi samples of ME7- and 139A-infected mice, respectively. The top 10 involved pathways based on their P values, and the numbers of DEAPs in each tested sample were summarized in (Supplementary Table S2 available in www.besjournal.com). Six significantly changed biological pathways were identified in all tested samples, including carbon metabolism, metabolic pathways, biosynthesis of amino acids, glycolysis/gluconeogenesis, pyruvate metabolism, and citrate cycle (TCA cycle). Subsequently, the numbers of the involved up- and down-regulated DEAPs in these six pathways for each tested sample were counted (Figure 4B–4G). All six pathways showed similar distribution patterns of DEAPs, with predominantly down-regulated DEAPs in the mid-early stage and up-regulated DEAPs in the mid-late and late stages. Meanwhile, the numbers of involved DEAPs in these pathways reduced along with the incubation, particularly in the brain samples of ME7-infected mice. Two kinds of scrapie-infected mice models also displayed other differences besides the numbers of involved DEAPs. In the samples of 139A-infected mice, all DEAPs involved in the six pathways were down-regulated in 80 dpi and up-regulated in 180 dpi samples. In the 120 dpi samples, the DEAPs in three pathways were all up-regulated, and the other three contained one down-regulated DEAP. A similar pattern was also observed in the samples of ME7-infected mice, with an overwhelming majority of down-regulated DEAPs observed in the 80 dpi samples and the majority of up-regulated DEAPs found in 120 dpi samples. In the 180 dpi samples, the numbers of DEAPs were considerably less, and the ratios of up- and down-regulated DEAPs in most (5/6) involved pathways were almost the same.
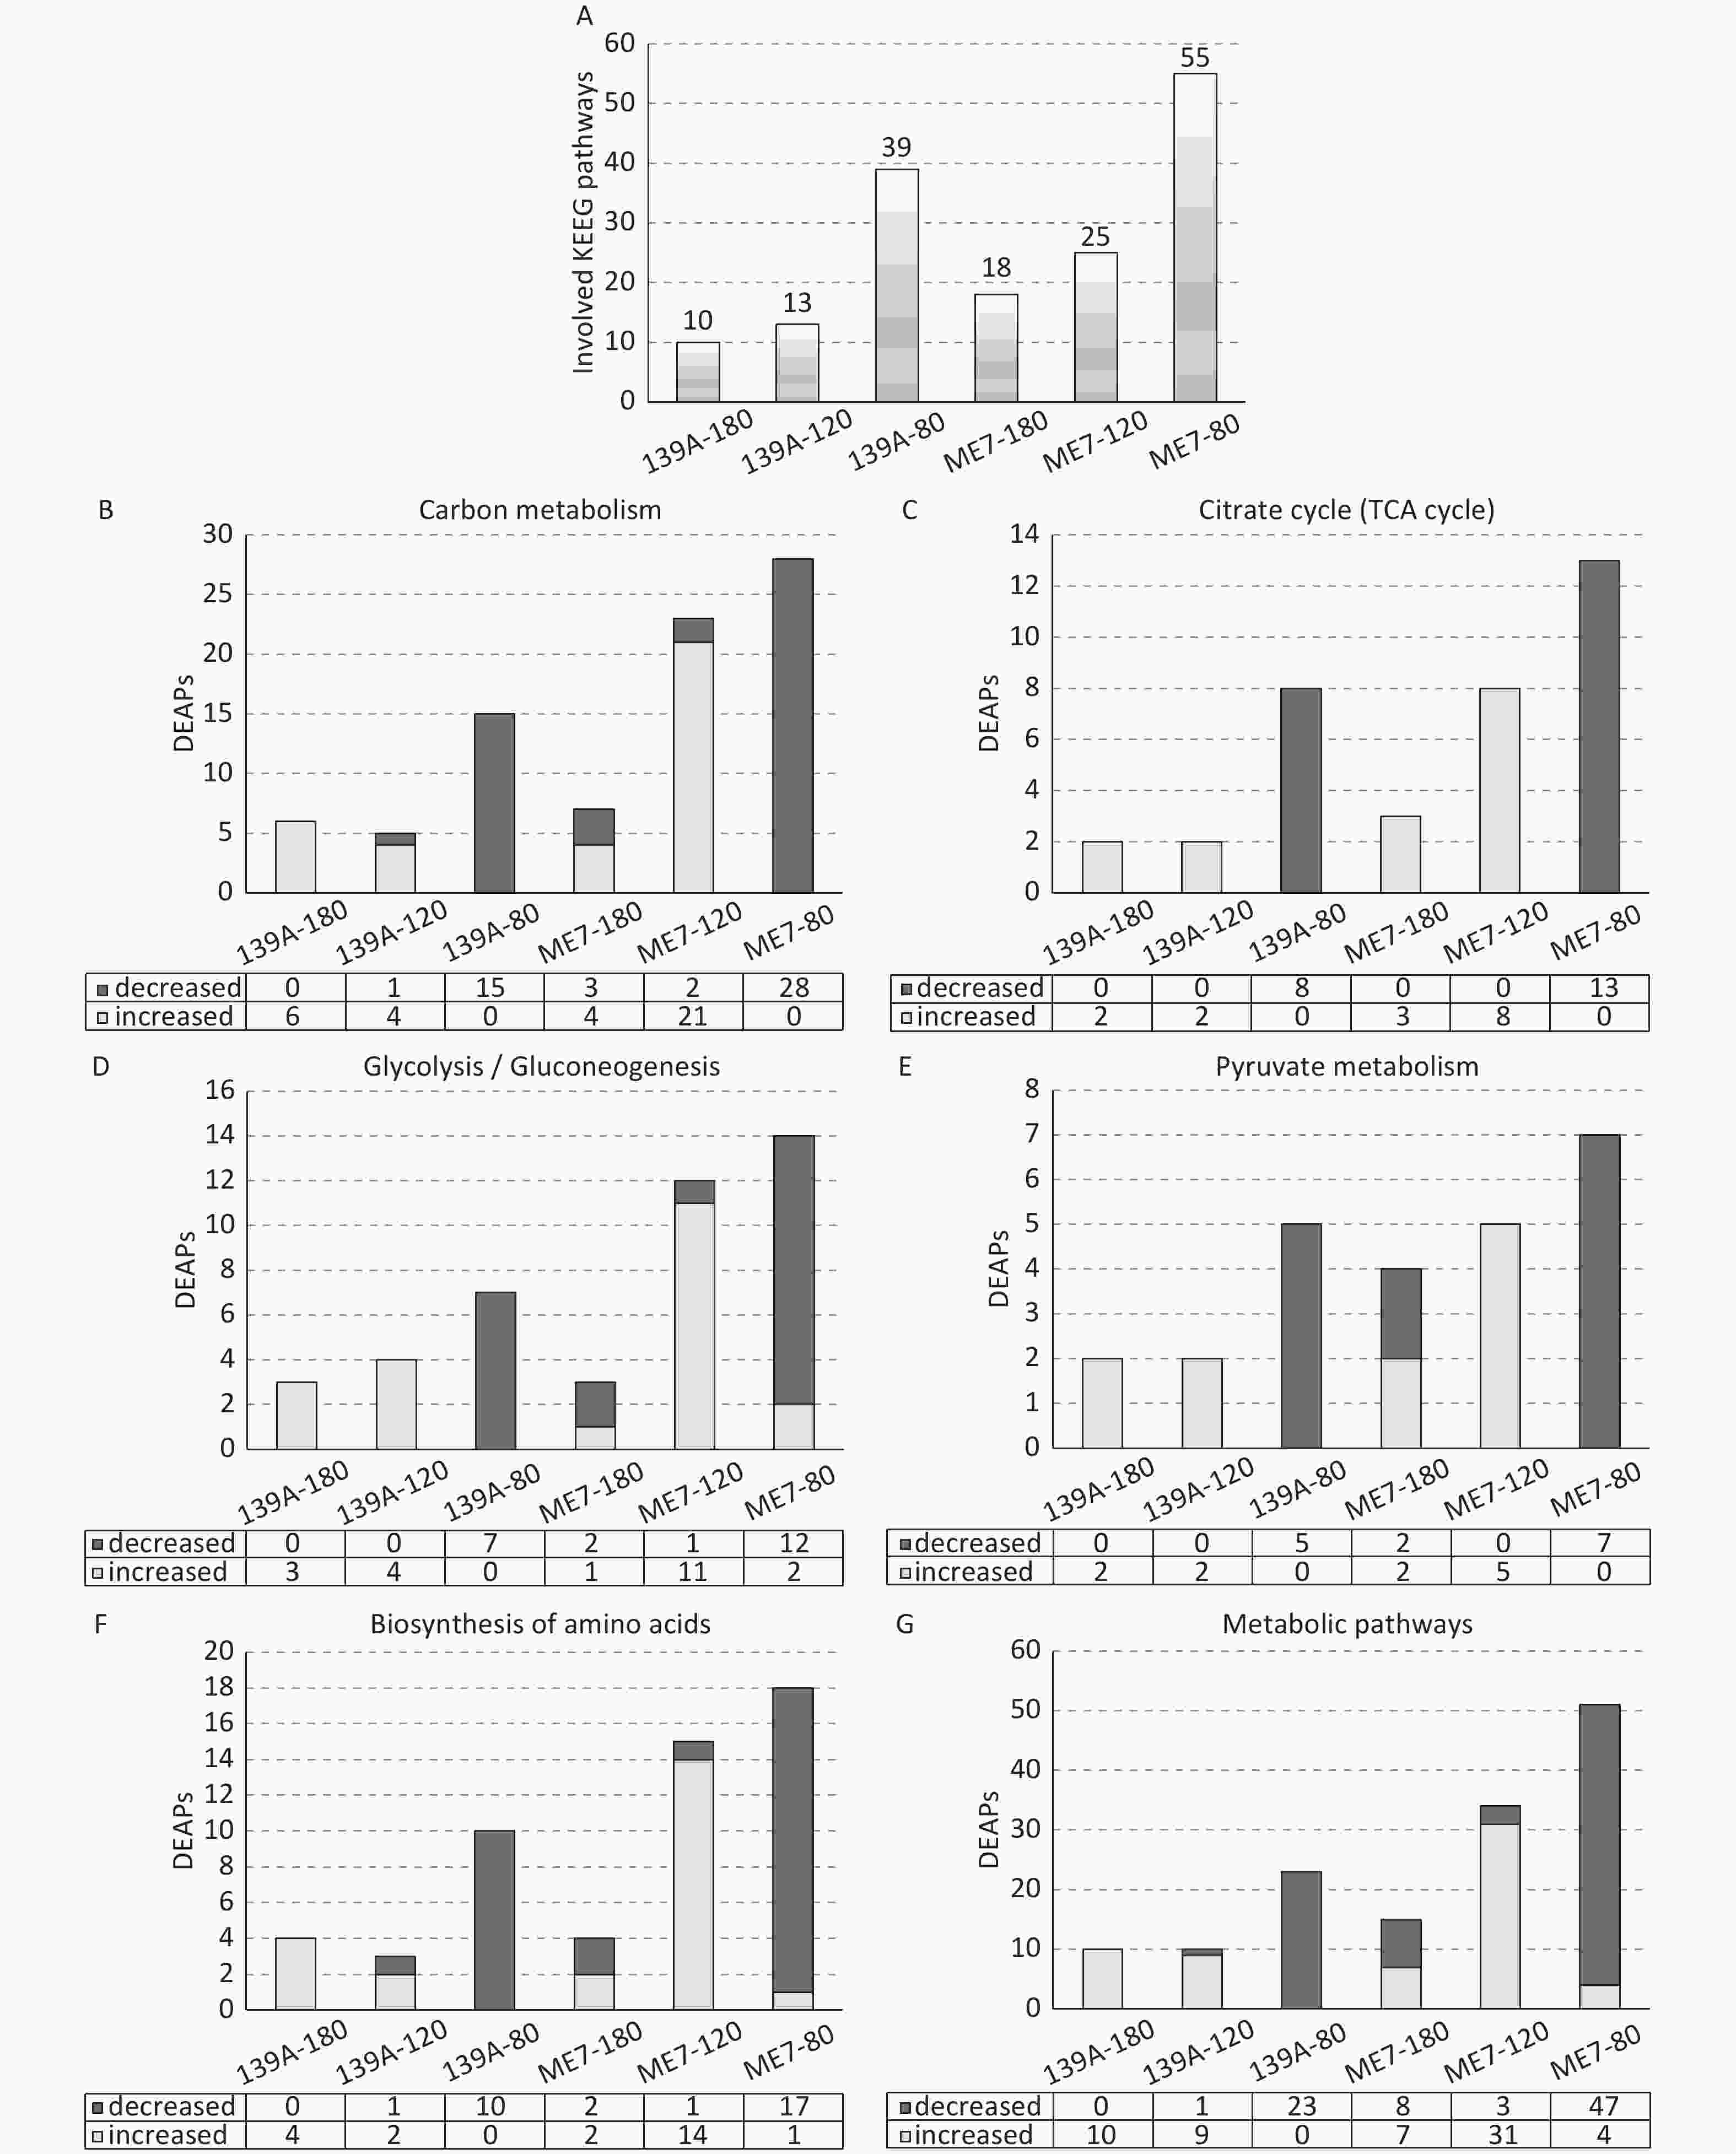
Figure 4. Numbers of involved KEGG pathways and DEAPs in six commonly detected pathways in the brains of 139A- and ME7-infected mice collected at mid-early, mid-late, and terminal stages. (A) KEGG pathways. The numbers of involved pathways in each sample are indicated at the top. (B) Carbon metabolism. (C) TCA cycle. (D) Glycolysis/Gluconeogenesis. (E) Pyruvate metabolism. (F) Biosynthesis of amino acids. (G) Metabolic pathways. The numbers of increased and decreased DEAPs in each sample are shown at the bottom.
Brain sample Involved pathway P value Acetylated Protein
in Diff Exp139A 180 dpi Carbon metabolism - Mus musculus (mouse) 0.00019146 6 Metabolic pathways - Mus musculus (mouse) 0.00110251 10 Biosynthesis of amino acids - Mus musculus (mouse) 0.00190727 4 HIF-1 signaling pathway - Mus musculus (mouse) 0.0035315 3 Longevity regulating pathway - multiple species - Mus musculus (mouse) 0.00441966 2 PPAR signaling pathway - Mus musculus (mouse) 0.00806604 2 Glycolysis / Gluconeogenesis - Mus musculus (mouse) 0.00813558 3 Glyoxylate and dicarboxylate metabolism - Mus musculus (mouse) 0.01025453 2 Pyruvate metabolism - Mus musculus (mouse) 0.02450717 2 Citrate cycle (TCA cycle) - Mus musculus (mouse) 0.03940544 2 139A-120 dpi Metabolic pathways - Mus musculus (mouse) 0.0000412 10 Glycolysis / Gluconeogenesis - Mus musculus (mouse) 0.000172 4 Carbon metabolism - Mus musculus (mouse) 0.000296 5 HIF-1 signaling pathway - Mus musculus (mouse) 0.001244 3 Cysteine and methionine metabolism - Mus musculus (mouse) 0.003018 2 Biosynthesis of amino acids - Mus musculus (mouse) 0.006147 3 Arginine and proline metabolism - Mus musculus (mouse) 0.00632 2 Pyruvate metabolism - Mus musculus (mouse) 0.012394 2 Citrate cycle (TCA cycle) - Mus musculus (mouse) 0.020208 2 Glucagon signaling pathway - Mus musculus (mouse) 0.024713 2 139A-80 dpi Carbon metabolism - Mus musculus (mouse) 3.8998 × 10⁻¹⁰ 15 Biosynthesis of amino acids - Mus musculus (mouse) 1.9413 × 10⁻⁷ 10 Citrate cycle (TCA cycle) - Mus musculus (mouse) 1.9661 × 10⁻⁷ 8 Metabolic pathways - Mus musculus (mouse) 7.4289 × 10⁻⁷ 23 2-Oxocarboxylic acid metabolism - Mus musculus (mouse) 5.5069 × 10⁻⁶ 5 Glyoxylate and dicarboxylate metabolism - Mus musculus (mouse) 1.1987 × 10⁻⁵ 5 Glycolysis / Gluconeogenesis - Mus musculus (mouse) 3.2015 × 10⁻⁵ 7 Pyruvate metabolism - Mus musculus (mouse) 0.00016141 5 Glucagon signaling pathway - Mus musculus (mouse) 0.00102569 5 Arginine biosynthesis - Mus musculus (mouse) 0.00124941 3 ME7-180 dpi Cysteine and methionine metabolism - Mus musculus (mouse) 0.0000172 4 Metabolic pathways - Mus musculus (mouse) 0.0000945 15 Carbon metabolism - Mus musculus (mouse) 0.000337 7 Pyruvate metabolism - Mus musculus (mouse) 0.000426 4 Citrate cycle (TCA cycle) - Mus musculus (mouse) 0.001198 4 Glyoxylate and dicarboxylate metabolism - Mus musculus (mouse) 0.001488 3 Oxidative phosphorylation - Mus musculus (mouse) 0.002029 5 Parkinson's disease - Mus musculus (mouse) 0.005802 5 Huntington's disease - Mus musculus (mouse) 0.005802 5 Alzheimer's disease - Mus musculus (mouse) 0.008496 5 ME7-120 dpi Carbon metabolism - Mus musculus (mouse) 4.6223 × 10⁻¹⁵ 23 Biosynthesis of amino acids - Mus musculus (mouse) 1.511 × 10⁻¹⁰ 15 Glycolysis / Gluconeogenesis - Mus musculus (mouse) 7.3068 × 10⁻⁹ 12 Metabolic pathways - Mus musculus (mouse) 1.5321 × 10⁻⁸ 34 Pentose phosphate pathway - Mus musculus (mouse) 6.5226 × 10⁻⁶ 7 Citrate cycle (TCA cycle) - Mus musculus (mouse) 8.4311 × 10⁻⁶ 8 Arginine biosynthesis - Mus musculus (mouse) 0.00026325 4 RNA degradation - Mus musculus (mouse) 0.00042343 5 HIF-1 signaling pathway - Mus musculus (mouse) 0.000782 6 Pyruvate metabolism - Mus musculus (mouse) 0.00155492 5 ME7-80 dpi Carbon metabolism - Mus musculus (mouse) 1.1992 × 10⁻¹⁶ 28 Metabolic pathways - Mus musculus (mouse) 2.9039 × 10⁻¹³ 51 Biosynthesis of amino acids - Mus musculus (mouse) 2.0746 × 10⁻¹¹ 18 Citrate cycle (TCA cycle) - Mus musculus (mouse) 2.777 × 10⁻¹⁰ 13 Glycolysis / Gluconeogenesis - Mus musculus (mouse) 3.7415 × 10⁻⁹ 14 2-Oxocarboxylic acid metabolism - Mus musculus (mouse) 1.8879 × 10⁻⁵ 6 Necroptosis - Mus musculus (mouse) 2.5058 × 10⁻⁵ 8 Pentose phosphate pathway - Mus musculus (mouse) 7.7631 × 10⁻⁵ 7 Central carbon metabolism in cancer - Mus musculus (mouse) 0.00014251 7 Pyruvate metabolism - Mus musculus (mouse) 0.00014251 7 Table S2. The top 10 involved pathways in the brain samples of 139A- and ME7-infected mice collected at mid-early (80 dpi), mid-late (120 dpi), and terminal (180 dpi) stages
-
The citrate cycle or TCA cycle, which is located in the cytoplasm of prokaryotes and mitochondria of eukaryotes, is an essential metabolism pathway in the aerobic body. The acetylation processes of dozens of enzymes in the TCA cycle showed significant changes in the brain tissues during prion infections, covering 13 and 8 down-regulated DEAPs in 80 dpi samples, 8 and 2 up-regulated ones in 120 dpi samples, 3 and 2 up-regulated ones in 180 dpi samples of ME7- and 139A-infected mice, respectively (Figure 4C). Furthermore, the status of each DEAP at the three time points was analyzed (Supplementary Table S3 available in www.besjournal.com). A total of 7 out of 8 down-regulated DEAPs in 80 dpi samples of 139A-infected mice significantly decreased compared with that of ME7-infected mice. The rest of the involved DEAPs observed in one type of scrapie-infected mouse (5 in ME7 and 1 in 139A) also showed down-regulated tendencies in another model despite the insignificance. Most of these down-regulated DEAPs increased in the 120 dpi samples, with 4 DEAPs being significantly up-regulated. All down-regulated DEAPs in the 80 dpi samples dropped to the normal ranges in 180 dpi samples. All eight DEAPs in the TCA cycle identified in the 120 dpi samples were up-regulated, and among them, two DEAPs were commonly detected in 139A- and ME7-infected mice. A total of 3 out of 8 up-regulated DEAPs in the 120 dpi samples maintained their increases, and another 5 returned to normal ranges in the 180 dpi samples. In the 180 dpi samples, 4 DEAPs were identified in the TCA cycle, and all of them were up-regulated. These data strongly indicated that the acetylating processes of the enzymes of the TCA cycle in the brain tissues were negatively regulated in the early stage and positively regulated in the mid-late and terminal stages of prion infection.
Diff Exp Proteins Modification ME7-
80 dpi139A-
80 dpiME7-
120 dpi139A-
120 dpiME7-
180 dpi139A-
180 dpiIn 180 dpi Fumarate hydratase N-Term (TMT6plex); K5 (Acetyl);
Q10 (Deamidated)1.032 1.326 2.307 1.298 1.17 1.546 Malate dehydrogenase N-Term (Acetyl); N-Term (TMT6plex);
Q2 (Deamidated); K11 (TMT6plex)0.919 1.139 2.411 1.498 1.507 2.075 Fumarate hydratase N-Term (TMT6plex); K7 (Acetyl) 0.925 1.039 1.252 1.106 1.702 1.278 Succinate dehydrogenase
[ubiquinone] flavoprotein subunitN-Term (TMT6plex); K8 (Acetyl); K15
(TMT6plex)0.701 0.832 1.919 1.102 1.775 1.12 In 120 dpi Dihydrolipoyllysine-residue
succinyltransferase component
of 2-oxoglutarate dehydrogenase
complexN-Term (TMT6plex); K2 (TMT6plex);
K7 (TMT6plex); K8 (Acetyl)0.57 0.542 1.978 1.926 0.776 1.161 Pyruvate dehydrogenase E1
component subunit alphaN-Term (TMT6plex); K2 (TMT6plex);
K10 (Acetyl)0.699 0.659 2.044 1.981 0.8505 1.2335 Fumarate hydratase N-Term (TMT6plex); K5 (Acetyl);
Q10 (Deamidated)1.032 1.326 2.307 1.298 1.17 1.546 Malate dehydrogenase N-Term (Acetyl); N-Term (TMT6plex);
Q2 (Deamidated); K11 (TMT6plex)0.919 1.139 2.411 1.498 1.507 2.075 Succinate--CoA ligase [ADP-forming]
subunit betaN-Term (TMT6plex); K10 (Acetyl);
K11 (TMT6plex)0.586 0.795 1.694 1.244 1.047 1.273 Isocitrate dehydrogenase [NAD]
subunit alphaN-Term (TMT6plex); K8 (Acetyl);
N10 (Deamidated); M12 (Oxidation)0.8175 0.954 1.867 1.4855 1.047 1.346 Dihydrolipoyl dehydrogenase N-Term (TMT6plex); K5 (Acetyl);
M6 (Oxidation); M7 (Oxidation);
K10 (TMT6plex)0.424 0.56 1.6 0.916 0.824 0.842 Succinate dehydrogenase
[ubiquinone] flavoprotein subunitN-Term (TMT6plex); K8(Acetyl);
K15 (TMT6plex)0.701 0.832 1.919 1.102 1.775 1.12 In 80 dpi Dihydrolipoyl dehydrogenase N-Term (TMT6plex); K5 (Acetyl);
M6 (Oxidation); M7 (Oxidation);
K10 (TMT6plex)0.424 0.56 1.6 0.916 0.824 0.842 Citrate synthase N-Term (TMT6plex); K4 (TMT6plex);
K10 (Acetyl)0.362 0.515 1.09 0.944 0.675 0.814 Malate dehydrogenase N-Term (TMT6plex); N1 (Deamidated);
K6 (Acetyl); K13 (TMT6plex)0.5 0.664 0.809 0.856 0.706 1.106 Pyruvate dehydrogenase E1
component subunit alphaN-Term (TMT6plex); K2 (TMT6plex);
K10 (Acetyl)0.699 0.659 2.044 1.981 0.8505 1.2335 Dihydrolipoyllysine-residue
succinyltransferase component of
2-oxoglutarate dehydrogenase
complexN-Term (TMT6plex); K2 (TMT6plex);
K7 (TMT6plex); K8 (Acetyl)0.57 0.542 1.978 1.926 0.776 1.161 Isocitrate dehydrogenase N-Term (TMT6plex);
C5 (Carbamidomethyl);
K6 (Acetyl); N7 (Deamidated)0.484 0.607 1.088 0.846 0.804 0.812 Aconitate hydratase N-Term (TMT6plex); K6 (Acetyl);
N7 (Deamidated); N9 (Deamidated)0.452 0.56 1.201 1.061 0.794 0.786 Isocitrate dehydrogenase
[NAD] subunit alphaN-Term (TMT6plex); K10 (Acetyl);
C15 (Carbamidomethyl); K20 (TMT6plex)0.627 0.583 0.707 0.917 0.838 0.674 Pyruvate dehydrogenase E1
component subunit betaN-Term (TMT6plex); K7 (Acetyl);
K8 (TMT6plex)0.643 0.701 0.996 0.88 0.8255 1.0335 Succinate--CoA ligase
[ADP-forming] subunit betaN-Term (TMT6plex); K10 (Acetyl);
K11 (TMT6plex)0.586 0.795 1.694 1.244 1.047 1.273 Isocitrate dehydrogenase [NADP] N-Term (TMT6plex); K8 (Acetyl) 0.597 0.7445 1.261 1.1625 0.9805 1.023 Fumarate hydratase N-Term (TMT6plex); M3 (Oxidation);
K6 (Acetyl)0.5255 0.707 1.3715 1.027 0.7775 1.176 Succinate dehydrogenase
[ubiquinone] flavoprotein subunitN-Term (TMT6plex); N-Term (Acetyl) 0.578 0.818 1.204 1.01 0.706 1.006 Table S3. The folds of the differentially expressed proteins within the pathway of citrate cycle (TCA cycle) in the brain samples of 139A- and ME7-infected mice collected at mid-early (80 dpi), mid-late (120 dpi) and terminal (180 dpi) stages
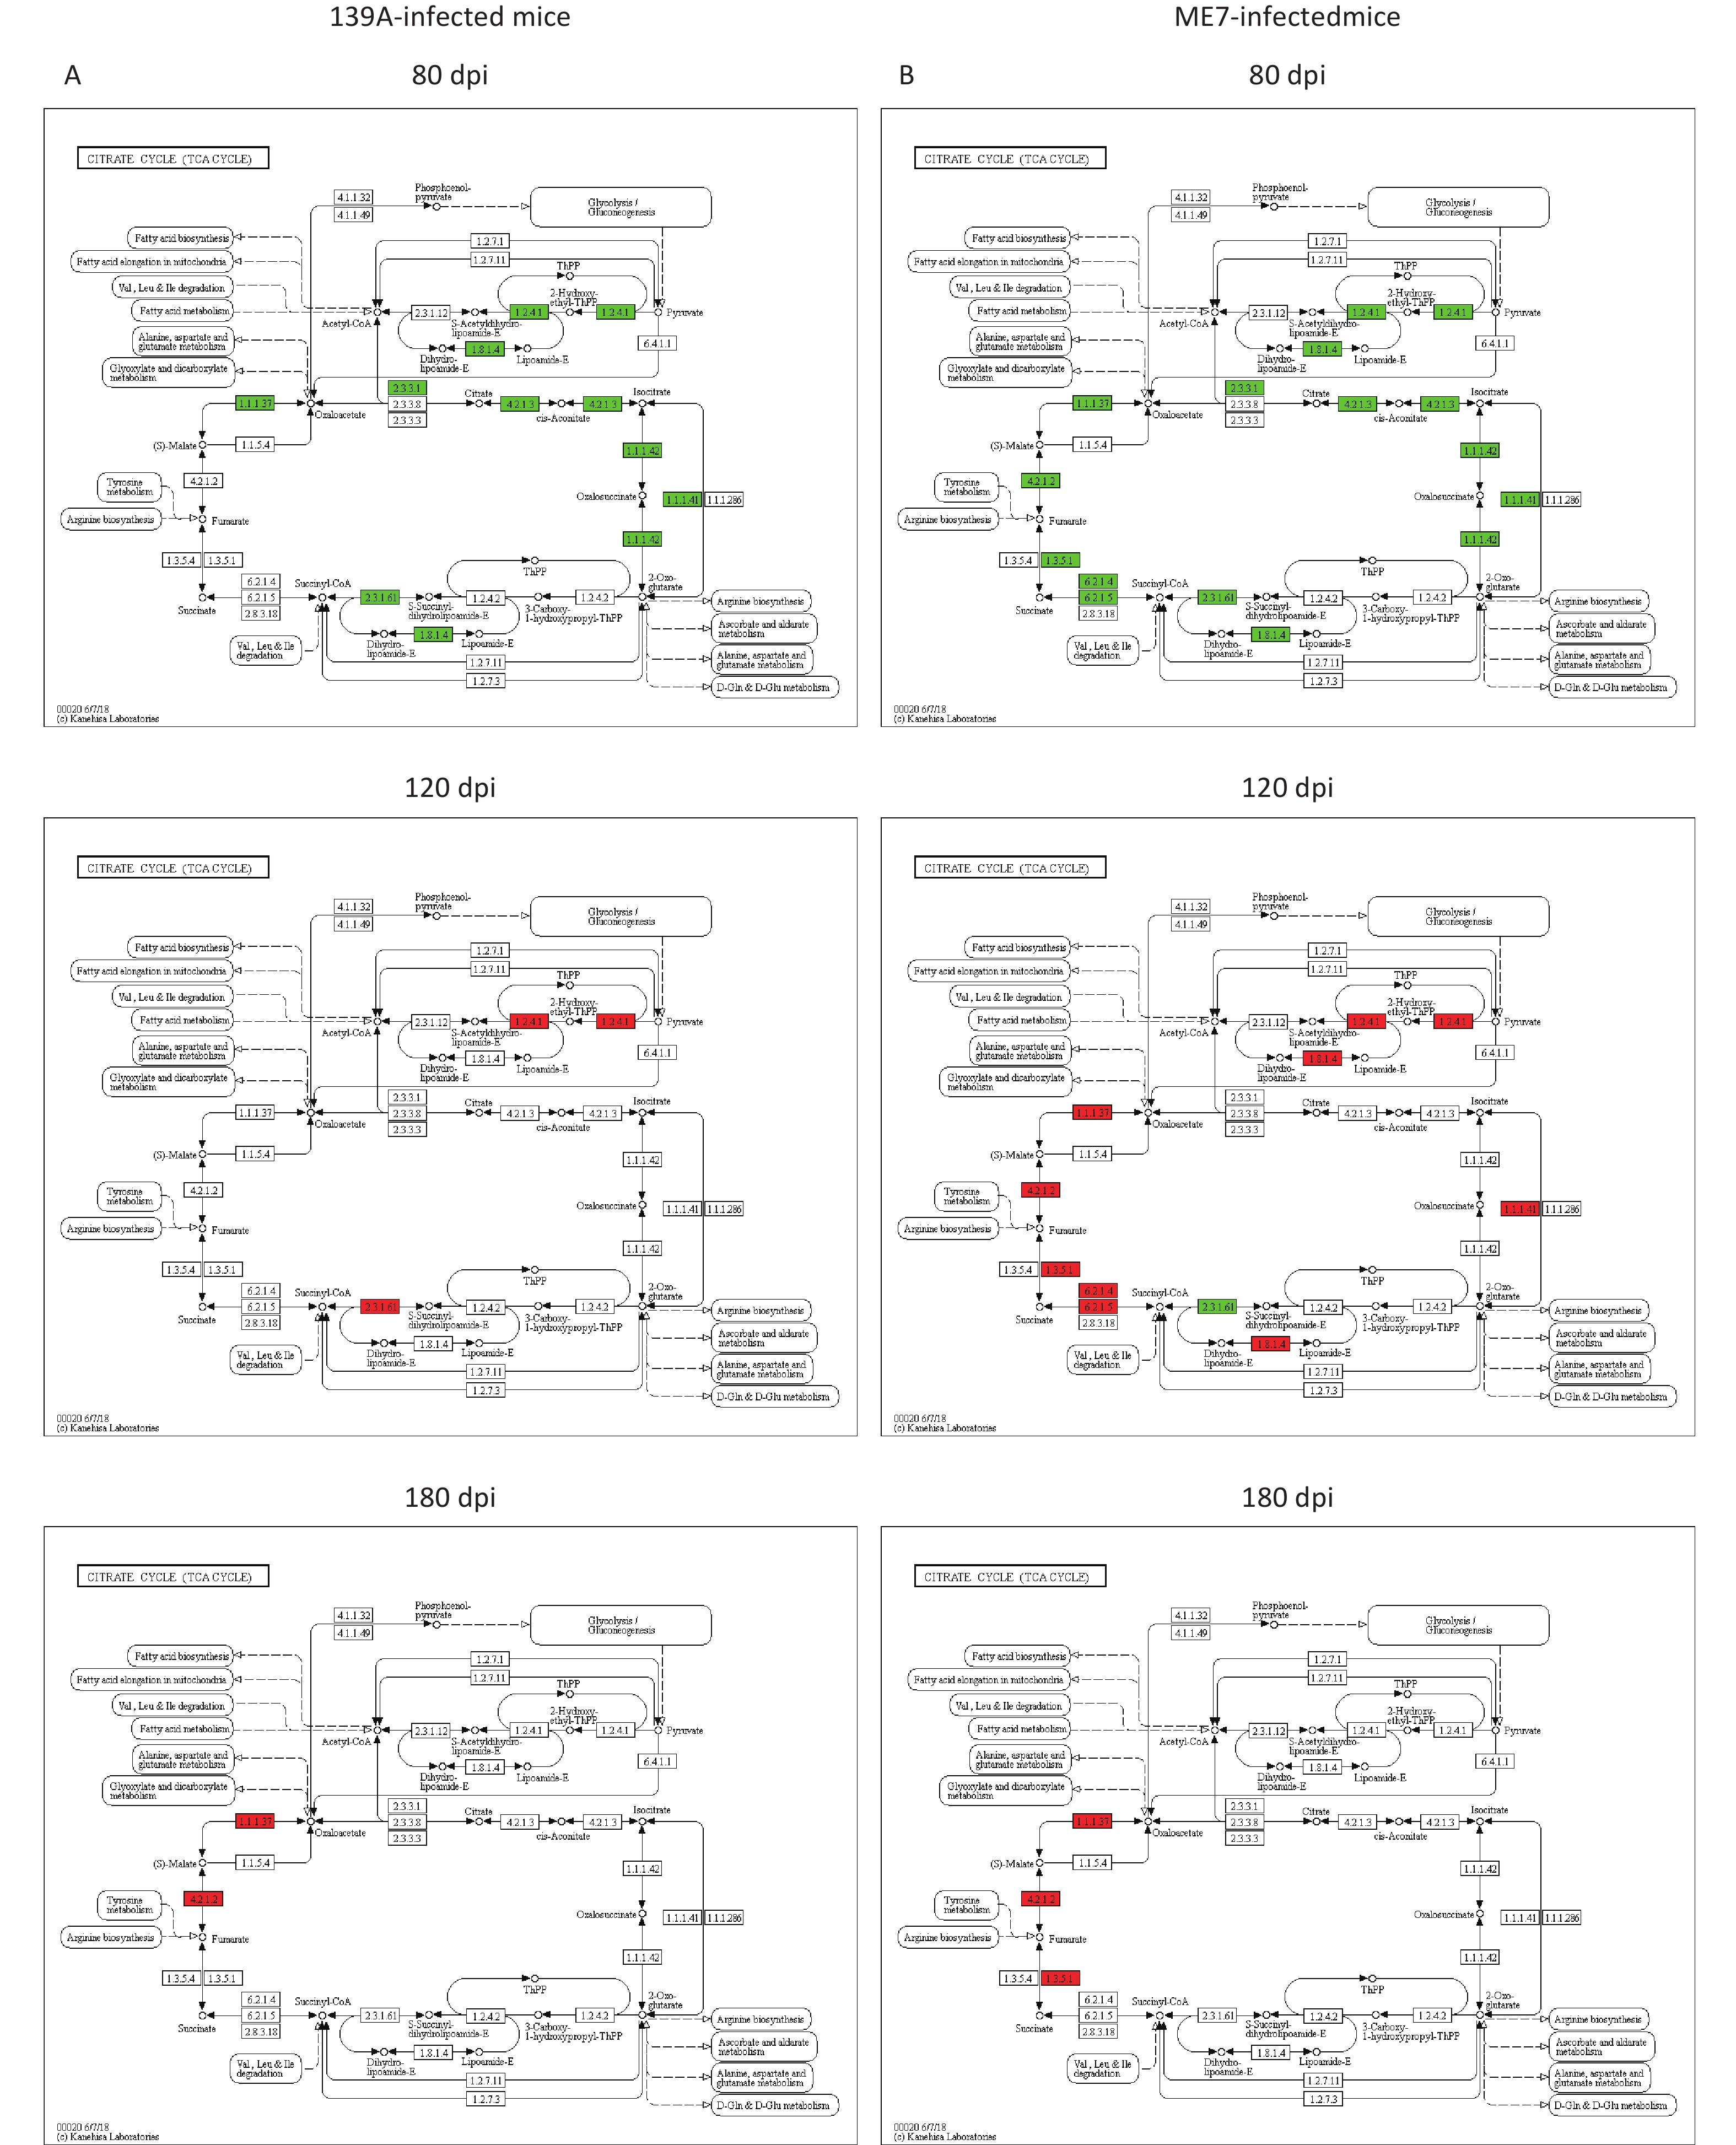
The potentially affected steps in the TCA cycle due to changes in the DEAPs in the brain tissues at different time points during prion infection were evaluated. Dozens of steps in the TCA cycle were affected via negatively regulated acetylation for relevant enzymes in the 80 dpi samples (left panels in Figure 5A and 5B). Many steps were also affected in the 120 dpi samples via the up-regulated acetylation for the enzymes, particularly in ME7-infected mice (middle panels in Figure 5A and 5B). In the 180 dpi samples, the affected steps focused on the processes from succinate to fumarate, fumarate to malate, and malate to oxaloacetate via positively regulated acetylation for succinate dehydrogenase, fumarate hydratase, and malate dehydrogenase (right panels in Figure 5A and 5B). Thus, the activity of the TCA cycle in the context of the whole brain is strongly influenced by deacetylation in the early stage and by acetylation in the mid-late and late stages during prion infection.
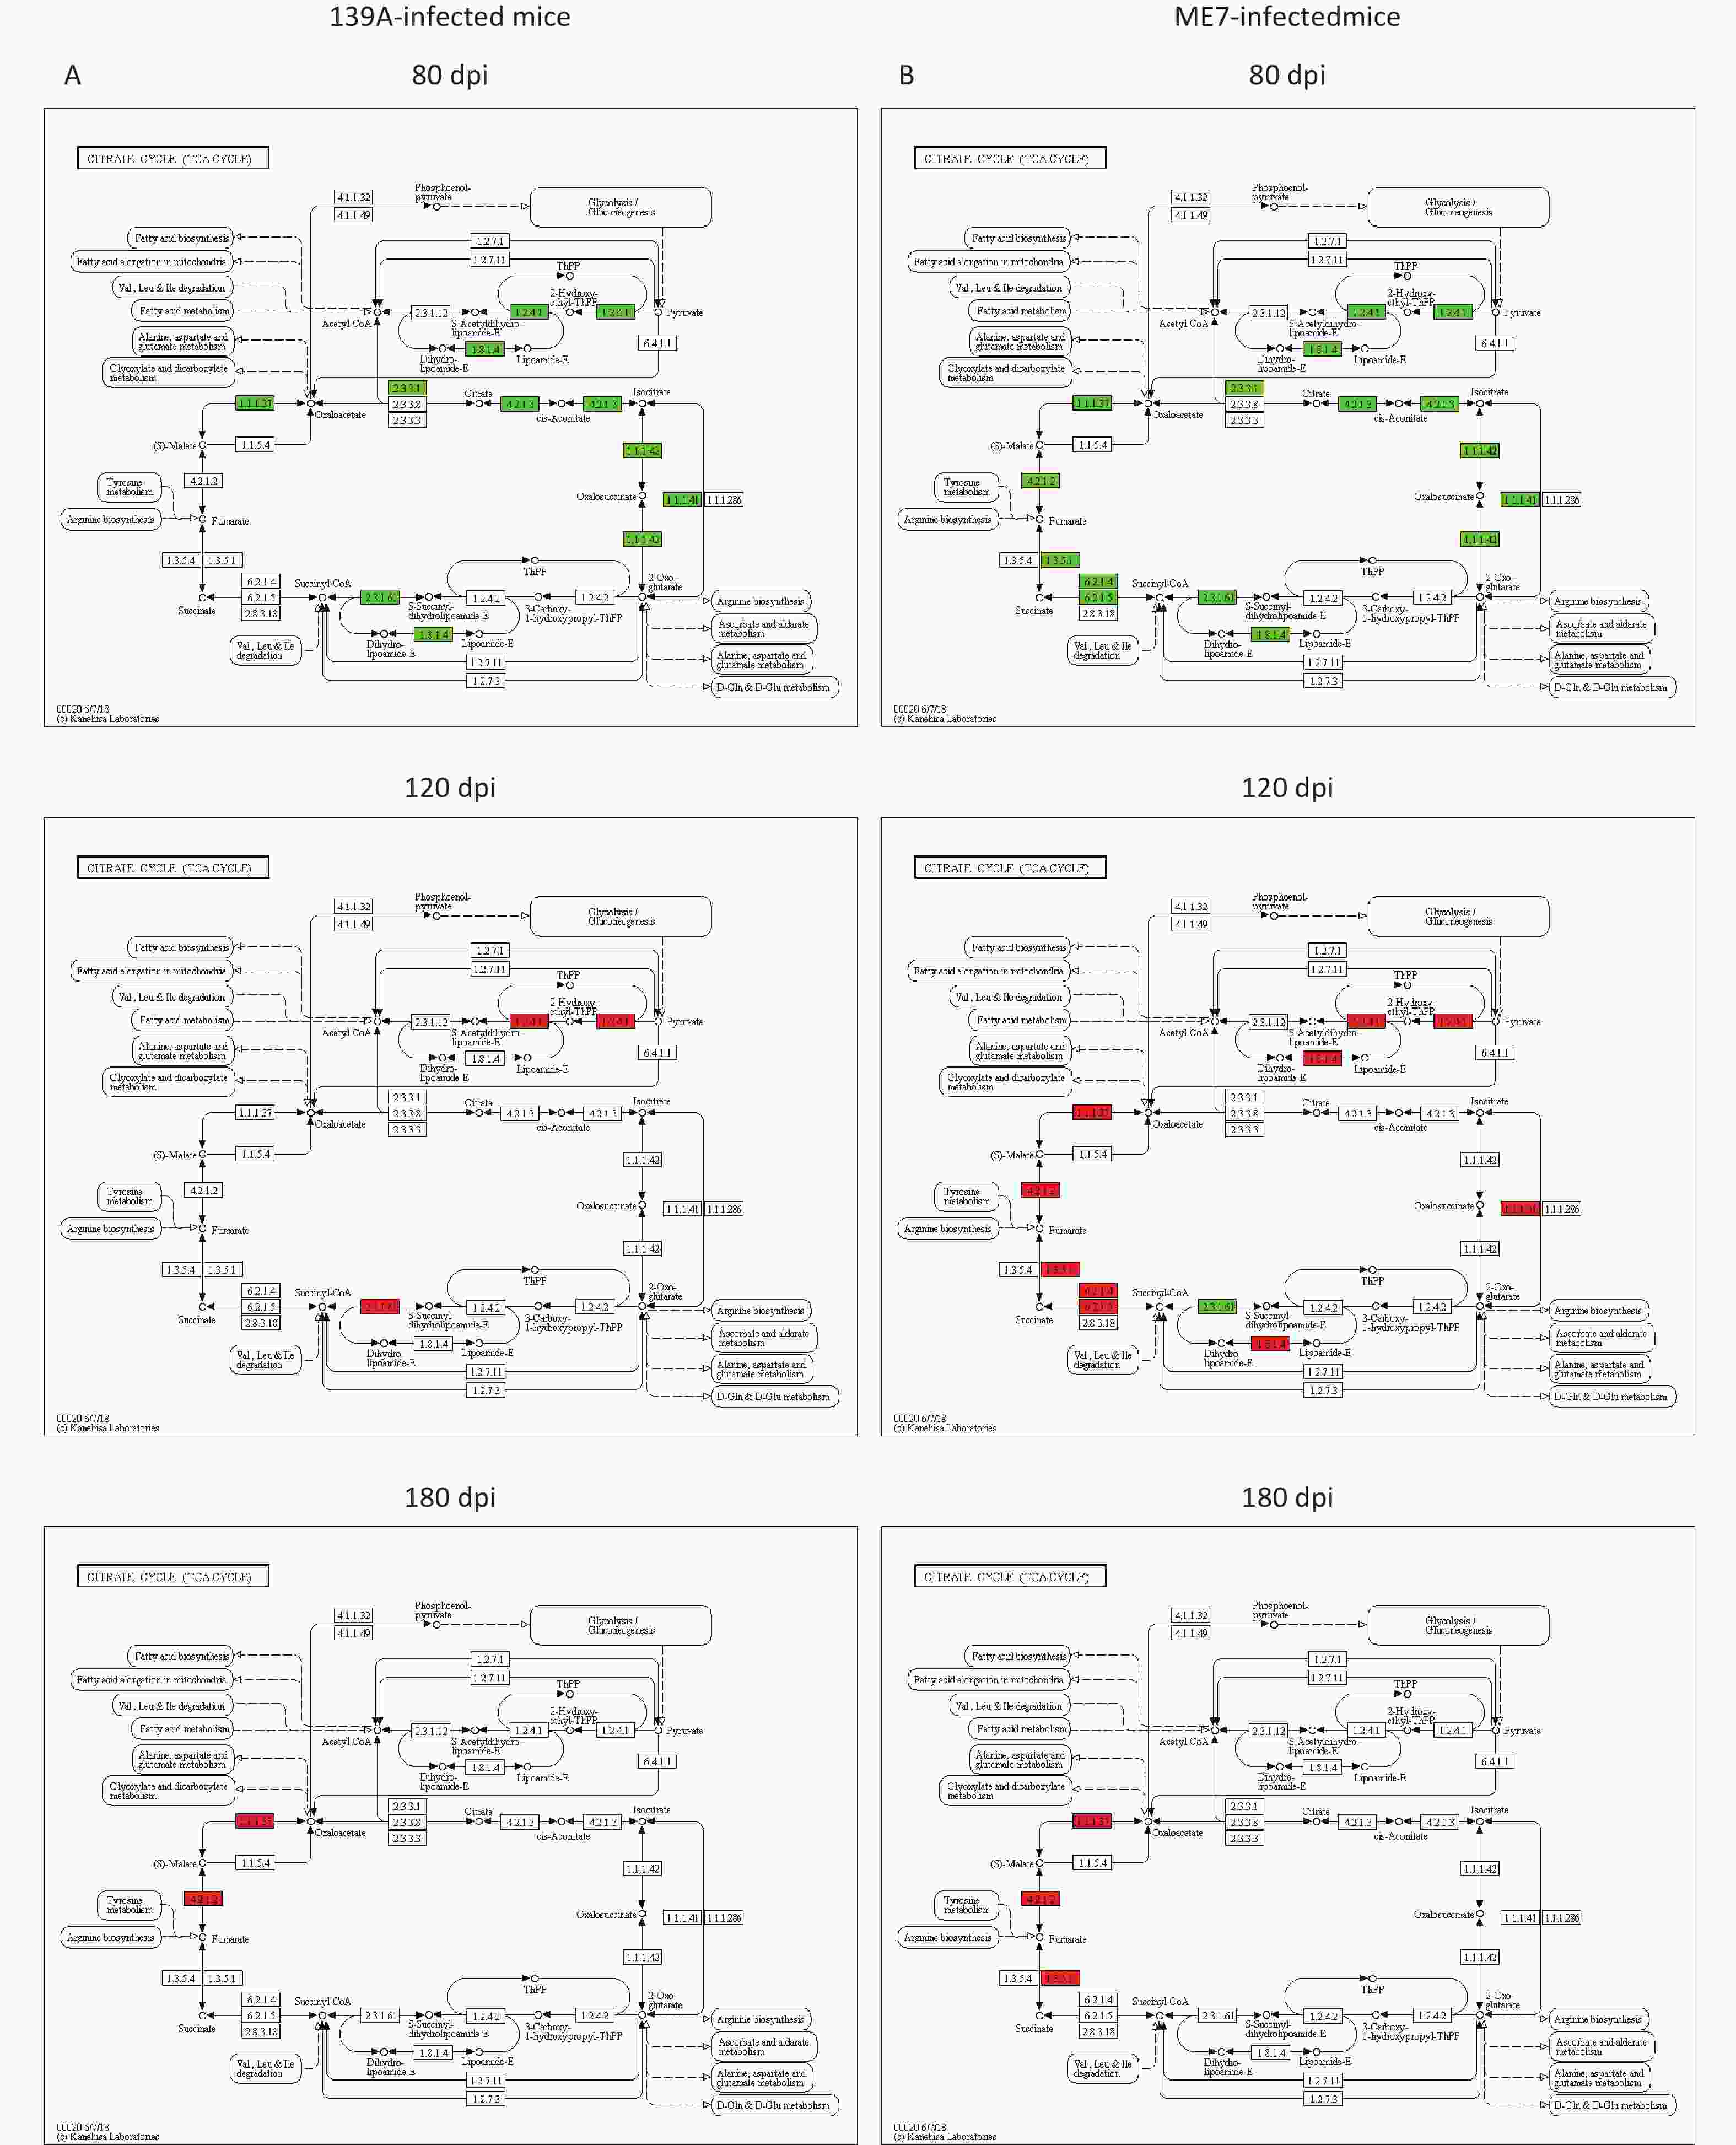
Figure 5. Analysis of up- or down-regulated acetylated proteins (enzymes) and catalytic steps in the pathway of the TCA cycle in the brains of 139A- and ME7-infected mice collected at mid-early, mid-late, and terminal stages. (A) 139A-infected mice (B) ME7-infected mice. Down-regulated acetylated enzymes are marked in green, and up-regulated ones are marked in red.
-
In this study, we screened the global acetylation situations of the brain proteins of two scrapie-infected mouse models at the mid-early, mid-late, and terminal stages using an advanced proteomic technique. The potential involved in biological functions and pathways due to alterations in protein acetylation were analyzed. A total of 1,485 acetylated peptides in the brain tissues of the mouse have been identified, and hundreds of them showed differential expression, with either a 1.5-fold increase or decrease at various time points during scrapie infection. To our knowledge, this research is the first comprehensive description of the global protein acetylation in brain tissues during prion infection.
Two scrapie-infected mouse models showed similar alterative patterns of the global acetylating profiles of the whole brain proteins during infection despite the difference in the numbers of DEAPs. In the brains at the mid-early stage (80 dpi), markedly higher numbers of DEAPs were observed, and the absolute majority displayed down-regulation. In the mid-late (120 dpi) and terminal (180 dpi) stages, the numbers of DEAPs were reduced, and large portions of them were up-regulated. The alterative tendencies of the brain protein acetylated profiles during prion infection were completely different from the changes in the global profiles of brain proteins from the two scrapie-infected mouse models [8]. In the proteomic study, considerably more DEPs were observed in the terminal stage samples (180 dpi) than in the mid-late stage (80 dpi) [8]. This result implies that brain protein acetylation situations are reversible during prion infection because more DEAPs were markedly observed in the mid-early (80 dpi) and close to normal in the mid-late (120 dpi) and terminal (180 dpi) stages.
The majority of DEAPs during prion infection are involved in the enzymatic proteins participating in various metabolism activities. The analyses of the involved KEGG pathways also revealed the same feature. Large portions of the involved pathways are associated with the metabolism, e.g., carbon metabolism, metabolic pathways, glyoxylate and dicarboxylate metabolism, pyruvate metabolism, TCA cycle, etc. However, in the assays of global brain proteomics for 139A- and ME7-infected mice [8] and for different subtypes of human prion diseases [6], the most frequently involved pathways are the ones related to inflammation, e.g., complement and coagulation cascades, Staphylococcus aureus infection, Chagas disease (American trypanosomiasis), Leishmaniasis, systemic lupus erythematosus, etc., in which up-regulation of some complement components (C1q, C2, C3, and C4) are commonly addressed. The diversity of the involved pathways addressed by two types of proteomic assays reflects two different aspects of the whole proteins in the brains infected with prions.
Mitochondria are the sites of oxidative metabolism in eukaryotes, where sugars, fats, and amino acids eventually oxidize and release energy [26]. Our data here revealed that approximately 1/3 of identified acetylated peptides were marked as mitochondrial OS, and more than 40% of mitochondrial associated acetylated peptides were DEAPs. Despite the difference in the numbers of DEAPs, the two scrapie-infected mouse models showed similar alterative patterns of mitochondrial associated DEAPs during infection; that is, the vast majority of down-regulated DEAPs were in the mid-early stage, but more ratios of up-regulated DEAPs were recorded in the mid-late and terminal stages. Moreover, the overwhelming majority of the identified brain mitochondrial associated DEAPs in the two scrapie mouse models revealed the same change tendency during the infection. The mitochondrial associated DEAPs subsequently induced significant changes in a series of pathways. Six significantly changed pathways identified in all tested samples contained the processes within mitochondria. Notably, the brain mitochondrial functions were influenced by protein deacetylation (in the early and mid-early stages) and acetylation (in the mid-late and terminal stages) during prion infection.
The TCA cycle is an essential metabolic pathway in aerobic organisms. It is the final metabolic pathway of the three major nutrients and the junction of the metabolism of sugars, lipids, and amino acids [27]. The TCA cycle occurs within the matrix of the mitochondrion, which contains eight enzymatic steps, including those for citrate synthase, aconitate hydratase, isocitrate dehydrogenase, oxoglutarate dehydrogenase, succinate--CoA ligase, succinate dehydrogenase, fumarate hydratase, and malate dehydrogenase [28]. In the mid-early stage, all eight enzymes were deacetylated. However, in the mid-late stage, six enzymes (isocitrate dehydrogenase, oxoglutarate dehydrogenase, succinate--CoA ligase, succinate dehydrogenase, fumarate hydratase, and malate dehydrogenase) in the sample of ME7-infected mice and one (oxoglutarate dehydrogenase) in 139A-infected ones were significantly acetylated, and the rests were in normal levels. In the late stage, three enzymes (succinate dehydrogenase, fumarate hydratase, and malate dehydrogenase) in ME7-infected mice and two (fumarate hydratase and malate dehydrogenase) in 139A-infected ones are in the status of acetylation. The alteration and reversion of the acetylation and deacetylation of almost all enzymes in TCA cycle may reflect the changes in the activity of this pathway in the brains during prion infection. As the core process linked with the metabolism of carbohydrates, fats, and proteins [28, 29], changes in the TCA cycle will definitely affect the other metabolic pathways.
Although histone acetylation has played a critical role in chromatin remodeling for a long time[30-32], the functional roles of acetylation in the vast majority of thousands of non-histone proteins are still unclear. Advances in MS-based proteomics proposed a vast of acetylated proteins involved in metabolic pathways in eukaryotes and bacteria, such as glycolysis and the TCA cycle [16, 33]. By performing proteomic analysis of 48 phylogenetically distant bacteria, Choudhary and colleagues reported that lysine acetylation occurs in evolutionarily conserved lysine residues in catalytic sites of enzymes involved in central carbon metabolism and plays a direct role in metabolic regulation by switching off the enzyme activity [34]. ApoE-deficient C57Bl/6J mice exposed to low-dose-rate gamma radiation showed that the great majority of the hyperacetylated proteins are involved in the TCA cycle, fatty acid oxidation, oxidative stress response, and sirtuin pathway, which is associated with impairment of heart metabolism [35]. Although the direct evidence to support the association of enzymic acetylation with the functions of metabolic pathways in the brains of prion diseases is still lacking, the hyperacetylation of enzymes in the TCA cycle may be a negative regulator for enzymatic activity, and deacetylation may benefit the TCA cycle. Further assays addressing the association between acetylation status and enzymatic activity in metabolic pathways, e.g., TCA cycle, during prion infection are mostly deserved.
The process of protein acetylation and deacetylation is a reversible post-translation modification in regulating cellular function and response to external stimuli [15, 36]. The data here also illustrated the reversible alteration of brain protein acetylation during prion infection. However, the changes in protein acetylation in this study reflect the alteration in the context of whole brain tissues. Similar changing profiles were also observed in the brain levels of nitric oxide, nitric oxide synthase, and S-nitrosylation of several proteins, e.g., aquaporin-1, calcium/calmodulin-dependent protein kinase II, neurogranin, and opalin in several experimental scrapie-infected rodents [37]. The exact reason for the reversible alteration of brain protein acetylation during prion infection is unclear. One possibility is the association with the changes in deacetylases, such as the sirtuin pathway, in the brains during prion infection. Our previous studies have shown that in addition to marked declines of brain Sirt1 and Sirt3 at the terminal stage of different prion diseases; the brain level of Sirt1 in the scrapie agent 263K-infected hamsters maintained a high level in the early stage, dropped down in the mid-late stage, and continually decreased until the end stage [19]. Another possibility is related to the gradual appearance of neuropathological abnormalities, such as PrPSc deposit, astrogliosis, and activated microglia in the brain tissues. Our data here and in other previous studies [8, 38, 39] demonstrated that the amounts of PrPSc in the samples of the mid-early stage (80 dpi) were remarkably less than in those of samples from the mid-late (120 dpi) and end (180 dpi) stages of the two scrapie-infected mouse models. Meanwhile, significant increases in GFAP- and Iba1-signals were also detected since the mid-late stage. Notably, the marked neuropathological changes occurred since the mid-late stage. In such a case, we may assume that in the early stage of prion infection with less PrPSc deposit and reactive gliosis, the host brain can maintain biological functions to overcome the neurotoxicity produced by prion infection, at least partially, via deacetylation of enzymes associated with various metabolic pathways. Along with the increased PrPSc deposit and severe reactive inflammation in the CNS tissues in the late stage, the deacetylation process may be inhibited, for example, due to declined levels of the sirtuin pathway in the brain, which is likely to contribute to the impairment of mitochondrial function.
In addition, the evaluation of protein acetylation during prion infection in this study refers to the global changes in whole brain tissues that contain not only damaged neurons but also proliferative astrocytes and activated microglia. We cannot simply conclude whether such alteration is due to the accumulation of aggregated proteins or due to subsequently reactive inflammation. We were also unable to distinguish the defined changes in protein acetylation in damaged neurons, proliferative astrocytes, and activated microglia. These questions deserve further exploration.
-
In conclusion, our data here illustrated a view of the global acetylation for brain proteins during prion infection, showing remarkably inhibiting acetylation in the early stage and relatively enhanced acetylation in the late stage. In the late stage, the affected steps focused on up-regulated acetylation for succinate dehydrogenase, fumarate hydratase, and malate dehydrogenase. This finding possibly reflects the host (brain) response to external prions to overcome the neurotoxicity in the early stage and the impairment of metabolic and mitochondrial functions due to PrPSc deposit and reactive inflammation.
HTML
Ethics Approval
Brain Samples of Scrapie-infected Experimental Mice
Western Blot
Protein Extraction
Protein Digestion and Peptide Purification
Enrichment of Acetylated Peptides
Peptide Labeling and Identification of Mass Spectra
Statistical Analysis
Aberrant Alterations of PrPSc, GFAP, and Iba1 in the Brain Samples of 139A- and ME7-infected Mice Collected at Mid-early, Mid-late, and Terminal Stages
Global Acetylated Proteins Profiles of the Brain Samples of 139A- and ME7-infected Mice Collected at the Mid-early, Mid-late, and Terminal Stages
Profiles of DEAPs in Mitochondria of the Brain Samples of 139A- and ME7-infected Mice Collected at the Mid-early, Mid-late, and Terminal Stages
Involvement of Significant Pathways in the Brain Samples of 139A- and ME7-infected Mice Collected at the Mid-early, Mid-late, and Terminal Stages
Changes in the Involved DEAPs in the Citrate Cycle (TCA cycle) Pathway in the Brain Samples of 139A- and ME7-infected Mice Collected at the Mid-early, Mid-late, and Terminal Stages
 21413Supplementary Materials.pdf
|

|

 Quick Links
 DownLoad: