


-
Iodine deficiency can cause a spectrum of growth, developmental and functional morbidities across the life course, termed iodine deficiency disorders (IDD)[1,2]. IDDs are among the most widespread and threatening diseases worldwide and are globally distributed in geographic areas with iodine deficiency. Owing to iodine deficiency in the external environment, approximately 1.6 billion people were threatened by iodine deficiency worldwide, and more than 700 million people in China lived in iodine deficient areas in 1995 [3,4]. In the 1990s, the World Health Organization recommended universal salt iodization to eliminate IDD[5]. China began implementing universal salt iodization in 1995. By 2000, China had essentially achieved the goal of eliminating IDD at the national level. In 2010, 28 provinces in China had achieved the goal of eliminating IDD, and Tibet, Qinghai and Xinjiang had essentially achieved the goal of IDD elimination. In 2019, 97.8% of counties nationwide had achieved the goal of eliminating IDD[6].
The prevention and control of IDD in China has unique characteristics. First, areas of water-borne iodine excess exist in China[4], to which non-iodized salt has been supplied. Because iodine-excess areas are randomly distributed, and each spot is at village level, problems exist, such as mutual interference between non-iodized salt and iodized salt supplementation in iodine-excess areas and surrounding areas. Second, in 2012, China implemented a new standard for iodine content in edible salt[4], in which each province can choose one or two levels of salt iodine (SI) content. However, problems arose regarding the mixed supply of salt with differing iodine content. Finally, since the reform of the salt industry system, the surveillance and management of iodized salt and non-iodized salt in the market has loosened, thus potentially increasing the possibility of IDD occurrence. A decline in IDD prevention has occurred in many developed countries, such as the United States, Australia and New Zealand[7-10]. Overall, owing to the complex water iodine distribution, the iodized salt supply and the salt industry reform, the spatiotemporal distribution of IDD status in China must be clearly described and analyzed. However, no corresponding research on these issues has been performed.
Time series and spatial epidemiology analyses are effective methods that reveal the temporal and spatial characteristics of diseases and have been widely used to predict disease trends and provide clues for early prevention and control measures. Spatial epidemiological methods are mainly used to explore the geographical distribution of infectious diseases or pathogenic factors. Relevant studies include regional spatial autocorrelation studies of endemic fluorosis[11,12] and a spatial ecology study of Keshan disease and hair selenium[13,14]; however, these methods have not been widely used in the study of IDD.
China systematically performs IDD surveillance nationally, with a large sample size, long time period, and many surveillance indexes[15]. Since 1995, China has performed IDD surveillance and iodized salt surveillance every 2 to 3 years. The monitoring indexes include the coverage rate of iodized salt (CRIS), qualified rate of iodized salt (RQIS), consumption rate of qualified iodized salt (CRQIS), mean iodine content in salt (MIS), standard deviation (SD) of SI, coefficient of variation (CV) of SI, median urinary iodine concentration (MUI) in children, MUI in pregnant women and goiter rate (GR) in children[15]. Although IDD monitoring in China has been long lasting and extensive, the spatiotemporal distribution characteristics are not adequately recognized. As described above, the spatial distribution of survey indicators has value in IDD prevention. Hotspots of CRIS, RQIS and CRQIS can indicate areas with achievable iodized salt supplementation; hotspots of MIS, SD, and CV reflect the homogeneity of salt iodization, which depends on the equipment and technology of the salt plant; hotspots of GR describe areas at risk of IDD prevalence; and hotspots of urinary iodine (UI) indicate the status of population iodine nutrition control. Assessing these characteristics would be meaningful and useful to guide IDD prevention and control measures.
In this study, time series and spatial epidemiology analyses were used to analyze the IDD surveillance indexes (including salt, MUI and goiter rate). The aims of this work were: 1) to use time series analysis to analyze the trends in iodine nutritional status and disease at the national and provincial levels since 1995, and to predict future development, and 2) to use spatial epidemiological methods to analyze the spatial distribution of SI, CRIS, CRQIS and GR in regions of China with different water-iodine levels, to guide reform of the salt industry, and to determine whether spatial clustering exists, and if so, what the clustering type might be. This study should provide useful information for adjusting measures according to local conditions, and formulating guidance for scientific iodine supplementation in different populations and individuals.
-
IDD surveillance in China can be divided into two stages: a parallel phase of iodized salt surveillance and IDD surveillance before 2016, and a combined phase of IDD surveillance (incorporating SI surveillance) after 2016.
For the parallel phase before 2016, IDD surveillance was performed from 1995 to 2014 at the province level. A total of 30 sampling units from counties in each province were sampled according to the population proportion sampling method. One primary school was selected from each sampling unit through a simple random sampling method, and 40 students 8–10 years of age were randomly selected from the selected primary school. Their thyroid volume and UI were measured, and the SI was determined. If the quantity of students was insufficient, students from neighboring townships were included. Iodized salt surveillance was performed in the same period. In non-high-iodine counties, each county was divided into five sampling areas—east, west, south, north and middle—and one township was randomly selected in each area. In counties with five or fewer townships, all townships were selected. In each township, four villages were randomly selected. In each village, 15 households were randomly selected for salt sampling. If counties were in iodine-excess areas, they were divided into two areas: iodine-excess areas and other areas, and then the edible salt of the residents in other areas was sampled according to the above sampling method.
For the combined survey phase after 2016, all counties were surveyed. The sampling method for primary schools was the same as before. However, a total of 40 children 8–10 years of age were randomly selected from the local primary schools in each sampling unit (township). The urine samples of the children were collected to detect UI, and the thyroid volume in children was measured with B-ultrasound to calculate the GR.
-
The provincial CRIS and CRQIS data were from the National Iodized Salt Surveillance 2002–2015, which covers all counties (except iodine-excess areas) in all 31 provinces, and from the IDD survey in 2016–2018. The provincial MUI and GR data for children 8–10 years old were from 1995, 1997, 1999, 2002, 2005, 2011 and 2014 (phase I), and 2016 and 2017 (phase II) IDD surveys, which covered all 31 provinces. The county-level CRIS, CRQIS, RQIS, MIS, SD and CV of SI data were from the IDD survey in 2016 (2,792 counties), 2017 (2,321 counties) and 2018 (2,885 counties). Because of the transition period of the IDD surveillance plan implementation, the number of counties differed from 2016 to 2018.
-
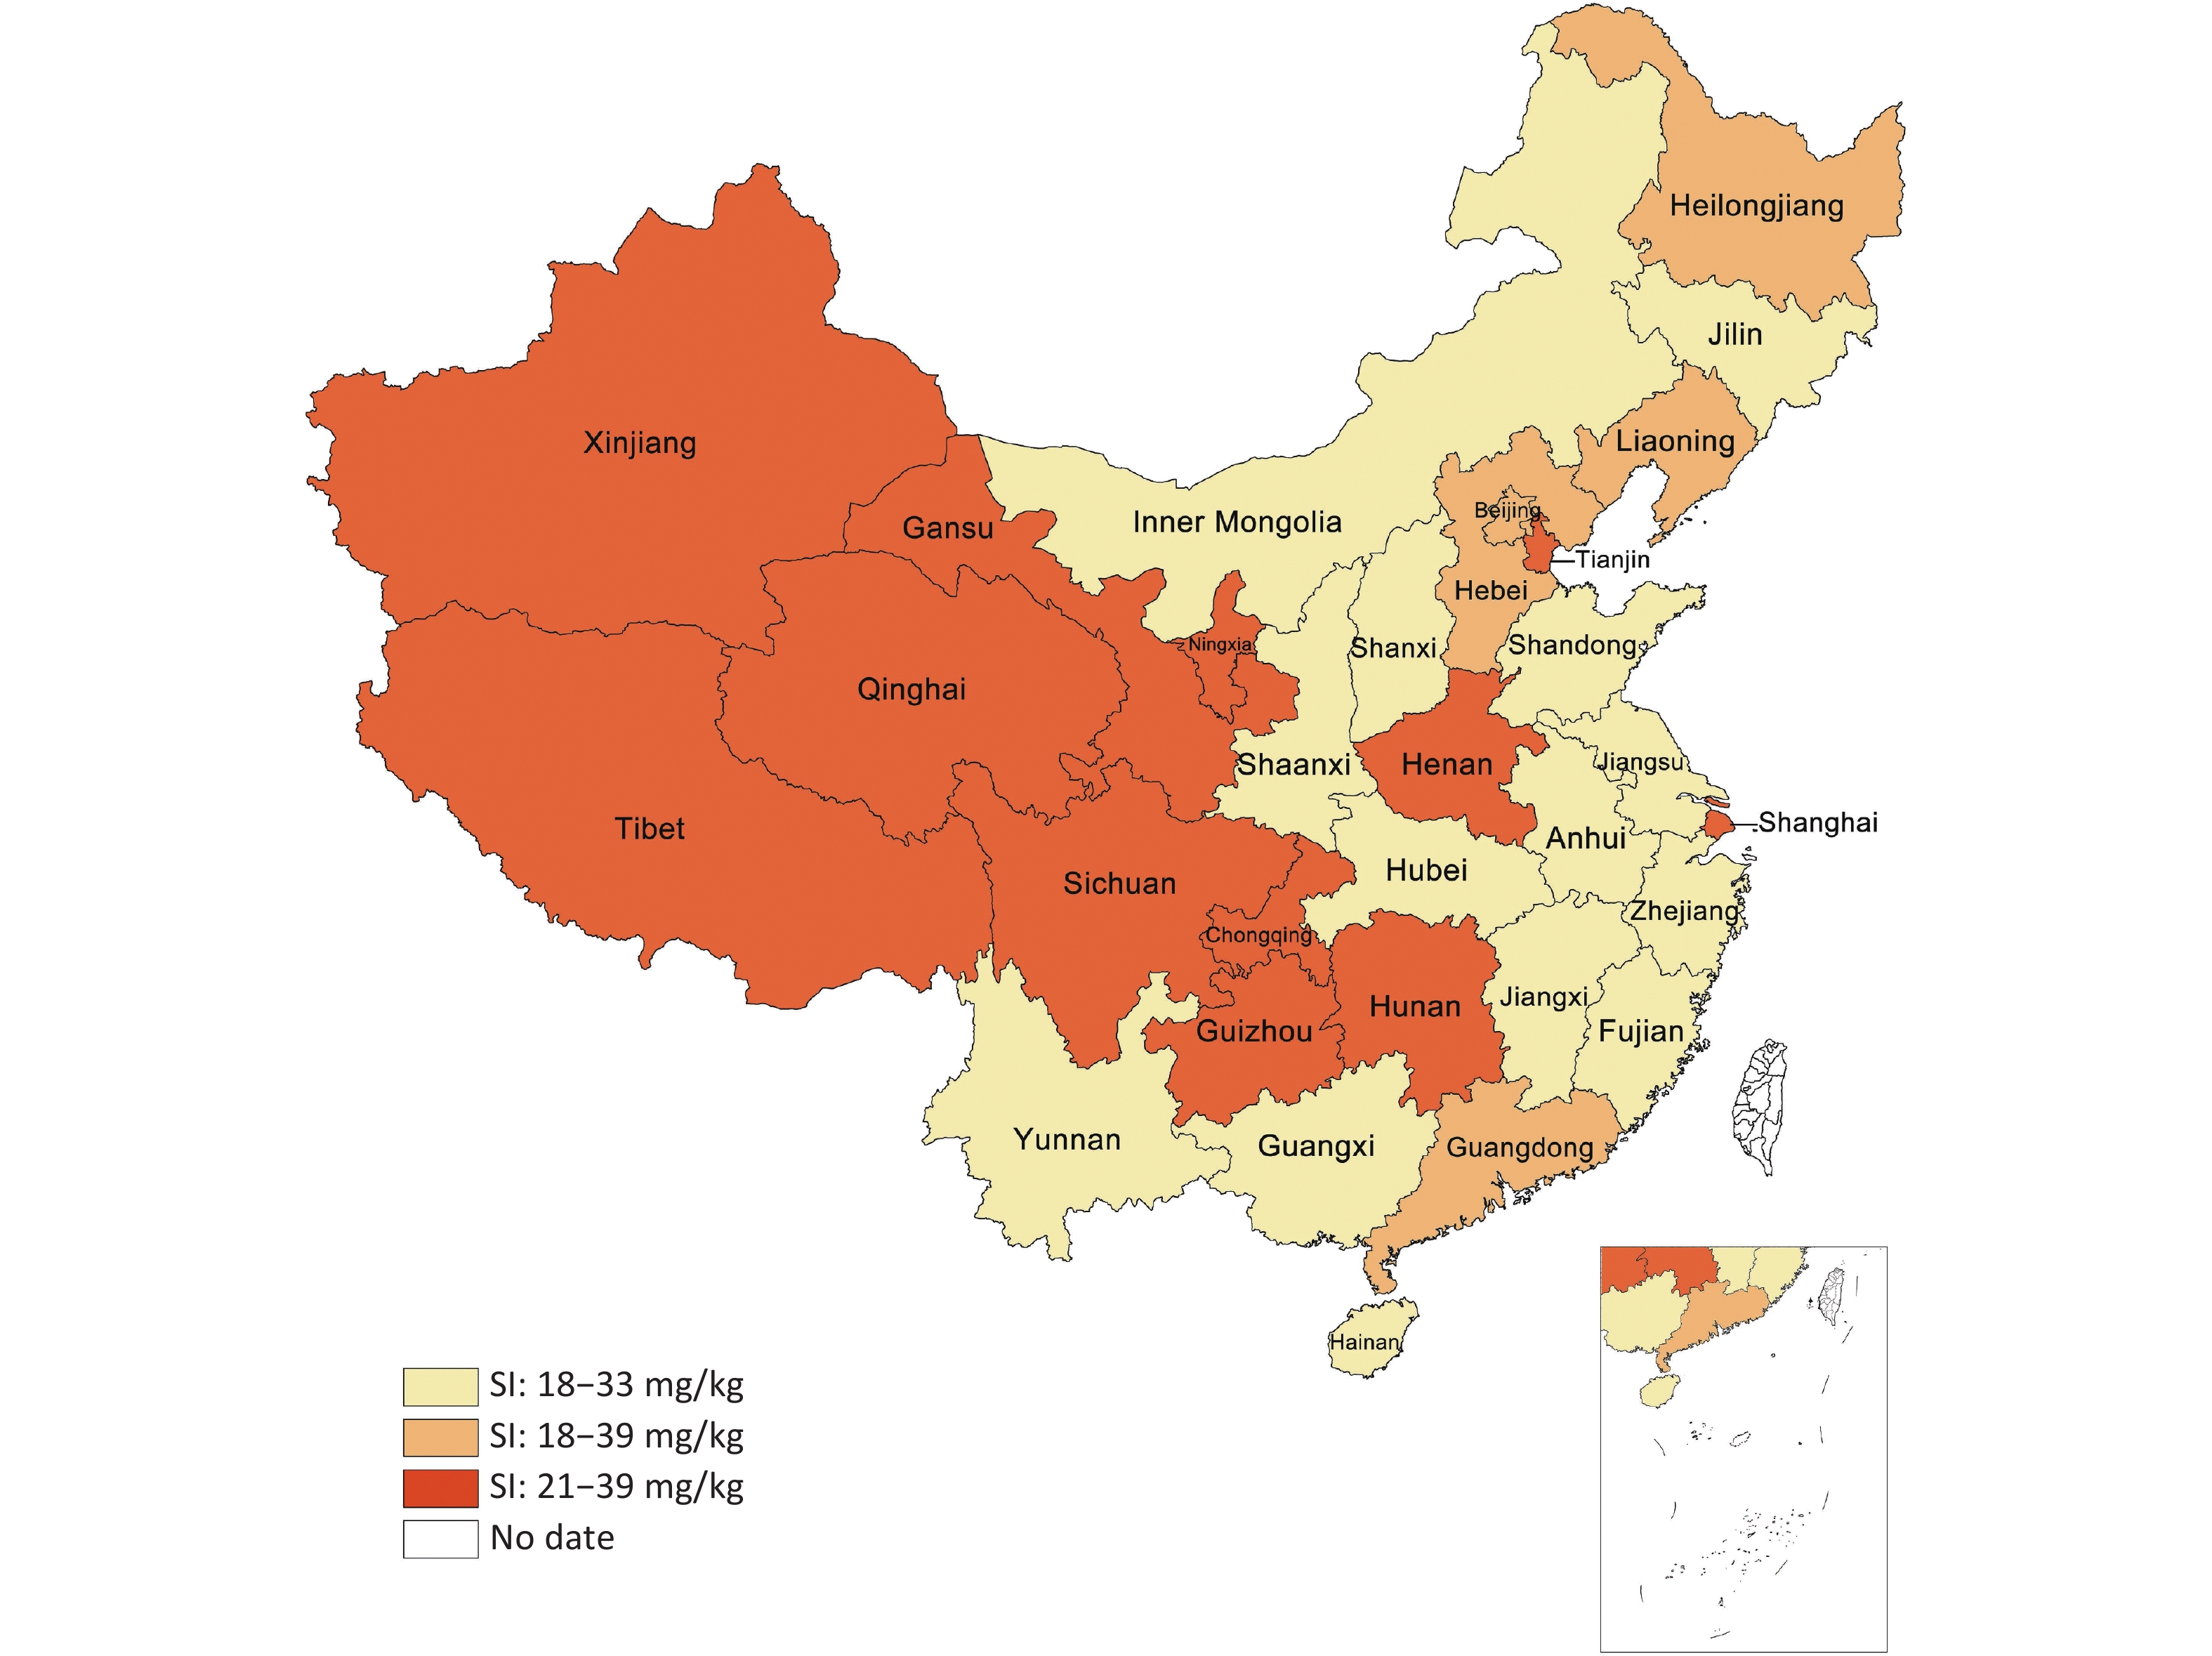
MUI was used to evaluate iodine nutrition levels at the population level. The MUI for children 8–10 years of age was classified as deficient below 100 μg/L, sufficient at 100–299 μg/L and excessive above 300 μg/L[16]. The thyroid volume in children was detected by ultrasound, and the presence or absence of goiter was assessed. The standard for goiter was > 4.5 mL for children 8 years old, > 5.0 mL for children 9 years old and > 6.0 mL for children 10 years old[17]. SI < 5 mg/kg was categorized as non-iodized salt. In China, the standard iodine content in iodized salt was chosen by each province from three levels (Supplementary Figure S1, available in www.besjournal.com): 18–33 mg/kg (in 14 provinces: Shaanxi, Hainan, Hubei, Guangxi, Jiangxi, Anhui, Yunnan, Shanxi, Jiangsu, Fujian, Inner Mongolia, Shandong, Zhejiang, and Jilin); 21–39 mg/kg (in 12 provinces: Sichuan, Gansu, Guizhou, Xinjiang, Qinghai, Hunan, Chongqing, Henan, Ningxia, Tibet, Tianjin, and Shanghai); and 18–39 mg/kg for edible salt for the general population and 21–39 mg/kg for pregnant individuals (5 provinces including Heilongjiang, Liaoning, Hebei, Beijing, and Guangdong)[18].

Figure S1. The concentration standard of Iodized salt in China.
-
Statistical analyses were performed in SPSS 17.0 (IBM Corp., Armonk, NY, USA). The time series analysis module was used for data processing and analysis to describe the CRIS and CRQIS from 2002 to 2018, and the MUI and GR from 1995 to 2018. An exponential smoothing model and ARIMA model were selected to describe the trends in IDD surveillance indicators and to predict the corresponding indicators for the year 2018. The model’s predicted values and the observed values in 2018 were compared to verify the results of the Bland-Altman plots, and the percentage errors were used to analyze the agreement between the actual value and the predicted value[19,20]. Finally, the models were used to predict the corresponding indicators for the years 2019–2020. Spatial analysis of the SI was performed with ArcGIS (version 10.2; Esri, Redlands, CA, USA). For global and local spatial autocorrelation, the parameters were set as follows: "conceptualization of spatial relationships" was set as "inverse distance"; "distance method" was set as "euclidean"; "standardization" was set as "false"; and other parameters were set to the default. Moran’s I was used for evaluating the global spatial autocorrelation. The overall spatial distribution characteristic of the SI was analyzed to determine whether spatial clustering existed. Moran’s I > 0 indicated a positive spatial correlation, with larger values indicating clearer spatial correlation. Moran’s I < 0 indicated a negative spatial correlation, with smaller values indicating a greater spatial difference. Otherwise, Moran’s I = 0 indicated that the data were randomly distributed in space. Getis-Ord Gi* was used for local spatial autocorrelation to describe the correlation between SI levels in the county and its neighboring counties, and explore and compare the type of spatial clustering to identify any differences in spatial clustering in 2016, 2017, and 2018. Blue areas are low-value areas, i.e., "cold spots"; red areas are high-value areas, i.e., "hot spots"; and white areas indicate no agglomeration[21,22].
-
The study protocol was approved by the Ethical Committee Review Board of Harbin Medical University. Written informed consent was obtained from all the participants included in the study.
-
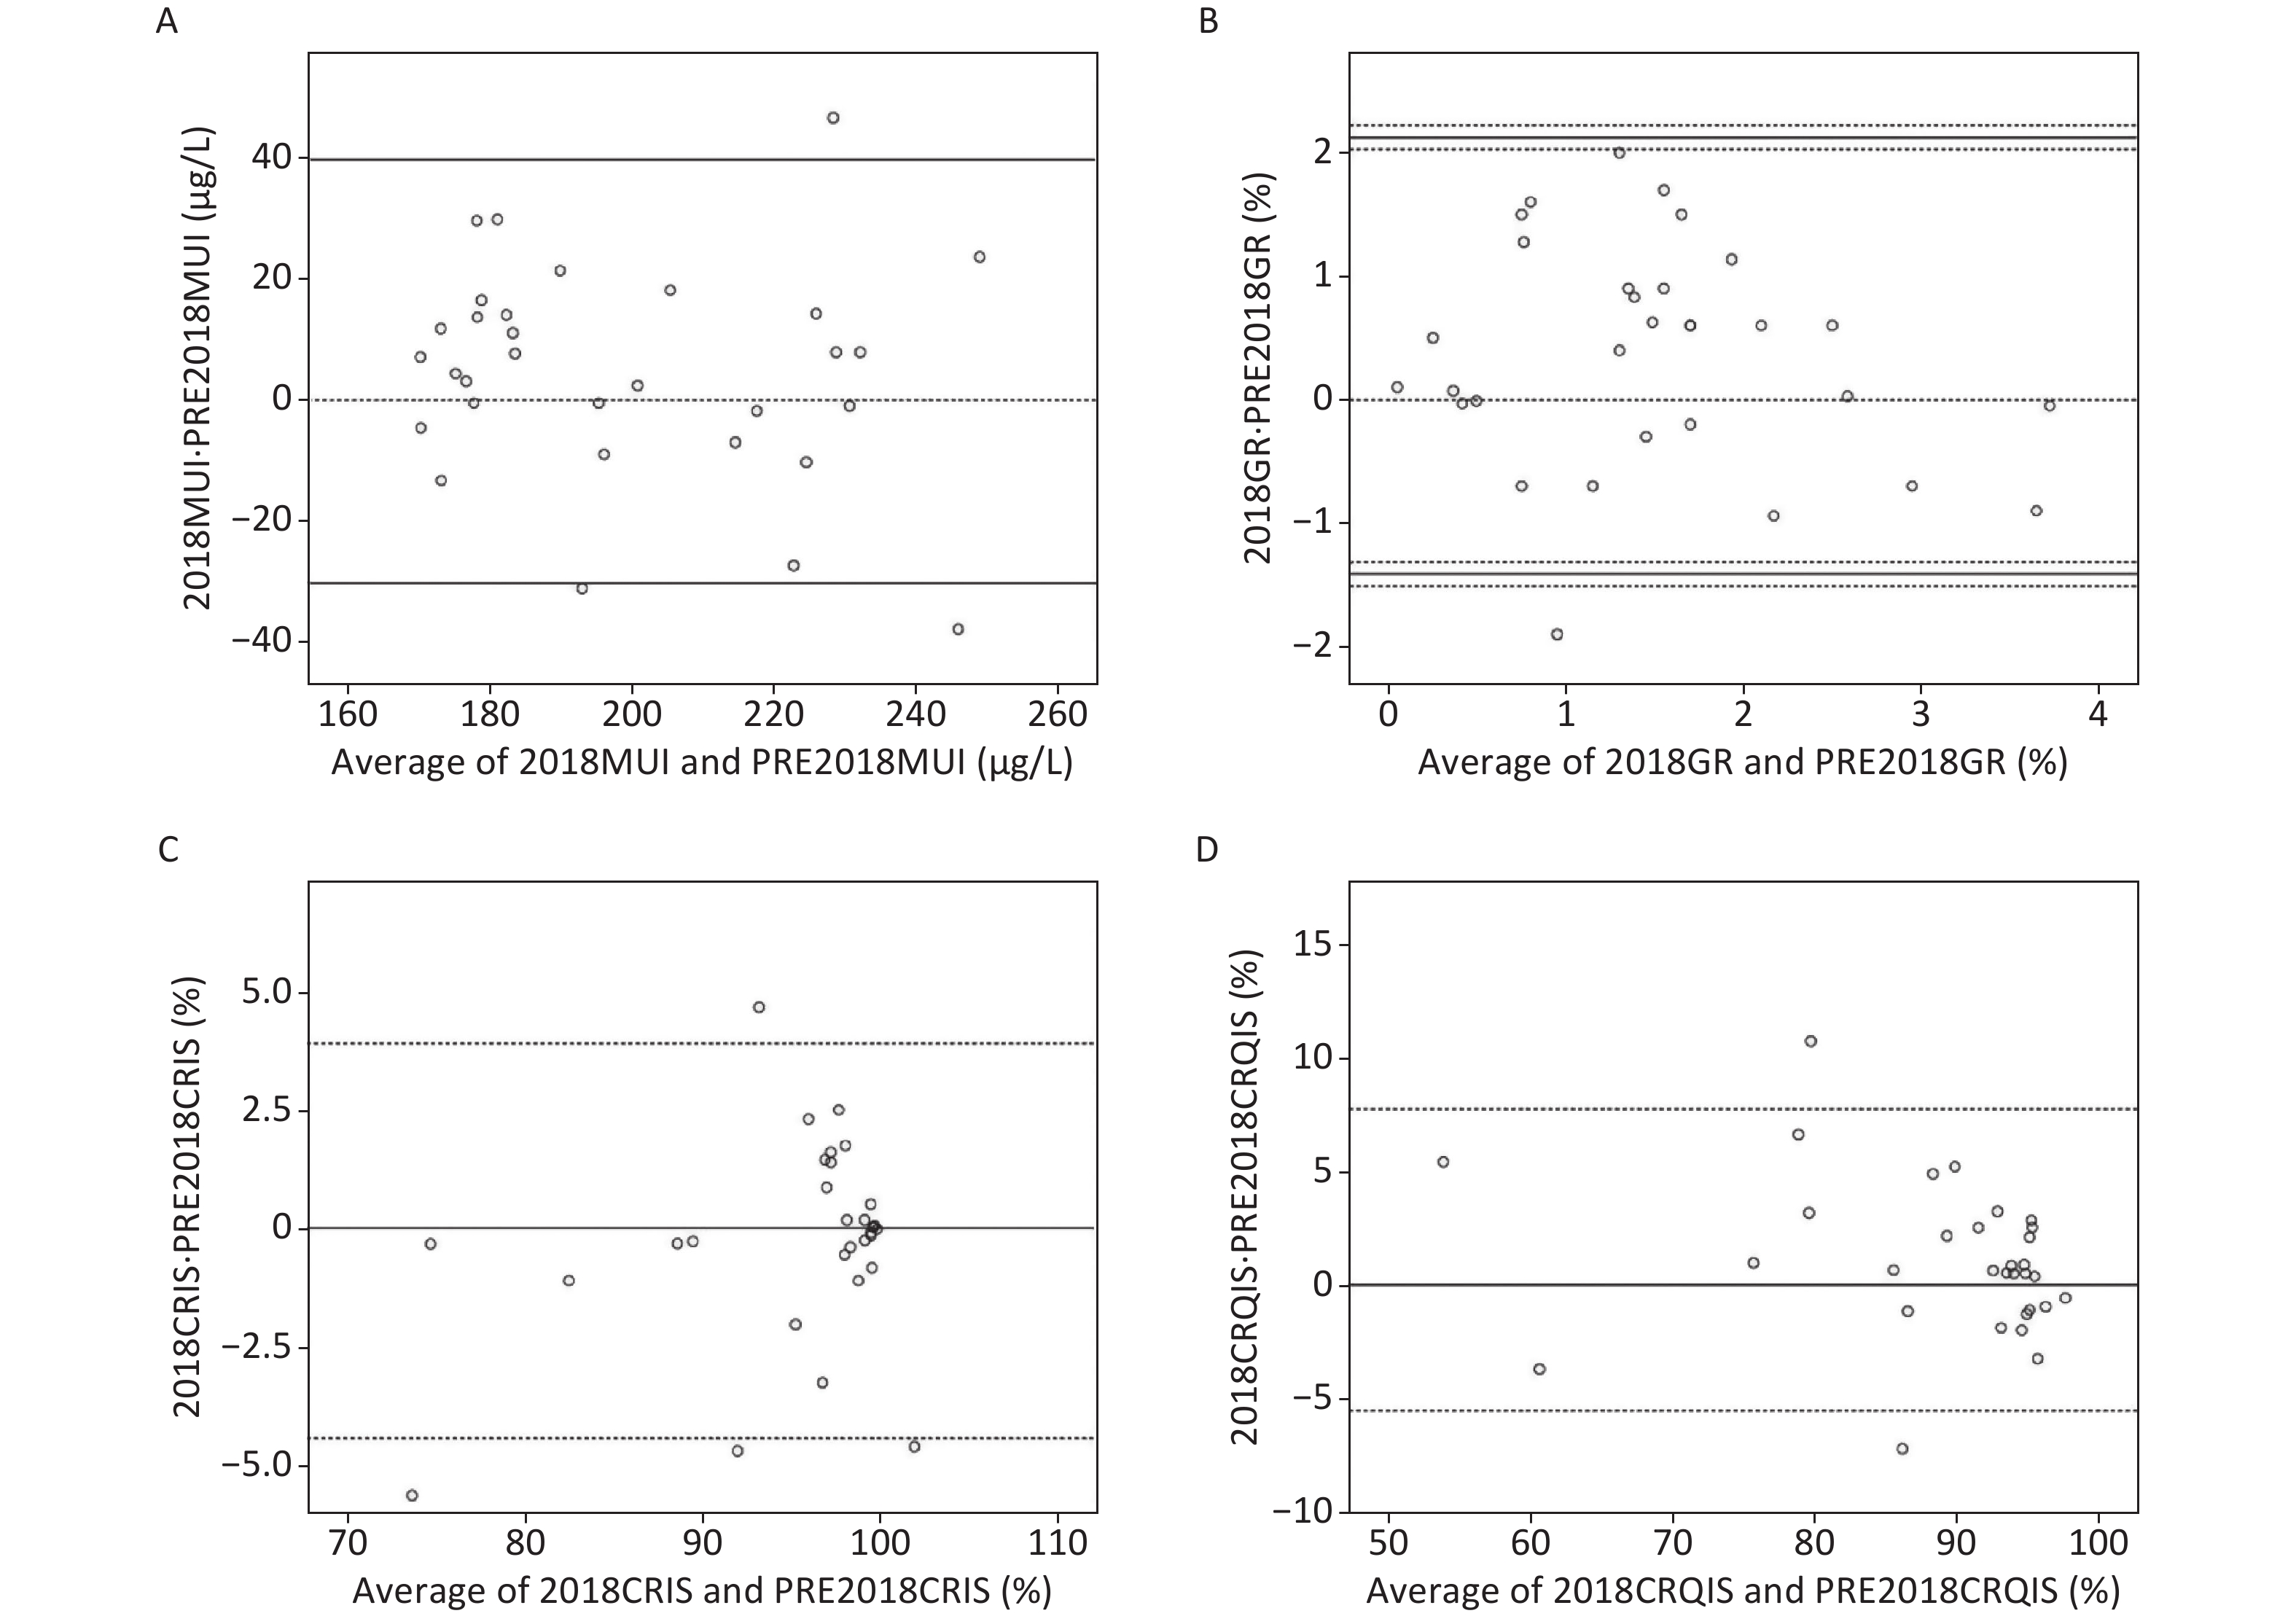
Bland-Altman analysis revealed a satisfactory result: the actual MUI, GR, CRIS and CRQIS values in 2018 were within 95% CI of the predicted values (Supplementary Table S1, available in www.besjournal.com). In Bland-Altman analysis, the actual value and the predicted value were in good agreement for all parameters (Supplementary Figure S2, available in www.besjournal.com).
Index Bland-Altman 95% CI Outiler percentage (%) Exact percentage (%) MUI (μg/L) −30.32 39.80 9.68 9.68 GR (%) −1.32 2.03 6.45 12.90 GRIS (%) −4.44 3.90 12.90 12.90 CRQIS (%) −5.54 7.75 6.45 0 Table S1. Bland-Altman analysis result
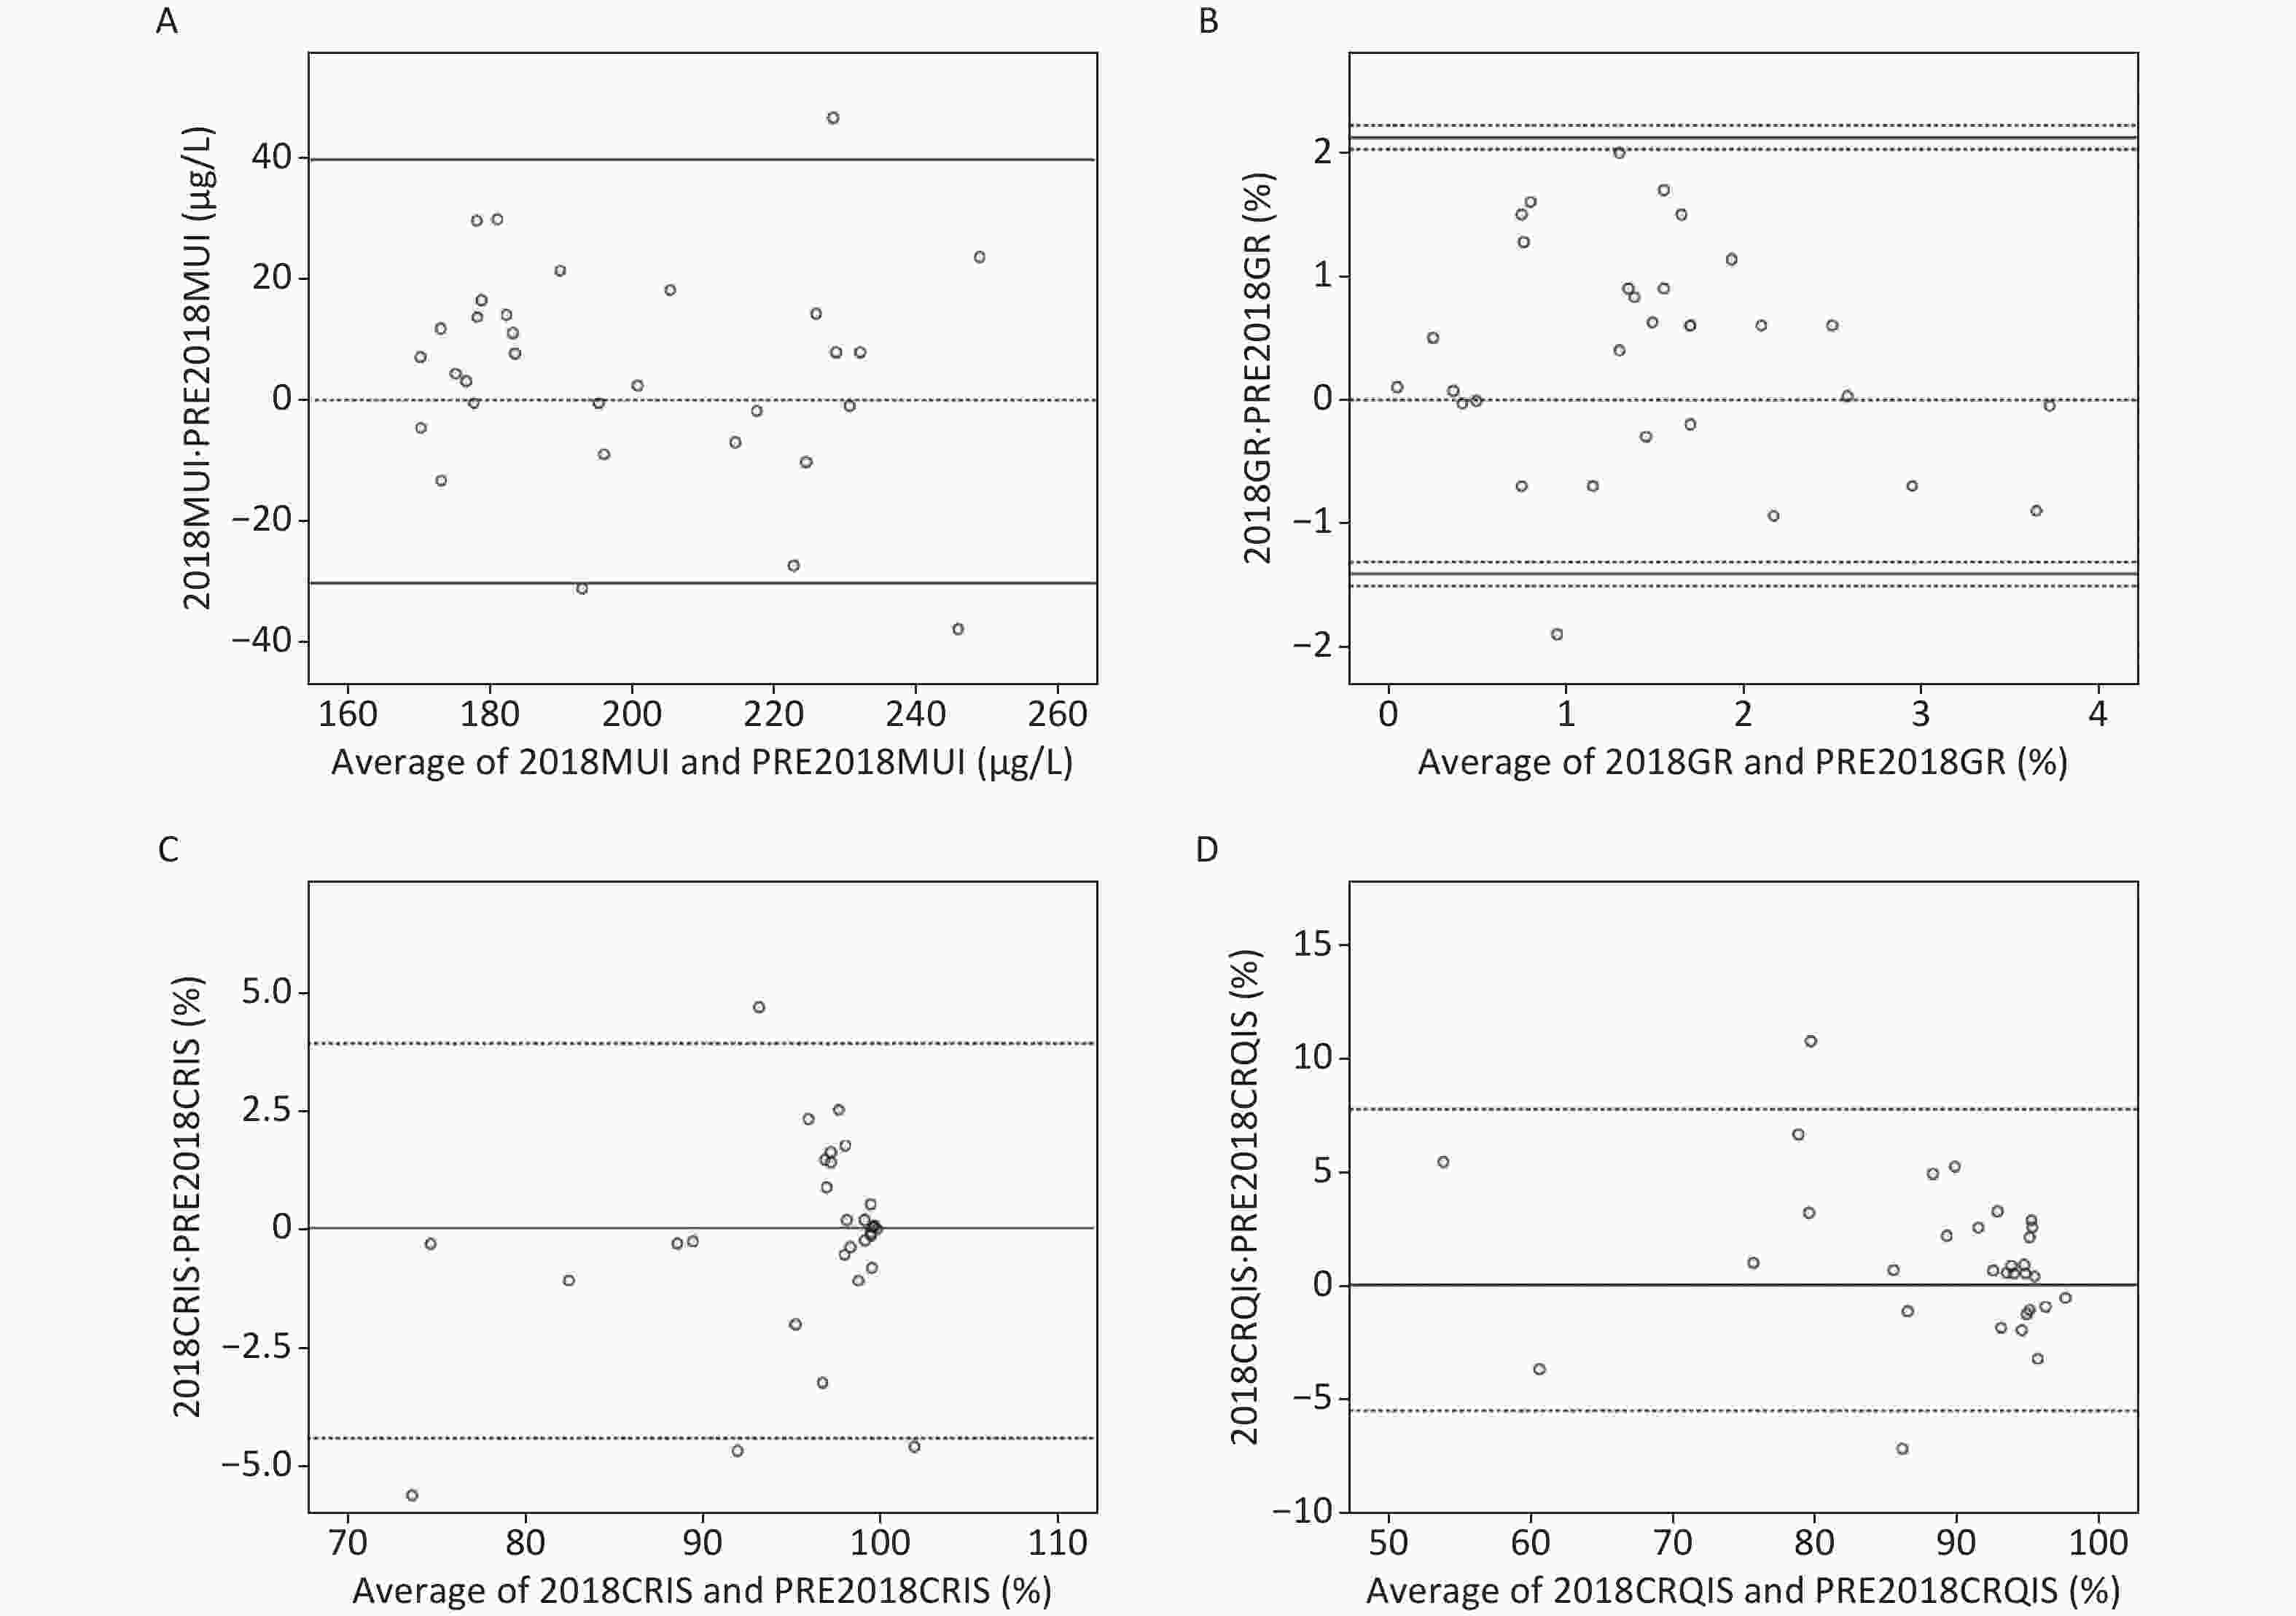
Figure S2. Provinces with 2018 actual and predicted MUI, GR, CRIS and CRQIS Bland-Altman analysis. (A) Provinces with 2018 MUI and predicted 2018 MUI Bland-Altman Analysis; (B) provinces with 2018 GR and predicted 2018 GR Bland-Altman Analysis; (C) provinces with 2018 CRIS and predicted 2018 CRIS Bland-Altman Analysis; (D) provinces with 2018 CRQIS and predicted 2018 CRQIS Bland-Altman Analysis. (A), (C), and (D) show three lines for the upper limit of the 95% consistency limit, exact consistency levels for both, and the lower limit of the 95% consistency limit. Figure (B), the seven lines are the upper confidence interval for the upper 95% consistency limit, the upper 95% consistency limit, the lower confidence interval for the upper 95% consistency limit, exact consistency levels for both, and the lower confidence interval for the lower 95% consistency limit.
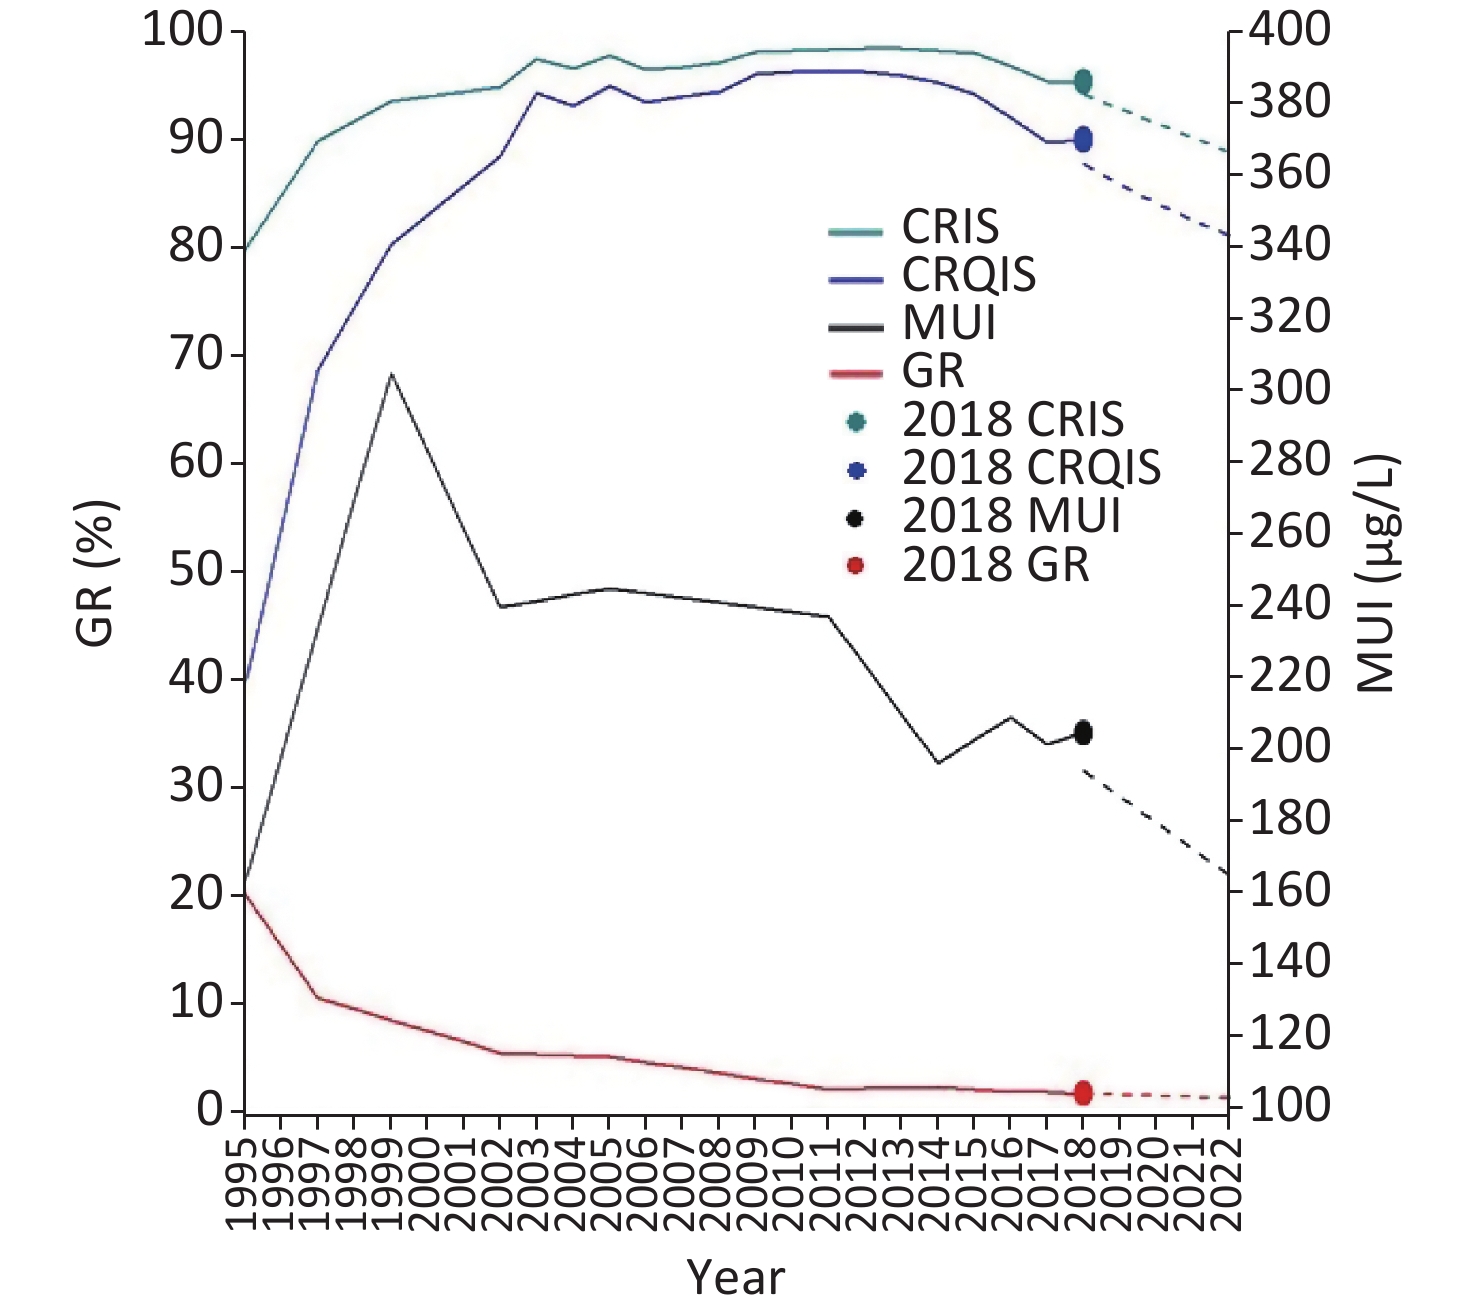
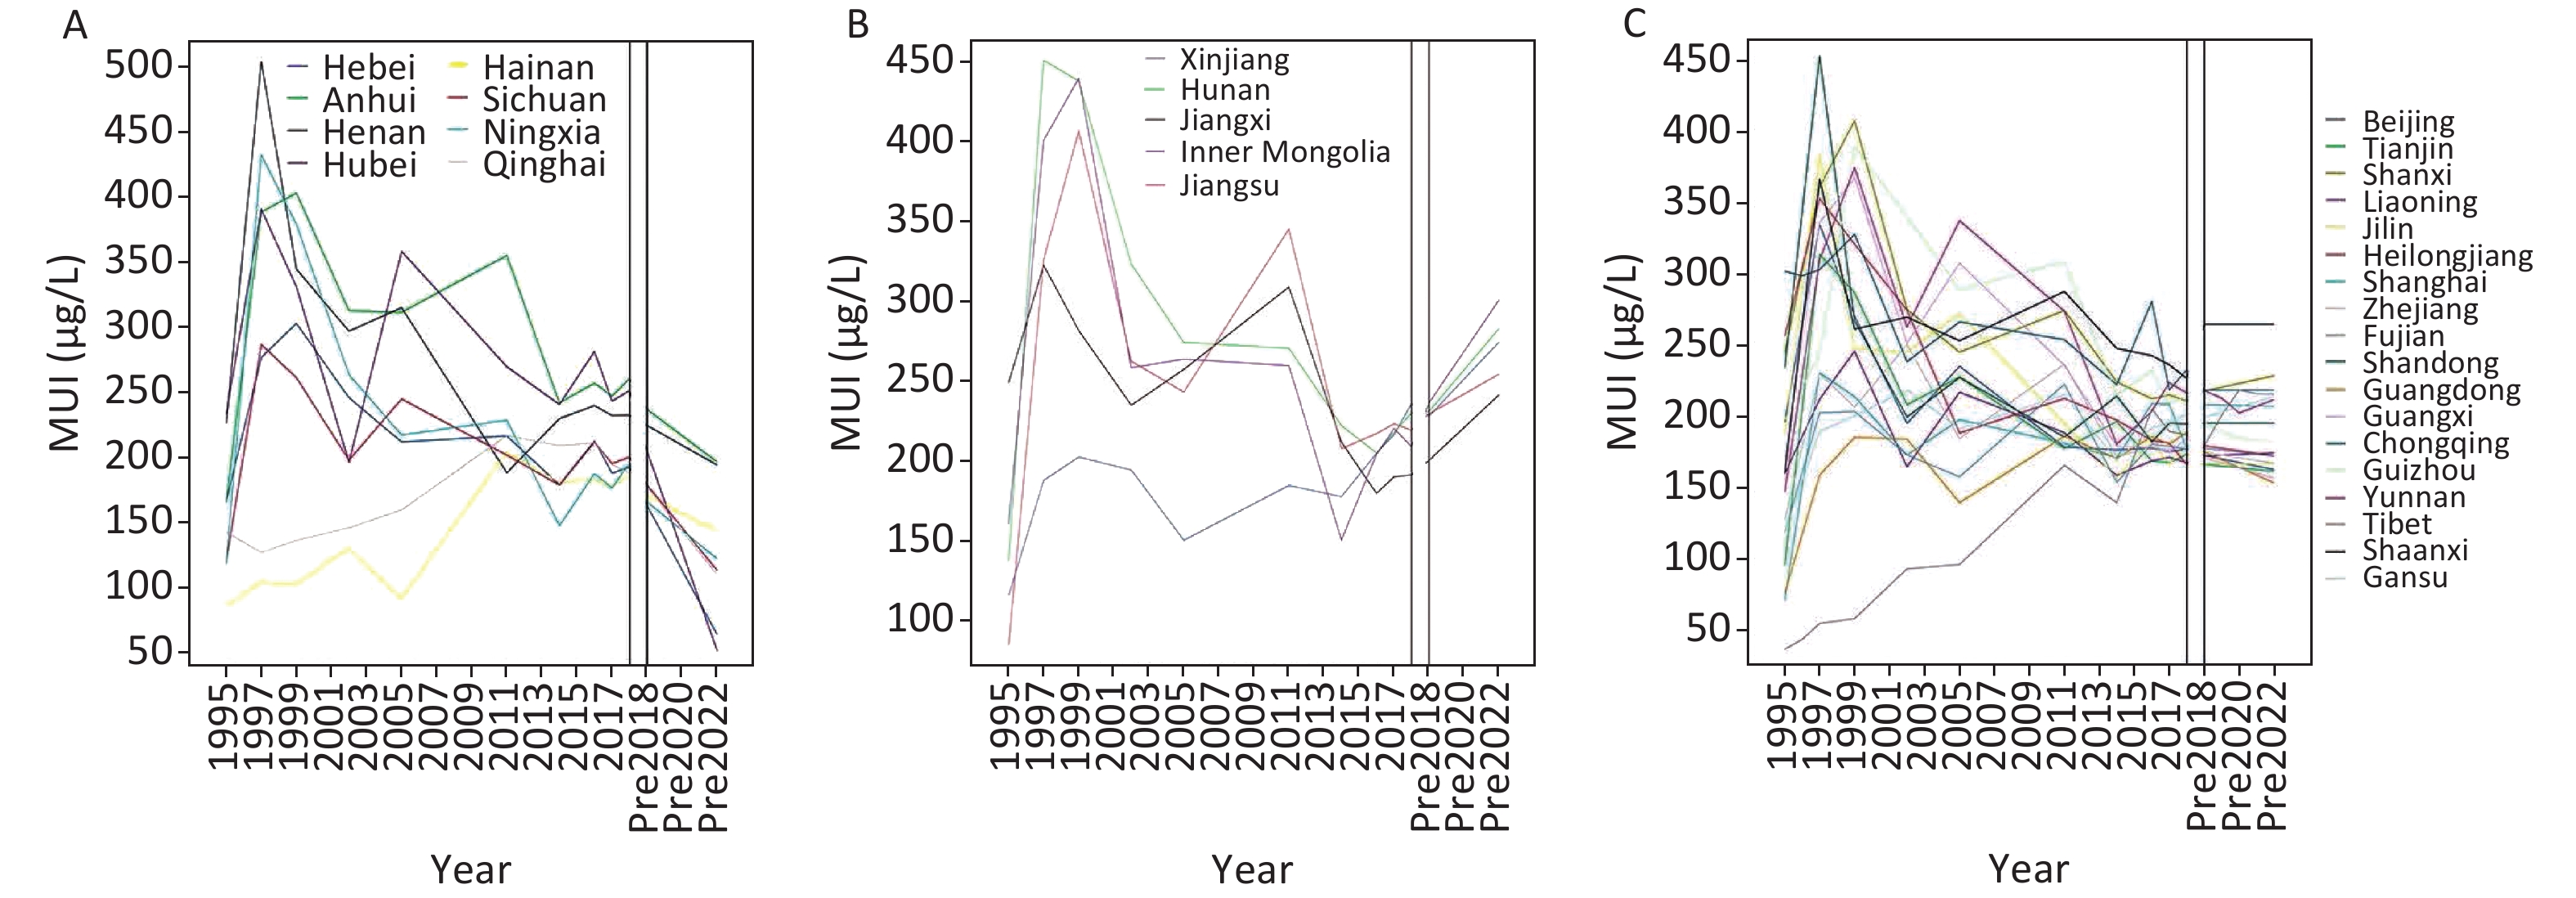
The MUI in children, as shown in Figure 1, increased significantly from 1995 to 1997, then decreased to an adequate range of 100–200 μg/L from 1997 to 2011. After the adjustment of MIS in 2012, the MUI in children also showed a downward trend; however, the overall level of iodine nutrition for children at the national and provincial levels remained adequate. The MUI in children in all provinces was divided into three categories according to their changes, and the trends are shown in Supplementary Figure S3A–C, available in www.besjournal.com.
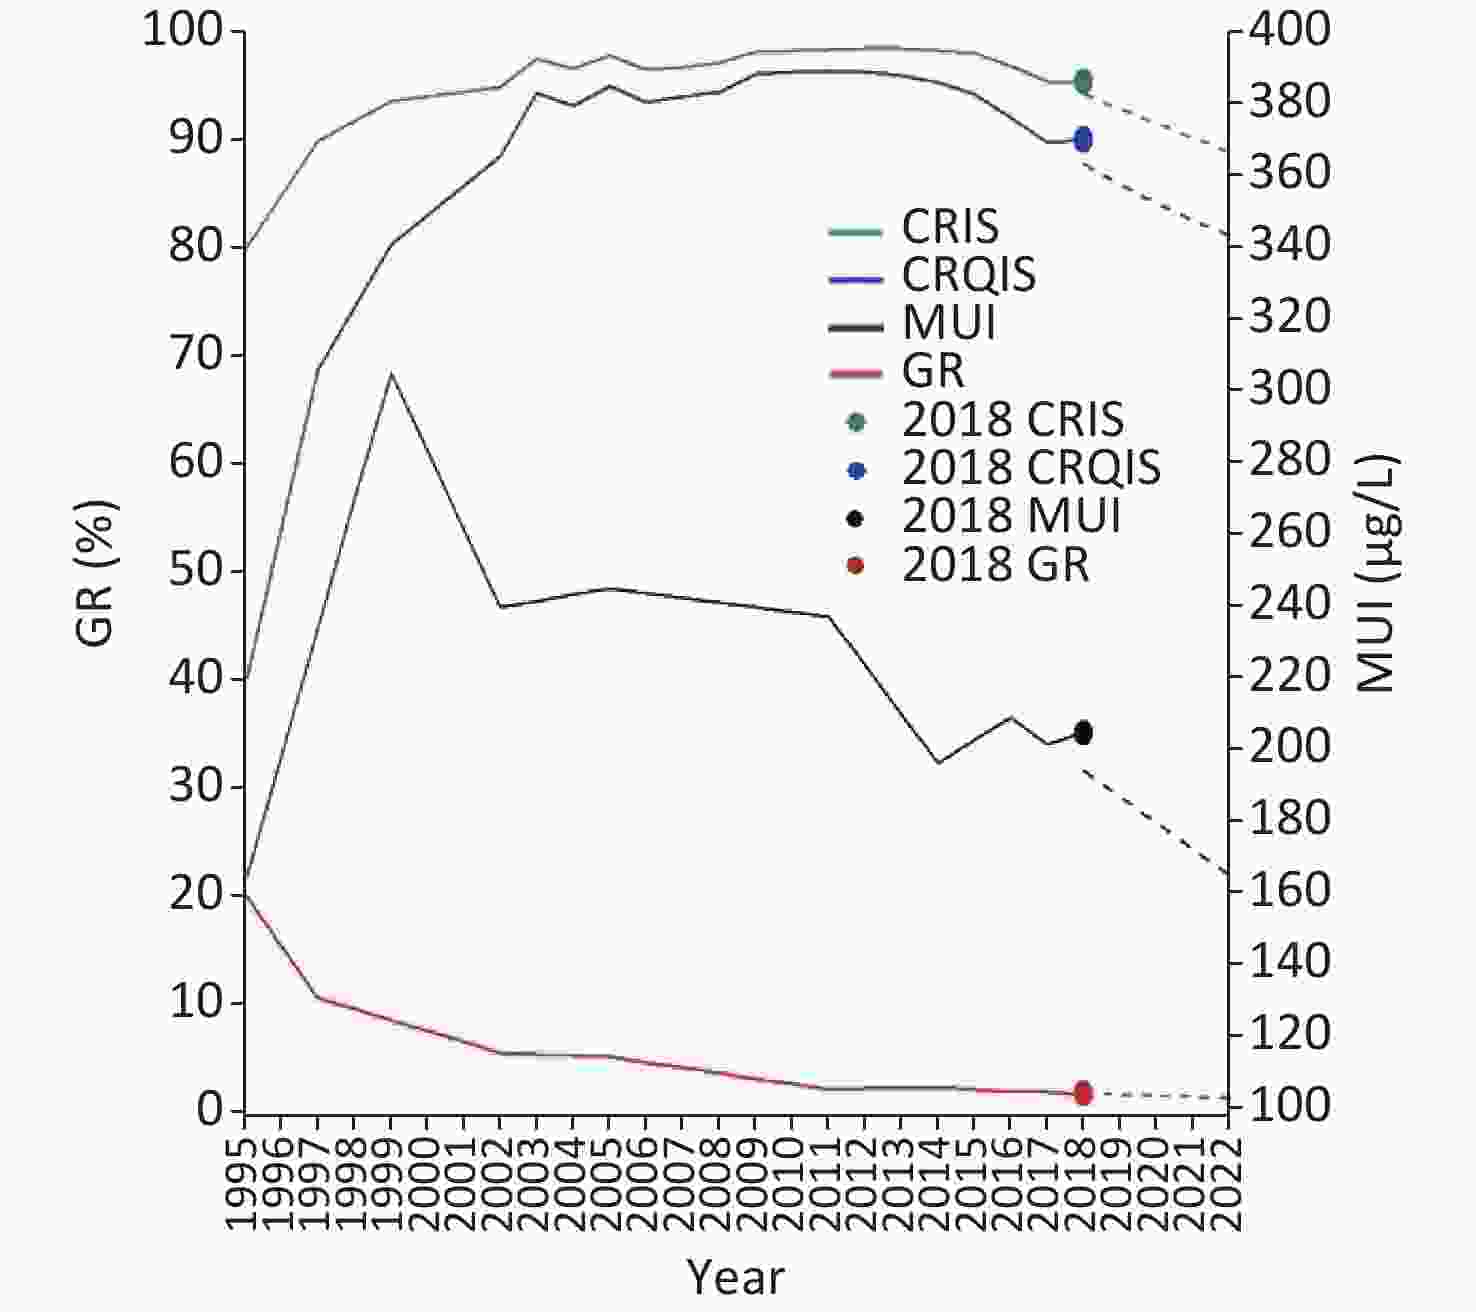
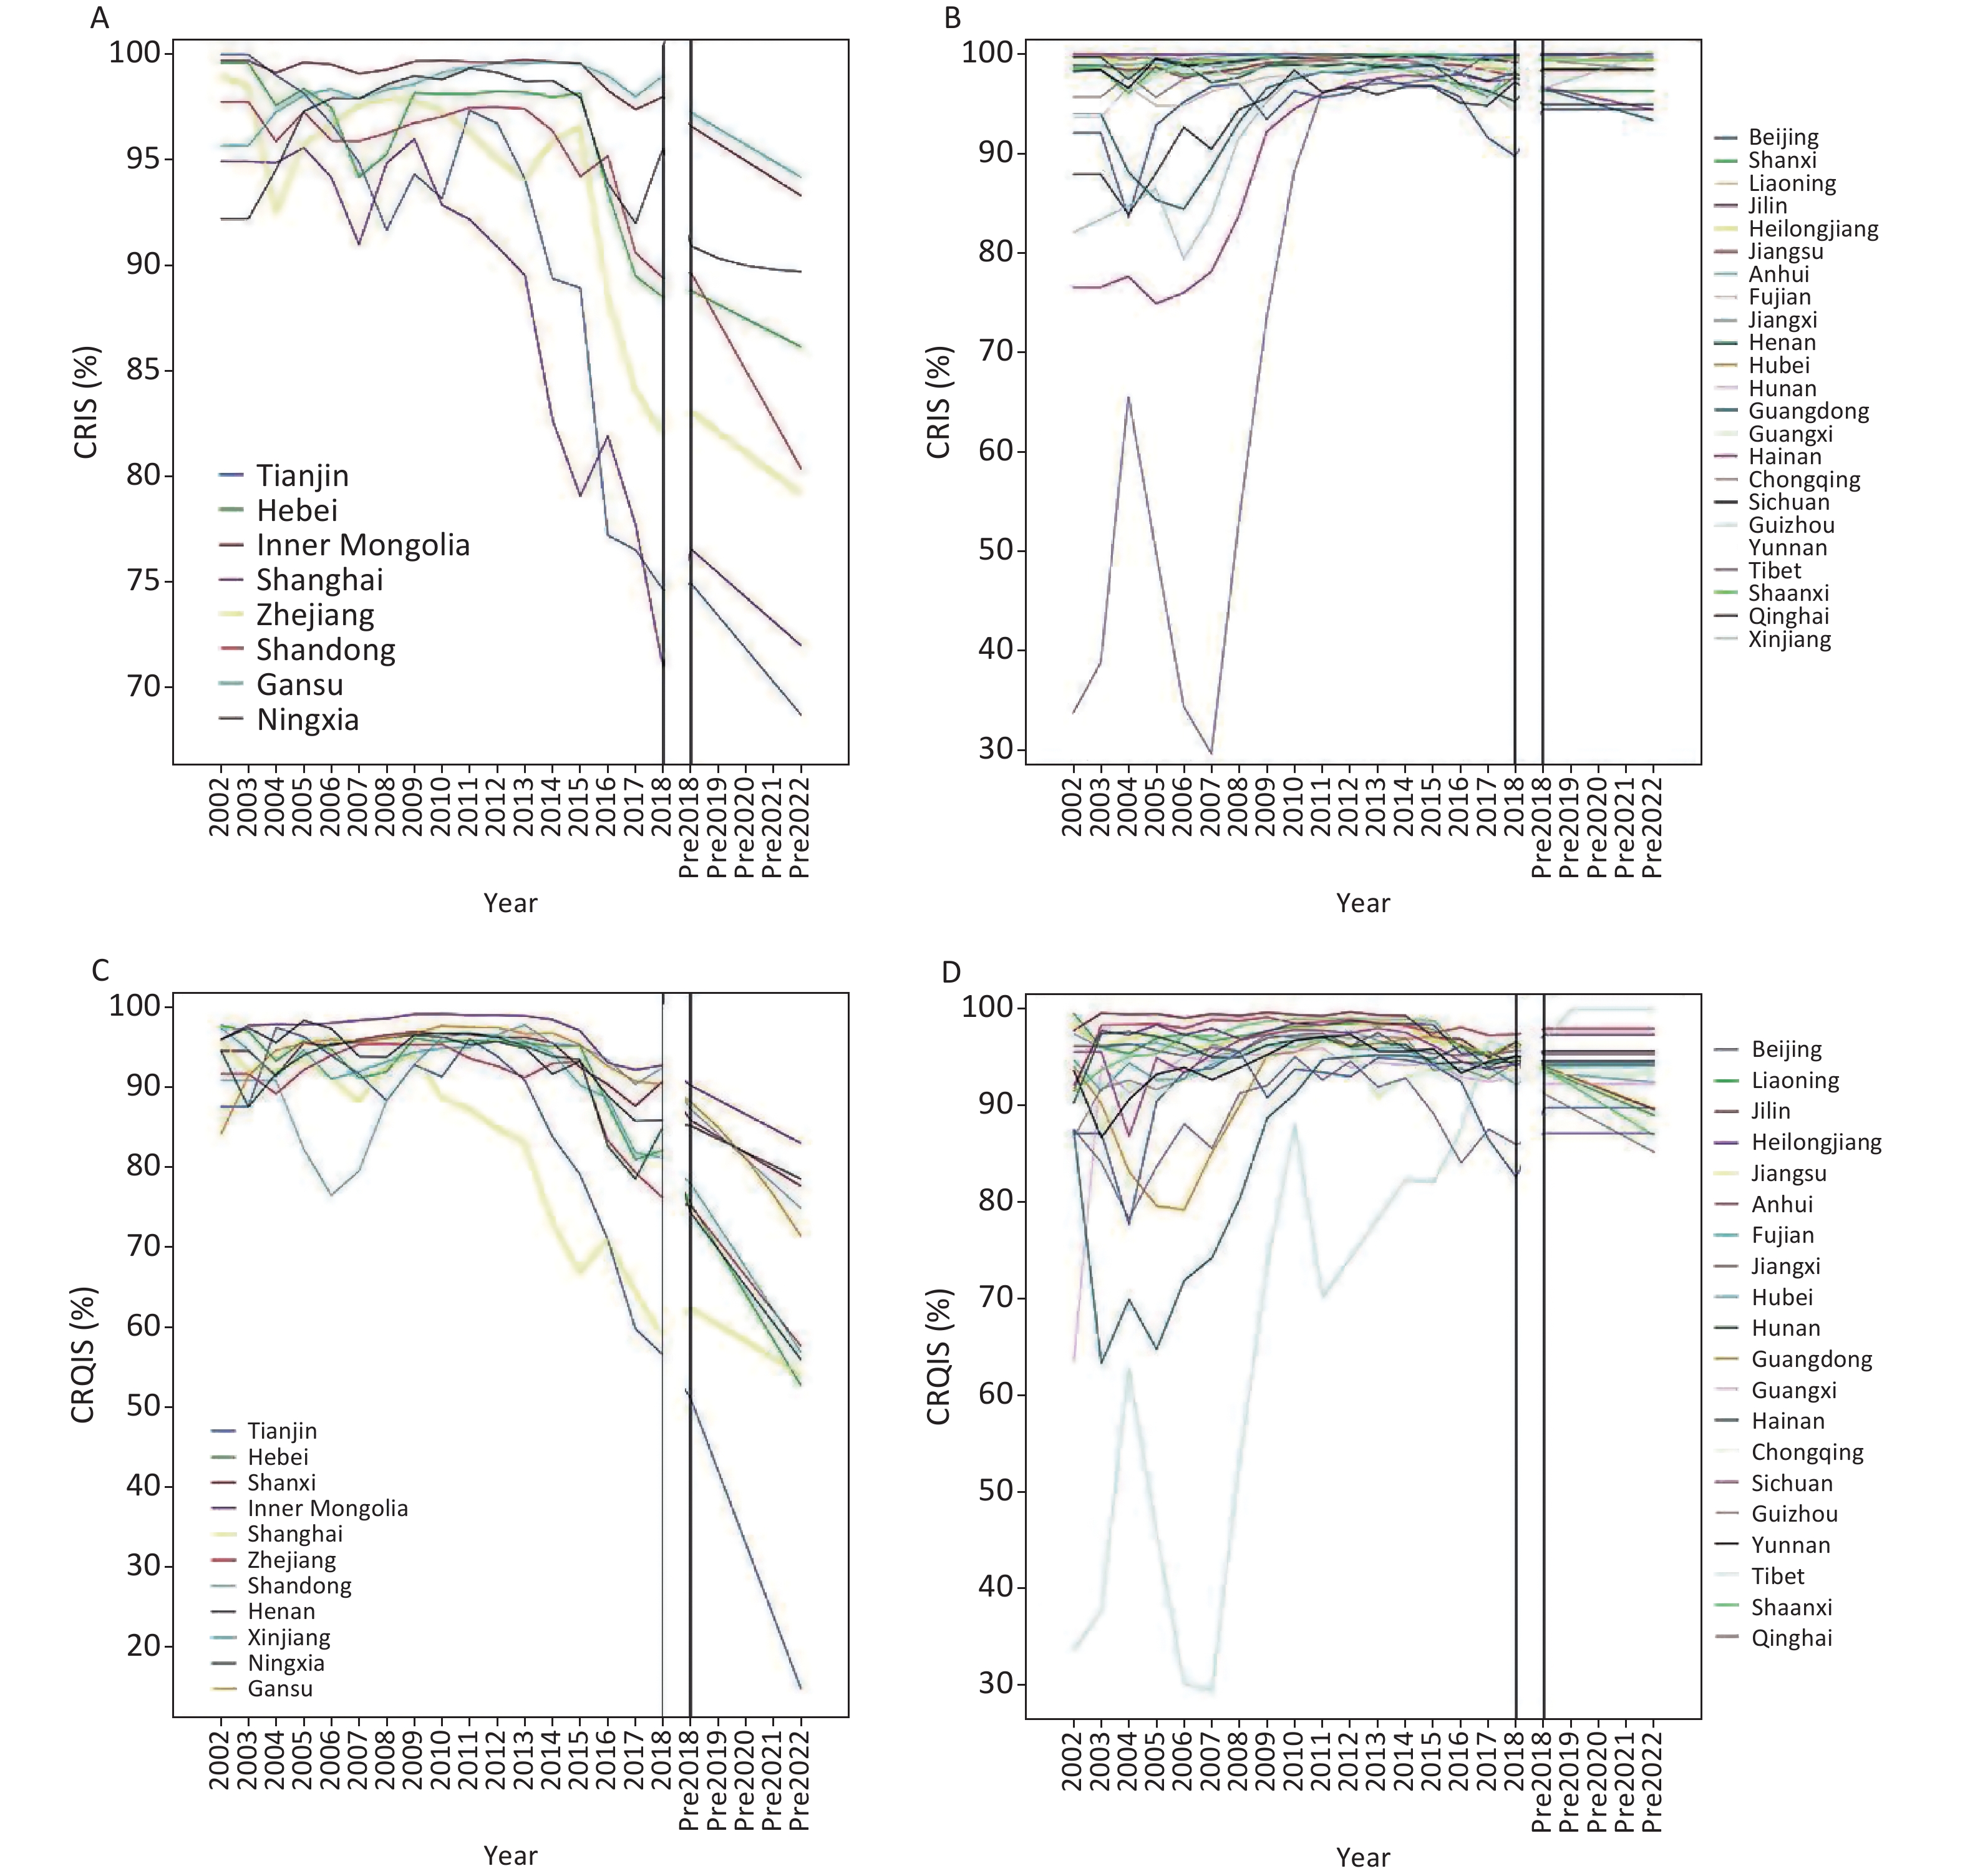
Figure 1. Time series analysis of IDD surveillance in different years. Solid lines show actual values, dots show 2018 actual values, and dashed lines show prospected values. IDD, iodine deficiency disorders; CRIS, coverage rate of iodized salt; CRQIS, consumption rate of qualified iodized salt; MUI, median urinary iodine concentration; GR, goiter rate
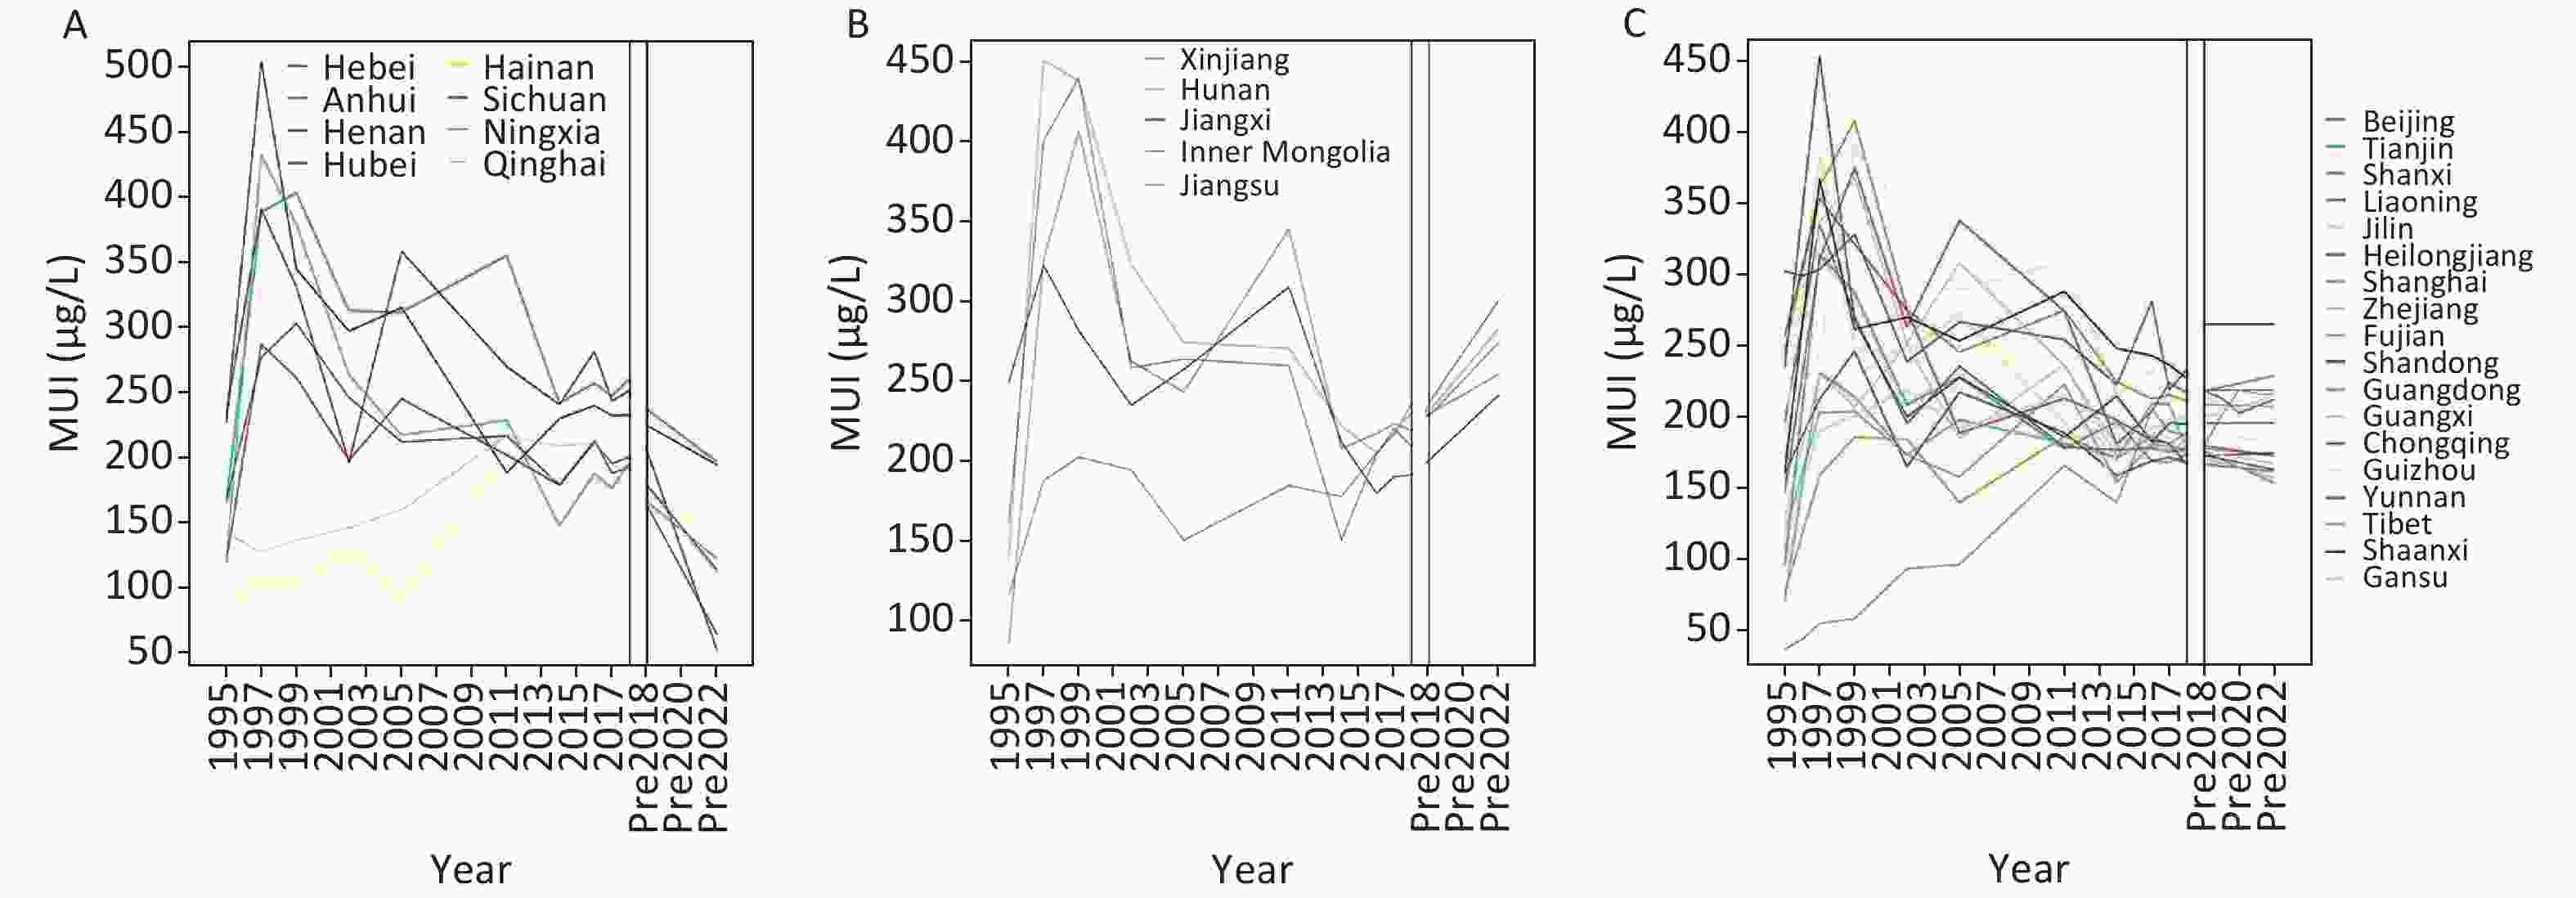
Figure S3. Time series analysis of IDD surveillance in different years (MUI of provinces). (A) Provinces with MUI of children present decreased tendency; (B) provinces with MUI of children present increased tendency; (C) provinces with MUI of children present unchanged tendency. Solid lines show actual values, dots show 2018 actual values, dashed lines show projected values.
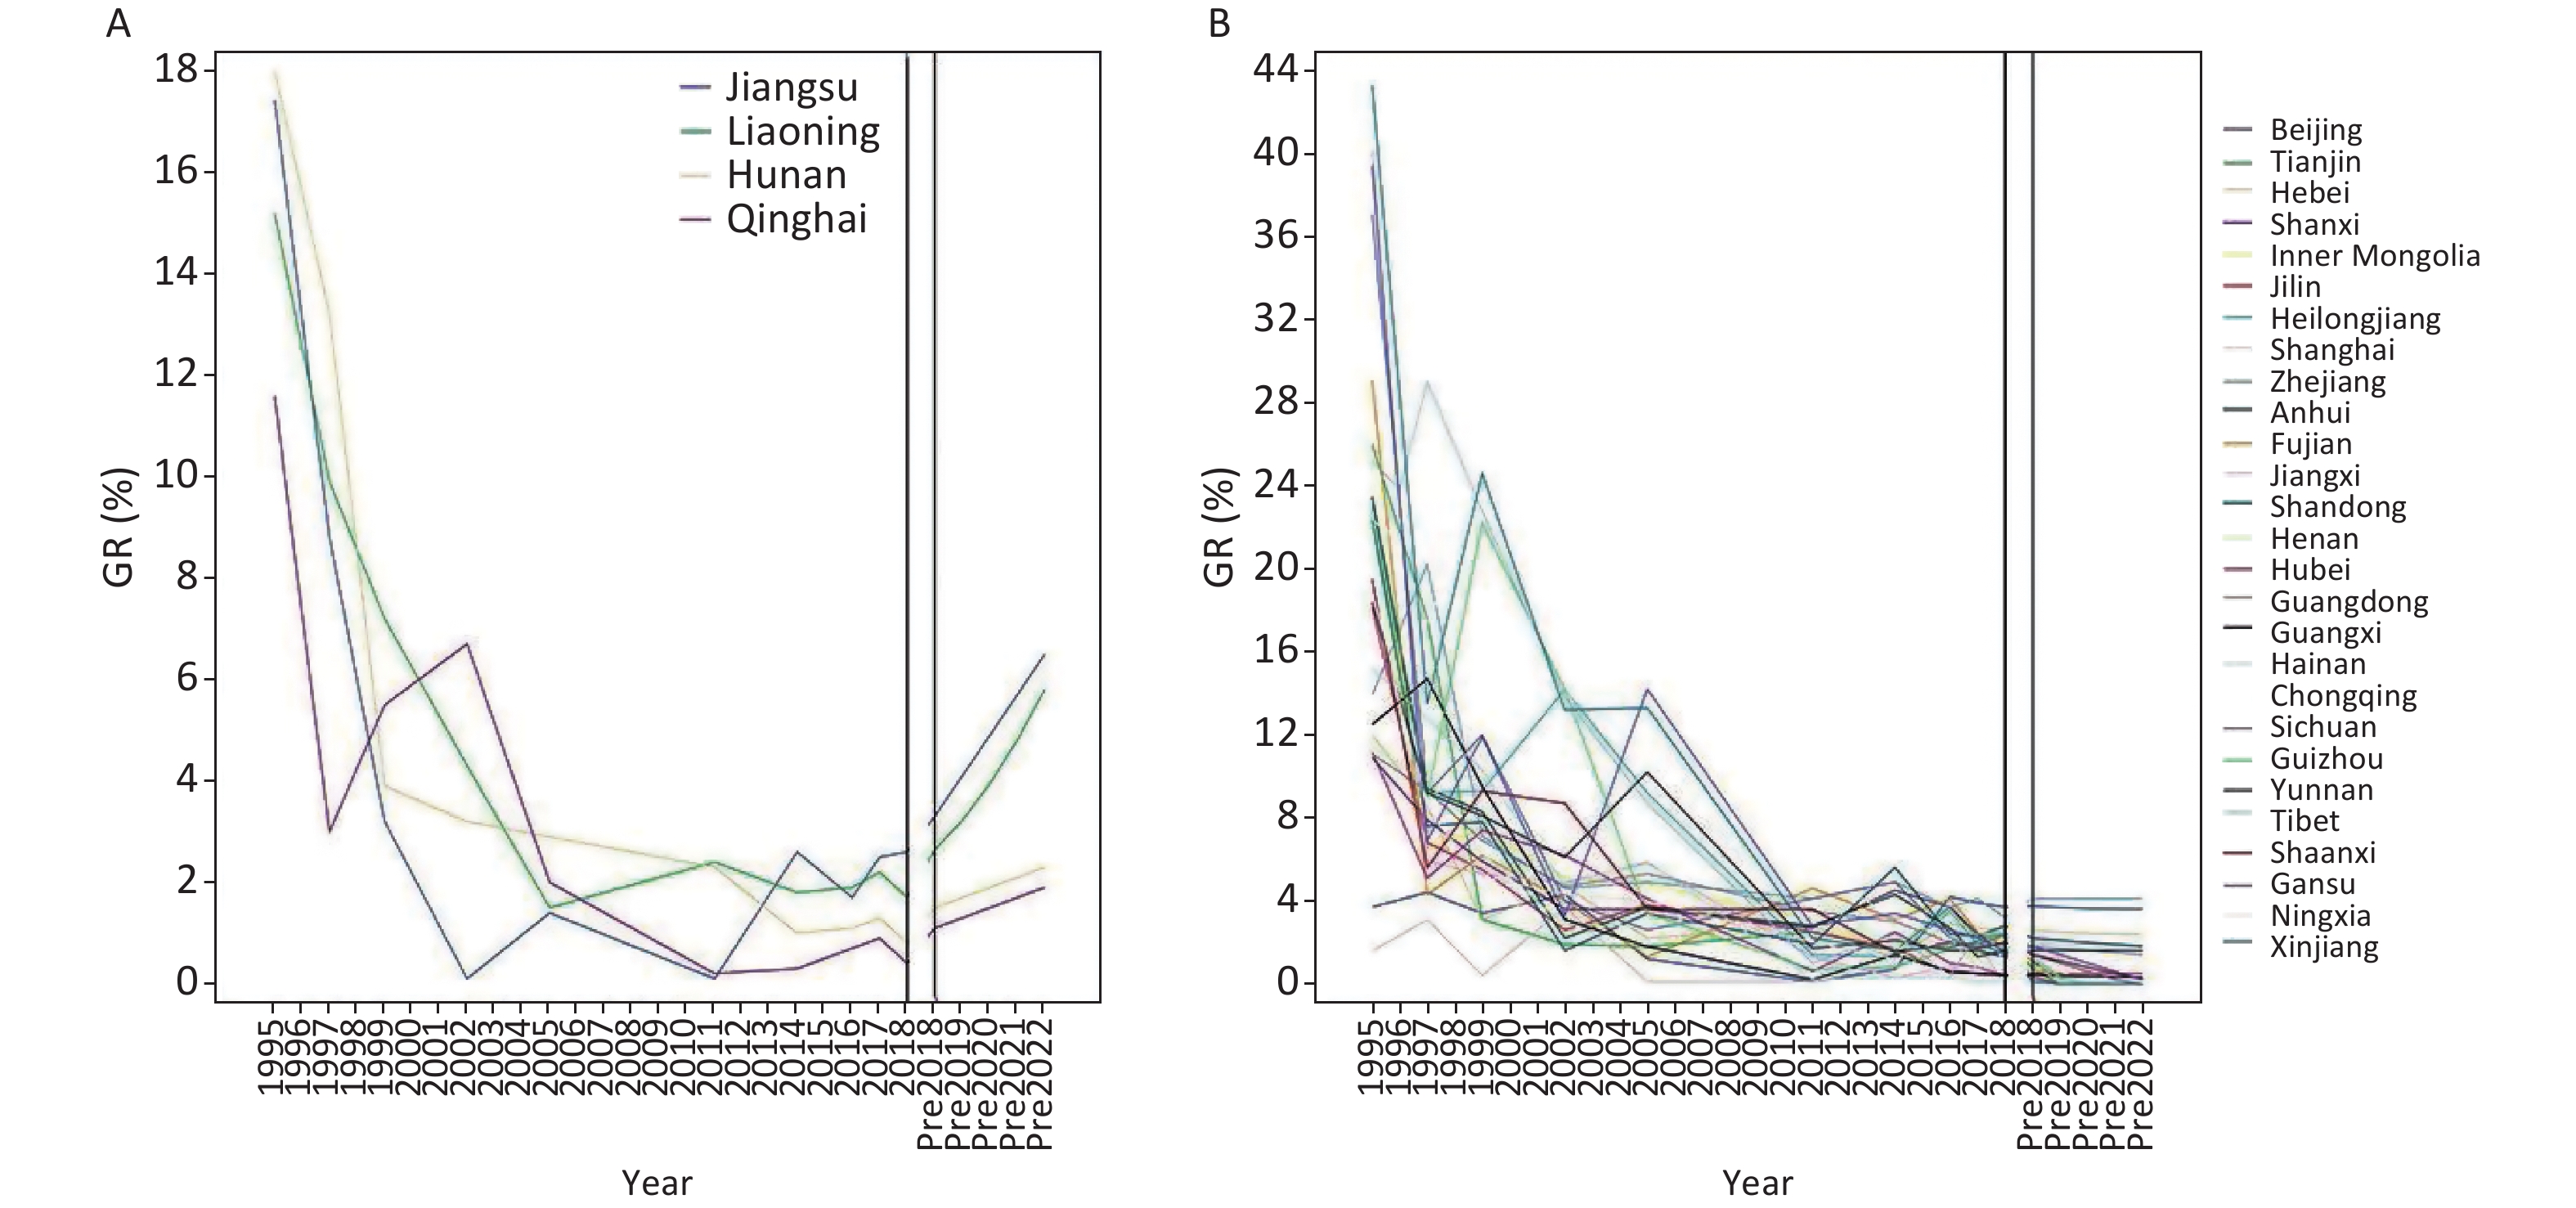
The national GR showed a decreasing trend from 1995 to 2017, and has remained stable in recent years (Figure 1). The GR was below 5% in all provinces. In 2019–2022, the GR in some provinces is expected to increase while that in the other provinces remains unchanged (Supplementary Figure S4A–B, available in www.besjournal.com).
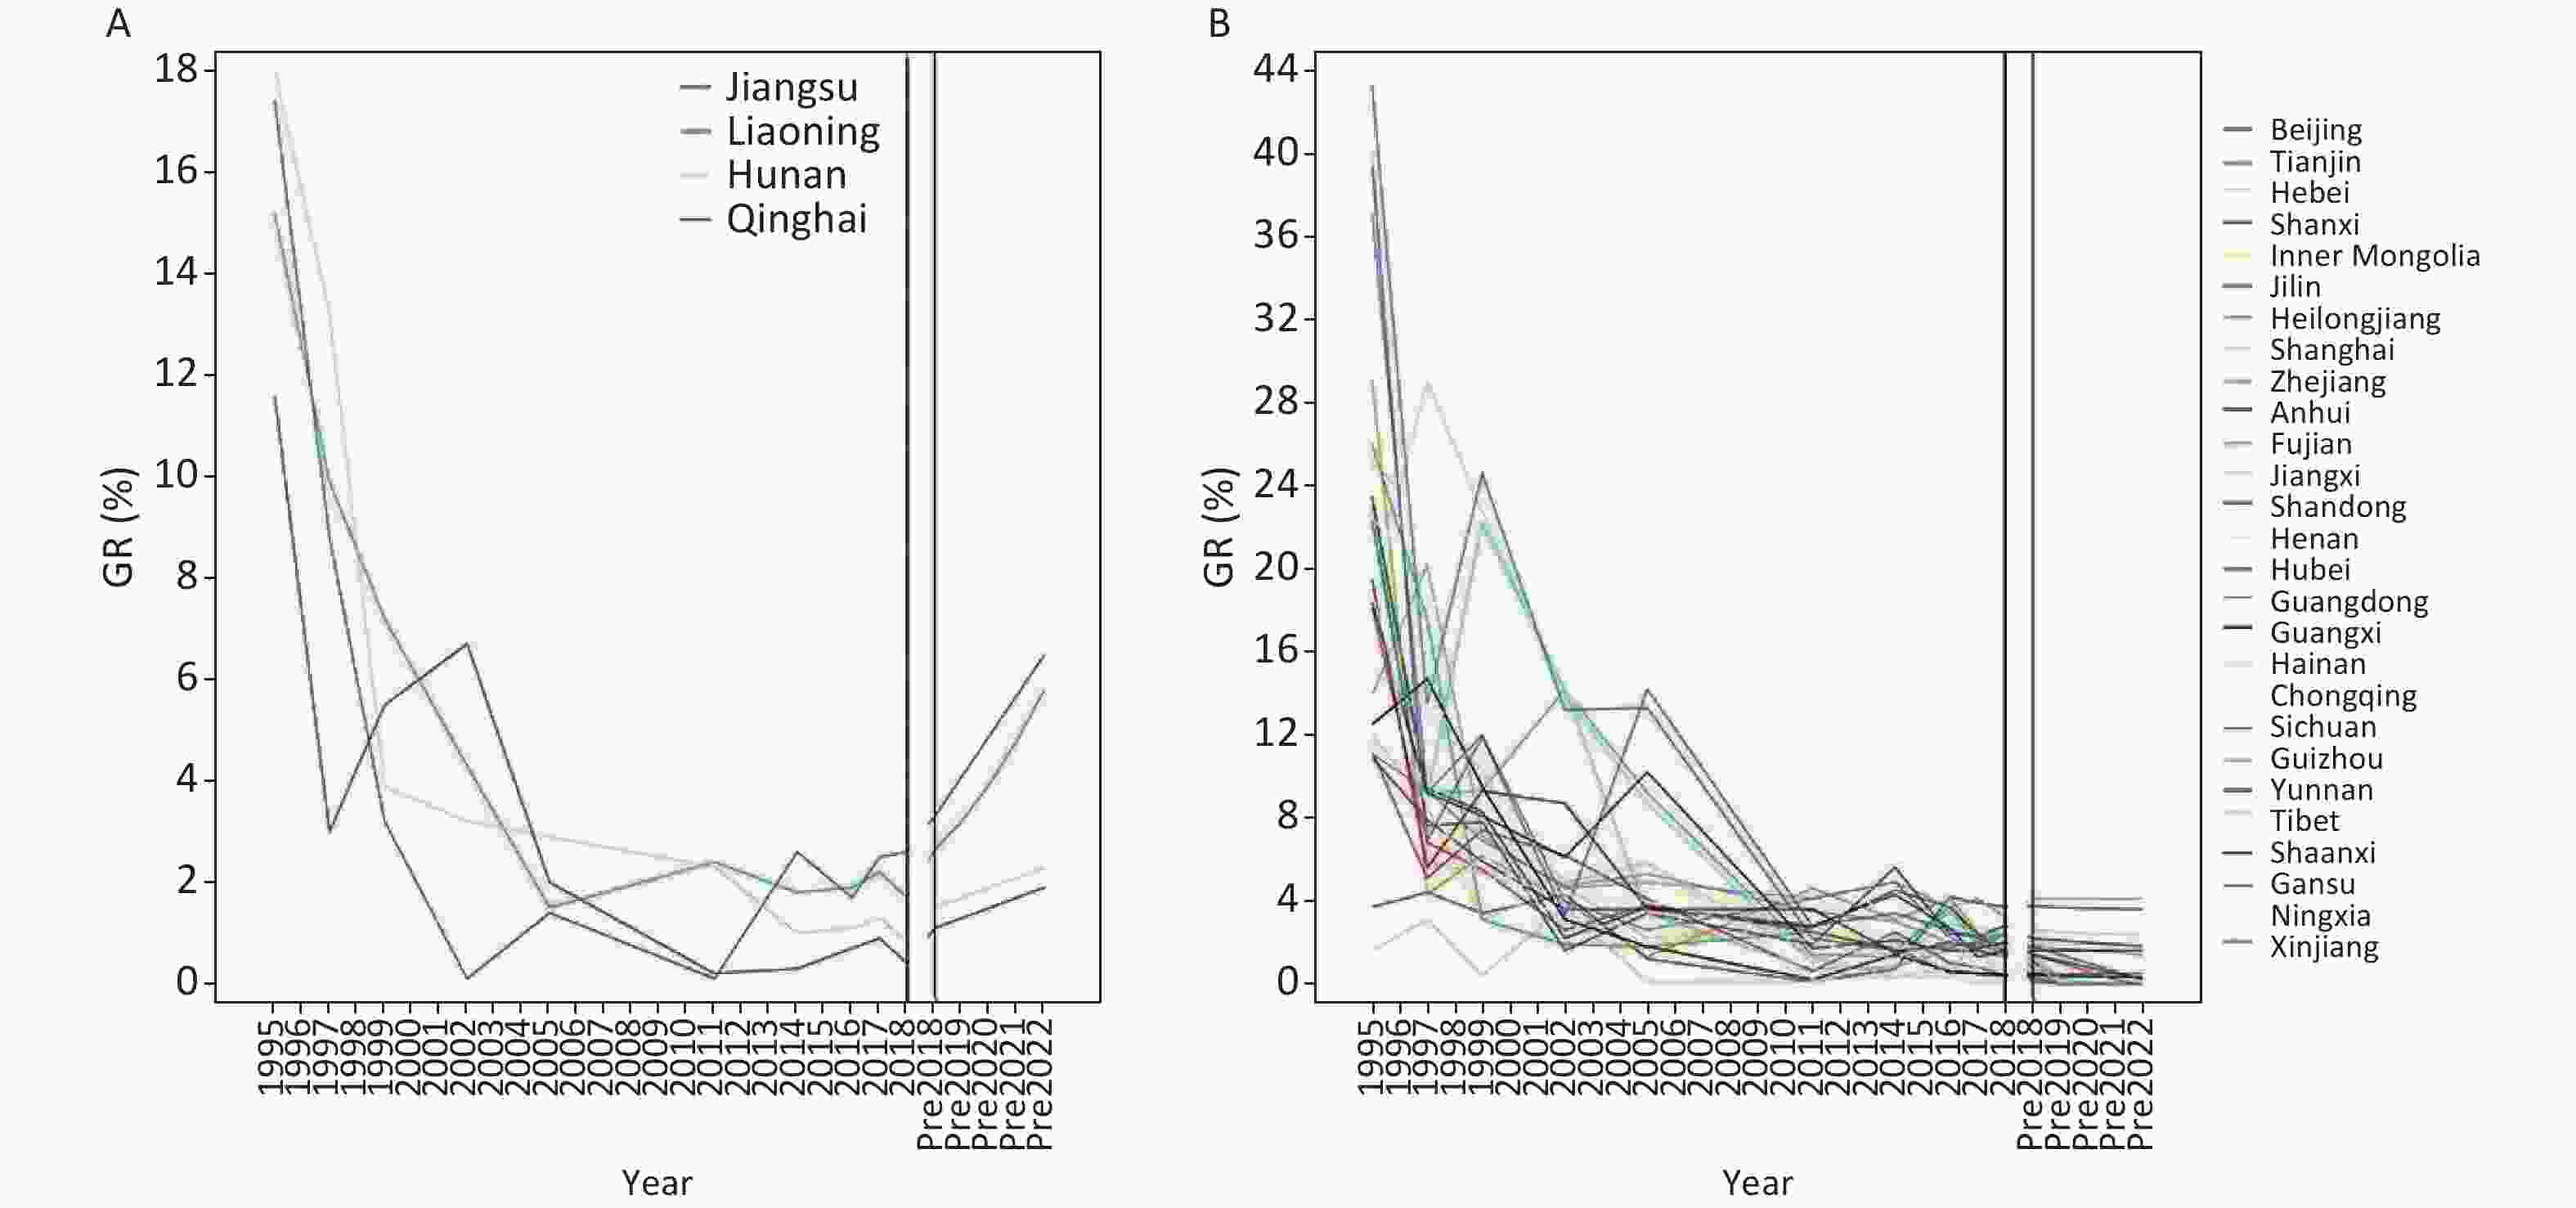
Figure S4. Time series analysis of IDD surveillance in different years (GR of provinces). (A) Provinces with GR of children present increased tendency; (B) provinces with GR of children present unchanged tendency. Solid lines show actual values, dots show 2018 actual values, dashed lines show projected values.
The national trend of CRIS increased, then remained stable, and then decreased after 2014 (Figure 1). CRIS is predicted to continue to decline from 2019 to 2022. The trends of CRIS in different provinces were essentially consistent with the national CRIS (Supplementary Figure S5A–B, available in www.besjournal.com).
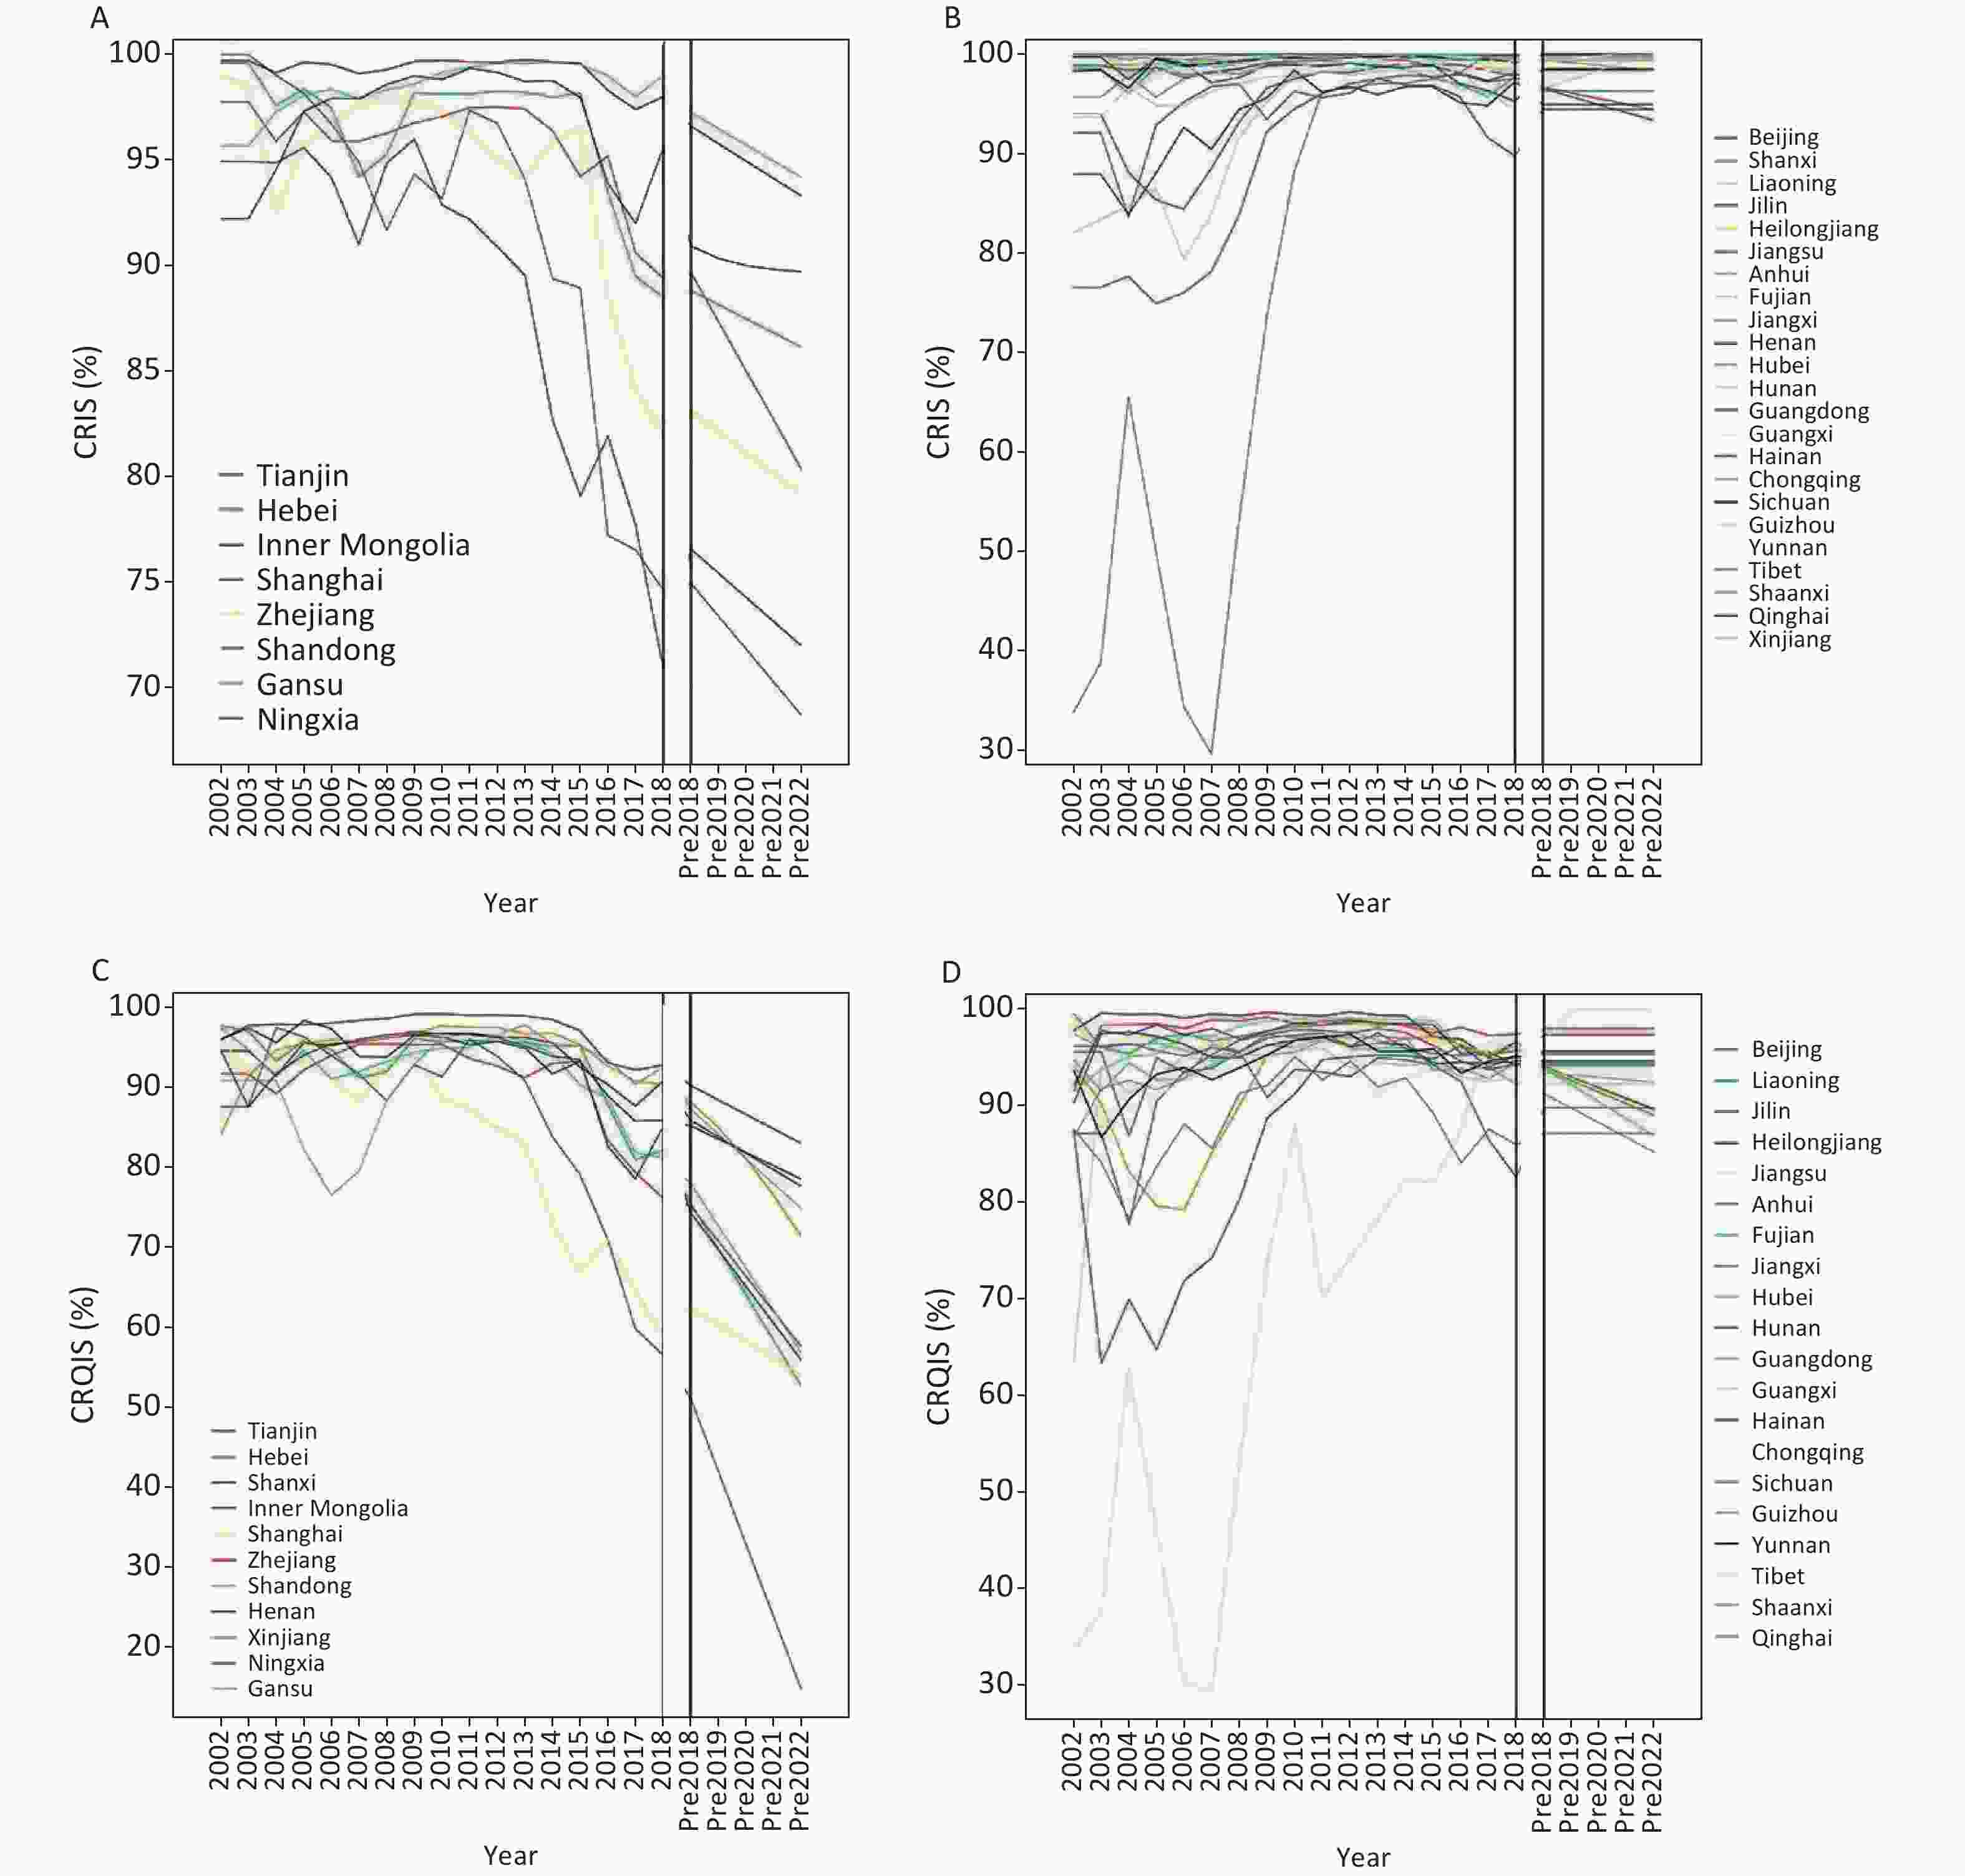
Figure S5. Time Series Analysis of IDD Surveillance in Different Years (CRIS and CRQIS). (A) Provinces with CRIS present decreased tendency; (B) provinces with CRIS present unchanged tendency; (C) provinces with CRQIS present decreased tendency; (D) provinces with CRQIS present unchanged tendency. Solid lines show actual values, dots show 2018 actual values, dashed lines show projected values.
The national CRQIS was similar to the CRIS; the CRQIS in each province is shown in Supplementary Figure S5C–D. By 2017, the CRQIS in Tianjin (59.9%), Shanghai (64.6%), Zhejiang (79.4%), Ningxia (78.6%) and several other provinces significantly decreased. In the 2019–2022 predictions, the CRQIS in Tianjin, Hebei, Shanghai, Shandong, Zhejiang, Ningxia, and several other provinces are expected to continue to decline. The CRQIS in Tianjin and Shanghai is likely to decrease significantly to below 70%. The CRQIS in other provinces is expected to remain essentially unchanged, above 85%.
-
The results of global spatial autocorrelation analysis are shown in Table 1. Data from surveys conducted in 2016, 2017, and 2018 showed a statistically significant positive special correlation (P < 0.0001). Moran’s I for the CRIS, RQIS and CRQIS increased each year, and the spatial autocorrelation was significant. The spatial autocorrelation of MIS in 2017 was larger than that in 2016, and that in 2018 was similar to that in 2017. The spatial autocorrelation of the SD of SI in 2017 was higher than that in 2016 and 2018, and low spatial autocorrelation of the CV of SI was found in 2016, 2017, and 2018.
Index 2016 2017 2018 Moran’s I z score P value Moran’s I z score P value Moran’s I z score P value Coverage rate of iodized-salt 0.066 19.133 < 0.0001 0.302 71.409 < 0.0001 0.369 102.561 < 0.0001 Qualified Rate of iodized salt 0.056 16.302 < 0.0001 0.093 22.113 < 0.0001 0.152 42.077 < 0.0001 Consumption rate of qualified iodized salt 0.080 23.028 < 0.0001 0.301 70.805 < 0.0001 0.331 91.704 < 0.0001 Mean of Iodized salt 0.150 43.005 < 0.0001 0.259 60.879 < 0.0001 0.242 66.841 < 0.0001 Standard deviation of iodized salt 0.076 21.998 < 0.0001 0.131 32.045 < 0.0001 0.043 12.126 < 0.0001 Coefficient Variation of iodized salt 0.061 17.596 < 0.0001 0.031 7.735 < 0.0001 0.050 13.876 < 0.0001 Table 1. Global spatial autocorrelation analysis of salt related indexes
-
Getis-Ord Gi* was used for local spatial autocorrelation analysis. The hotspot map for the CRIS, RQIS, CRQIS, the MIS, SD and CV of SI in 2016, 2017, and 2018 is shown in Figures 2–4.

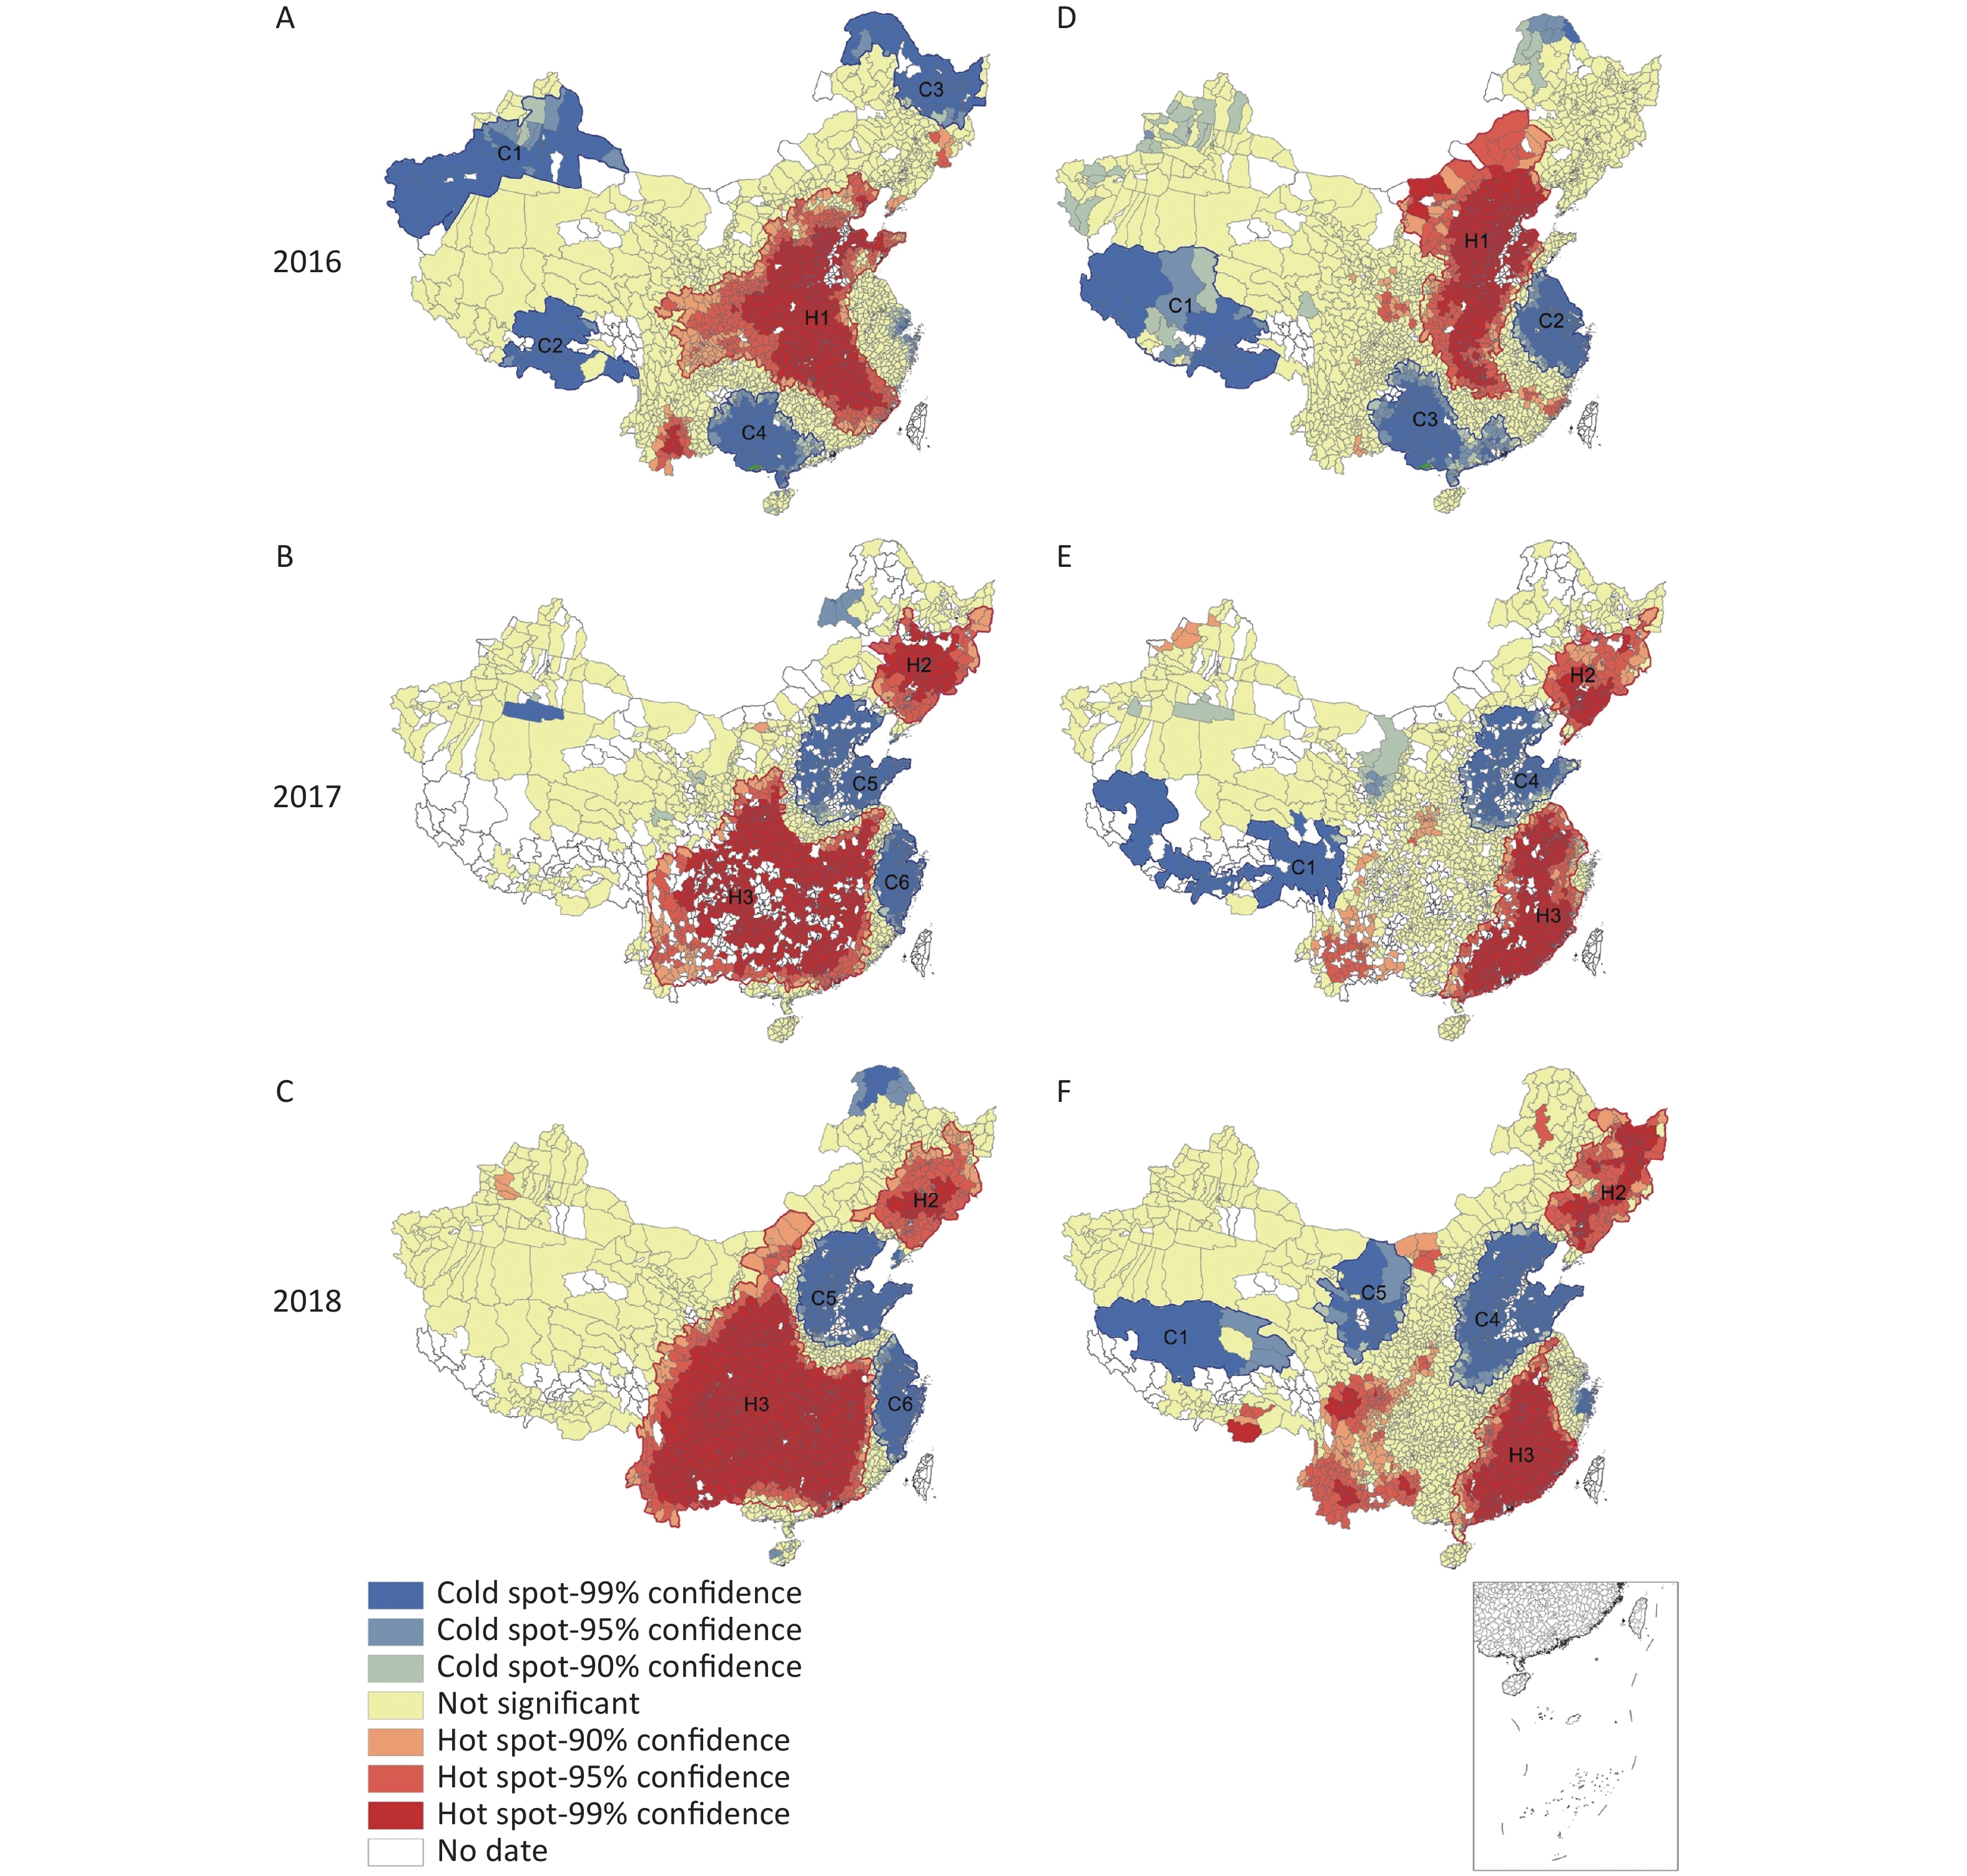
Figure 2. Local autocorrelation maps of the coverage rate of iodized salt (CRIS) and qualified rate of iodized salt (RQIS) in 2016, 2017, and 2018. (A) Local autocorrelation map of CRIS in 2016; (B) local autocorrelation map of CRIS in 2017; (C) local autocorrelation map of CRIS in 2018; (D) local autocorrelation map of RQIS in 2016; (E) local autocorrelation map of RQIS in 2017, (F) local autocorrelation map of RQIS in 2018.
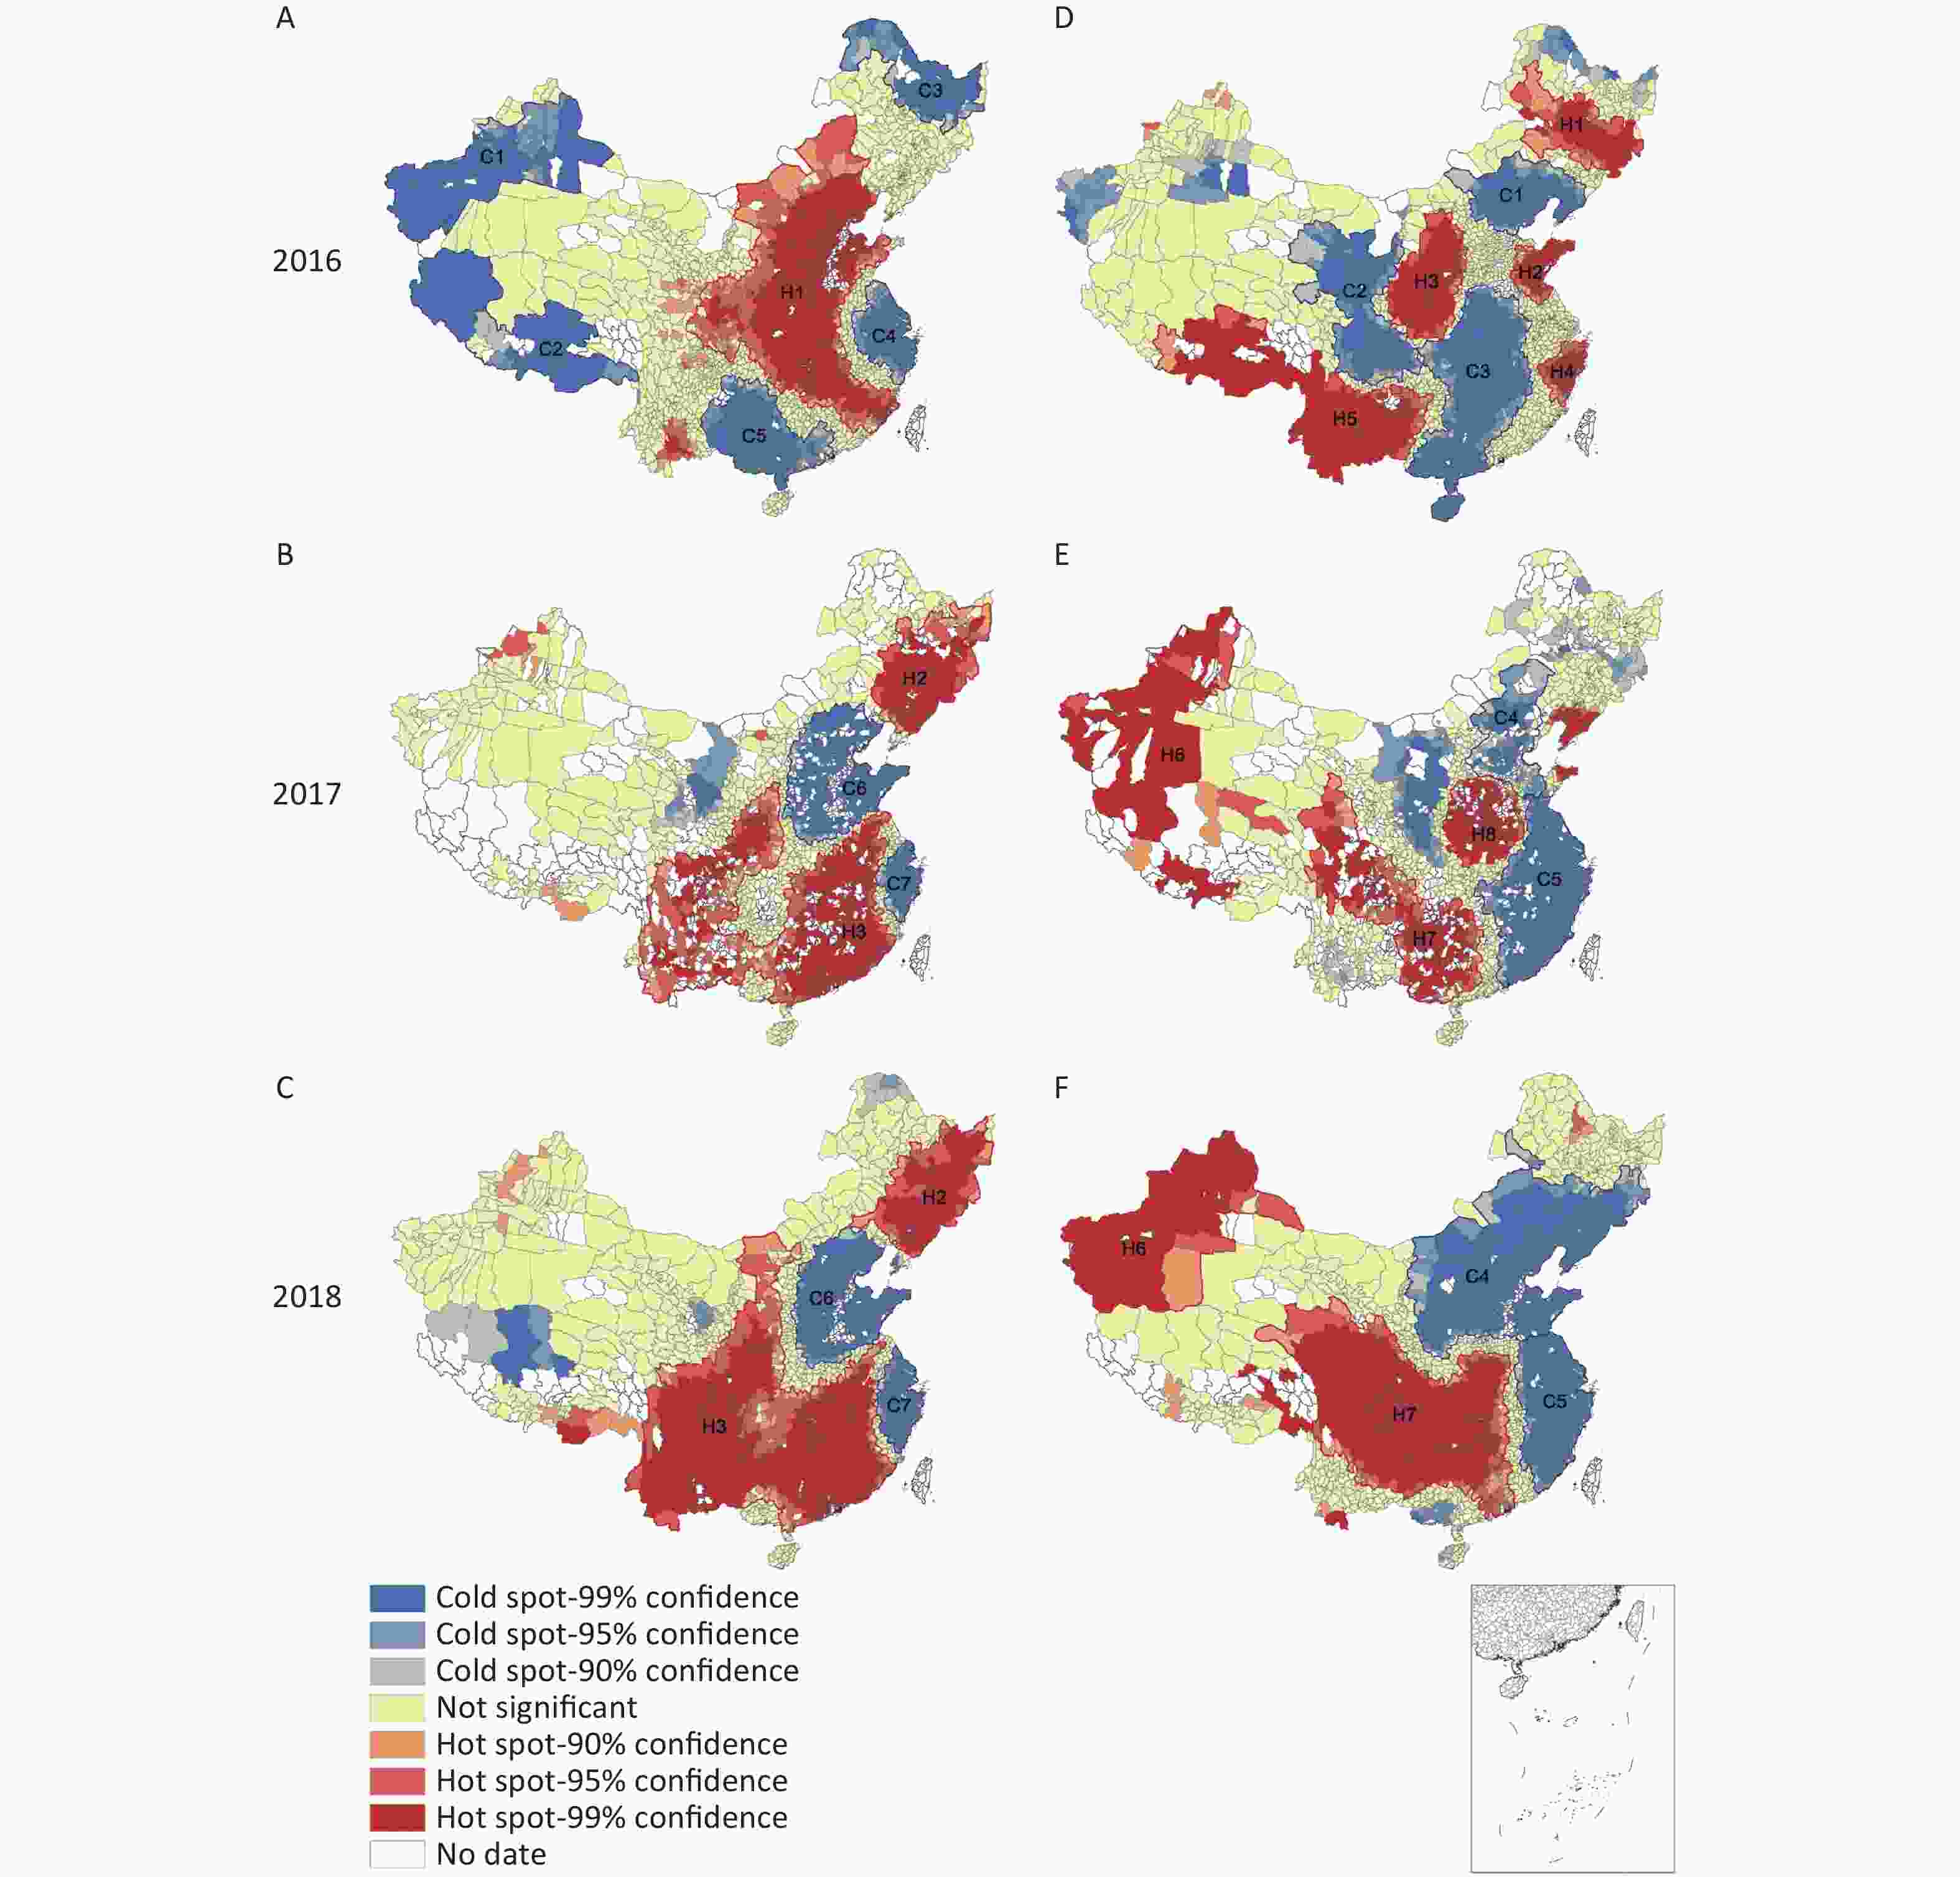
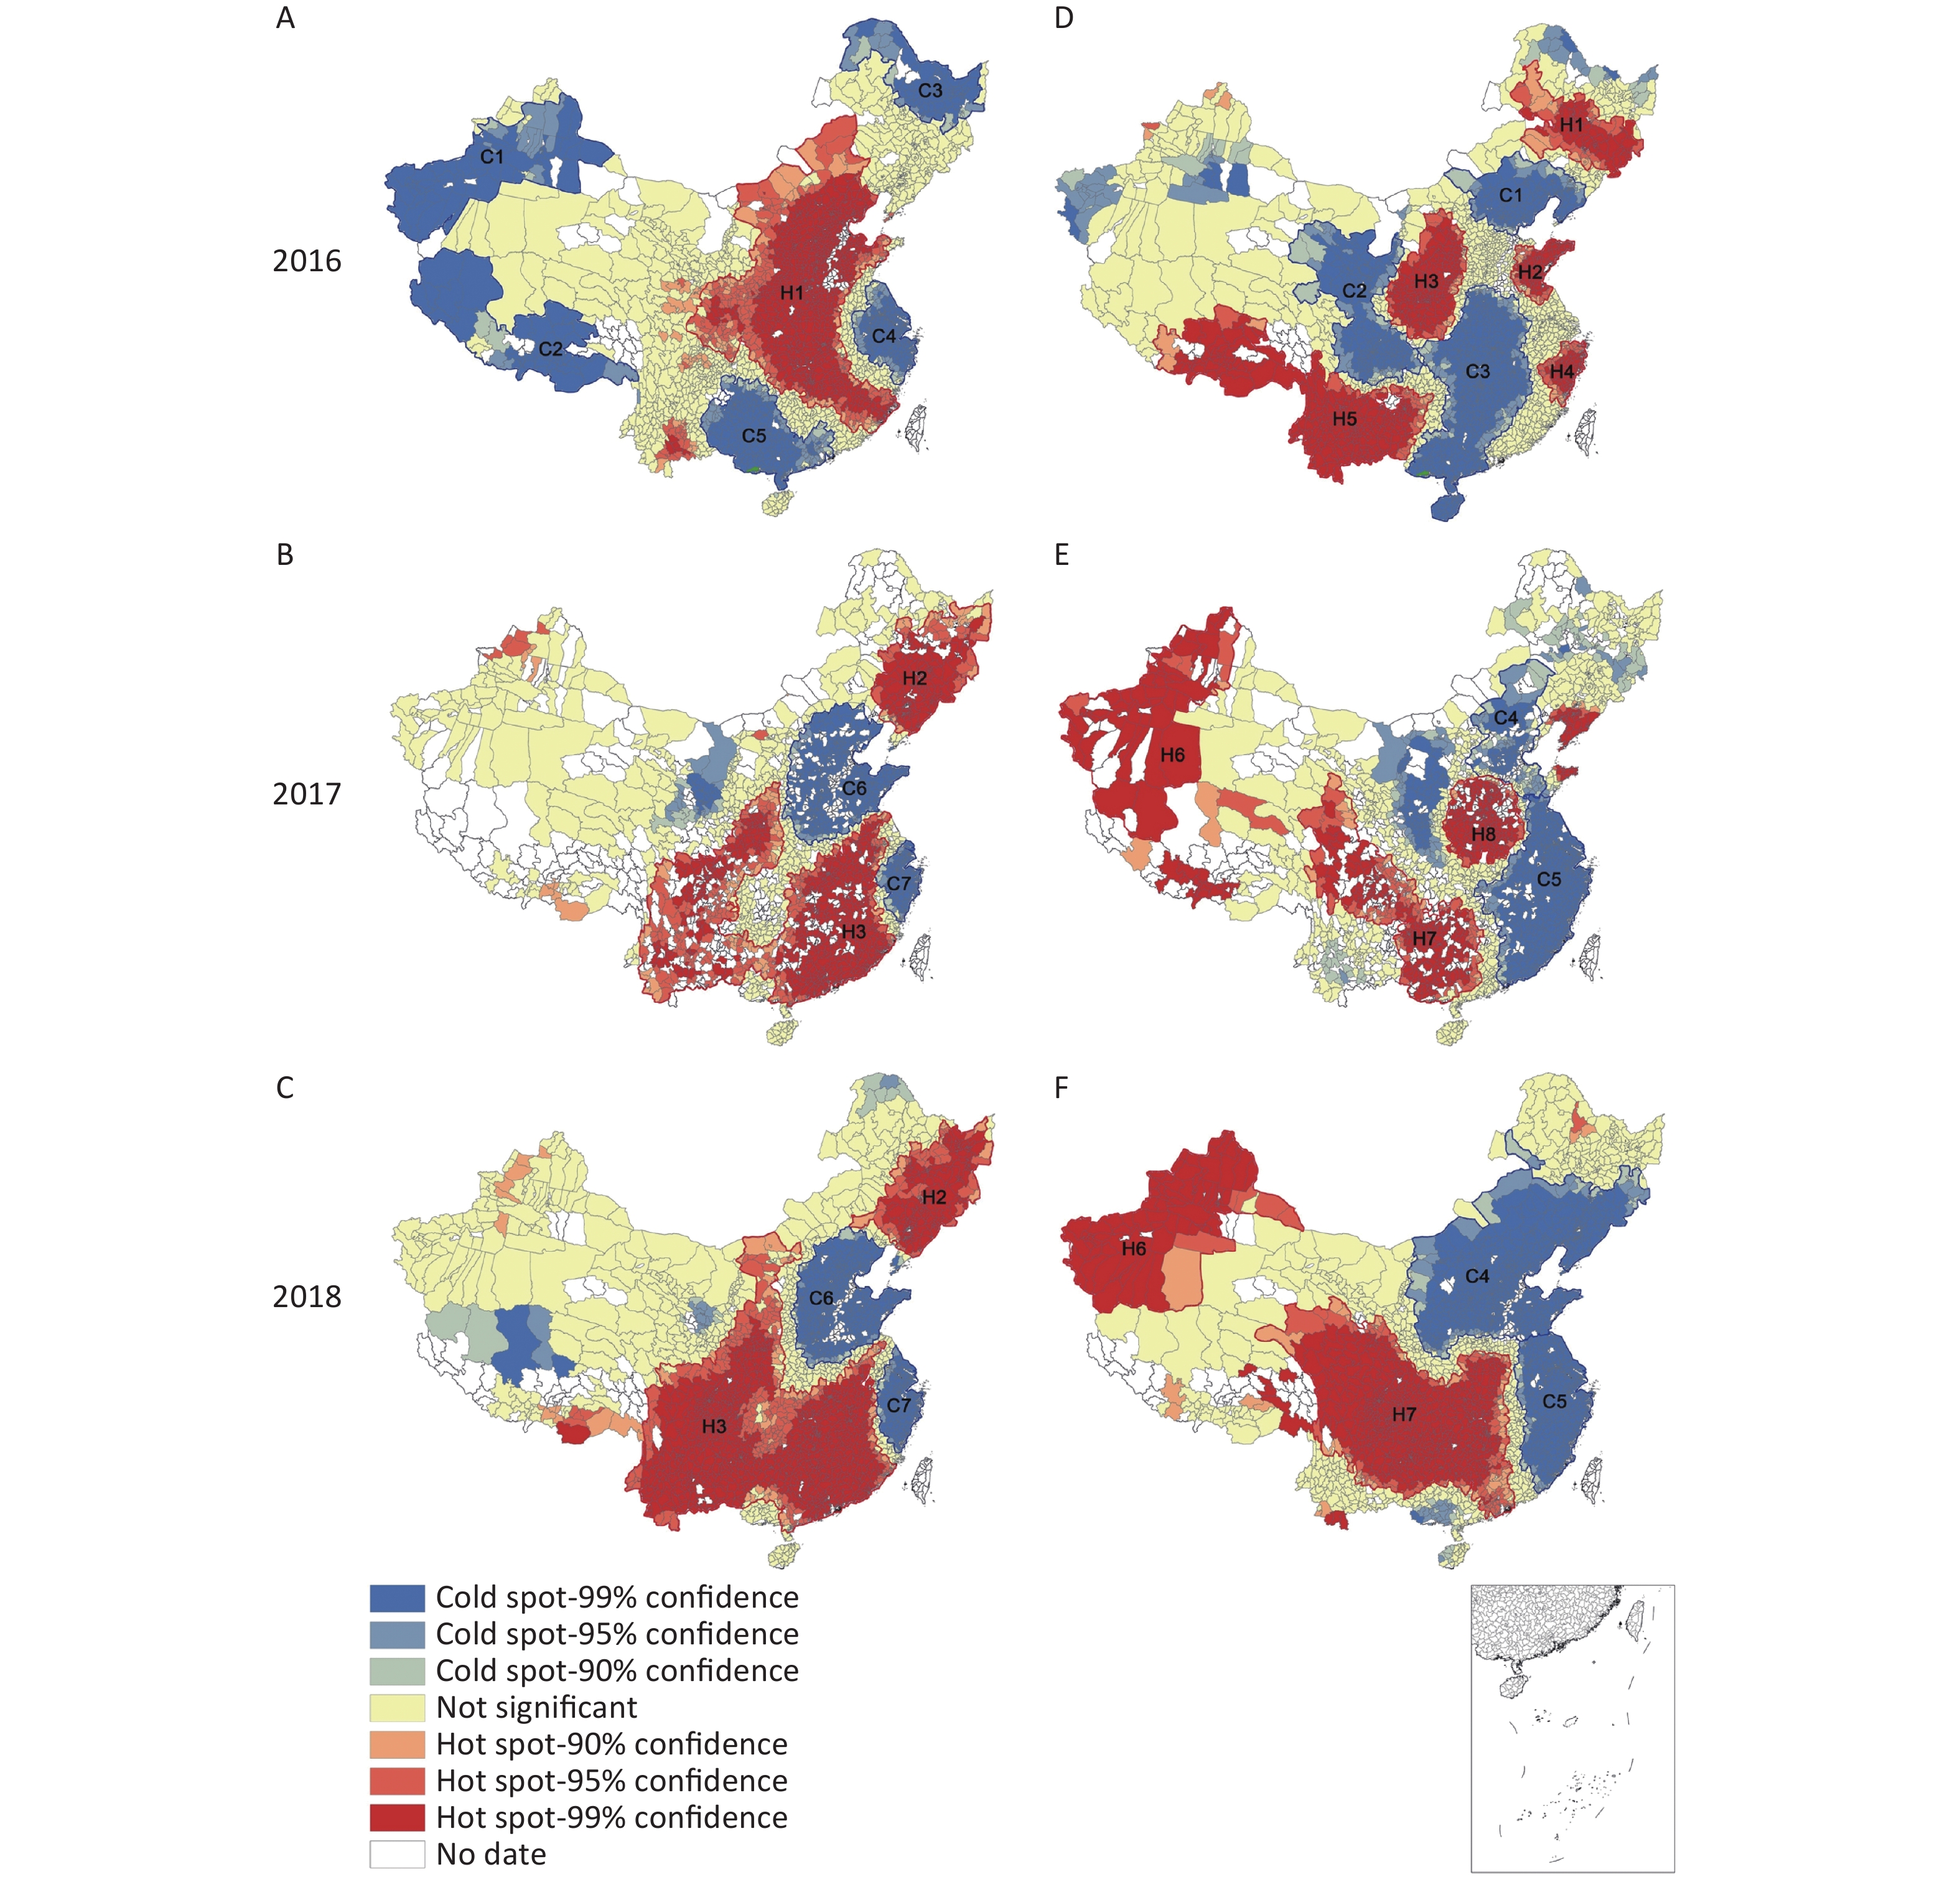
Figure 3. Local autocorrelation maps of the consumption rate of qualified iodized salt (CRQIS) and median of iodized salt (MIS) in 2016, 2017, and 2018. (A) Local autocorrelation map of CRQIS in 2016; (B) local autocorrelation map of CRQIS in 2017; (C) local autocorrelation map of CRQIS in 2018; (D) local autocorrelation map of MIS in 2016; (E) local autocorrelation map of MIS in 2017; (F) local autocorrelation map of MIS in 2018.
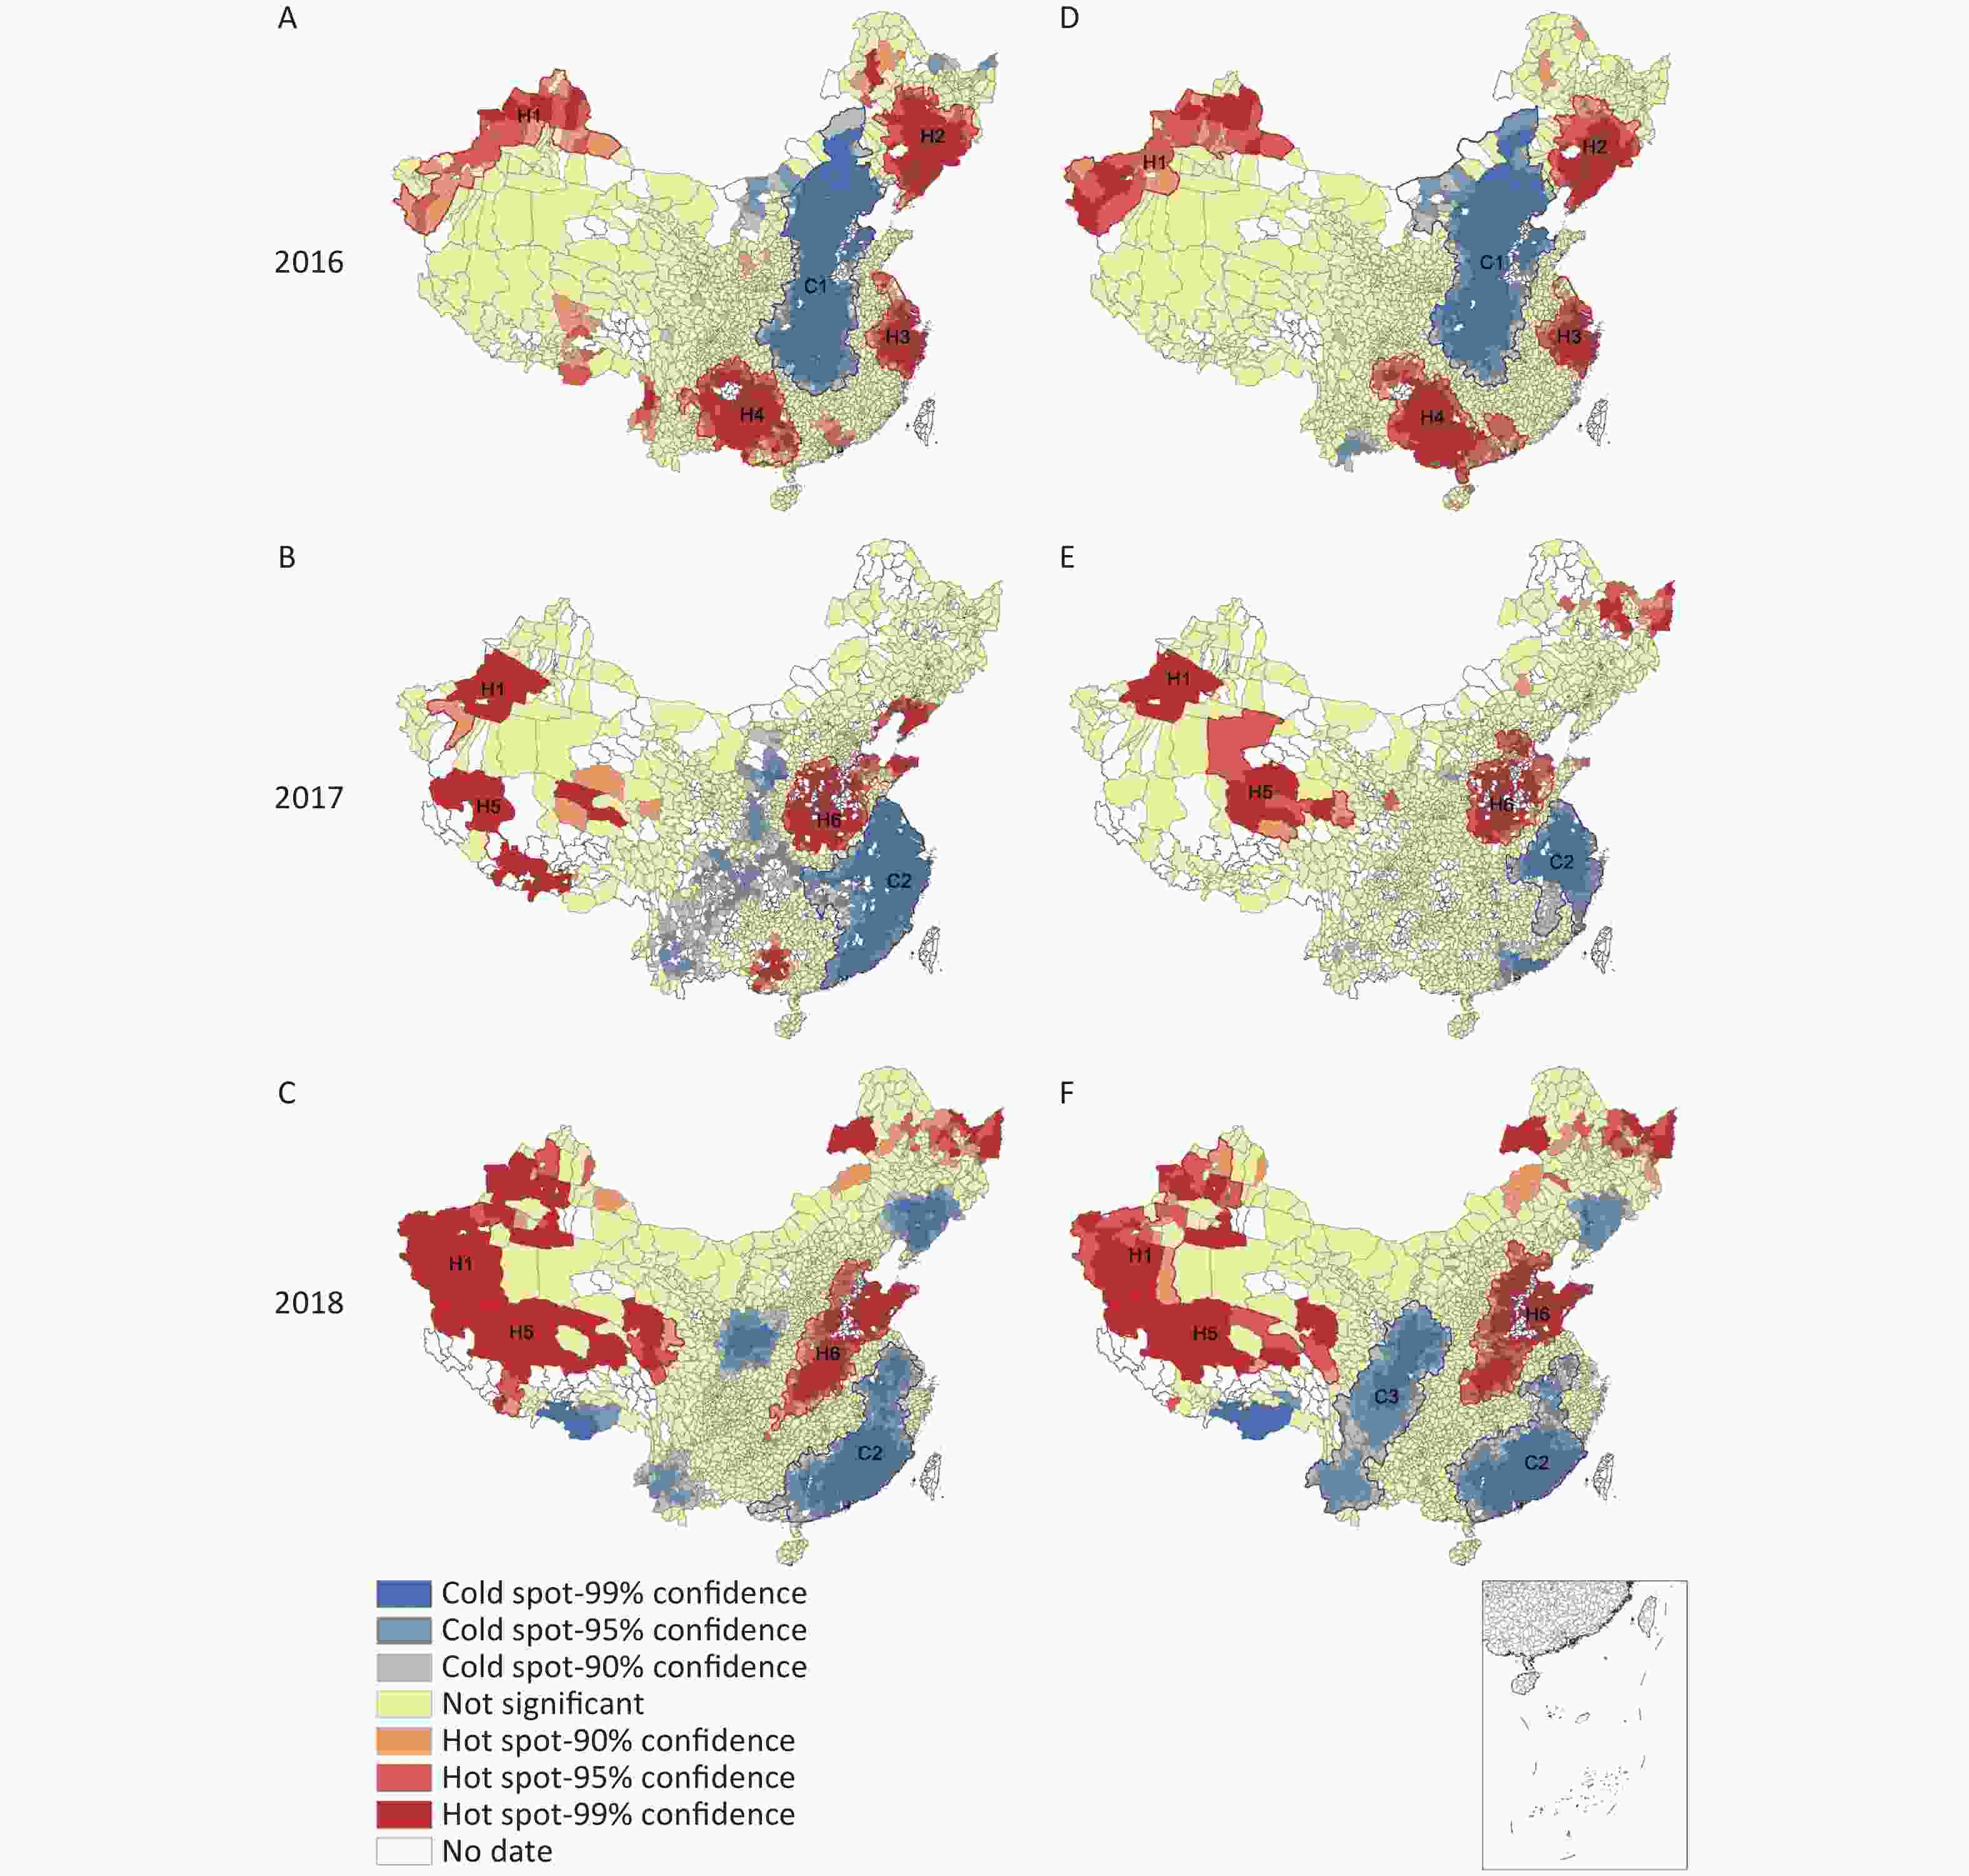
Figure 4. Local autocorrelation maps of the standard deviation (SD) and coefficient of variation (CV) in 2016, 2017, and 2018. (A) Local autocorrelation map of SD in 2016; (B) local autocorrelation map of SD in 2017; (C) local autocorrelation map of SD in 2018; (D) local autocorrelation map of CV in 2016; (E) local autocorrelation map of CV in 2017; (F) local autocorrelation map of CV in 2018.
CRIS (Figure 2A–2C) In 2016, there was one hot spot and four cold spots; in 2017, there were two hot spots and two cold spots; in 2018, the distribution of hot spots and cold spots was similar to that in 2017. From 2016 to 2018, the four major cold spots—C1, C2, C3, and C4—disappeared, and the new cold spots C5 and C6 appeared in 2017 and 2018. C5 was converted from a hot spot to a cold spot (areas around iodine-excess areas). The hot spot area spread from the original H1 to the southwest, forming H3, with the addition of H2, indicating a wider range of hot spots and higher iodized salt coverage.
RQIS (Figure 2D–2F) In 2016, the RQIS had one hot spot, H1, and three cold spots. In 2017, the RQIS had two hot spots and two cold spots. In 2018, a new cold spot was added, concentrated in C5 (including Ningxia and Gansu). From 2016 to 2018, hot spot H1 disappeared and eventually became a cold spot, and the RQIS decreased overall. The C1 cold spot area narrowed with the simultaneous development of two new hot spots, H2 and H3, whereas the RQIS increased.
CRQIS (Figure 3A–3C) Because the CRQIS is influenced by the CRIS, the distribution of CRQIS hot and cold spots was consistent with that of CRIS. From 2016 to 2018, the scope of the H1 hot spot narrowed; part of it became the C6 cold spot, and the CRQIS decreased. The C1, C2 and C3 cold spots disappeared or became hot spots. Hot spots spread to the southwest, forming H3 and adding H2, and the CRQIS increased. In 2018 the CRQIS increased significantly over that in 2017.
MIS (Figure 3D–3F) In 2016, there were five MIS hot spots and three cold spots; the distribution of MIS hot spots in 2017 and 2018 was similar, with two hot spots and two cold spots. Between 2016 and 2018, the hot spots H1, H2, H3 and H4 all disappeared or became cold spots, new hot spots H6 and H7 formed, and the MIS increased. The cold spot evolved from the original central C2 and C3 to the eastern coast, forming a wide area of cold spots C4 and C5, with decreasing MIS.
SD of SI (Figure 4A–4C) In 2016, there were four hot spots of the SD of SI, and one cold spot; in 2017 and 2018 there were two new hot spots, and the cold spots changed from C1 to C2 in the original central region. Between 2016 and 2018, all three hot spots—H2, H3 and H4—disappeared or even became cold spots, and the SD of SI became smaller.
CV of SI (Figure 4D–4F) The CV of SI was similar to the distribution of the cold spots and hot spots of the SD of SI. Between 2016 and 2018, hot spots H2, H3 and H4 disappeared or even became cold spots, while new hot spots H5 and H6 developed. The C1 cold spot gradually disappeared, and two new cold spots C2 and C3 emerged.
-
To prevent and control IDD, a series of surveillance and prevention measures have been undertaken in China. In this study, China’s large IDD surveillance dataset covering a period of 20 years was analyzed. The data included a large sample size and long time period, thus enabling accurate prediction. The results revealed adequate iodine nutrition, on the basis of adequate median UI excretion; a sustained decrease in the goiter rate; and an initial increase in the CRIS and CRQIS followed by a recent declining trend. The provision of salt with different levels of iodine to different provinces and the introduction of market competition in the salt industry may partially explain the recent decline in iodine nutrition parameters, as observed, for example, in coastal areas. The integration of time series and spatial epidemiology analysis techniques revealed new clues for IDD prediction and early warning, as well as spatial distribution characteristics that may facilitate monitoring, hence providing a more reliable basis for the formulation of policies and measures for the prevention and control of IDD.
-
Many indicators can be used to assess iodine status in a population, such as the MUI [23]. In this study, the MUI in children 8–10 years of age in China was adequate after three SI content adjustments. According to our predictions, the MUI is expected to continue to be adequate in the future, thus indicating that the current IDD prevention and control strategies are appropriate. However, this study also predicted that the MUI in children in eight provinces will decrease below 100 μg/L. In the future, applicable measures such as SI content adjustment should be undertaken in these provinces to prevent further decreases in the MUI.
The GR in children 8–10 years of age in China showed a decreasing trend. However, the predictions indicated that the GR in individual provinces may increase again. Any increases may require further intervention if the situation worsens. Targeted prevention and control measures are recommended to maintain the sustainability of IDD elimination. Moreover, health education and timely intervention measures should focus on residents of coastal areas. Strengthened supervision conducted by related departments of the government in China is recommended to ensure an effective iodine content in edible salt.
For the whole nation, the CRIS and the CRQIS began to decline gradually after 2012 and showed a dramatic decline in 2016 and 2017. For individual provinces, the CRIS and CRQIS in Tianjin, Hebei, Shanghai, Zhejiang, and Shandong significantly declined in recent years, for the following reasons: First, after the salt industry system reform, the number of outlets for non-iodized salt increased, thus making non-iodized salt easier to obtain and leading to an increase in the non-iodized salt rate. Second, with improvements in residents’ nutritional status, serious diseases caused by iodine deficiency have become relatively rare. Consequently, the public’s awareness of IDD has progressively decreased, and a small number of residents choose to consume non-iodized salt. Finally, these provinces are essentially coastal provinces or are in areas with water-borne iodine-excess, thus making supplementation with iodized salt more complicated. In several other provinces, such as Gansu and Ningxia, declining tendencies were observed; however, because these are not coastal provinces or provinces with iodine-excess areas, the decline in the CRIS and CRQIS might have been due to relaxation of iodized salt management. In summary, the improved IDD related indicators in recent years are closely associated with the adjustment of salt iodization policy and water improvement (changes to drinking water with lower iodine) in iodine-excess areas. Changes in IDD related indicators were also affected by policy adjustments, such as the new standard of iodine in salt and salt industry reform; therefore, modeling predictions should be redone if policy changes occur in the future.
-
Differences were observed between the spatial distribution of MIS and the MIS actually selected by each province, such as in Shanghai and Zhejiang[24]. The possible reasons for this difference are as follows. On one hand, in some areas, residents consumed both iodized and non-iodized salt; consequently, the iodine content in edible salt detected was > 5 mg/kg, i.e., the salt was iodized but below the provincial standard of iodine content in edible salt. On the other hand, owing to the wide range of qualified iodized salt concentrations, the qualified ranges of different SI standards have substantial overlap (21–33 mg/kg)[18], thus making cross-supplementation with two standard salts possible.
-
In this study, the results of spatial epidemiological analysis indicated differences in the spatial distribution of SI in coastal areas and in areas surrounding iodine-excess areas.
According to the above spatial autocorrelation analysis, in Shanghai, Zhejiang, Jiangsu and other coastal areas in 2017 and 2018, compared with 2016, the CRIS, CRQIS and MIS decreased and changed from hot spots to cold spots; moreover, the supply and consumption of iodized salt in coastal areas overall showed a decreasing trend. The SD and CV of SI in coastal areas changed from hot spots to cold spots, thus indicating that the MIS distribution had become more uniform.
The water-borne iodine-excess areas in China include eight provinces (municipalities and autonomous regions): Tianjin, Hebei, Shanxi, Inner Mongolia, Jiangsu, Anhui, Shandong and Henan, excluding provinces that have improved their water, such as Beijing, Fujian and Xinjiang[25]. In the above iodine-excess provinces, although the IDD survey excluded those iodine-excess areas, the CRIS, RQIS and CRQIS all decreased since 2017, changing from hot spots to cold spots or no agglomeration areas. Therefore, the supply of iodized salt has been affected by non-iodized salt in areas near iodine-excess areas in these provinces. The SD and CV of SI changed from cold spots to hot spots, thereby showing that the MIS distribution became more uneven, and cases may exist in which the MIS supplied is lower than the standard, or non-iodized salt is used.
-
The spatial distribution of SI was also affected by the reform of the salt industry system. The reforms increased the supply channels for iodized salt, thus potentially leading to a greater variety of salt and prices. However, the reforms might also have led to a decrease in the CRIS, thus severely interfering the quality and safety of the salt supply. The variety and price of salt may lead to instability of the salt supply in remote and poverty-stricken areas, economically underdeveloped areas, and areas with minority ethnic populations, and may lead to abnormal fluctuations in salt price, or even unjustified price behavior. According to the above spatial autocorrelation analysis, since 2017, residents have consumed more non-iodized salt in coastal areas such as Shanghai, Zhejiang and Jiangsu. The phenomenon of mixed sale of iodized and non-iodized salt existed in formerly high-iodine areas such as Beijing, Shandong, Tianjin, Hebei and Henan. At present, the CRIS remains good, and the iodized salt quality and supply are stable in areas with minority ethnic populations such as Xinjiang, Tibet and Guangxi. Our results suggest the following recommendations: the supply of qualified iodized salt should be ensured in accordance with the laws and regulations on salt iodization; the supply of iodized salt and non-iodized salt should be organized according to the water iodine concentration in different regions; iodine deficiency and iodine excess should be prevented, and the needs of special populations (more susceptible population to IDD, such as pregnant women and children) should be met.
-
The time series analysis of CRIS and CRQIS showed a decreasing tendency in China, thus prompting concerns regarding IDD prevention. Data from several countries have indicated that IDD has begun to recur in some countries, due to inadequate salt iodization in developed countries, such as the United States, Australia and New Zealand, as well as other countries including Azerbaijan and Thailand[7-10].
Other countries may also experience the same problems as China in IDD control. The measures that China has taken, such as supplying different types of salt in regions with different water iodine levels, selecting different salt contents for different provinces, and reforming the salt industry system by introducing a market competition mechanism, may provide experience and lessons for other countries. Meanwhile, China must continue to strengthen the supply and monitoring of iodized salt to prevent the recurrence of IDD.
-
In this research, IDD surveillance data spanning more than 20 years were analyzed; the data included a large sample size and long time period, thus enabling accurate prediction. However, this study also has some limitations. First, the sampling method changed in the multi-year IDD surveillance. Second, the criteria for the implementation of CRQIS varied slightly. Third, because some monitoring was not performed continually every year during the analysis, missing data were supplemented with complementary values for some indexes.
In conclusion, IDD prevalence has been successfully controlled for a long time period in China, and iodine nutrition has shown a gradual improvement. However, a recent decline in iodized salt consumption has been observed in some areas following changes in the iodized salt supply in China. In the future, regulations concerning salt management should be strengthened to prevent the recurrence of IDD.
HTML
Sampling Methods of Surveys
Data Sources
Diagnostic Criteria
Statistical Analysis
Ethics Committee Approval
Time Series Trends and Predictions
Spatial Autocorrelation Analysis
Global Spatial Autocorrelation Analysis
Local Spatial Autocorrelation Analysis
Time Series Analysis
Space Epidemiological Analysis
Relationship between MIS Standards in different Regions of China and the Actual MIS
Coastal Areas and Iodine excess Areas
Reform of the Salt Industry System
Comparison with other Countries
Strengths and Limitations
 21348Supplementary Materials.pdf
|

|

 Quick Links
 DownLoad: