


-
Nonalcoholic fatty liver disease (NAFLD) is a severe form of chronic liver disease [1,2] and represents a spectrum of conditions ranging from simple hepatic steatosis to nonalcoholic steatohepatitis, cirrhosis, and hepatocellular carcinoma [3]. The prevalence of NAFLD is approximately 29.81% in China [4]. As a hepatic manifestation of metabolic syndrome, NAFLD is closely associated with insulin resistance (IR) [5], type 2 diabetes mellitus (T2DM) [6], cardiovascular disease [7] and other chronic diseases [8]. To date, no specific therapy for NAFLD has been approved. Therefore, early screening and prevention are crucial for patients with NAFLD.
NAFLD is closely related to lipid metabolism disorders, including high-density lipoprotein cholesterol (HDL-C) [9]. HDL-C has anti-inflammatory and antioxidant properties, and decreased concentrations of HDL-C is associated with insulin resistance (IR)[10], which is a key pathogenesis of NAFLD[11]. Studies conducted by Nemes et al. have revealed that patients with NAFLD usually have low HDL-C concentrations[12-14]. Apart from lipid abnormalities, serum uric acid (SUA) is associated with the occurrence and progression of NAFLD [15]. Several studies have revealed that compared with the general population, subjects with higher SUA levels are more likely to develop NAFLD [16-19]. Recent studies have investigated the associations between SUA to HDL-C ratio (UHR) and chronic metabolic diseases[20-24]. Koncak et al. reported that compared with HDL-C, waist circumference, and fasting plasma glucose levels, UHR was a stronger predictor of MS [20]. A case-control study indicated that UHR is a promising predictor of diabetic control among men with T2DM [21]. Another case-control study demonstrated that UHR is a reliable and useful marker for Hashimoto's thyroiditis [22]. Besides, a cross-sectional cohort study indicated that elevated UHR levels could be associated with poor blood pressure control in these patients with hypertension [23]. Furthermore, a cross-sectional study involving 6,285 lean Chinese adults showed a positive association between UHR and the risk of NAFLD [24].
To date, data on the association between UHR and the risk of NAFLD are limited, and no study has explored the dose-response association between UHR and NAFLD. Accordingly, this case-control study was conducted to establish the association between UHR and the risk of NAFLD as well as explore the dose-response association between the two.
-
This case-control study involved Han Chinese participants (age, 20–70 years) who were recruited from the Medical Examination Center of the Affiliated Hospital of Qingdao University, China, between January and December 2016. A questionnaire survey was administered to all participants, and abdominal ultrasound examination and blood biochemical tests were performed for the diagnosis of NAFLD. Participants exhibiting any of the following behaviors or symptoms were excluded: 1) body mass index (BMI) < 18.5 kg/m2; 2) excessive alcohol consumption (> 140 g/week for men and > 70 g/week for women); 3) unexplained increases in liver enzyme or transaminase levels, three times higher than the upper limit of normal values (normal range, 0–39 U/L); and 4) the presence of an autoimmune or self-reported history of viral or other forms of chronic liver disease. Healthy control samples were derived from the same center during the same study period (Figure 1). The study was approved by the Ethics Committee of Qingdao Medical University (approval number: 20130304; clinical trial registration number: ChiCTR-OCS-14004819).
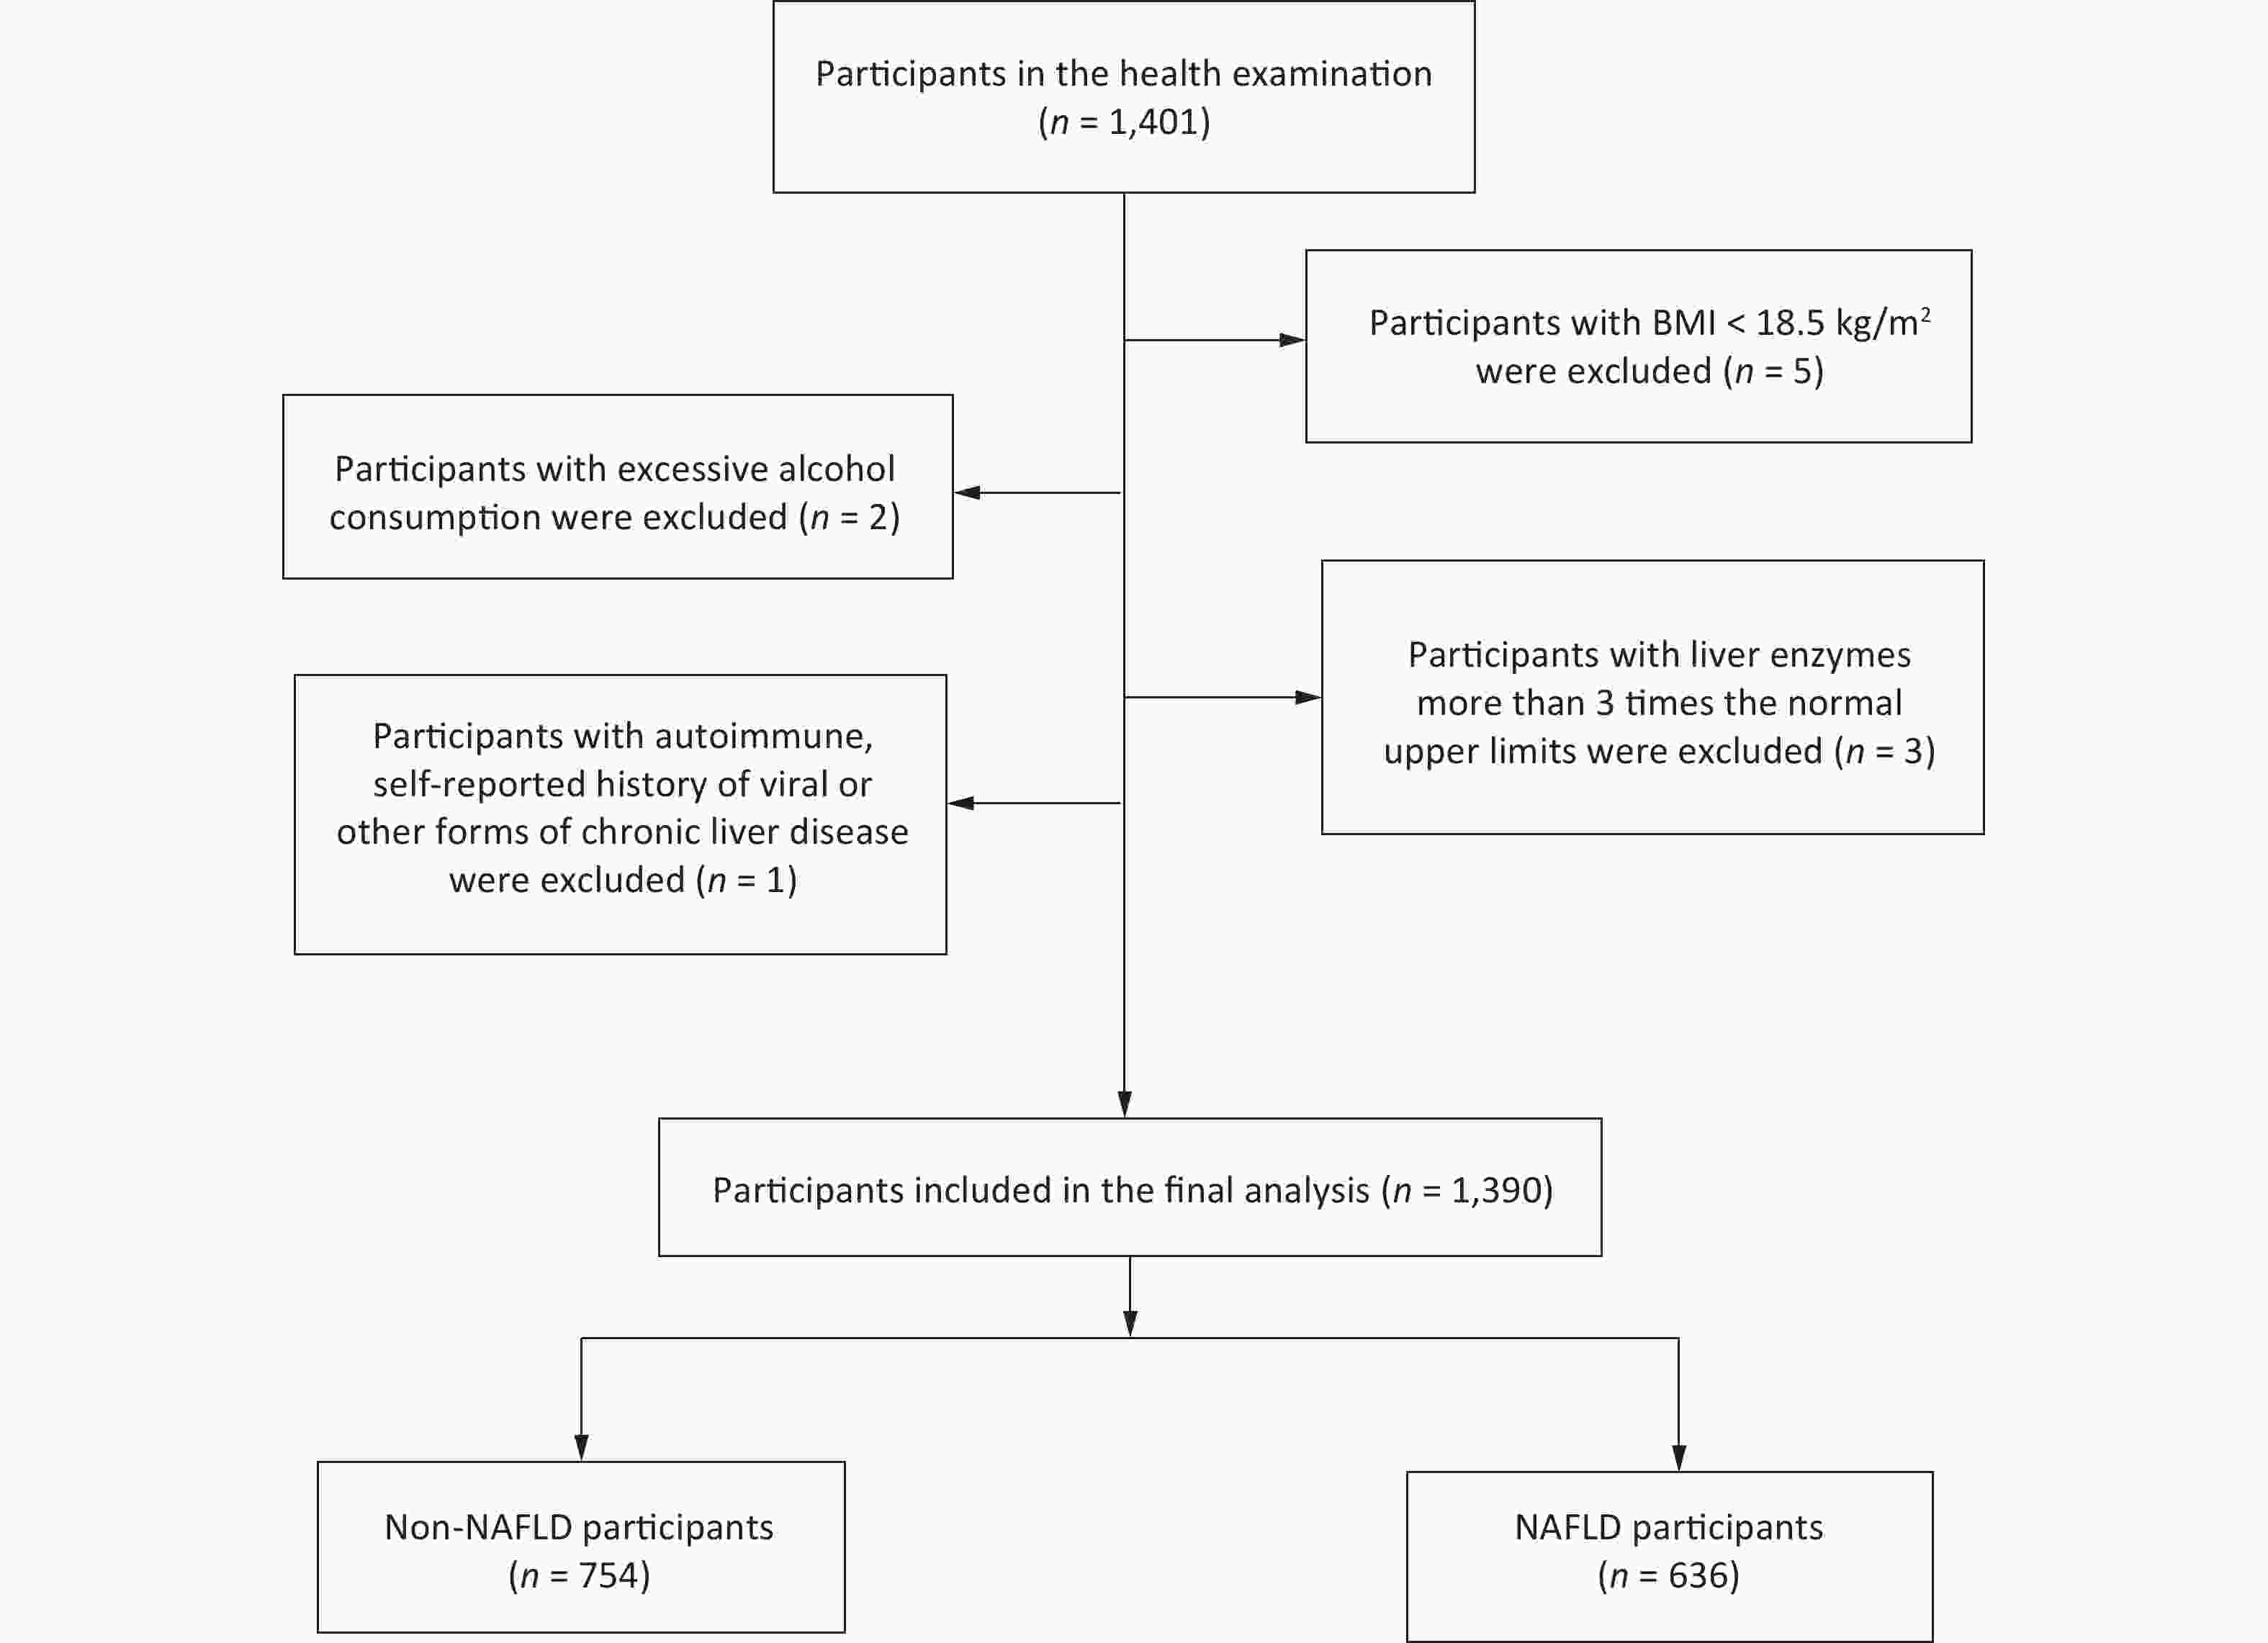
Figure 1. Flowchart of participant selection.
-
All participants underwent a complete physical examination in the morning after a 12-hour overnight fast. Standardized questionnaires were used to collect information related to age, sex, smoking habits, and alcohol consumption. Alcohol consumption was assessed according to the frequency of alcohol intake per week and the usual amount of alcohol consumed per occasion. Height and body weight were measured using standardized procedures. BMI was calculated as weight (in kg) divided by height (in m2) and classified into two categories: normal weight (18.5 ≤ BMI < 24 kg/m2) and overweight or obese (BMI ≥ 24 kg/m2). Systolic and diastolic blood pressures were measured using a standard mercurial sphygmomanometer after a 10-minute rest period in the sitting position. Overnight fasting blood samples were obtained for the analysis of biochemical variables, including serum aspartate aminotransferase (AST), alanine aminotransferase (ALT), SUA, serum fasting blood glucose (FBG), total cholesterol (TC), triglyceride (TG), low-density lipoprotein cholesterol (LDL-C), and HDL-C levels, which were measured using an automatic analyzer (Beckman CX-7 Biochemical Autoanalyzer; Brea, CA, USA).
-
Hepatic steatosis was diagnosed by trained technicians according to the abdominal ultrasound results. The ultrasound diagnosis of fatty liver was based on the criteria proposed by the Chinese Society of Endocrinology [25]. The presence of diabetes was defined as FBG levels of ≥ 7.0 mmol/L, self-reported diagnosis of diabetes, or current use of antidiabetes treatment [26]. Hypertension was defined as a systolic blood pressure of ≥ 140 mmHg and/or diastolic blood pressure if ≥ 90 mmHg, current use of antihypertension treatment, or a history of hypertension [27].
-
The Kolmogorov-Smirnov normality test was used to assess the normality of continuous variables. The participants’ baseline characteristics are presented as medians (interquartile ranges) for continuous variables and numbers (percentages) for categorical variables. According to the characteristics of the variables, the Mann-Whitney U-test or the Chi-square test was applied to compare participants with and without NAFLD. UHR was categorized into quartiles: quartile 1, < 25th percentile; quartile 2, ≥ 25th to 50th percentile; quartile 3, ≥ 50th to 75th percentile; and quartile 4, ≥ 75th percentile. Using binary logistic regression analysis, we calculated odds ratios (ORs) along with 95% confidence intervals (CIs) to determine the association between UHR and the risk of NAFLD. In the binary logistic regression analysis, model 1 was adjusted for age, sex, and BMI. Model 2 was adjusted for age; sex; BMI; current smoking habits; diabetes; hypertension; and TG, TC, and LDL-C levels. To evaluate the association between UHR and the risk of NAFLD, stratified analyses were performed according to age (< 50 years and ≥ 50 years), sex (men and women), and BMI (18.5 ≤ BMI < 24.0 kg/m2 and BMI ≥ 24.0 kg/m2). The dose-response association was evaluated using a restricted cubic spline function, with three knots located at the 5th, 50th, and 95th percentiles of the exposure distribution in the fully adjusted model. The nonlinear P value was calculated by testing the value of the quadratic zero spline coefficient. All statistical analyses were conducted using Stata version 15.0 (Stata Corp., College Station, Texas, USA). A two-tailed P value of < 0.05 was considered to indicate statistical significance.
-
A total of 1,390 participants were included (636 NAFLD and 754 non-NAFLD) in this study (Figure 1). Table 1 presents a comparison of the clinical characteristics of the participants with or without NAFLD. Compared with the controls, the patients with NAFLD tended to be older; to be men; to be current smokers; and to have higher BMI, serum FBG, ALT, AST, TG, TC, LDL-C, SUA, and UHR levels. However, they had lower HDL-C levels. Moreover, compared with the controls, the patients with NAFLD were more likely to have diabetes and hypertension.
Characteristics Non-NAFLD (n = 754) NAFLD (n = 636) P value Age (years) 50 (44, 57) 52 (45, 58) 0.004 BMI (kg/m2) 23.8 (22.0, 25.6) 26.6 (25.0, 28.7) < 0.001 ALT (U/L) 18 (14, 24) 24 (19, 36) < 0.001 AST (U/L) 19 (16, 21) 20 (17, 24) < 0.001 FPG (mmol/L) 5.0 (4.8, 5.4) 5.4 (5.0, 6.0) < 0.001 TG (mg/dL) 74.4 (53.2, 108.1) 128.0 (90.4, 187.8) < 0.001 TC (mg/dL) 202.2 (176.9, 228.8) 208.6 (185.1, 238.8) < 0.001 LDL-C (mg/dL) 115.7 (99.8, 135.5) 124.2 (106.5, 145.4) < 0.001 HDL-C (mg/dL) 57.1 (49.2, 67.3) 49.5 (43.7, 56.5) < 0.001 SUA (mg/dL) 4.8 (4.0, 5.7) 5.7 (4.9, 6.7) < 0.001 UHR (%) 8.5 (6.3, 10.9) 11.8 (9.1, 14.2) < 0.001 Sex Men, n (%) 330 (43.8) 400 (62.9) < 0.001 Women, n (%) 424 (56.2) 236 (37.1) < 0.001 Current smoking Yes, n (%) 59 (7.8) 88 (13.8) < 0.001 No, n (%) 695 (92.2) 548 (86.2) < 0.001 Diabetes Yes, n (%) 47 (6.2) 76 (11.9) < 0.001 No, n (%) 707 (93.8) 560 (88.1) < 0.001 Hypertension Yes, n (%) 134 (17.8) 217 (34.1) < 0.001 No, n (%) 620 (82.2) 419 (65.9) < 0.001 Note. Data are presented as median (interquartile range) or number (percentage). ALT, alanine aminotransferase; AST, aspartate aminotransferase; FPG, fasting plasma glucose; TG, triglyceride; TC, total cholesterol; LDL-C, low density lipoprotein cholesterol; HDL-C, high density lipoprotein cholesterol; SUA, serum uric acid; UHR, serum uric acid to HDL-C ratio; NAFLD, non-alcoholic fatty liver disease. Table 1. Clinical characteristics of participants by NAFLD
In the unadjusted model, in the comparison of the highest quartile versus the lowest quartile, UHR (OR = 9.964, 95% CI: 6.994–14.194) was associated with an increased risk of NAFLD (Table 2). Even after adjustment for age, sex, and BMI (model 1), the results (OR = 6.785, 95% CI: 4.327–10.640) remained similar to the crude OR. UHR was still significantly and positively associated with the risk of NAFLD (OR = 3.888, 95% CI: 2.324–6.504; P < 0.05) after further adjustments for more potential confounders, including current smoking status; hypertension; diabetes; and TG, TC, and LDL levels.
NAFLD OR (95% CI) Crude Model 1 Model 2 Quartile 1 (< 7.3505) 1.00 (Ref.) 1.00 (Ref.) 1.00 (Ref.) Quartile 2 (7.3505–9.7471) 2.861 (2.028–4.038)*** 2.322 (1.583–3.405)*** 1.912 (1.273–2.872)** Quartile 3 (9.7471–12.9786) 5.199 (3.691–7.322)*** 3.771 (2.503–5.681)*** 2.635 (1.674–4.149)*** Quartile 4 (≥ 12.9786) 9.964 (6.994–14.194)*** 6.785 (4.327–10.640)*** 3.888 (2.324–6.504)*** Note. CI, confidence interval; OR, odds ratio; model 1 adjusted for age, sex, BMI; model 2 adjusted for age, sex, BMI, current smoking, diabetes, hypertension, TG, TC, LDL; BMI, body mass index; TG, triglyceride; TC, total cholesterol; LDL-C, low density lipoprotein cholesterol; UHR, serum uric acid to HDL-C ratio; NAFLD, non-alcoholic fatty liver disease. **P < 0.01; ***P < 0.001. Table 2. ORs and 95% CIs for NAFLD according to quartiles of UHR in the study population
The associations between UHR and the risk of NAFLD among the different subgroups are presented in Tables 3–5. In the analyses stratified by sex, the multivariate ORs (95% CIs) for NAFLD in the highest quartile of UHR versus those in the lowest quartile were 2.374 (1.344–4.196) and 3.011 (1.538–5.894) men and women, respectively. In the analyses stratified by age, the multivariate OR (95% CI) for NAFLD in the highest quartile versus that for NAFLD in the lowest quartile of UHR was 7.534 (2.916–19.465) for participants aged < 50 years. The OR (95% CI) was 3.063 (1.642–5.714) for participants aged ≥ 50 years. The analyses stratified by BMI indicated that the association between UHR and the risk of NAFLD was more pronounced in participants with a BMI of ≥ 24.0 kg/m2, and the corresponding OR (95% CI) for NAFLD was 1.634 (1.084–2.462) in quartile 2, 2.692 (1.657–4.372) in quartile 3, and 3.402 (1.974–5.864) in quartile 4 (model 2). For participants with 18.5 ≤ BMI < 24.0 kg/m2, no significant association was observed between UHR and the risk of NAFLD.
NAFLD OR (95% CI) Crude Model 1 Model 2 Men UHR quartile Quartile 1 (< 9.7656) 1.00 (Ref.) 1.00 (Ref.) 1.00 (Ref.) Quartile 2 (9.7656–12.2748) 1.788 (1.174–2.725)** 1.354 (0.849–2.159) 1.169 (0.711–1.922) Quartile 3 (12.2748–14.6127) 2.980 (1.946–4.563)*** 2.065 (1.293–3.298)** 1.598 (0.956–2.672) Quartile 4 (≥ 14.6127) 5.585 (3.551–8.783)*** 3.301 (2.007–5.432)*** 2.374 (1.344–4.196)** Women UHR quartile Quartile 1 (< 5.8793) 1.00 (Ref.) 1.00 (Ref.) 1.00 (Ref.) Quartile 2 (5.8793–7.6255) 1.376 (0.789–2.400) 1.019 (0.559–1.856) 0.836 (0.439–1.595) Quartile 3 (7.6255–9.4763) 3.583 (2.139–6.002)*** 2.469 (1.411–4.319)** 1.614 (0.855–3.045) Quartile 4 (≥ 9.4763) 9.183 (5.454–15.461)*** 5.799 (3.305–10.176)*** 3.011 (1.538–5.894)** Note. CI, confidence interval; OR, odds ratio; model 1 adjusted for age, BMI; model 2 adjusted for age, BMI current smoking, diabetes, hypertension, TG, TC, LDL; UHR, serum uric acid to HDL-C ratio; NAFLD, nonalcoholic fatty liver disease; BMI, body mass index; TG, triglyceride; TC, total cholesterol; LDL-C, low density lipoprotein cholesterol. **P < 0.01; ***P < 0.001. Table 3. ORs and 95% CIs for NAFLD according to quartiles of UHR in the study population, stratified by sex
NAFLD OR (95% CI) Crude Model 1 Model 2 < 50 years UHR quartile Quartile 1 (< 7.0953) 1.00 (Ref.) 1.00 (Ref.) 1.00 (Ref.) Quartile 2 (7.0953–9.6465) 4.951 (2.601–9.426)*** 3.500 (1.713–7.148)** 3.294 (1.532–7.086)** Quartile 3 (9.6465–13.2329) 10.000 (5.306–18.846)*** 5.694 (2.678–12.104)*** 4.332 (1.868–10.045)** Quartile 4 (≥ 13.2329) 28.500 (14.775–54.973)*** 11.169 (4.863–25.655)*** 7.534 (2.916–19.465)*** ≥ 50 years UHR quartile Quartile 1 (< 7.4813) 1.00 (Ref.) 1.00 (Ref.) 1.00 (Ref.) Quartile 2 (7.4813–9.7943) 2.148 (1.405–3.283)*** 1.993 (1.249–3.180)** 1.589 (0.968–2.608) Quartile 3 (9.7943–12.7691) 3.459 (2.262–5.291)*** 3.113 (1.891–5.124)*** 2.113 (1.215–3.673)** Quartile 4 (≥ 12.7691) 5.451 (3.523–8.433)*** 5.374 (3.131–9.224)*** 3.063 (1.642–5.714)*** Note. CI, confidence interval; OR, odds ratio; model 1 adjusted for sex, BMI; model 2 adjusted for sex, BMI, current smoking, diabetes, hypertension, TG, TC, LDL; UHR, serum uric acid to HDL-C ratio; NAFLD, nonalcoholic fatty liver disease; BMI, body mass index; TG, triglyceride; TC, total cholesterol; LDL-C, low density lipoprotein cholesterol. **P < 0.01; ***P < 0.001. Table 4. ORs and 95% CIs for NAFLD according to quartiles of UHR in the study population, stratified by age
NAFLD OR (95% CI) Crude Model 1 Model 2 18.5 ≤ BMI < 24 kg/m2 UHR quartile Quartile 1 (< 5.9387) 1.00 (Ref.) 1.00 (Ref.) 1.00 (Ref.) Quartile 2 (5.9387–7.9763) 0.991 (0.426–2.303) 0.936 (0.395–2.217) 0.821 (0.323–2.087) Quartile 3 (7.9763–10.1011) 2.002 (0.941–4.258) 2.039 (0.922–4.512) 1.409 (0.576–3.443) Quartile 4 (≥ 10.1011) 3.422 (1.667–7.023)** 4.459 (1.950–10.194)*** 2.356 (0.875–6.350) BMI ≥ 24 kg/m2 UHR quartile Quartile 1 (< 8.4785) 1.00 (Ref.) 1.00 (Ref.) 1.00 (Ref.) Quartile 2 (8.4785–11.0559) 1.858 (1.281–2.695)** 1.999 (1.360–2.939)*** 1.634 (1.084–2.462)* Quartile 3 (11.0559–13.7527) 3.488 (2.365–5.144)*** 4.082 (2.624–6.351)*** 2.692 (1.657–4.372)*** Quartile 4 (≥ 13.7527) 4.793 (3.196–7.188)*** 5.800 (3.601–9.343)*** 3.402 (1.974–5.864)*** Note. CI, confidence interval; OR, odds ratio; model 1 adjusted for age, sex; model 2 adjusted for age, sex, current smoking, diabetes, hypertension, TG, TC, LDL; UHR, serum uric acid to HDL-C ratio; NAFLD, nonalcoholic fatty liver disease; BMI, body mass index; TG, triglyceride; TC, total cholesterol; LDL-C, low density lipoprotein cholesterol. *P < 0.05; **P < 0.01; ***P < 0.001.otein cholesterol. *P < 0.05; **P < 0.01; ***P < 0.001. Table 5. ORs and 95% CIs for NAFLD according to quartiles of UHR in the study population, stratified by BMI
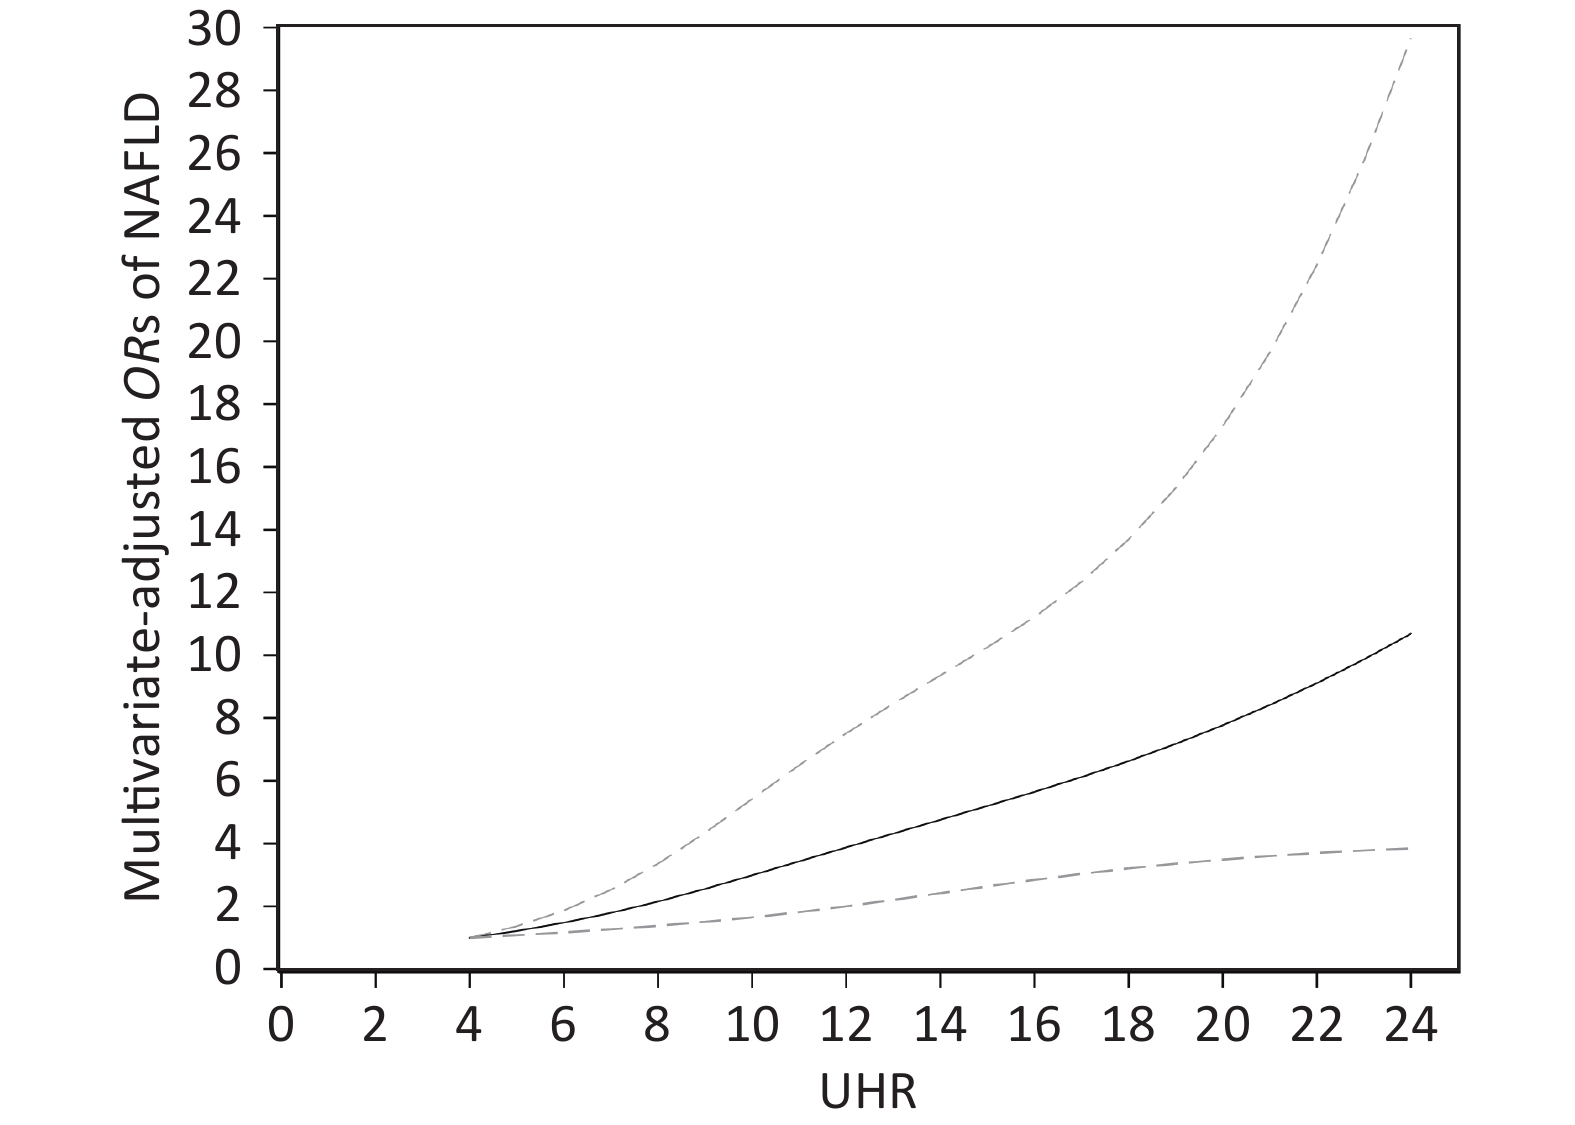
The dose-response association between UHR and the risk of NAFLD in the restricted cubic spline model is displayed in Figure 2. UHR was linearly and positively associated with the risk of NAFLD (P for nonlinearity = 0.193). When the UHR index was 5, the OR value tended to be lowest (OR = 1.22, 95% CI: 1.08–1.37).

Figure 2. Dose-response relationship between UHR and the risk of NAFLD. Adjustments were made according to age, sex, BMI, current smoking, diabetes, hypertension, TG, TC, LDL; UHR, serum uric acid to HDL-C ratio; NAFLD, nonalcoholic fatty liver disease; BMI, body mass index; TG, triglyceride; TC, total cholesterol; LDL-C, low density lipoprotein cholesterol. The solid line and the dotted line represent the estimated OR and the corresponding 95% CI, respectively; OR, odds ratio.
-
In this case-control study, we observed a positive association between UHR and the risk of NAFLD among Chinese adults, even after adjustment for multiple potential confounders (age; sex; BMI; current smoking habits; diabetes; hypertension; and TG, TC, and LDL-C levels). In the analyses stratified by sex and age, a significant positive association between UHR and the risk of NAFLD was observed in the various sex and age subgroups. However, in the analyses stratified by BMI, a positive association was observed only in participants with a BMI of ≥ 24 kg/m2 after adjustment for confounding factors; furthermore, a linear positive association between UHR and the risk of NAFLD was observed among these participants. To the best of our knowledge, our study is the first to explore the dose-response association between UHR and the risk of NAFLD.
SUA and HDL-C are the two most crucial metabolic variables that are altered in a fatty liver. As an end product of purine metabolism, elevated SUA levels increase the risk of NAFLD [28] and are considered to constitute an independent risk factor for the development of NAFLD and the aggravation of liver damage [29-31]. HDL-C is mainly synthesized in the liver, and HDL-C levels decline owing to a lack of exercise [32], smoking [33], obesity [34], and diabetes [35], which are risk factors for NAFLD. Patients with NAFLD often exhibit lower HDL-C levels than do patients without NAFLD [36,37]. Several recent studies have reported that UHR was closely associated with metabolic diseases. Kocak et al. conducted a case-control study including 100 patients with diabetes and demonstrated that UHR was a stronger predictor of MS compared with other established criteria [20]. A study conducted on 159 men with T2DM revealed that UHR is a promising index for predicting diabetic control [21]. A cross-sectional study including 6,285 lean Chinese participants revealed that UHR was significantly associated with NAFLD [24]. Furthermore, Kosekli et al. showed that compared with controls, patients with NAFLD had higher UHR levels [38]. These results are consistent with our finding of a positive association between UHR and the risk of NAFLD. To the best of our knowledge, our study is the first to explore the association between UHR and the risk of NAFLD by using analyses stratified by sex, age, and BMI. As a routine detection variable in clinical settings, UHR is a reliable and noninvasive marker for predicting NAFLD among Chinese adults. Although the mechanisms underlying the association between UHR and the increased risk of NAFLD are not fully understood, inflammation and insulin resistance have been reported as potential mediators. High SUA levels increased proinflammatory factor production and insulin resistance [39], and insulin resistance could reduce the concentration of HDL-C [10]. Therefore, insulin resistance and inflammation, both of which play key roles in the pathophysiological process of NAFLD [11,40], may be responsible for the association between high SUA/HDL-C levels and the risk of NAFLD.
Our study has several strengths. First, the relatively large sample size enhances the statistical power and reliability of our results. Second, we conducted stratified analyses to clearly understand the association between UHR and the risk of NAFLD in different subgroups of the study population. Third, the positive association between UHR and the risk of NAFLD was statistically significant even after adjustment for potential confounders. Our study also has several limitations. First, this was a case-control study. Therefore, the causal association between UHR and the risk of NAFLD could not be precisely identified. We recommend that future studies conduct long-term cohort assessments in a larger population. Second, although ultrasound scanning is highly sensitive and specific in identifying fatty liver, it is not the gold standard for NAFLD diagnosis. Third, incomplete adjustment processes may cause residual confusions. Lastly, extrapolating the findings to the Chinese general population should be interpreted cautiously since the participants of this study only came from Qingdao.
In conclusion, UHR was positively associated with the risk of NAFLD and may serve as an innovative and noninvasive marker for identifying individuals at risk of NAFLD.
-
The authors declare no competing interests.
-
All the authors listed have read and approved the manuscript that is enclosed. SUN Yong Ye designed the study. QIU Xia, LI Hua Zi, and CUI Jia Jia acquired the data. ZHAO Hui analyzed the data and drafted the manuscript. SUN Yong Ye critically revised the manuscript.
Funds:
This study was supported by the Natural Science Foundation of China [No. 81703206, No. 81973015] and Science and Technology Program of Qingdao [No. 19-6-1-52-nsh]

 Quick Links
 DownLoad: