


-
In human biological monitoring involving measuring chemicals or their metabolites in urine to estimate their exposures, urinary creatinine (Ucr) is commonly used to determine the acceptability of spot urine specimens and to adjust for variations in dilution of these specimens. Chemical concentrations in spot urine samples are affected greatly by hydration-driven dilution variation [1, 2]. Measurement of chemicals in urine samples that are either extremely diluted or concentrated can lead to misinterpretation. The World Health Organization (WHO) recommends that urine samples with a Ucr concentration < 0.3 g/L or > 3.0 g/L should be discarded, and another sample collected when possible [3]. The guidelines intended for use in the practice of industrial hygiene have been adopted by other scientific organizations that focus on occupational or environmental health [4, 5], and also by numerous of general population-based studies [6-8]. Creatinine is a metabolite of the high-energy product creatine, with its levels proportional to muscle mass. The concentrations of Ucr can be affected by age, gender, race, muscle mass, and health status [9]. This results in a wide variation in Ucr concentrations across individuals. It may therefore be inappropriate to use the exclusionary criteria for all populations. A study from the Third National Health and Nutrition Examination Survey (NHANES III) in the United States showed that the guideline was inapplicable for women and children, and suggested that the guidelines for sample exclusion should be re-evaluated and that the lower limit of acceptable Ucr concentration should be established [9].
Correction for dilution variations in spot urine sample is necessary, with Ucr the most commonly used—whereby the concentration of the urinary chemical is divided by the Ucr concentration and the resulting value expressed as weight of the chemical per g of Ucr (μg/g·creatinine) [10, 11]. The assumption required in this correction method is that the Ucr excretion rate remains stable across and within individuals, or shows a linear relationship with the chemical excretion rate, such that the ratio of chemical concentrations to Ucr concentration can be compared between different individuals or within an individual at different times [12, 13]. Urinary chemical levels expressed as a ratio of Ucr concentration are likely to be overestimated or underestimated [14, 15]. For example, in population with the same chemical excretion rate, creatinine-corrected chemical concentrations may be higher in individuals with low muscle mass compared with those with a high muscle mass. In addition, including chemical-to-creatinine ratios in multiple regression analysis probably lead to misleading results for that significant associations observed between chemical-to-creatinine ratios and other variables may be explained partially by the relationship between the variables and Ucr [9, 16, 17]. Increasingly, researchers are considering more effective creatinine correction methods [9, 10, 18, 19]. This includes using Ucr as a separate independent covariate in regression models[9], which has been widely used [6-8]. However, this approach probably has limitations in certain situations [17-19]. For example, according to the directed acyclic graph theory [20], Ucr is likely to act as a "collider" in the causal pathway. If this is the case, collider stratification bias is probably introduced by controlling for Ucr in the regression model [18].
The optimal approach to adjust for hydration status of chemical concentrations in spot urine samples has been a significant challenge [21]. To avoid introducing significant bias of varying magnitude and direction into epidemiologic associations, a comprehensive understanding of the factors directly and chronically affecting Ucr concentrations is necessary. Previous studies have investigated numerous conventional predictors of creatinine, including age, race, gender, body mass index (BMI), fat-free mass (FFM), diet, physical activity, disease state, collection period, and season [9, 13, 22-25]. However, multivariable analyses of Ucr in large general populations are limited and the associations between Ucr and some of the main environmental chemical related health outcomes, such as hypertension, diabetes and hyperthyroidism have not been fully evaluated. In addition, the applicability of the guidelines to the general Chinese population need to be studied. Ucr concentrations and variations in demographic groups may provide reference cut-off values for Ucr that determine the validity of urine samples. The present study used a dataset from the initial wave of the China National Human Biomonitoring (CNHBM) Program to depict Ucr concentrations in a general population sample with a broad range of demographic characteristics in China and to study whether the WHO's exclusionary guidelines (0.3–3.0 g/L) are applicable to the general Chinese population. We also examined the associations between Ucr concentrations and a variety of variables that are potential predictors of creatinine, including demographics, dietary intake, behavior patterns, and health status. This analysis will provide references and recommendations for correction of urine dilution using Ucr.
-
The study population was from the initial wave of CNHBM (2017–2018) [26, 27]. The CNHBM uses a multi-stage stratified sampling method to select a nationally representative sample of the general Chinese population between the ages of 3 and 79 years. Totally 152 districts/counties were selected nationwide as monitoring sites, and 3 villages/communities (units) were selected from each site using the probability-proportional-to-size sampling method to represent the approximate urban/rural participant ratio of the site. In each unit, 48 participants were selected according to the age and gender categories (3–5, 6–11, 12–18, 19–39, 40–59, and 60–79 years; male and female). Finally, a total of 21,888 participants (i.e., 152 sites × 3 units × 2 genders × 6 age groups × 4 persons) were selected. The data collected from each participant included detailed questionnaire information on demographic characteristics, behavior patterns, diet, and health, and a thorough physical examination was also conducted. Random spot urine and fasting blood samples were also collected. The study was approved by the Ethical Review Committee of National Institute of Environmental Health (NIEH), Chinese Center for Disease Control and Prevention (CDC) (No. 201701). All participants and/or their relatives provided written informed consent.
A total of 21,746 participants completed the questionnaire and biospecimen collection in the CNHBM (2017–2018). In the present cross-sectional study, we excluded participants without Ucr data (n = 59) or those missing relevant explanatory variables (n = 520), resulting in a final analytic sample of 21,167 participants. The participants in this study had similar characteristics with those who were excluded because of missing data (see Supplementary Table S1 available in www.besjournal.com).
Characteristics Included (n = 21,167) Excluded (n = 579) P n % (SE) n % (SE) Age (years) 3–5 3,516 10.29 (0.28) 102 11.1 (2.55) 0.304 6–11 3,535 12.46 (0.19) 81 9.09 (2.59) 12–18 3,540 12.05 (0.23) 69 8.46 (1.59) 19–39 3,507 22.01 (0.49) 124 27.56 (3.16) 40–59 3,535 25.26 (0.4) 102 25.38 (3.15) 60–79 3,534 17.93 (0.31) 101 18.40 (2.57) Gender Male 10,582 49.79 (1.79) 281 50.52 (5.52) 0.896 Female 10,585 50.21 (1.79) 298 49.48 (5.52) Residential area Urban 11,613 60.58 (2.77) 296 60.43 (9.07) 0.987 Rural 9,554 39.42 (2.77) 283 39.57 (9.07) BMI (kg/m2), means ± SD 21,167 22.21 ± 0.11 322 22.62 ± 0.57 0.476 Table S1. Comparison of characteristics between participants included and excluded from the analysis
-
Fasting blood (4–16 mL) and spot urine (50–80 mL) were collected from each participant. All the samples were processed locally within 4 hours after collection. Sample aliquots were held at 2–8 °C during processing and stored at –20 °C for no longer than 7 days. The Aliquot of urine samples for Ucr measurement were transported at 2–8 °C within 2 hours of collection to the local county-level CDC. Other aliquots of urine, serum, whole blood and blood clots were transported at –80 °C by a commercial courier to the Biobank of NIEH, China CDC and stored in ultra-low temperature refrigerators at –80 °C for future measurement. The Ucr measurements were performed immediately at the chemistry laboratories of the local county-level CDC using the Spectrophotometric method [28]. Ucr was reported in g/L. The limit of quantitation (LOQ) was 0.1 g/L with 0.87% of study participants having Ucr concentrations below the LOQ. For participants with Ucr concentrations below the LOQ, a level equal to the LOQ divided by the square root of 2 was imputed.
The Ucr assay had very stable quality-control measures throughout the study. The correlation coefficient of the standard curve was required to be > 0.998. Two blank samples containing no analyte were tested within each batch with the absorbance values of these two samples needing to be < 0.002. More than 10% of parallel samples were tested within each batch and the relative error of testing results for these parallel samples were required to be < 10%. The samples were diluted and re-measured if the testing results were out of the linear range. The limit of detection (LOD) and LOQ were estimated by measuring 20 replicates of a blank sample and calculating the mean and standard deviation (SD). LOD was calculated as the mean +3 SD and LOQ was calculated as the mean +10 SD.
-
The explanatory variables included age, gender, residential area, red meat intake, smoking status, alcohol consumption, BMI, hypertension, diabetes, dyslipidemia, hyperthyroidism, alanine aminotransferase (ALT) elevation, and chronic kidney disease (CKD). The residential area was categorized as urban or rural according to the type of unit. Villages were classified as rural and communities were classified as urban. Data on dietary intake during the past year, self-reported smoking status, and self-reported alcohol consumption were obtained by the questionnaire. The frequency of red meat intake over the past year was calculated as the average number of times each week. Smoking status was categorized as current or non-current, with the latter category including both former smokers and those who had never smoked. Self-reported frequency of alcohol consumption in the past year was categorized as never, less than four times per month, or four or more times per month.
Blood pressure was measured in those aged over 12 years. Systolic blood pressure (SBP) and diastolic blood pressure (DBP) were measured three times in each participant, and the mean value of the three measurements were calculated. The blood biochemical analysis were determined by Dian Diagnostics (Dian Diagnostics Group Co., Ltd., Hangzhou, Zhejiang, China). Fasting blood glucose, serum lipids, serum thyroxine (T4), serum triiodothyronine (T3), and serum ALT concentrations were measured in participants aged over 18 years. BMI was calculated as weight divided by height squared (kg/m2). Cases with extreme values of BMI (< 5 kg/m2 or > 50 kg/m2) were excluded from the analysis. The cut-off points for BMI for overweight and obesity between 3 and 79 years are summarized in Supplementary Table S2 (available in www.besjournal.com). The definition for overweight and obesity for participants aged 3 to 5 years used cut off values recommended by the International Obesity Task Force [29], while for participants aged 6 years and older the screening guidelines issued by National Health Commission of People's Republic of China were used [30]. To evaluate kidney function, glomerular filtration rate (GFR) was calculated using the CKD epidemiology collaboration equation, which incorporates age, gender, and serum creatinine concentration [31]. The definitions for the health status of individuals are summarized in Supplementary Table S3 (available in www.besjournal.com).
Age (years) Males Females Overweight Obesity Overweight Obesity 3– 17.9 19.6 17.6 19.4 3.5– 17.7 19.4 17.4 19.2 4– 17.6 19.3 17.3 192 4.5– 17.5 19.3 17.2 19.1 5– 17.4 19.3 17.2 19.2 5.5– 17.5 19.5 17.2 19.3 6.0– 16.4 17.7 16.2 17.5 6.5– 16.7 18.1 16.5 18.0 7.0– 17.0 18.7 16.8 18.5 7.5– 17.4 19.2 17.2 19.0 8.0– 17.8 19.7 17.6 19.4 8.5– 18.1 20.3 18.1 19.9 9.0– 18.5 20.8 18.5 20.4 9.5– 18.9 21.4 19.0 21.0 10.0– 19.2 21.9 19.5 21.5 10.5– 19.6 22.5 20.0 22.1 11.0– 19.9 23.0 20.5 22.7 11.5– 20.3 23.6 21.1 23.3 12.0– 20.7 24.1 21.5 23.9 12.5– 21.0 24.7 21.9 24.5 13.0– 21.4 25.2 22.2 25.0 13.5– 21.9 25.7 22.6 25.6 14.0– 22.3 26.1 22.8 25.9 14.5– 22.6 26.4 23.0 26.3 15.0– 22.9 26.6 23.2 26.6 15.5– 23.1 26.9 23.4 26.9 16.0– 23.3 27.1 23.6 27.1 16.5– 23.5 27.4 23.7 27.4 17.0– 23.7 27.6 23.8 27.6 17.5– 23.8 27.8 23.9 27.8 18.0– 24.0 28.0 24.0 28.0 Table S2. Cut off points for BMI for overweight and obesity by gender between 3 and 79 years (kg/m2)
Health status Definitions Hypertension Systolic blood pressures > 140 mmHg and/or diastolic blood pressures > 90 mmHg; or self-reported diagnosis by a physician; or self-reported use of antihypertensive medication in the 24 h before the survey[1]. Diabetes Blood glucose ≥ 7.0 mmol/L; or self-reported diagnosis by a physician; or self-reported use of insulin or oral hypoglycemic agents in the 24 h before the survey[2]. Dyslipidemia Triglyceride ≥ 2.26 mmol/L, or cholesterol ≥ 6.22 mmol/L, or low-density lipoprotein ≥ 4.14 mmol/L, or high-density lipoprotein ≤ 1.04 mmol/L; or self-reported diagnosis by a physician; or self-reported use of anti-dyslipidemia medications in the 24 h before the survey. Hyperthyroidisma T4 > 161.25 nmol/L or T3 > 2.79 nmol/L; or self-reported diagnosis by a physician. ALT elevationa Male: ALT > 41 U/L; Female: ALT > 33 U/L. Chronic kidney disease Glomerular filtration rate < 60 mL·min−1·1.73 m−2; or self-reported diagnosis by a physician. Note. aCut-off levels for T4, T3 and ALT were according to laboratory-verified reference ranges. [1] Writing Group of 2018 Chinese Guidelines for the Management of Hypertension. Chin J Cardiovasc Med, 2018; 24, 24-56. [2] Chinese Diabetes Society. Guidelines for the prevention and control of type 2 diabetes in China (2017 Edition). Chin J Diabetes Mellitus, 2018; 10, 4-67. Table S3. Definitions of the health status of participants in CNHBM (2017–2018)
-
The CNHBM used a complex sampling methodology that made it possible to derive national estimates from the data of the survey participants. We used strata, primary sampling units, and sampling weights to obtain point estimates and standard errors. The standard errors were estimated using the Taylor series linearization method. All statistical analyses were performed using SAS, version 9.4 (SAS Institute Inc., Cary, NC, USA). Statistical significance was set at P < 0.05 (two-sided) for all analyses.
The Ucr data showed a positively skewed distribution and was natural log (ln) transformed in the analysis. The geometric mean (GM), selected percentiles and coefficient of variation (CV) of Ucr concentrations were calculated. The percentage of individuals with a Ucr concentration outside the WHO's recommended creatinine limit of 0.3–3.0 g/L was calculated, grouped by gender and age category. Age- and gender-adjusted GM of Ucr concentrations grouped by demographics, dietary intake, behavior patterns, and health status were calculated and compared using linear mixed-effects models. To evaluate the associations of explanatory variables with Ucr, uni- and multivariable regression analysis were performed with ln transformed Ucr as the dependent variable. Geometric mean ratios (GMR) of Ucr concentrations were estimated using mixed linear models. A two-level mixed linear model using the restricted maximum likelihood method was fitted, in which individuals were included as a fixed effect for level 1, and sites were included as a random effect for level 2. Because information on behavior patterns and health status were not available for all participants, the associations between these variables and Ucr were analyzed only for participants aged 19 to 79 years. We next explored the functional form of BMI, blood pressure, GFR and serum biochemical indexes with Ucr concentrations using generalized linear models to fit restricted cubic spline functions. The extreme 1% of these variables were excluded to avoid implausible extrapolations of the functional form caused by the extremes of the data distribution.
-
A total of 21,746 participants were included in the study, of which 10,591 were aged 3 to 18 years and 10,576 aged 19 to 79 years. The characteristics of the participants were presented in Table 1, including age, gender, residential area and red meat intake for participants aged 3 to 79 years, and behavior patterns and health status for participants aged 19 to 79 years. In the 21,167 study participants, the weighted mean age (sx) was 34.45 (0.26) years, and 49.79% were male. Of the 10,576 participants aged 19 to 79 years, 38.38% were diagnosed with hypertension, and the prevalence of CKD was 4.56%.
Variables No. % (sx) Age (years) 3–5 3,516 10.29 (0.28) 6–11 3,535 12.46 (0.19) 12–18 3,540 12.05 (0.23) 19–39 3,507 22.00 (0.49) 40–59 3,535 25.26 (0.40) 60–79 3,534 17.94 (0.31) Gender Female 10,585 50.21 (1.79) Male 10,582 49.79 (1.79) Residential area Rural 9,554 39.42 (2.77) Urban 11,613 60.58 (2.77) Smoking statusa Non-current 7,477 66.15 (1.19) Current 3,099 33.85 (1.19) Alcohol consumption in the past yeara Never 5,993 48.91 (1.76) < 4 drinks per week 3,577 39.44 (1.54) ≥ 4 drinks per week 1,006 11.65 (0.66) Red meat intake (times per week) ≤ 1 3,778 17.67 (0.87) > 1 to 7 11,874 57.46 (0.96) > 7 5,515 24.87 (0.98) BMI (kg/m2) Normal and underweight 13,743 58.04 (1.06) Overweight 4,822 27.88 (0.73) Obesity 1,632 14.08 (0.56) Hypertensiona No 6,591 61.62 (1.35) Yes 3,985 38.38 (1.35) Diabetesa No 9,473 89.19 (0.60) Yes 1,103 10.81 (0.60) Dyslipidemiaa No 6,453 58.62 (1.12) Yes 4,123 41.38 (1.12) Hyperthyroidisma No 10,379 98.07 (0.31) Yes 197 1.93 (0.31) ALT elevationa No 10,053 94.51 (0.45) Yes 523 5.49 (0.45) CKDa No 9,991 95.44 (0.52) Yes 585 4.56 (0.52) Note. All data were weighted to account for the complex sampling design; ALT, alanine aminotransferase; BMI, body mass index; CKD, chronic kidney disease; No., number of the participants; sx, standard error. aAnalyses limited to participants aged 19 to 79 years. Table 1. Characteristics of the study population
-
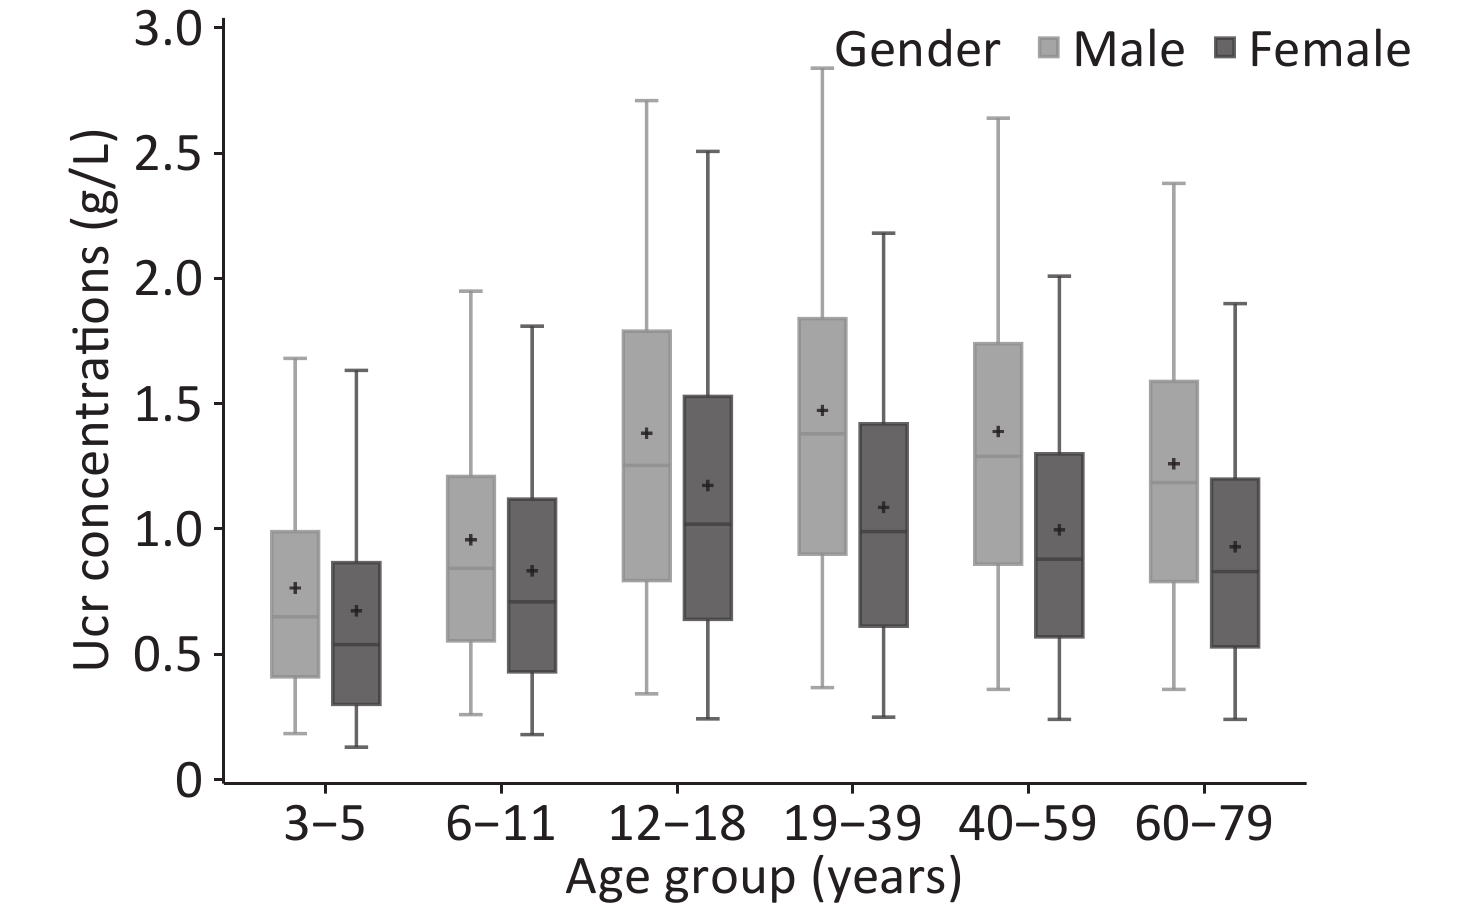
The weighted Ucr concentrations of the total participants by age and gender are shown in Table 2, and Figure 1 showed the unweighted results. The GM of Ucr concentration was 0.90 g/L and the median was 1.01 g/L. The central 90% interval (5th-95th percentile) was 0.24–2.30 g/L. Median urinary creatinine was significantly higher in males [1.23 (IQR: 0.77, 1.69) g/L] compared with that in female [0.82 (IQR: 0.49, 1.26) g/L]. Children and elderly participants were more likely to have lower Ucr concentrations than adults. The coefficient of variation of Ucr concentrations of all the participants was 73.76%, that ranged in each age group by gender from 63.69% to 96.49%.
Groups No. GM (95% CI) M (IQR) 5th (95% CI) 95th (95% CI) CV (%) Overall All 21,167 0.90 (0.86, 0.95) 1.01 (0.59, 1.49) 0.24 (0.21, 0.27) 2.30 (2.15, 2.46) 73.76 3–5 3,516 0.52 (0.48, 0.55) 0.55 (0.32, 0.88) 0.13 (0.10, 0.16) 1.63 (1.45, 1.82) 93.10 6–11 3,535 0.70 (0.66, 0.74) 0.75 (0.47, 1.14) 0.19 (0.15, 0.23) 1.87 (1.70, 2.04) 72.51 12–18 3,540 1.00 (0.94, 1.06) 1.11 (0.68, 1.62) 0.27 (0.22, 0.31) 2.55 (2.36, 2.73) 71.37 19–39 3,507 1.08 (1.01, 1.15) 1.23 (0.77, 1.70) 0.29 (0.23, 0.34) 2.49 (2.27, 2.71) 70.75 40–59 3,535 1.03 (0.98, 1.09) 1.16 (0.72, 1.60) 0.31 (0.24, 0.37) 2.39 (2.21, 2.56) 68.19 60–79 3,534 0.92 (0.87, 0.98) 1.00 (0.63, 1.46) 0.28 (0.23, 0.33) 2.23 (2.04, 2.42) 66.20 Male All 10,582 1.09 (1.03, 1.16) 1.23 (0.77, 1.69) 0.33 (0.26, 0.39) 2.47 (2.29, 2.65) 74.68 3–5 1,757 0.59 (0.54, 0.64) 0.62 (0.42, 0.94) 0.18 (0.15, 0.21) 1.57 (1.34, 1.79) 96.49 6–11 1,768 0.79 (0.73, 0.85) 0.83 (0.57, 1.19) 0.25 (0.17, 0.33) 1.88 (1.52, 2.24) 72.16 12–18 1,771 1.15 (1.07, 1.23) 1.28 (0.80, 1.77) 0.34 (0.25, 0.43) 2.61 (2.30, 2.93) 72.51 19–39 1,757 1.22 (1.13, 1.31) 1.38 (0.87, 1.80) 0.35 (0.25, 0.44) 2.60 (2.29, 2.91) 66.81 40–59 1,763 1.16 (1.09, 1.24) 1.29 (0.86, 1.71) 0.37 (0.28, 0.46) 2.51 (2.32, 2.70) 68.06 60–79 1,766 1.08 (1.00, 1.15) 1.21 (0.79, 1.63) 0.35 (0.28, 0.42) 2.37 (2.20, 2.53) 64.14 Female All 10,585 0.75 (0.71, 0.79) 0.82 (0.49, 1.26) 0.20 (0.17, 0.22) 2.03 (1.88, 2.18) 69.18 3–5 1,759 0.50 (0.47, 0.54) 0.54 (0.30, 0.86) 0.13 (0.10, 0.15) 1.63 (1.45, 1.82) 79.35 6–11 1,767 0.66 (0.62, 0.70) 0.70 (0.43, 1.12) 0.17 (0.14, 0.20) 1.81 (1.67, 1.95) 71.96 12–18 1,769 0.94 (0.88, 0.99) 1.02 (0.64, 1.53) 0.24 (0.19, 0.29) 2.51 (2.29, 2.73) 67.68 19–39 1,750 0.88 (0.83, 0.94) 0.99 (0.61, 1.42) 0.25 (0.21, 0.29) 2.18 (1.97, 2.39) 69.63 40–59 1,772 0.82 (0.77, 0.87) 0.88 (0.57, 1.30) 0.24 (0.21, 0.27) 2.00 (1.77, 2.23) 65.78 60–79 1,768 0.77 (0.73, 0.82) 0.83 (0.53, 1.20) 0.24 (0.21, 0.27) 1.90 (1.73, 2.07) 63.69 Note. All data were weighted to account for the complex sampling design; CI, confidence interval; CV, coefficient of variation; GM, geometric mean; IQR, interquartile range; M, median. Table 2. Ucr concentrations (g/L) in each demographic group in the population of CNHBM 2017–2018
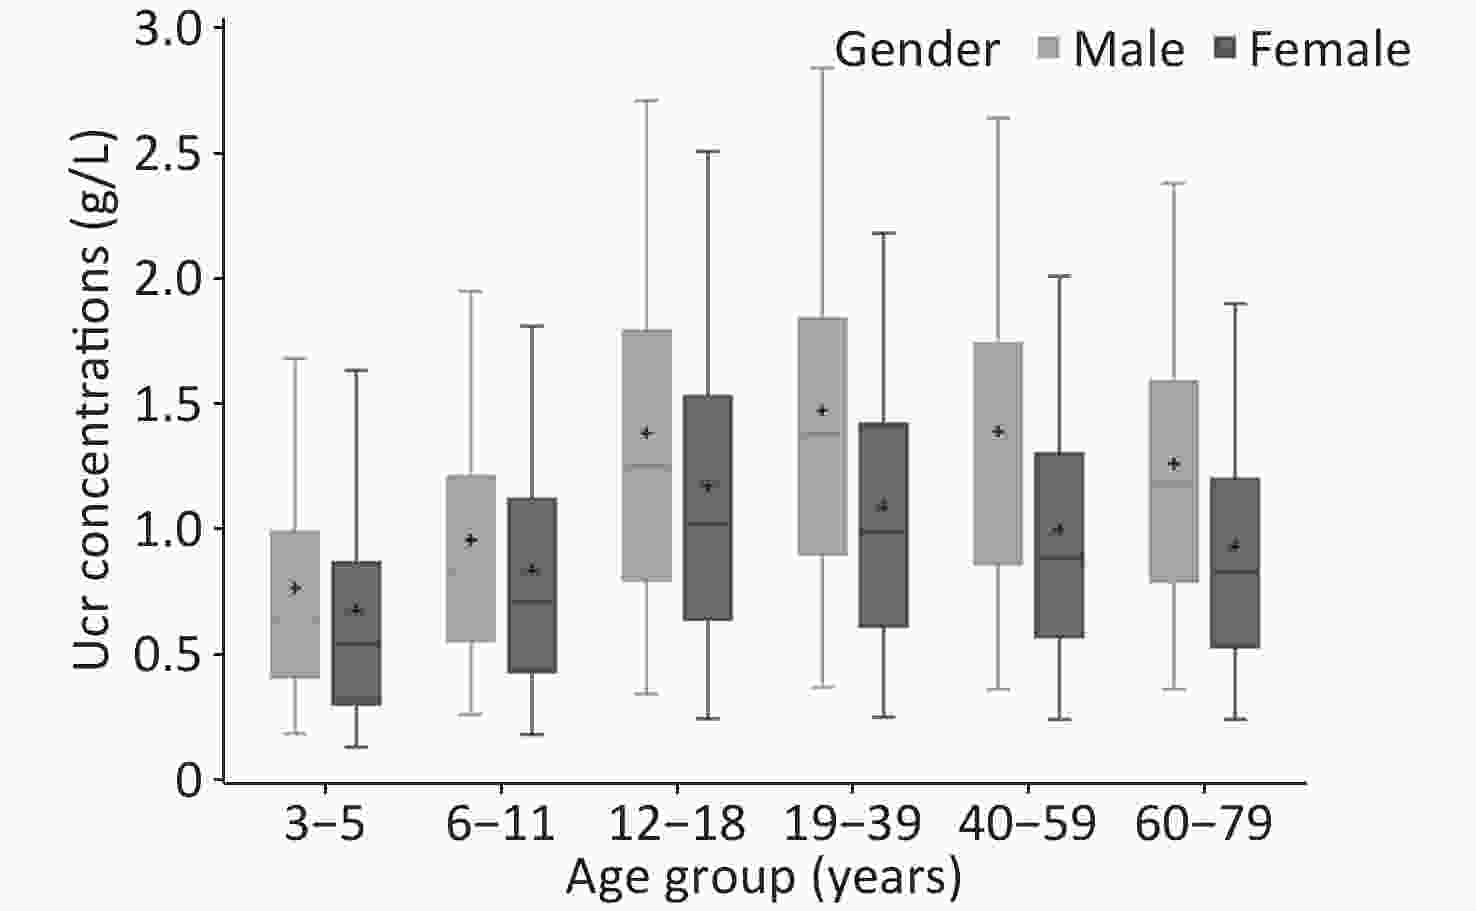
Figure 1. Urinary creatinine concentrations (g/L) for each gender by age group.
-
Among all the participants with a random spot urine sample collection, 9.36% were outside the creatinine limits (0.3–3.0 g/L), including 7.83% whose samples were too dilute (< 0.3 g/L) and 1.53% whose samples were too concentrated (> 3.0 g/L). In all age groups, extremely dilute urine was more prevalent than overly concentrated urine. More samples from female participants than from male participants were considered invalid. Invalid urinary samples were also more common in children than in adults. The percentage of urine samples outside the limit range was much higher in those aged 3–5 years (23%) than in the other age groups (Table 3).
Groups Overall Male Female < 0.3 g/L, % (sx) > 3.0 g/L, % (sx) < 0.3 g/L, % (sx) > 3.0 g/L, % (sx) < 0.3 g/L, % (sx) > 3.0 g/L, % (sx) All 7.83 (0.89) 1.53 (0.57) 4.53 (0.93) 2.00 (0.77) 11.11 (0.94) 1.06 (0.39) 3–5 22.56 (0.17) 0.53 (0.04) 15.00 (0.08) 0.33 (0.01) 24.38 (0.26) 0.57 (0.07) 6–11 11.30 (0.15) 0.54 (0.04) 7.00 (0.12) 0.59 (0.04) 13.39 (0.22) 0.51 (0.04) 12–18 6.06 (0.12) 2.53 (0.08) 4.51 (0.07) 2.88 (0.07) 6.74 (0.18) 2.38 (0.11) 19–39 5.25 (0.22) 2.32 (0.15) 4.03 (0.33) 2.94 (0.25) 7.26 (0.18) 1.31 (0.08) 40–59 4.83 (0.23) 1.59 (0.17) 3.44 (0.34) 1.93 (0.27) 7.62 (0.17) 0.90 (0.08) 60–79 5.55 (0.16) 1.05 (0.12) 3.91 (0.19) 1.37 (0.17) 7.41 (0.16) 0.68 (0.07) Note. All data were weighted to account for the complex sampling design; sx, standard error. Table 3. Percentage of samples with Ucr concentrations outside the WHO guideline range (0.3–3.0 g/L) in each demographic group, in population of CNHBM 2017–2018
-
In participants age 19 to 79 years, after adjusting for age and gender, Ucr concentrations varied significantly according to smoking status (P = 0.038), frequency of red meat intake (P = 0.027), BMI (P = 0.001), and kidney function (P = 0.002) (Table 4). Ucr concentrations were 0.03 g/L higher in current smokers than those who had never smoked or were former smokers. Participants with more than 7 times per week of red meat intake had 0.05 g/L higher Ucr concentration than individuals who ate red meat less than or equal to one times per week. Compared with participants classified as underweight and normal weight, individuals defined as overweight and obesity had 0.03 g/L and 0.06 g/L higher Ucr concentration, respectively. Participants with CKD had 0.08 g/L higher Ucr concentration than those without CKD. In the multivariable-adjusted models restricted to participants aged 19 years and older, age group, gender, smoking status, red meat intake, BMI, and CKD were found to be associated significantly with Ucr concentrations (Table 4).
Characteristics No. (%) GMa F P GMRb P Age (years) 54.01 < 0.001 19–39 3,507 (33.16) 1.04 (0.99, 1.10) 1.00 40–59 3,535 (33.42) 0.97 (0.92, 1.02) 0.93 (0.91, 0.96) < 0.001 60–79 3,534 (33.42) 0.90 (0.86, 0.95) 0.87 (0.85, 0.89) < 0.001 Gender 947.53 < 0.001 Female 5,290 (50.02) 0.82 (0.78, 0.86) 1.00 Male 5,286 (49.98) 1.15 (1.09, 1.21) 1.38 (1.34, 1.42) < 0.001 Residential area 0.37 0.543 Rural 4,746 (44.88) 0.97 (0.92, 1.02) 1.00 Urban 5,830 (55.12) 0.97 (0.92, 1.03) 0.99 (0.96, 1.02) 0.629 Smoking status 4.33 0.038 Non-current 7,477 (70.70) 0.96 (0.91, 1.01) 1.00 Current 3,099 (29.30) 0.99 (0.94, 1.05) 1.04 (1.01, 1.07) 0.017 Alcohol consumption in the past year 0.49 0.611 Never 5,993 (56.67) 0.97 (0.92, 1.02) 1.00 < 4 drinks per week 3,577 (33.82) 0.97 (0.92, 1.03) 1.00 (0.97, 1.03) 0.982 ≥ 4 drinks per week 1,006 (9.51) 0.95 (0.90, 1.02) 0.98 (0.94, 1.02) 0.313 Red meat intake (times per week) 3.62 0.027 ≤ 1 2,082 (19.69) 0.94 (0.89, 1.00) 1.00 1 to 7 5,922 (55.99) 0.97 (0.92, 1.02) 1.03 (1.00, 1.06) 0.052 > 7 2,572 (24.32) 0.99 (0.94, 1.05) 1.06 (1.01, 1.09) 0.010 BMI (kg/m2) 6.81 0.001 Normal and underweight 5,275 (49.88) 0.95 (0.90, 1.00) 1.00 Overweight 3,669 (34.69) 0.98 (0.93, 1.03) 1.03 (1.00, 1.06) 0.023 Obesity 1,632 (15.43) 1.01 (0.95, 1.07) 1.06 (1.03, 1.10) < 0.001 Hypertension 1.03 0.31 No 6,591 (62.32) 0.98 (0.93, 1.03) 1.00 Yes 3,985 (37.68) 0.96 (0.91, 1.01) 0.98 (0.95, 1.00) 0.088 Diabetes 0.01 0.924 No 9,473 (89.57) 0.97 (0.92, 1.02) 1.00 Yes 1,103 (10.43) 0.97 (0.91, 1.03) 0.99 (0.96, 1.03) 0.706 Dyslipidemia 0.08 0.784 No 6,453 (61.02) 0.97 (0.92, 1.02) 1.00 Yes 4,123 (38.98) 0.97 (0.92, 1.02) 0.98 (0.96, 1.01) 0.182 Hyperthyroidism 0.01 0.933 No 10,379 (98.14) 0.97 (0.92, 1.02) 1.00 Yes 197 (1.86) 0.97 (0.88, 1.06) 0.99 (0.91, 1.08) 0.884 ALT elevation 2.72 0.099 No 10,053 (95.05) 0.97 (0.92, 1.02) 1.00 Yes 523 (4.95) 1.01 (0.94, 1.08) 1.03 (0.98, 1.08) 0.252 CKD 9.59 0.002 No 9,991 (94.47) 0.97 (0.92, 1.02) 1.00 Yes 585 (5.53) 1.05 (0.98, 1.12) 1.08 (1.03, 1.14) 0.002 Note. ALT, alanine aminotransferase; BMI, body mass index; CI, confidence interval; CKD, chronic kidney disease; GM, geometric mean; GMR, Geometric mean ratio; No., number of the participants. aModels are adjusted for age group and gender. bModels are shown as geometric mean ratio, adjusted for age group, gender, residential area, smoking status, alcohol consumption in the past year, red meat intake, and BMI. Table 4. Age and gender adjusted geometric mean (95% CI) and fully adjusted geometric mean ratio (95% CI) of Ucr concentrations (g/L) by explanatory variables in CNHBM participants aged 19 to 79 years
A final multivariable mixed linear model that included age group, gender, residential area, red meat intake, and BMI was performed in participants aged 3 to 79 years (Table 5). In the final model, participants with CKD were excluded. As shown in Table 5, age group, gender, and BMI were significantly associated with Ucr in a model that included all ages. Compared with participants aged 3 to 5 years, Ucr concentrations were 29% higher (95% CI: 26%, 33%) in individuals aged 6 to 11 years, 85% higher (95% CI: 79%, 90%) in individuals aged 12 to 18 years, 85% higher (95% CI: 80%, 91%) in individuals aged 19 to 39 years, 72% higher (95% CI: 67%, 77%) in individuals aged 40 to 59 years, and 60% higher (95% CI: 55%, 65%) in individuals aged 60 to 79 years. Males had 30% higher (95% CI: 28%, 38%) Ucr concentration than females. Ucr concentrations were 3% higher (95% CI: 1%, 5%) and 6% higher (95% CI: 4%, 9%) in individuals defined as overweight or obesity than in participants classified as underweight and normal weight, respectively.
Characteristics GMRa P Age (years) 3–5 1.00 6–11 1.29 (1.26, 1.33) < 0.001 12–18 1.85 (1.79, 1.90) < 0.001 19–39 1.85 (1.80, 1.91) < 0.001 40–59 1.72 (1.67, 1.77) < 0.001 60–79 1.60 (1.55, 1.65) < 0.001 Gender (male vs. female) 1.30 (1.28, 1.33) < 0.001 Residential area (rural vs. urban) 0.99 (0.96, 1.01) 0.297 Red meat intake (times per week) ≤ 1 1.00 1 to 7 1.00 (0.98, 1.03) 0.732 > 7 1.02 (0.99, 1.05) 0.150 BMI (kg/m2) Normal and underweight 1.00 Overweight 1.03 (1.01, 1.05) 0.008 Obesity 1.06 (1.04, 1.09) < 0.001 Note. BMI, body mass index; CI, confidence interval; GMR, Geometric mean ratio. aModels are shown as geometric mean ratio, adjusted for age group, gender, residential area, red meat intake and BMI. Participants aged 19 years and older and diagnosed with chronic kidney disease were not included in the analysis. Table 5. Geometric mean ratio (95% CI) of Ucr concentrations (g/L) by explanatory variables from multiple mixed linear models for CNHBM participants aged 3 to 79 years
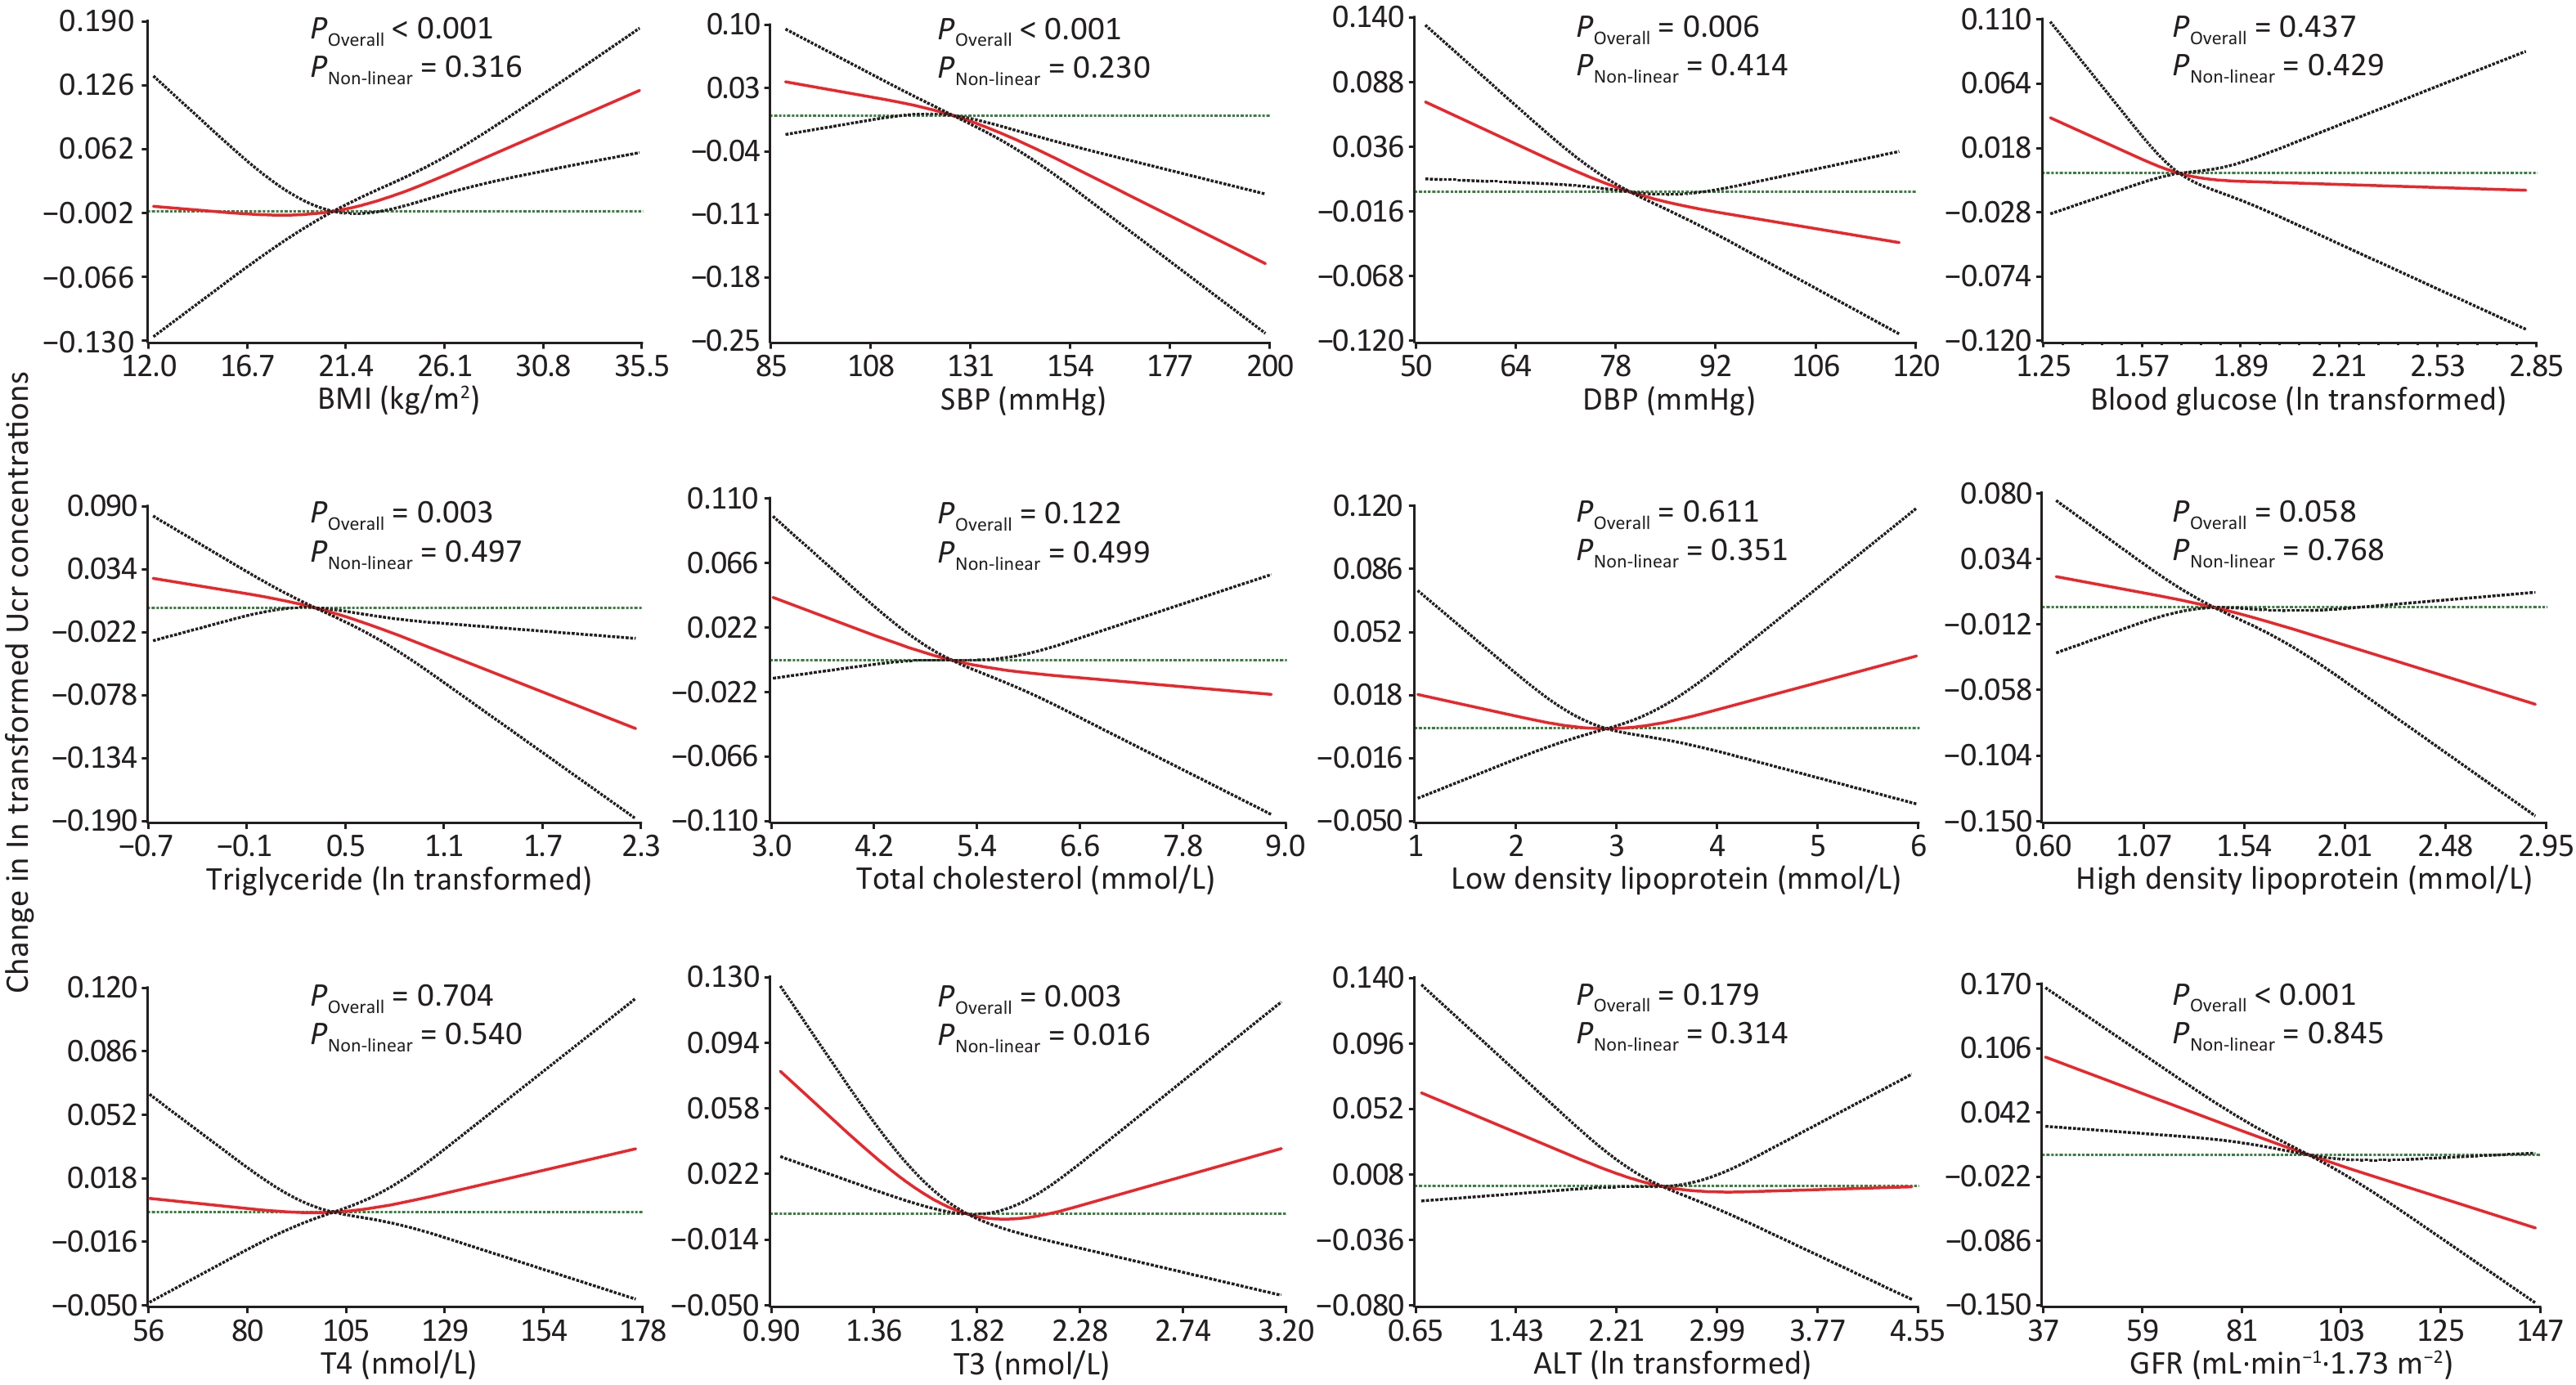
Restricted cubic splines showed significant positive and linear associations between BMI and Ucr concentrations in participants aged 3 to 79 years after adjustment for demographics, diet and behavioral patterns. In models based on restricted cubic splines, after further adjusting for BMI, a significant inversely and linear association were observed between Ucr and SBP (P < 0.001), DBP (P = 0.006), triglyceride (P = 0.003), and GFR (P < 0.001) in participants aged 19 to 79 years. The association between T3 and Ucr was significant but non-linear, with a P value for the overall association of 0.003 and for the non-linear association a P value of 0.016 (Figure 2).
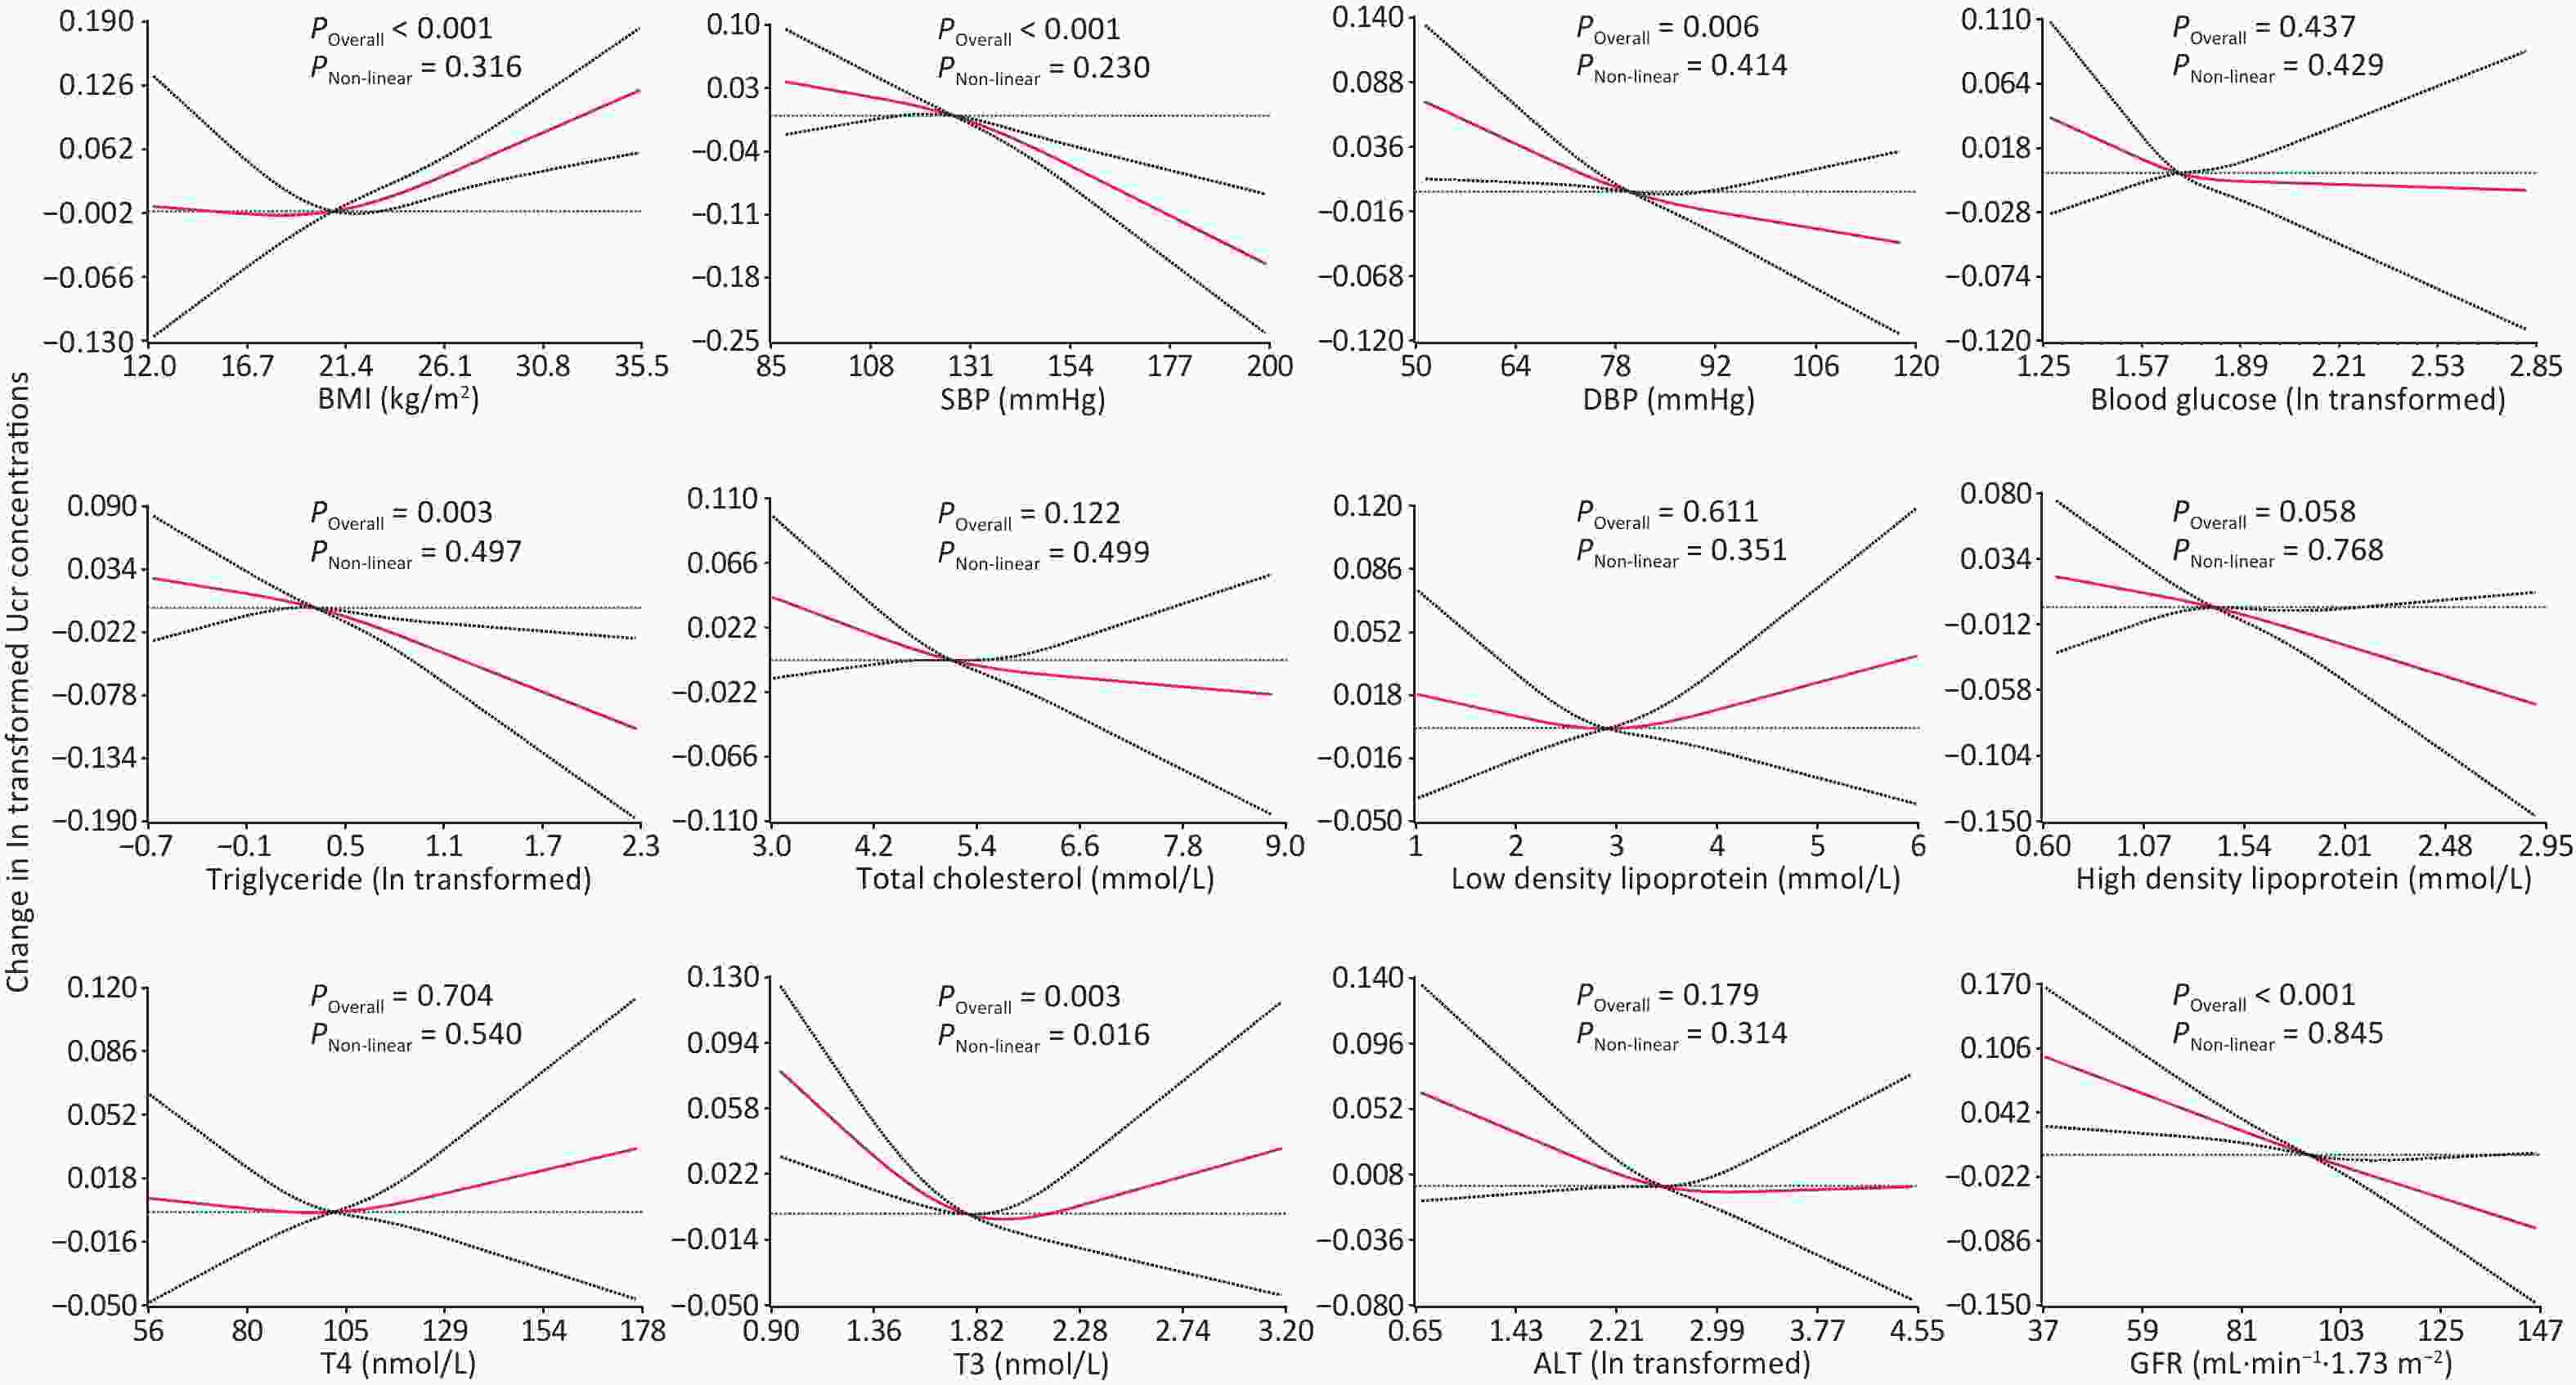
Figure 2. Change in Ucr concentrations according to explanatory variables based on restricted cubic splines.
-
To our knowledge, the present study is the first to analyze Ucr concentrations and its related factors in the general Chinese population with a large age range. The study showed that Ucr concentrations grouped by age and gender varied greatly. According to the WHO's exclusionary guidelines (0.3–3.0 g/L), more urine samples were considered excessively dilute than were considered excessively concentrated. In line with previous studies, association analysis showed that age, gender, red meat intake, BMI, and CKD were associated significantly with Ucr. Interestingly, quite a few significant associations that were rarely reported in previous studies were observed in the present study. Ucr concentrations were found to be higher in current smokers. Furthermore, we observed significant negative linear associations between Ucr and SBP, DBP, and triglyceride, and a significant non-linear association between Ucr and T3.
The median concentration of Ucr in the CNHBM was similar to that in the Fifth Human Biomonitoring of Environmental Chemicals in Canada, although the GM concentration was lower than that of Canadians [32]. The median Ucr concentrations in the CNHBM was also lower than that in NHANES III [9]. In addition, Ucr concentrations grouped by age and gender varied greatly in the above countries. Creatinine is produced by creatine and creatinine phosphate as a result of muscle metabolic processes, with its level proportional to muscle mass. An increase in the consumption of proteins rich in the creatine precursors, arginine and glycine, and an increased dietary intake of meat, especially red meat, increases the urinary excretion of exogenous creatinine [25, 33]. Therefore, Ucr concentrations are very different depending on age, gender, BMI, and diet. Accordingly, the difference in total body lean mass of the general population and dietary patterns across countries probably leads to marked variations in Ucr concentrations. These data suggest that Ucr concentrations and demographic characteristics should be considered when comparing urinary chemical concentrations corrected for Ucr using a conventional method across countries or regions.
The Ucr limits (0.3–3.0 g/L) recommended by the WHO [3] may be not applicable in the general Chinese population because large numbers of samples with a low creatinine concentration would be excluded according to this limits, especially in children and women. Similarly, data from NHANES III showed the limit range corresponded approximately to the central 90% interval (5th–95th percentile) only in non-Hispanic white males aged 20 to 60 years old. In general, repeated sampling of individuals with ineligible urine samples is unfeasible. Abandonment of samples outside the range may result in an overestimation of urine chemical concentrations in the total population. The WHO's exclusionary criteria for occupational health monitoring purposes may be recommended with considering that occupational monitoring is usually carried out in working populations comprising primarily healthy men of working age. Nevertheless, the criteria for the general population need improvement. Ucr concentrations vary greatly according to demographics and therefore the cut-off values should be given by age and gender. The 5th and 95th percentiles of Ucr concentration in each age group by gender in the present study may be optimal alternative limits for determining the validity of urinary samples in the general Chinese population.
The present study showed quite a few significant associations that have been reported rarely in previous studies. A significant elevation of Ucr concentration in current smokers was observed. This could be explained by glomerular hyperfiltration. This possibility is supported by the findings that serum creatinine concentration is lower in smokers and that smoking is associated with a higher GFR [34, 35]. Additionally, SBP and DBP were found to be associated inversely with Ucr concentration. This result provides potential support that low Ucr levels probably are a predictor of cardiovascular disease [36, 37]. Moreover, significant negative linear associations between serum triglyceride concentrations and Ucr were observed in the present study, suggesting that creatinine levels are probably related to lipid metabolism. In contrast, the present analyses did not find an association between diabetes and Ucr, which has been reported in previous studies [9, 24]. This inconsistency is probably due to racial differences and the distinction of adjustment variables that were included in the multiple analyses.
The significant associations observed in the study should be considered when using Ucr to correct for urinary dilution. Our study indicated that Ucr is associated with various health outcomes. In epidemiological studies, bias is probably introduced by including chemical-to-creatinine ratios in regression models. For example, the statistical association between chemical-to-creatinine ratios and obesity may be distorted due to the positive association between Ucr and obesity. On the other hand, researchers should avoid adjusting Ucr as a covariate in some scenarios. Ucr probably acts as a “collider” in a causal pathway of urinary chemicals and certain health outcomes, such as obesity-related diseases, hypertension, lipid metabolism diseases, and kidney diseases. In this scenario, collider stratification bias is probably introduced if Ucr is included in the regression model. Furthermore, in studies determining whether a factor is a significant predictor of a chemical, if this factor is a common cause of the urinary chemical and Ucr, adjusting for Ucr as a covariate may result in an over-controlling. This bias has been confirmed in studies of Ucr, arsenic metabolites, and folate. Both inorganic arsenic metabolism and creatine biosynthesis are related to folate-dependent transmethylation reactions [38, 39]. A previous study showed that the associations between arsenic metabolites and folate become non-significant after adjusting for Ucr as a covariate [40]. Because this study observed an association between smoking and Ucr, a similar probably of over-control may have occurred when studying the effects of smoking on urinary chemicals. For the above scenarios, a multistep approach known as the covariate-adjusted standardization method was developed [18]. In this approach, log-transformed Ucr is first regressed on known predictors to obtain predicted Ucr values. The observed Ucr values are then divided by the predicted values to calculate the creatinine ratio, which theoretically reflects only the variation in urinary dilution. Urinary chemical concentrations are then divided by the ratio to estimate the actual concentration levels of these chemicals. This novel method has been adopted in several epidemiologic studies [41-44], with the method applicable in the above scenarios. In summary, these significant associations observed in our study are meaningful to the application of Ucr correction. The choice of correction method should be based on the specific causal relationships. It is also necessary to evaluate the role of Ucr in a causal pathway before adjustment for dilution variation using Ucr.
This study has several strengths. Firstly, we used a nationally representative dataset to describe Ucr concentrations by age and gender. Secondly, the associations between Ucr and a variety of physiological indicators, such as blood pressure, lipids, and functional enzyme were studied extensively in the study. Moreover, the research implications of the study are important as they were conducive to creatinine limits and creatinine adjustment. Our study also has several limitations. First, the study was a cross-sectional design and therefore, we could not draw conclusions about causal relationships. It is unknown if health status, such as dyslipidemia and CKD, alter the excretion and metabolism of creatinine. This impedes the assessment of the role of Ucr in the causal pathway. Prospective studies are needed to confirm these associations. Second, the measurements of serum creatinine were measured at clinical chemistry laboratories of local accredited medical institutions. Inter-laboratory differences were not examined because of a lack of available information, which is likely to have introduced bias in the results. Third, some variables that are important for Ucr, such as FFM, drug use, physical activity, and nutrients involved in one-carbon metabolism, were not included in the study due to unavailability of data. Further studies are therefore needed to investigate other potential factors that may affect Ucr concentrations.
-
Ucr concentrations varied greatly by age and gender. This study indicates that the WHO's guidelines for evaluating the validity of urine samples for occupational medical health monitoring purposes need improvement for studies conducted in the general population. We recommended the 5th and 95th percentiles of Ucr concentration in each age group by gender calculated in our study as the cut-off values to determine the validity of urine samples in the general Chinese population. Ucr concentration was associated with various factors, including diet, smoking habits, BMI, blood pressure, lipid metabolism, endocrine disruption, and kidney function. These associations are conducive to evaluating the role of Ucr in a causal pathway. To avoid introducing significant bias into epidemiologic associations, the significant associations observed in the present study should be considered in regression models when using Ucr to adjust for dilution variations.
-
We gratefully acknowledge all the participants in the CNHBM (2017–2018). We also appreciate the extensive support from the 31 provincial CDCs across China and from the local county-level CDC sites.
-
SSJ: Conceptualization, data acquisition and analysis, writing - original draft and writing - review & editing. YBL, YLQ, and XJH: Investigation, conceptualization, writing - original draft. YFL, JFC, SXS, XZ, YCL, YWY, WLZ, YWL, HG, LL, JYC, TQ, and HF: Investigation and data acquisition. MYZ, CC, CCL and ZL: Interpretation of data. JSJ: Writing - review & editing. FZ, YZ, and ZJC: Investigation, data acquisition and writing - review & editing. XMS: Conceptualization, data analysis, writing - review & editing. All authors read and approved the final manuscript.
-
The authors declare that they have no known competing financial interests or personal relationships that could have appeared to influence the work reported in this paper.
HTML
Study Population
Ucr Measurements
Definition of the Explanatory Variables
Statistical Analysis
Characteristics of Study Population
Ucr Concentrations by Age and Gender
Ucr Concentrations outside the WHO Guidelines
Associations of the Explanatory Variables with Ucr Concentration
 22036Supplementary Materials.pdf
|

|

 Quick Links
 DownLoad: